China now has the wealth, commercial sophistication and technical expertise to make its
pursuit of technological leadership work. The fundamental issue for the U.S. and other
western nations, and the IT sector is how to respond ...
Office of the United States Trade Representative, March 28, 2018 report
1 Introduction
A growing body of research focuses on the impact of China’s meteoric rise as an economic
power and the impact of this rise on the innovation spending by established firms in the
United States. This growing body of research has been matched by a growing interest in
this same issue by policy makers, politicians and the popular press. Issues at stake include
job loss, the incentives to innovate, and intellectual property (IP) protection. Yet the existing
literature disagrees even on the most basic question: does an increase in foreign competition
have a positive or negative impact on the intensity of innovative investment in the U.S?
On the surface, increased competition is a negative shock and afflicted existing firms
should reduce investment in R&D if this competition is in the form of strategic substitutes,
as is true in many markets. Yet this prediction is not a given, even if firms compete through
strategic substitutes. For example, Aghion, Bloom, Blundell, Griffith, and Howitt (2005)
suggest that firms might increase R&D following increased competition, as this might facil-
itate “escaping competition” through increased product differentiation. Bloom, Draca, and
Van Reenen (2016) further predict that when firms have “trapped assets” that are difficult
to redeploy, or high adjustment costs, these incentives to increase innovative spending in-
crease further. In particular, these firms may maintain high ex ante production levels despite
lower prices if curtailing production is too costly. The increased innovative spending then
restores some pricing power through differentiation. It is thus an empirical question whether
increased competition leads to increases or decreases in innovation spending.
The existing empirical evidence examines import trade shocks and subsequent changes
in R&D but has not examined the first stage of competition in R&D itself. Examining R&D
1
following import trade shocks from China, Autor, Dorn, Hanson, Pisano, and Shu (forth-
coming) find a negative relation between imports from China and U.S. firm R&D spending.1
However, even this evidence is mixed as Bloom, Draca, and Van Reenen (2016) find that
import trade shocks lead to increased R&D spending in a sample of European firms. We
consider a new approach to this question that examines competition in innovation itself. We
introduce a novel shock to the ability of Chinese firms to compete in knowledge creation
through changes in the cost and ability of Chinese firms to access information over the inter-
net. We use the staggered internet rollout in China across provinces to identify changes in
the cost of accessing information for Chinese firms located in these provinces. We map these
information access changes to Chinese competing firms using differential industry agglom-
eration by province. We also examine the extent to which U.S. firms complain more about
Chinese competition and intellectual property theft after increases in internet penetration
in China.
We propose that global competition influences innovation through at least two competi-
tive margins, each having different implications for innovation spending in the U.S. The first
is examined by the existing studies: direct import competition in the market for existing
products. These existing studies use tariffs and import data and competition in existing
products. The second margin, which has not been studied in the U.S.-China innovation
literature, is direct competition in the market for innovation and intellectual property itself.
Importantly, shocks to tariffs and imports cannot be used as direct shocks to this margin, as
tariffs and imports relate to products that already exist, and thus their impact on intellectual
property competition would be indirect and observed with delay.
We study the competitive impact of Chinese innovation on U.S. innovation using direct
measures of Chinese firms’ ability to access information about U.S. innovation over the
internet. We propose that differential industry agglomeration and internet penetration at
1Hombert and Matray (2018) also examine U.S. firms following China imports, and find that firms thatare ex ante R&D intensive experience more positive outcomes due to their increased ability to use R&D toescape competition.
2
the province level in China can be used to generate variation in the capacity of Chinese
firms to access information cheaply and challenge U.S. firm innovation. First and foremost,
intellectual property is knowledge, and the internet has proven to be an efficient means for
accumulating knowledge, especially when the knowledge resides overseas and is available
online in electronic form. Indeed, a wealth of information on intellectual property, product
market strategies, and the performance of U.S. firms is available from firm websites, patent
filings, and required EDGAR filings. Thus, as regional Chinese firms gain greater access to
the internet, they have access to information at a much lower cost that allows them to more
effectively compete in innovation with rival U.S. firms.
Our main analysis examines how U.S. firms change their innovative investment in the
face of changes in intellectual property competition from China. We find that impacted
U.S. firms significantly reduce spending in R&D over a three-year period after treatment.
These firms also realize fewer patents, and there is a material increase in Chinese patents
in these same intellectual property markets. In particular, the new patents by Chinese
inventors directly cite the existing technology of the U.S. firms treated by the shock. This
crowding-out effect is linked to Chinese firms competing with U.S. firms as required under
the exclusion requirement. Placebo tests indicate that firms from Europe, Japan and other
major economies do not compete differently when Chinese internet penetration rises. These
findings mitigate concerns that unobserved economic state variables might be driving our
results.
Competition in the market for intellectual property has a strong industry-specific com-
ponent. We thus use provincial industry locations and motivation from the agglomeration
literature to identify geographic regions where the most skilled and specialized human cap-
ital exists in China for a given industry. We build industry-specific measures of Chinese
internet penetration by mapping province-level data on internet penetration to the locations
where each industry most agglomerates. Because internet penetration depends on the ability
of unrelated utility companies (internet service providers) to provide digital infrastructure,
3
its variation is plausibly exogenous (particularly when we additionally control for demand
effects such as industry growth rates in China, and when we consider placebo tests). Intu-
itively, the provision of high quality internet depends on population distributions, geographic
features, and the relative efficiency of local Internet Service Providers (ISPs). Province-level
penetration thus varies substantially across provinces and over time.2 This framework allows
us to create an industry-year panel of instruments for Chinese innovation competition with
adequate variation to test our key hypotheses even after including firm and year fixed effects.
We also assess the specific role of Chinese government support by considering Chinese
government five-year plans, which list the industries that are strategically favored at any
point in time. We find that U.S. firms reduce R&D and patents more aggressively when
internet penetration is high and their focal industry is supported in the Chinese five-year-
plan. However, our main innovation results remain significant even in the absence of Chinese
government support, reinforcing the distinct importance of information access on innovation
competition.
As we are careful to note limitations in our ability to establish causality, we conduct a
number of tests that at least partially support the validity of our instrument. First, using
textual analysis of U.S. firm 10-Ks, we find that U.S. firms complain more about competition
specifically from China, especially in the context of intellectual property, when our industry-
year measure of Chinese internet penetration is higher. Second, placebo tests indicate no
evidence of similar complaints about competition from other regions of the world including
Japan, Europe, Canada and Mexico. This placebo test has high power, as complaints about
competition from these other regions are more common. It also mitigates concerns about
unobserved industry state variables, as industry conditions typically have a global component
that would trigger positive results in these placebo tests.
Going beyond competition complaints, we also predict and find analogous treatment
effects using patent citations for Chinese citations and no placebo results for other countries
2Roberts and Whited (2013) suggest that variation along geographic dimensions has good properties forcausal identification.
4
in other regions of the world. We find that our internet penetration measure significantly
predicts higher rates of patent citations by Chinese inventors citing the patents of the treated
U.S. firms in our sample. We observe no changes in citation rates by inventors from the other
regions of the world - including Japan, European countries, as well as Canada. Finally, we
also find higher rates of patents applied for by firms and inventors in China itself that cite
these same treated U.S. firm patents.
The results illustrate the mechanism driving intellectual property competition and indi-
cate that omitted economic state variables, such as worldwide industry supply or demand
factors, likely cannot explain our results. Our framework, which includes region, firm and
time fixed effects, also ensures that identification is coming from specific Chinese provinces
(mapped using industry agglomeration), and not from changes in China that are nationwide
in scope. These findings support the validity of the exclusion requirement, as our instrument
only measures shocks to innovative potential in China itself, and we only observe a strong
impact on the specific U.S. firms that should be impacted.
We also examine the ex post performance and production strategies of treated U.S.
firms. Our findings are consistent with U.S. firms re-optimizing their production and sourcing
decisions after an increase in Chinese competition. In the face of increased Chinese innovation
competition, sales growth of U.S. firms declines over the long run and U.S. firms also increase
their sourcing of inputs from China. Thus, the increased competition from China also
facilitates the ability of U.S. firms to purchase less expensive inputs from offshore sources.
Existing theory further predicts that our results regarding curtailed innovation investment
might moderate for firms with existing physical assets as hypothesized by Bloom, Draca, and
Van Reenen (2016). In particular, treated firms with more tangible and potentially “trapped”
assets might have incentives to maintain high innovation levels to avoid high adjustment costs
from downsizing. These firms should reduce innovation less following competitive shocks.
We use the asset tangibility of U.S. firms as our measure of trapped assets and indeed find
that firms with more tangible assets do maintain higher relative levels of R&D spending and
5
patents in the face of increased competition.
Our findings regarding trapped assets provide new insights on the importance of an in-
dustry’s initial conditions in shaping the ultimate impact of competition in innovation. Two
competing forces - competition in IP and existing markets - can help to explain some of the
disagreement in the empirical literature, which finds both positive and negative competitive
effects on innovation. We conclude that at least two margins of competition need to be sepa-
rately explored. Our main finding is that competition in the market for intellectual property
itself has a sharp negative impact due to crowding-out effects. In contrast, increased inno-
vation to escape competition is more likely when firms are competing in existing products
with assets with high asset specificity (due to high cost of downsizing).
Although our focus is on competitive intensity in the market for innovation, it is natural
to ask if our results inform the more controversial issue of intellectual property theft. A
starting point is that IP theft and fair competition should have similar impact on treated
U.S. firms. Both will crowd-out innovative spending as the foreign entrants claim a fraction
of the rents for themselves. On the surface, the increase in ex post Chinese firm patents
we find suggests that IP theft can only be part of the story, as the foreign innovators are
securing legal patent protection. However, this alone does not rule out IP theft as the ability
to create the new patents may also be partially from stolen trade secrets or other IP as a
precursor.
In order to at least partly inform whether our results relate to IP theft, we examine
the extent to which U.S. firms complain directly about IP theft in their 10-Ks. We find
suggestive evidence that our internet penetration instrument predicts a higher incidence of
complaints about IP theft by the treated U.S. firms. This evidence suggests that IP theft, or
“perceived IP theft,” might explain part of the increased competition in these IP markets.
Yet we caution readers not to draw strong conclusions from this analysis because power is
limited and statements by firms about IP theft do not constitute direct proof that IP theft
has in fact occurred. The underlying question of potential IP theft is important for future
6
research to consider, as policy implications differ for IP theft versus high competition.
2 Literature and Hypotheses
Our study aims to understand the impact of foreign competition specifically on the domestic
innovation production margin, and how it might differ from foreign competition on the
existing products margin (the focus of most existing studies). We focus on U.S.-China
competition due to its importance and the existence of relevant experiments. Our thesis is
that foreign competition plays out on at least two competitive margins.
Competition in the U.S. domestic innovation market has been extensively studied.3 In an
international context, Hombert and Matray (2018), Bloom, Draca, and Van Reenen (2016),
and Autor, Dorn, Hanson, Pisano, and Shu (forthcoming) study the impact of competition
from Chinese imports. However, no study to our knowledge has examined the impact of
competition in knowledge production itself on U.S. patenting and innovation.
Globalization of product markets results in the opening of borders, and the impact on
any nation can be modeled using theories of entry in markets with existing incumbents. In
classical models of competition with strategic substitutes, such as the Cournot model, the
central prediction is that an entrant will cause existing firms to downsize as the new competi-
tor absorbs a fraction of the market and applies upward pressure on quantities produced and
downward pressure on prices. If the value of growth options in such a market is proportional
to the scale of the firm, a natural follow-on prediction regarding innovation (our setting) is
that such competitive shocks will also lead to reductions in ex-post innovation spending by
incumbents as they analogously cede a share of the future market.
More recent research has challenged this classical view. Aghion, Bloom, Blundell, Griffith,
and Howitt (2005) suggest that a shock to competition could result in increases in innovation
as firms rush to differentiate their products in order to rebuild lost market power. This is the
3Early work on innovation and competition has been summarized in the survey by Reinganum (1989)with recent contributions by Phillips and Zhdanov (2013) and Bena and Li (2014).
7
“escape competition” hypothesis. The validity of this alternative hypothesis depends at least
in part on incumbent firms having a technological advantage relative to the new entrants,
as only then would they be able to defend their differentiated products from entrants.
The classical theory and the escape competition theory thus have opposite predictions. It
is therefore not surprising that existing studies find mixed evidence regarding the impact of
Chinese competition on the innovation intensity of domestic firms. These studies, however,
only examine one competitive margin: the market for existing products. We propose that
the overall effect of Chinese competition on a domestic incumbent’s innovation spending has
two parts: that from (1) increased competition in the market for existing products and (2)
increased competition in the market for innovation itself. Understanding both margins can
help to reconcile the mixed evidence in the literature.
Our first hypothesis relates to the margin of competition for innovation.
Hypothesis H1: Increased foreign competition in innovation will reduce the value of
the incumbent’s growth options as the entrant will take a fraction of both current and fu-
ture market share. This will reduce the incumbent domestic firm’s innovation spending and
patenting. In contrast, foreign entrants will increase patenting activity, especially in tech-
nologies related to those of the incumbent.
Because H1 pertains to an increase in competition on the same margin that we are
trying to predict (innovation), H1 intuitively predicts that the classic model’s crowding out
prediction should dominate. In contrast, because innovation can change the market structure
of existing products (Sutton, 1991), the scenario can be more complex on the second margin:
mestic incumbents to downsize. We thus predict decreased innovation spending by these
incumbent domestic firms.
8
Hypothesis H2b: Increased foreign competition in existing product markets leads to
reduced prices for the existing products. To recapture pricing power, incumbent domestic
firms will increase innovation spending in order to increase product differentiation and es-
cape competition.
Because predictions can be ambiguous, it is natural to ask if initial conditions moderate
which outcome prevails: H2a or H2b? We follow Bloom, Draca, and Van Reenen (2016) and
propose that the existence of trapped assets by the domestic incumbents favors H2b. If a
firm has non-redeployable assets and adjustment costs are high, it has a strong incentive to
maintain high production levels. By increasing innovation, such a firm can preserve pricing
power while maintaining production.
Hypothesis H3: When domestic incumbents have non-redeployable assets, these firms
will increase innovation spending, all else equal, to fully utilize existing assets.
3 Data and Methods
3.1 Sample Selection and Panel Structure
Our sample begins with the universe of Compustat firm-years with available 10-K filings on
the EDGAR system. We exclude financial firms and regulated utilities (SIC 6000 - 6999
and 4900 - 4949, respectively) and limit the sample to firm-years with sales and assets of
at least $1 million. Since the Chinese internet penetration measures do not exhibit enough
industry-province coverage until 2000, our final sample is from 2001 to 2016, with 62,899
firm-years from 8,584 unique firms.
We construct a set of country-specific competition complaint measures using text from
10-K filings. We use software from meta Heuristica LLC to process these queries. To measure
complaints about competition from China, we search for paragraphs that contain at least
one word from both the country name list (”China” or ”Chinese”) and the competition
9
word list (”compete” or ”competition” or ”competing”). We define CNcomp as the number
of matching paragraphs normalized by the total number of paragraphs in the given 10-K
document. We construct three more specific competition measures by additionally requiring
matching paragraphs to contain a word from a third word list. First, we define CNCompHi
(high competition), as additionally requiring one word from the following list: (high OR
intense OR significant OR face OR faces OR substantial OR significant OR continued OR
vigorous OR strong OR aggressive OR fierce OR stiff OR extensive OR severe). Second,
we define CNIntComp (competition in intellectual property) as additionally requiring both
“intellectual” and “property” in matching paragraphs. Finally, we measure complaints about
IP theft, CNIntTheft, by counting the number of paragraphs that contain the country name
list (”China” or ”Chinese”), contain “intellectual property” or “trade secret”, and that also
match one of the words in the following list: (infringe* OR theft* OR stolen* OR steal*). In
addition to constructing the above ratio measures scaled by the total number of paragraphs,
we also construct dummy variables equal to one if the given firm has at least one hit on a
given query above. We also construct analogous measures for three other major economies
in the world: Europe, North America (Canada and Mexico), and Japan. Table A1 provides
additional detail.
Other firm characteristics variables come from Compustat. We measure firms’ R&D
intensities by normalizing the R&D expenses (xrd) by sales. Following the suggestions from
Koh and Reeb (2015), we replace missing R&D intensities by the industry average (2-digit
SIC) if the firm has applied for any patents in the past three years, and replace other missing
values with 04. We winsorize all ratio variables at the 1% and the 99% level to control for
outliers. Definitions for other control variables can be found in Table A1.
4Our results on R&D are robust if we do not fill missing R&D expenses following Koh and Reeb (2015),as shown in Table OA9 in the Online Appendix.
10
3.2 Patent Data
We generate our patent measures from two sources. The first source is Google Patent. Since
Oct. 31, 2017, Google, in collaboration with IFI Claims, a global patent research company,
has made a set of structured and queryable datasets of patents available to the public5. The
database contains over 90 million patent publications from the patent offices of 18 countries,
including both the U.S. and China, among others. We also use patent data from Kogan,
Papanikolaou, Seru, and Stoffman (2016) (KPSS hereafter), who kindly share this data on
their website. A key advantage of KPSS data is the authors link patents to U.S. public firms.
Google patent data also has the patents filed by foreign firms, which we use to assess Chinese
patenting and to conduct our placebo tests based on firms from other countries filing in the
U.S.
We first use patent applications to measure innovation activities and we extend the KPSS
(which ends in 2010) using the Google data. To link the new Google patent data to public
firms, we utilize links already developed by KPSS. First, we take the overlapping part of the
Google data and the KPSS data6 and generate links between permno numbers (from KPSS
data) and (first) assignee names (from Google data). Next, we select all the utility patents
that are filed in USPTO and granted after Nov. 1, 2010 from Google data. We then merge
the permno number to the first assignee of patents using the link file we just generated. In
this step we are able to match 77.4% of all the new patents.
Google also provides the country for each assignee7, allowing us to identify U.S. patents
assigned to foreign firms. We use this information to additionally measure the number of
new Chinese patents that specifically cite the existing patents of U.S. firms, providing direct
evidence on the intensity of learning by Chinese firms about specific (treated) U.S. firms.
We also construct similar measures for the other major economies, which facilitate our key
5See https://cloud.google.com/blog/products/gcp/google-patents-public-datasets-connecting-public-paid-and-private-patent-data. The data is accessed through Google’s BigQuery service
6The Google Patent Data covers 99.95% of the patents in the KPSS data matched by the patent number,and covers 99.59% of patents matched by both patent number and the grant date.
7The corresponding variable is assignee harmonized.country code in the dataset.
11
placebo tests.
Finally, Google also includes patents filed with China’s Patent Office SIPO (State Intel-
lectual Property Office of the People’s Republic of China). This allows us to further check
whether Chinese patents filed with SIPO also cite the patents of treated U.S. firms, allowing
us to reinforce tests based on our previous measures that use only patents filed in the U.S.
3.3 Internet Penetration
Internet access in China has dramatically changed over the past two decades. In the early
2000s, fewer than 1% of the population in China had access to the internet, and by 2018, the
number of internet users in China surpassed 800 million and internet penetration reached
57.7%. The internet has become the most important medium through which information is
exchanged. For innovation activities, the internet enables inventors to collect information
more efficiently, and it is almost indispensible for modern day research.
To measure the internet penetration rate in China, we hand collect the number of internet
users from the reports issued by the China Internet Network Information Center (CNNIC).
CNNIC is the official administrator of internet infrastructure in China, and starting from
1998, it publishes semi-annual reports which describe the recent development of internet
infrastructure and the demographics of internet users in China. Importantly, these reports
provide information separately for each Chinese province (excluding Hong Kong and Macau).
We then collect population for each province using China Data Online and we then compute
the internet penetration ratio for each province in each year.
Internet infrastructure has grown unevenly across provinces in each year. For example,
Figure 2 plots the year in which each province experienced its largest increase in internet
penetration, illustrating a highly scattered pattern. The telecommunication industry in
China also has experienced drastic change. Prior to 1994, China had a single government unit
that provided all phone and internet service: the Directorate General of Telecommunications,
which was later registered as China Telecom. The monopoly structure changed in 1994 when
12
China introduced China Unicom to compete with China Telecom. Deregulation continued
in the 1990s as China Telecom was broken into two companies, and other internet service
providers such as China Net and China Railnet were established. By the end of 2001, China
had seven telecommunications companies, each focused on different businesses and regions.
For example, China Net, an internet service provider, mostly operated in 10 provinces in
northern China. After the industry went through a round of consolidation by the end of
2008, only three companies remained, each covering all telecommunication services, namely
China Telecom, China Mobile, and China Unicom. These industry changes directly impacted
internet services. For example, Figure 2 shows that after China Net was acquired by China
Unicom, three northern provinces—Liaoning, Shandong, and Jilin—experienced their largest
increase in the internet penetration rate in 2009.
We compute a measure of internet penetration customized to each industry in each
year. To do so, we compute the weighted-average level of internet penetration based on
the provinces that are most important for the given industry. Supporting this approach, a
large literature illustrates that industries cluster geographically8. Ideally, our weights would
assess the total assets of all firms in each industry across provinces. However, detailed census
data covering private firms is not publicly available, and thus we focus on Chinese public
firms. To reduce the impact of endogeneity in the industry-province links, we derive ge-
ographic industry distributions using only data from the year 2000. We choose this year
because the number of industries spanned by public firms reaches sufficient critical mass
in this year, as shown in Figure 3. We consider all Chinese public firms with non-missing
headquarter locations and assets in 2000. This includes 938 firms listed in mainland China
(A-share) and Hong Kong9. For each 2-digit SIC industry, we compute province weights us-
ing the total assets of the given industry’s public firms headquartered in the given province
in 2000. We then set to zero any provinces whose weights are below 10%, and recalculate the
8See Florence (1948); Hoover (1948); Fuchs (1962); Krugman (1993); Ellison and Glaeser (1997); Duran-ton and Overman (2005, 2008)
9We only consider the primary exchange for dual-listed companies. Our results are robust if we only useA-share public firms, as shown in Table OA1 of the Online Appendix.
13
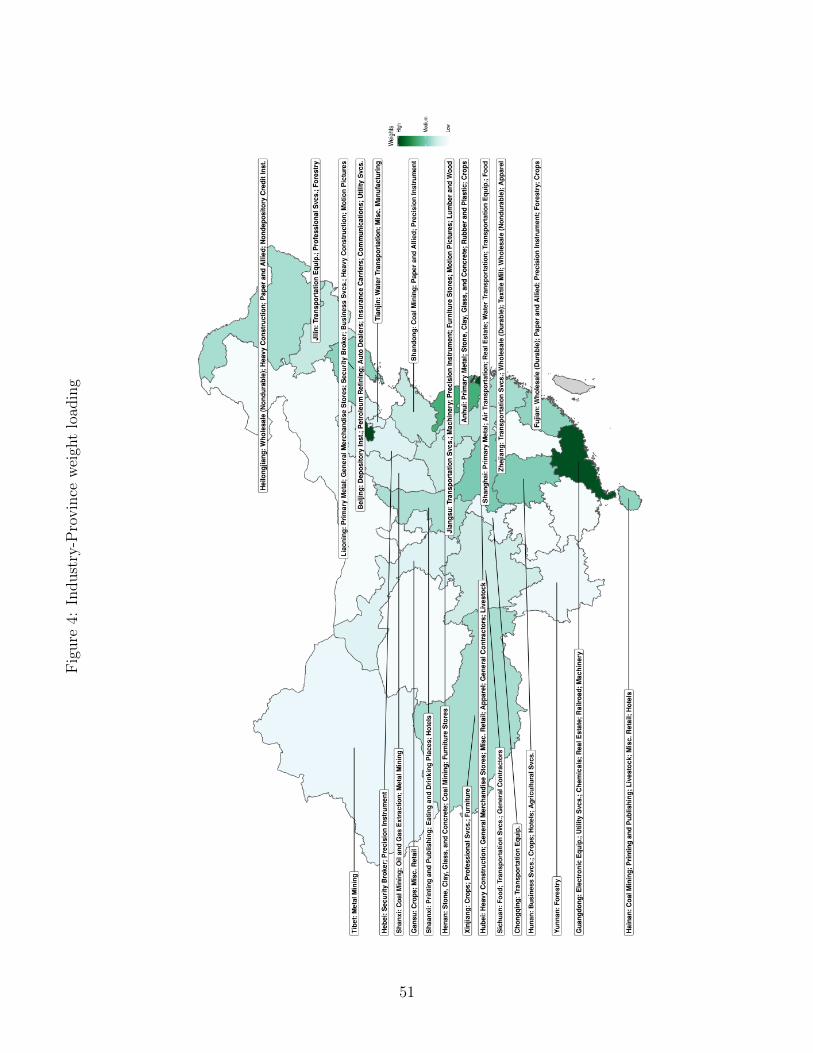
weights using the remaining provinces. Figure 4 shows the industry weights and descriptions
of each province. The color fill represents the sum of the weights of all the industries in each
province, and darker color indicates higher weight loading. For each province, we also list
the top six 2-digit SIC industries by total assets.10
An industry’s internet penetration ratio in a given year is then computed as the weighted
average yearly internet penetration ratios across the relevant provinces using the fixed year
2000 weights for each industry. As we discuss in the Online Appendix, our results are robust
to three alternative constructions of industry-specific internet penetration. First, we use
the internet penetration only from the top province with the largest assets in the industry
(Online Appendix Table OA2). Second, we consider the opposite approach and exclude the
top industry for each province, as the top industry might enjoy favorable policies (Online
Appendix Table OA3). Third, we consider weights based on macro-level industry output for
each province instead of public firm assets (Online Appendix Table OA4).11
4 Summary Statistics and Validation
4.1 Summary Statistics
Table 1 presents summary statistics for our 2001 to 2016 panel of 62,892 firm-year observa-
tions. The average industry internet penetration ratio is 36% for each firm-year. Roughly
5% of sample firms explicitly complain about competition from China, and 40% of these
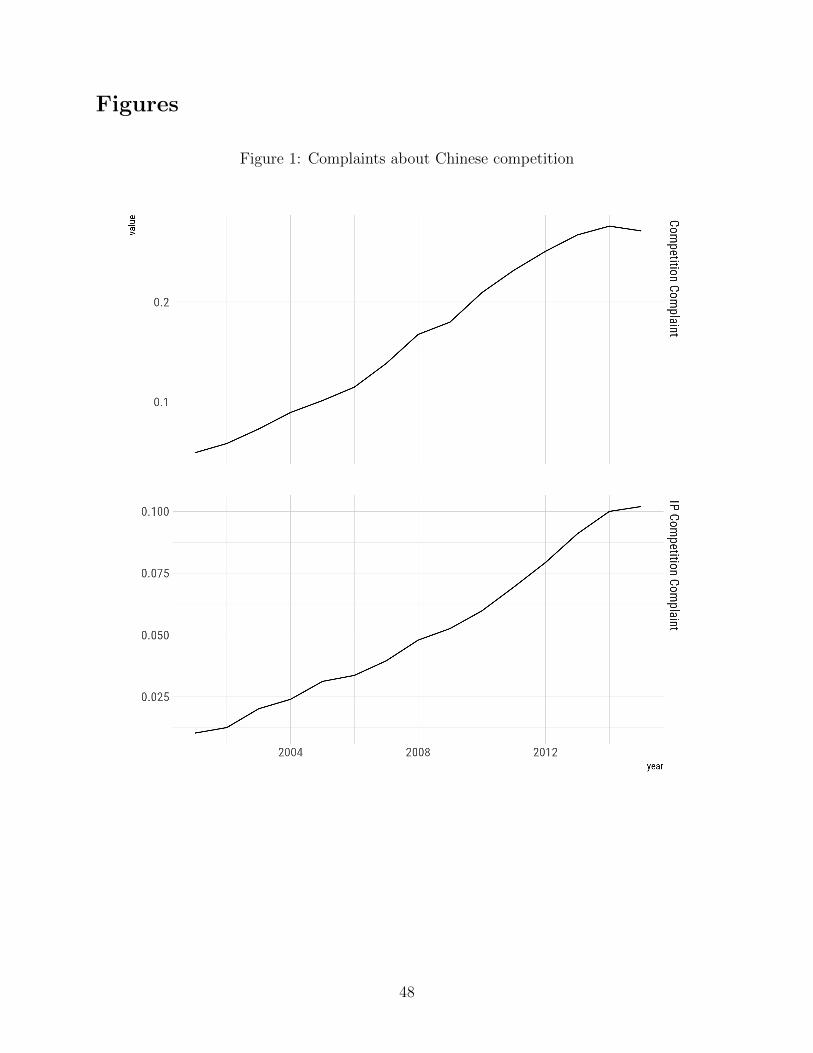
firms specifically mention intellectual property in their competition complaints. Figure 1
plots the incidence of U.S. firms complaining about both types of Chinese competition and
illustrates that both rise dramatically during our sample.
Table 1 also shows that U.S. firms complain about European and North American
10Due to the 10% cutoff for industry weights, some provinces will show fewer than six industries.11The macro-level data is based on aggregated Chinese census data acquired from China Data Online.
One disadvantage of this data is that it only includes manufacturing industries. However, a benefit is thatit includes both public and private firms.
14
(Canada and Mexico) competition at even higher unconditional rates than they complain
Chinese competition. Chinese competition (scaled by document size and x 1000) averages
0.15, whereas the analogous variable for Europe is 0.26 and it is 0.24 for North America.
Because we use activity in these other parts of the world as placebo tests, this indicates
that there is ample power to detect deviations from the exclusion requirement using these
other regions as placebos. However, this variable is just 0.04 for Japan, indicating its smaller
relative economic size and distance from the U.S.
We find even larger contrasts for patent citation activity across these regions. The average
intensity of Chinese firms citing U.S. patents is 2.36, while European, Japanese and North
American citations of U.S. firm patents are 26.85, 23.88 and 5.06, respectively. Because the
data is considerably richer for these regions than it is for China, it again follows that our
placebo tests should be particularly strong. Despite this high power, we still find strong
results for Chinese companies and no results for placebo tests using these other regions of
the world.
Table 2 displays summary statistics at the firm level rather than at the firm-year panel
level. In particular, we first calculate the mean value of each variable for each firm, and
the table shows statistics for the resulting firm averages. The primary motive for reporting
summary statistics both ways is to assess the distributions of our key variables for extreme
values. As we will include firm and year fixed effects, such outliers could sway our findings.
As is well-known in the innovation literature, variables measuring R&D and patenting
activity tend to be right-skewed. Consistent with the literature, we winsorize all variables
at the 1%/99% level.12 Overall, we find distributions that are similar to those in other
studies. Although these distributions are consistent with other studies, in Appendix B, we
also examine robustness tests to determine if our results remain robust in key subsamples
including the set of firms with positive R&D activity or in subsamples with above-median
patenting activity. The results in the Appendix show that our findings are robust to the
12We winsorize three variables CNIntTheft %, CNIntTheft Dummy, and JPIntComp %, at the 0.1% and99.9% levels because these variables have values of 0 at the 99th percentiles.
15
excluding firms with no reported R&D, as well as in these subsamples.
4.2 Validation Test: EDGAR Downloads by Chinese Internet Users
In this section, we validate our measure of Chinese internet penetration by directly assessing
the intensity of internet traffic from China targeting each U.S. firm in each year. For example,
if internet penetration increases in a Chinese province that focuses on electronics production
in 2006, we predict that U.S. firms in the electronics industry will experience increased
downloads by Chinese internet users specifically in this year. If additionally, the evolution of
internet penetration in China is plausibly exogenous to broader industry conditions (a key
threat to exclusion), we additionally predict no relationship for downloads by internet users
in other (placebo) nations. Alternatively, if internet penetration was endogenously driven by
unobserved industry state variables (violating exclusion), we instead would predict a strong
link between Chinese internet penetration and observed downloads from other parts of the
world (as industry conditions such as demand levels have a strong global component).
We test these predictions using the EDGAR internet log files from the U.S. Securities
and Exchange Commission. We use the IP Address of each visitor to identify which nation
they are from, and we then tabulate the number of visitors from each nation to each U.S.
public firm in each year from 2004 to 2015. We exclude IP addresses that are likely web
crawlers. Following Lee, Ma, and Wang (2015), we tag an IP address as a web crawler if the
IP address has downloaded files from over 50 or more firms in a day13. As larger firms will
have more visitors, we scale total web visits by each firm’s sales to create our key dependent
variable: # of EDGAR searches/sales. We also standardize this variable in each year for the
ease of interpretation and we estimate the following regression
13In addition to excluding downloads from web crawlers, we also exclude web requests that (1) have aserver code larger than 300 and (2) that target the index pages.
16
where i represents firm, j represents industry, and t represents year.
The dependent variable is the EDGAR web visitor traffic described above and detailed
variable descriptions are in Section 3.1 and in Table A1. CNInternet is our key internet
penetration variable. Z represents the control variables, which include: CNSalesGR, the
sales growth of the same 2-digit SIC industry in China, log(10kSize), log of the total number
of paragraphs of each 10-K filing, firm age, and size (log(total asset)). We also include
industry Q, computed as the product-similarity-weighted average Q of the firm’s TNIC
industry peers from Hoberg and Phillips (2006). To control for domestic competition, we
include the total similarity (sum of TNIC similarity scores) over a firm’s industry rivals using
the TNIC network from Hoberg and Phillips (2006). Finally to control for the possibility that
Chinese firms learn through joint ventures rather than the internet, we include the control
variable JV, which measures the intensity of joint ventures with China for each 3-digit SIC
industry-year14. All independent variables are lagged one year relative to the dependent
variable and hence are ex-ante measurable. We also include firm and year fixed effects in all
regressions, and standard errors are clustered by firm. In Online Appendix Table OA8, we
also show that our results are robust to clustering by Industry - Year.
Table 3 shows that Chinese internet penetration significantly predicts the intensity of
EDGAR downloads of U.S. firm disclosures by Chinese internet users. The inclusion of firm
fixed effects absorbs all firm-specific unobservable characteristics, and allows us to focus on
rigorous within-firm effects. These results provide strong validation of our proposed mecha-
nism: internet usage is a major tool for rapid information gathering of knowledge by overseas
individuals. This, in turn, likely exposes treated U.S. firms to increased competition from
abroad, specifically in the market for innovation and knowledge itself. These findings also
indicate an unintended consequence of mandatory disclosure. Such disclosure can strengthen
competition from overseas, likely at the expense of domestic firms.
14JV is calculated for each industry-year as JV = sum(Sales of firms that reported joint venture withChina) / sum(Sales of all firms in the industry). Online Appendix Table OA6 further shows that our resultsare robust if we exclude U.S. firms that reported any joint ventures in China.
17
Table 3 also reports the results of our placebo tests, where we consider EDGAR searches
from other major economies. As predicted, we find no significant link between our measure of
Chinese internet penetration and observed internet traffic from the European Union, Japan,
or Canada and Mexico. These results are consistent with Chinese internet penetration
being driven by factors that are plausibly exogenous relative to industry state variables. In
particular, if internet penetration was correlated with industry demand or expected growth,
which have strong common global components, we would expect these placebo tests to fail
and produce significant results. Our findings instead suggest that any link between internet
penetration and industry conditions is likely small in magnitude.
4.3 Validation Test: Complaints about Chinese Competition
Our empirical strategy is based on the assumption that increased Chinese information gath-
ering via the internet specifically shifts the innovation competition faced by treated U.S.
firms (those facing higher Chinese internet penetration). We test this validating assumption
directly using textual analysis of 10-Ks disclosed by U.S. firms during our sample period to
determine if treated U.S. firms disclose more complaints specifically about Chinese competi-
tion, and specifically in the context of intellectual property. These tests aim to validate the
power of our instrument regarding its predicted economic content for the U.S. firms.
Once again, our framework also allows for strong placebo tests based on the other major
economies. If the exclusion requirement holds, Chinese internet penetration should not
predict higher rates of complaints by U.S. firms about competition from Europe, North
America (Canada and Mexico) and Japan. As noted earlier, these placebo tests have high
power due to the fact that these other economic regions are large in scale and U.S. firms
frequently summarize the intensity of competition from these regions. The key empirical
question is if these complaints are related to Chinese internet penetration.
Table 4 shows the results. In the first two columns, we find that the Internet penetra-
tion significantly predicts the rate at which treated U.S. firms complain about competition
18
specifically from Chinese firms. A one standard deviation increase of the internet penetration
ratio leads to a 0.132 standard deviation increase, or a 68% increase from the sample mean
of the Chinese competition complaint measure. We obtain similar estimates if the dependent
variable is a dummy equal to one if the given U.S. firm has at least one such complaint in
its 10-K. Columns (3) and (4) of Table 4 show that internet penetration also significantly
predicts complaints specifically noting that Chinese competition is high.
Our most direct tests are in the last four columns of Table 4. Internet penetration also
significantly predicts U.S. firm complaints about competition that are specific to intellectual
property (IP) discussions (see Columns (5) and (6)). In Columns (7) and (8), instead of
focusing on competition, we consider instances where U.S. firms discuss IP theft. We find
that U.S. firms indeed complain more about IP theft when internet penetration rises.
The possibility of IP theft has been a centerpiece of recent public and political debates
about trade conflicts between the U.S. and China. Although we do not draw strong con-
clusions with respect to IP theft, as complaints do not constitute proof that a crime has
occurred, our finding that internet penetration significantly predicts IP theft complaints is
suggestive of a potential link that can motivate future research. Also relevant, we later doc-
ument increased patenting with USPTO by Chinese firms (discussed later), which suggests
that a significant part of the Chinese competitive activity is transparent and legal given cur-
rent USPTO rules. Yet IP theft could be a precursor to such patents, as the younger firms
in China might use trade secret theft to catch up on overall knowledge capital, which then
facilitates the subsequent seemingly-legal patents. Overall, our evidence of IP theft is thus
far from decisive and we report this evidence mainly to motivate the importance of future
research on IP theft.
Overall, Table 4 validates that internet penetration has strong links to the competitive
pressures reported by U.S. firms, and especially regarding IP discussions.
19
4.4 Placebo Tests using Other Major Economies
Although the above validation tests produce positive results regarding the predicted eco-
nomic content of Chinese internet penetration, other economic or industry factors might be
correlated with this measure. To further examine the exclusion requirement, we construct
analogous measures of competition complaints for other the major economies (Europe, Japan,
and Canada and Mexico). Table 5 shows the results. For brevity we focus on complaints
about competition and intellectual property theft. The table shows that Chinese internet
penetration is not significantly related to complaints about competition from any of the
placebo regions. This evidence further suggests that our internet penetration variable is not
picking up content related to global industry conditions or competition, which would predict
significant coefficients in these placebo tests.
We briefly note that we run an additional placebo tests later in the paper where we con-
sider patenting activity by firms in these placebo nations. We again find positive results for
Chinese firms and their link to Chinese internet penetration, but no significant results for
firms in placebo nations despite the higher power available for the placebo tests. Collectively,
these placebo tests suggest that it is unlikely that our internet penetration variable is signif-
icantly contaminated by an omitted industry state variable. These findings lend support to
the interpretation that our results are consistent with Chinese access to information through
internet penetration likely driving increases in competition on the innovation production
margin.
5 Competition and Innovation
In this section, we examine how competition from China, as measured by our industry-
specific Chinese internet penetration variable, affects the innovation activities of U.S. firms.
20
5.1 Impact on U.S. Firms
We first examine how ex ante industry-specific Chinese internet penetration impacts ex post
investment in R&D and ex post patenting by treated U.S. firms. We do so by estimating
the regression model specified in Equation 1 where the dependent variable is U.S. firms’
R&D/sales or patents/sales.
Table 6 shows the results. Column (1), which uses R&D in year t+1 over sales in year t as
the dependent variable, shows that internet penetration significantly negatively predicts ex-
post R&D. The coefficient estimate of -0.183 is significant at the 1% level, and indicates that
R&D decreases by 0.183 standard deviations when Chinese internet penetration increases
by one standard deviation. The coefficient remains significant when we examine two-year
ahead R&D in Column (2) and three-year ahead R&D in Column (3). To ensure the results
are not driven by changes in the denominator (the scaling factor), following convention, we
scale both dependent variables by ex ante sales from year t.
We find similar results for the ex post patenting by the treated U.S. firms. In Columns
(4) - (6) of Table 6, we use the number of patent applications in the next three years divided
by sales in year t as the dependent variable. Column (4) shows a highly significant coefficient
estimate of -0.074, indicating a decrease of 0.074 standard deviations when Chinese internet
penetration increases by one standard deviation. In years two and three, we continue to
observe significant and negative coefficients.
To ensure that our results are not driven by the skewed distribution of R&D and patents,
we re-estimate the model using Poisson regressions. Table 8 displays the results. To facilitate
the Poisson regressions, we drop the firm fixed effects and instead we control for the lagged
dependent variable. Overall the negative effects we find for internet penetration on ex
post U.S. firm innovation are analogous to those in Table 6. In Online Appendix Table
OA5, we also find consistent results when we only include observations with positive R&D.
Collectively, it is unlikely that the skewed distribution of R&D, or reports of zero or missing
R&D, can explain our results.
21
We conclude that plausibly exogenous shocks to the ability of Chinese firms to compete
in the market for innovation production are associated with sharp reductions in ex-post
innovation rates for treated U.S. firms. This main result of our paper is new to the literature,
which instead focuses on the margin of import competition through existing products.
5.2 Impact on Chinese Firms
Unlike broad industry conditions such as demand shocks, which predict same-sign results
for U.S. firms, Chinese firms, and placebo nation firms, our competition hypothesis rather
uniquely predicts opposite-sign results for U.S. and Chinese firms, and no results for placebo
nation firms.
We now examine the relationship between ex ante internet penetration and the ex post
number of new Chinese patents that directly cite the existing patents of treated U.S. firms.
We use the country information of the first assignee for each patent to identify patents
assigned to a Chinese entity. For each firm i in year t+ 1, we then count the number of new
patents that are (1) applied for through the USPTO, (2) assigned to a Chinese entity, and
(3) cite any existing patents of firm i. Following our standard conventions, we then scale
this count (PatCiteUSCN) by firm sales in year t.
We use this measure of Chinese patents (that cite each focal U.S. firm) as the dependent
variable in Table 9. Columns (1) - (3) show that ex ante internet penetration predicts
increases in the number of Chinese firms citing patents to these U.S. firms in the next three
years. Results are significant at the 1% level in each of the three ex post years. The effects
are economically large as a one standard deviation increase in internet penetration is followed
by a 0.224 standard deviation increase in the number of citing patents by Chinese firms in
the following year.
To ensure that our tests are not driven by changes in the overall intensity of patent
citations to a given U.S. firm’s existing patents, we consider an alternative scaling that
accounts for the cites to these same patents by other U.S. firms. In particular, we define
22
PatCiteUSUS as the number of cites to the focal firm’s patents by U.S. firms. Columns (4) -
(6) of Table 9 show the results of regressions where the dependent variable is PatCiteUSCN
/ (PatCiteUSCN + PatCiteUSUS + 1). The added one in the denominator avoids division
by zero and this construction ensures that this variable is bounded in [0,1] and thus avoids
outliers. We find that the results in Columns (4) to (6) are similar to our baseline results in
Columns (1) to (3). Our results are thus not driven by broad increases in patent citations,
but are unique to the Chinese firms citing these patents.
The Google patent database also includes all patents filed with SIPO, the Chinese Patent
Office. We thus construct a similar measure of Chinese patents that cite the U.S. firm
patents, but that are filed in China. The dependent variable for Columns (7) - (9) of Table 9
is PatCiteCN, which is the number of new patents that are applied with SIPO that cite the
existing patents of the U.S. firm, and we scale this quantity by the focal firm’s sales. We find
that the coefficient estimates for internet penetration once again are highly significant and
economically large. A one standard deviation increase in internet penetration is associated
with an increase of 0.098 to 0.194 standard deviations of these SIPO patents over the three
ex post years. Columns (10) - (12) of Table 9 show that these results are robust using the
alternative scaling used in Columns (4) to (6).
We also examine whether the firms subject to Chinese increased competition increased
their mergers and acquisitions to buy innovation as a substitute for the decreased internal
R&D spending that we find. We measure M&A activity using data from the Securities Data
Corporation (SDC). We do not find any significant changes in ex post M&A activity.
Overall, we find consistent evidence that the internet penetration predicts strong ex
post patenting activity by Chinese firms, and that these new patents are directly in the
technological areas spanned by the treated U.S. firms. These results suggest that high quality
internet access facilitates increased learning by Chinese firms about the existing technologies
used by U.S. firms in their industry. Taken together with our finding that U.S. firms decrease
patenting in these same technological markets, our results suggest that high Chinese internet
23
penetration is followed by a strong crowding-out effect. As Chinese firms enter these markets
for innovation, they absorb a fraction of the associated rents and opportunities, and thus
crowd-out the treated U.S. firms.
5.3 Impact on Firms in Placebo Tests
Analogous to our earlier placebo tests in Table 5 regarding competition complaints, we
perform similar placebo tests for the ex post patenting results in the previous section. If the
exclusion requirement is violated, we would expect to see significant increases in patents from
placebo nations that cite these same U.S. firms when Chinese internet penetration increases.
Table 10 displays regressions similar to those in Table 9, except we replace the depen-
dent variable with patenting activity by firms in each of the alternative placebo economies
(Europe, Japan, and Canada and Mexico). Table 9 shows that, across all columns, we find
no evidence that Chinese internet penetration predicts ex post patenting activity by firms
in any of the placebo economies. The absence of results also holds uniformly over the first,
second and third years following the increases in internet penetration.
Furthermore, the economic size of the coefficients are much smaller than those for Chinese
patents documented above. In fact, six of the nine regression coefficients have a negative sign,
whereas the results for China are positive and highly significant. Especially when combined
with our results for Table 5, these placebo tests indicate that Chinese internet penetration
rather uniquely measures the ability of Chinese firms (and not placebo nation firms) to
compete in the market for innovation on the global stage. These results are consistent with
the validity of the exclusion requirement.
5.4 Competition in Innovation vs. Product Market Competition
To compare the two margins of competition - competition in innovation and competition
from existing products - we follow the literature and use import penetration from China to
measure China’s competition in existing products. Appendix 6 provides the detailed steps
24
regarding how we construct the import penetration variable. We then consider regressions
that include both competition in existing products and competition in innovation (based
on our internet penetration variable). Panel A of Table 7 displays the results for our R&D
and patenting dependent variables. Columns (1)-(4) display results for R&D, and Columns
(1)-(3) focus on an early part of our sample (2001 - 2007) to better match the sample
period used in Autor, Dorn, Hanson, Pisano, and Shu (forthcoming) (ADHPS hereafter).
We include only internet penetration or import penetration in Columns (1) and (2), and
include both in Column (3). As the coefficients change little when included together, the
impact of each competition margin is likely unique and not particularly correlated. Although
both competition variables have negative coefficients, only the coefficient for CNInternet is
significant. We find a similar result when we repeat the analysis using the full sample (2001
- 2016) in Column (4).
Columns (5) to (8) analogously examine patenting activity. We find that import pene-
tration (CNImport) significantly and negatively impacts U.S. firms’ patenting activity, espe-
cially in the years after China’s admission into the WTO in 2001. In contrast, CNInternet
has a negative but insignificant coefficient estimate in Column (5) of Panel A. The results
are similar when we include both competition variables in Column (7). This result illus-
trates the existing literature’s finding of a large impact of imports after China’s inclusion
in the WTO. Interestingly, however, when we extend the sample to 2016 in Column (8),
we find that the CNInternet becomes significant, while the coefficient for CNImport loses
its significance. This suggests that internet penetration and competition in the market for
IP production became the dominant margin for competition in more recent years, whereas
competition in existing products (import penetration) was the dominant margin in earlier
years.15 These results also illustrate that the two competition margins have distinct effects
and at different times, illustrating the importance of modeling both in related settings.
We further examine specifications that include CNImport alone in different sample peri-
15Column (4) in Panel B shows that CNImport is negative and weakly significant if we exclude theCNInternet variable.
25
ods in Panel B of Table 7. Consistent with ADHPS, Columns (1) and (3) show significant and
consistent negative effects for CNImport in their sample, which begins in 1997.16 Columns
(2) and (4) of Panel B show that CNImport is negative and significant in our full sample
when included in the regression without CNInternet, although Panel A Rows (4) and (8)
show that CNInternet subsumes this significance when both are included.
These subsample results, which include years beyond those in existing studies, show that
competition relating to innovation is growing in importance relative to competition from
existing products. Competition from existing products measured using import penetration
is mainly significant in earlier samples. This shift in later years is also consistent with Chinese
import penetration reaching more stable levels in the later years, and thus our fixed effects
absorb more of its variation. Our results thus should not be interpreted as import penetration
not being important. Rather, our more recent sample is best suited to explore competition
from innovation, and earlier samples are better suited to explore import penetration and
competition in existing products.
5.5 Competition and Central Government Support
The Chinese government provides additional support for innovation in selected industries as
part of its five-year-plans, which are published by the Chinese government and renewed in
five year cycles. From a theoretical perspective, subsidies increase the incentives to innovate
by lowering costs. Because subsidies can accelerate innovation when adequate knowledge is
available, we predict that the impact of Chinese competition on U.S. firms will be particularly
large in magnitude when both (A) government subsidies target the focal industry and (B)
internet penetration and knowledge-availability is high.17
To implement this test, we extract lists of strategically favored industries from each five-
16We used the 2001-2007 sample in Panel A because because the CNInternet variable is only of highquality after 2001 (See Section 3 and Figure 3), and this period also avoids the financial crisis.
17We also examine if our results are driven by local provinces lobbying to gain internet access to help theirlargest industry. We thus examine if our results are robust to excluding the largest province for each industrywhen computing internet penetration. We present the results in Online Appendix Table OA3, which showsthat our results are robust.
26
year-plan,18 and define a dummy variable FYP that is one if a given industry is favored
in the five-year-plan prevailing at the time. Our primary focus is on the interaction with
internet penetration (CNInternet x FYP).
Table 13 reruns our main tests with both FYP and its key interaction with CNInternet
included. The interaction term in Columns (4) to (7) show that US firms indeed reduce R&D
more aggressively and patent less when Chinese internet penetration is high and the focal
industry is supported under the prevailing five-year-plan. Moreover, we also find that the
CNInternet levels term remains negative and significant especially for R&D, indicating that
access to quality information remains important even in the absence of government subsidies.
Additionally, rows (1) to (3) show that complaints about Chinese competition by U.S. firms
remain significantly related to internet penetration (CNInternet) but the cross term with
FYP is not significant. We conclude that our main result is robust and generally strongest
in industries that receive support. Yet our results remain robust even in non-subsidized
industries.
In a final test, we examine whether government support alone (without considering in-
ternet penetration) can also generate our results. We thus drop all terms relating to internet
penetration in Online Appendix Table OA7, but we keep the FYP dummy. We find that
FYP is not significant in any of our main tests with one exception: column (4) shows that
FYP predicts lower U.S. firm R&D. We conclude that although government support matters,
access to high quality information about U.S. firms is crucial to generating our main results.
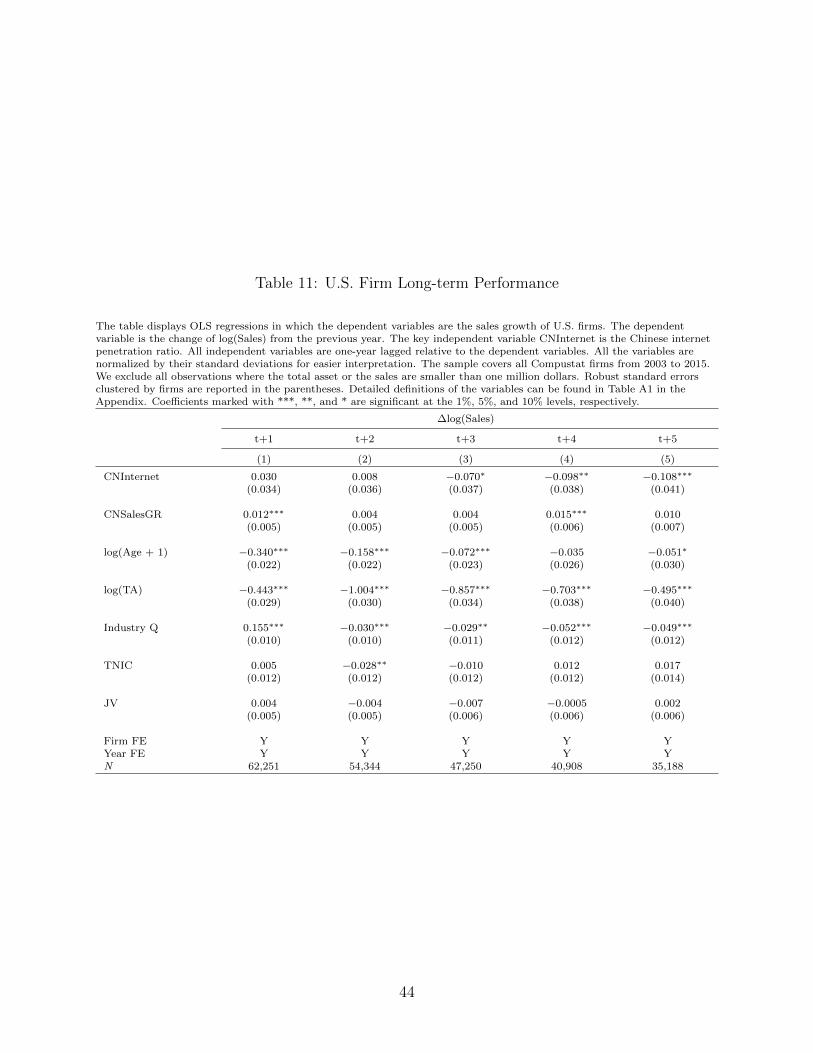
5.6 Subsequent Firm Performance
In this section we examine the long-run firm performance of treated U.S. firms subsequent
to the increases in Chinese internet penetration. Hombert and Matray (2018) find that firms
that are ex ante R&D intensive experience more positive outcomes due to their increased
ability to use R&D to escape competition - however both sets of firms have negative long-run
18These data were gathered by Hong, Li, and Phillips (2020). We thank them for sharing the data.
27
performance. We examine both the long-run change in sales growth and we alsohow U.S.
firms change their offshoring decisions following episodes of high Chinese internet penetra-
tion.
Table 11 examines ex post sales growth over 5 years and shows that sales growth declines
over longer-term horizons when CNInternet is high. In particular, sales growth is significantly
negative three to five years after Chinese internet penetration increases. The 3 year lag is
consistent with the fact that shocks to R&D take time before they are commercialized. The
decline in year three is 7% and this further declines to 10.8% by year five. Overall, these
results are consistent with U.S. firms growing less in the face of Chinese competition. We also
examine subsequent firm profits and find, in unreported results, that there are no significant
changes. Given that profits do not decline, we investigate whether treated U.S. firms make
offsetting changes in their offshoring decisions in response to increased Chinese competition.
5.7 Subsequent Firm Sourcing Decisions
Table 12 examines ex post offshoring decisions following increases in Chinese competition.
We focus specifically on offshore operations in China and we examine both input sourcing
from China and output exporting to China. We thus use the text-based offshore network
data from Hoberg and Moon (2017) and Hoberg and Moon (2019). These measures are based
on 10-K filings and use proximity searches to examine the content of text appearing within
a 15 word window around each mention of the word China. This proximity search identifies
words associated with purchasing input or with selling output, allowing us to identify which
U.S. public firms are engaged in each activity. The offshore input dummy is one if the firm
mentions purchasing inputs from China in the given year. The offshore output dummy is
analogously based on mentions of selling output to China in the given year.
Table 12 shows that U.S. firms facing higher Chinese internet penetration respond by
purchasing more inputs from China. However, they do not increase their offshore sales to
China. Columns 1 - 3 show that the increased purchase of Chinese inputs is significant for all
28
windows examined. The propensity to conduct offshore purchasing of inputs increases 5% in
one year and 3.8% in year three. These results are consistent with U.S.firms re-optimizing
their sourcing and production decisions when Chinese competition increases. Given that the
sales decline but operating profits do not, this is consistent with firms sourcing less expensive
inputs - a potential benefit for the U.S. firms. The ability to source more inputs from China
in this scenario indicates that firms adjust on multiple margins when foreign innovation
competition increases.
5.8 Competition and Asset Composition
As we noted in our discussion of hypotheses, the impact of foreign competition on the
innovation activities of U.S. firms can vary based on the specific threats posed by the foreign
entrants, and the asset composition of the affected U.S. firms. For example, competition in
the market for existing products can either increase or decrease innovation for the affected
U.S. firms. Moreover, U.S. firms having non-redeployable assets might have strong incentives
to increase innovation spending on the margin. Such innovation can help firms to “escape
competition”.
The theory of Bloom, Draca, and Van Reenen (2016) suggests that firms with more
trapped (non-redeployable) assets will have stronger incentives to preserve market share by
increasing innovation following shocks to competition. When competition increases, treated
firms will become more innovative after the shock’s arrival. The prediction is that U.S. firms
will increase innovation following such competitive shocks. We take this prediction to the
data and measure the likely existence of trapped assets using the asset tangibility of the U.S.
firms. We then rerun our main regressions after adding a dummy indicating above-median
ex ante asset tangibility and also its interaction with CNInternet.
Table 14, Columns (1) to (3), show that firms with higher asset tangibility complain
more about the Chinese competition. This supports the notion that these firms face fewer
options to adapt to the increased competition because they cannot easily downsize. These
29
results are consistent with trapped asset predictions. Moreover, high asset tangibility firms
increase innovation relative to firms with less asset tangibility as the cross terms in Columns
(4) to (7) are positive and significant at the 1% or 5% level.
Although these results support the theories of Bloom, Draca, and Van Reenen (2016)
and Aghion, Bloom, Blundell, Griffith, and Howitt (2005) for these firms with existing assets
with high asset tangibility, our broader results show that this outcome is not observed in all
situations. In particular, the sample-wide results strongly support that innovative activities
are decreased when competitive shocks arrive. These different results in subsamples of firms
with existing assets with high asset tangibility helps to resolve disagreement in the literature
regarding the impact of foreign competition on domestic innovative activities. These results
also reinforce the importance of initial conditions such as asset composition in moderating
the incentives to increase or decrease innovation.
6 Conclusions
We examine the impact of Chinese innovation competition on U.S. firm R&D and patenting
activity. We use Chinese province-level data on internet penetration and geographic industry
agglomeration data to identify variation in the capacity of Chinese firms to challenge U.S.
firms on the knowledge-centric margin of innovation production. Validation tests support
for this interpretation of internet penetration. Higher internet penetration predicts higher
web traffic from China specifically accessing information about the impacted U.S. firms,
and textual analysis of SEC filings indicates that impacted U.S. firms complain more about
Chinese competition, especially regarding intellectual property. Placebo tests help mitigate
concerns that Chinese internet penetration is influenced by unobserved industry conditions.
Our main conclusion is that increased intellectual property competition has a strong
and robust negative impact on U.S. firm R&D spending, realized patents, and subsequent
long-run sales growth. At the same time, Chinese firms increase their patenting activity
30
specifically in the area of the afflicted U.S. firms. These results indicate a crowding-out
effect as the foreign rivals capture a fraction of the rents of innovation. The results are
consistent with higher internet penetration decreasing the cost of obtaining information for
competing firms. The magnitude of these results increases for industries that are strategically
favored by the Chinese government, but remain significant even for non-favored industries.
Our results regarding competition in innovation are distinct from earlier findings relating
to competition from existing products. Both competitive margins are independently sig-
nificant and is important at different points in time. Competition in existing products is
most important following China’s 2001 entry into the WTO, and competition in innovation
production is most important later following increased internet penetration in China.
Overall, our results help to reconcile disagreement in the literature regarding whether
foreign competition leads to increases or decreases in domestic firm innovation. Given the
importance of these issues in political and regulatory circles, we believe more work examining
multiple competitive margins and potential intellectual property theft would be invaluable.
31
References
Aghion, Philippe, Nicholas Bloom, Richard Blundell, Rachel Griffith, and Peter Howitt, 2005, Competitionand innovation: an inverted u relationship, Quarterly Journal of Economics 120, 701–28.
Autor, David, David Dorn, Gordon H Hanson, Gary Pisano, and Pian Shu, forthcoming, Foreign competitionand domestic innovation: Evidence from us patents.”, American Economic Review: Insights.
Bena, Jan, and Kai Li, 2014, Corporate innovations and mergers and acquisitions, Journal of Finance 69,1923–1960.
Bloom, Nicholas, Mirko Draca, and John Van Reenen, 2016, Trade induced technical change? the impact ofchinese imports on innovation, IT and productivity, Review of Economics Studies 83, 87–117.
Duranton, Gilles, and Henry G Overman, 2005, Testing for localization using micro-geographic data, TheReview of Economic Studies 72, 1077–1106.
, 2008, Exploring the detailed location patterns of uk manufacturing industries using microgeographicdata, Journal of Regional Science 48, 213–243.
Ellison, Glenn, and Edward L Glaeser, 1997, Geographic concentration in us manufacturing industries: adartboard approach, Journal of political economy 105, 889–927.
Florence, Philip Sargant, 1948, Investment, location, and size of plant . vol. 7 (CUP Archive).
Fuchs, Victor R, 1962, The determinants of the redistribution of manufacturing in the united states since1929, Review of Economics and Statistics 44, 167–177.
Hoberg, Gerard, and S Katie Moon, 2017, Offshore activities and financial vs operational hedging, Journalof Financial Economics 125, 217–244.
, 2019, The offshoring return premium, Management Science 65, 2876–2899.
Hoberg, Gerard, and Gordon Phillips, 2006, Real and financial industry booms and busts, Working Paper,University of Maryland.
Hombert, Johan, and Adrien Matray, 2018, Can innovation help us manufacturing firms escape importcompetition from china?, The Journal of Finance 80, 2003–2039.
Hong, Xiangjun, Minwen Li, and Gordon Phillips, 2020, Influence activities and regulating chinese acquisi-tions, Working paper.
Hoover, Edgar M, 1948, Location of economic activity (McGraw-Hill Book Company, Inc., New York).
Kogan, Leonid, Dimtris Papanikolaou, Amit Seru, and Noah Stoffman, 2016, Technological innovation,resource allocation and growth, Quarterly Journal of Economics forthcoming.
Koh, Ping-Sheng, and David Reeb, 2015, Missing r&d, Journal of Accounting and Economics pp. 73–94.
Krugman, Paul R, 1993, Geography and trade (MIT press).
Lee, Charles M C, Paul Ma, and Charles C Y Wang, 2015, Search-based peer firms: Aggregating investorperceptions through internet co-searches, Journal of Financial Economics 116, 410–431.
Phillips, Gordon M., and Alexei Zhdanov, 2013, R&d and the incentives from merger and acquisition activity,Review of Financial Studies 34-78, 189–238.
32
Reinganum, Jennifer F, 1989, The timing of innovation: Research, development, and diffusion, Handbook ofindustrial organization 1, 849–908.
Roberts, Michael R, and Toni M Whited, 2013, Endogeneity in empirical corporate finance1, in Handbookof the Economics of Financevol. 2 . pp. 493–572 (Elsevier).
We first calculate the mean value of each variables for each firm, and the table shows the summary statistics of thefirm-averages. Detailed variable definitions can be found in Table A1
Table 3: EDGAR searches and Chinese internet penetration
The table displays OLS regressions in which the dependent variable is the number of EDGAR searches scaled by sales. Forease of interpretation, we standardize this variable to have unit variance in each year. Column (1) tabulates EDGAR searcheswhose IP addresses are from China; Column (2) tabulates European IP addresses, Column (3) counts Japanese IP addresses,and Column (4) counts Canadian and Mexican IP addresses. Following Lee, Ma, and Wang (2015), we exclude EDGARsearches by web crawlers. All RHS variables are also standardized to have unit variance for ease of interpretation. The sampleincludes all Compustat firms from 2004 to 2015 with available 10K filings on the EDGAR system as the EDGAR server logstarts in February of 2003. We exclude all observations where the total assets or sales are smaller than one million dollars.Robust standard errors clustered by firms are reported in the parentheses. Detailed definitions of the variables can be found inTable A1 in the Appendix. Coefficients marked with ***, **, and * are significant at the 1%, 5%, and 10% levels, respectively.
Firm FE Y Y Y YYear FE Y Y Y YN 48,808 48,808 48,808 48,808
36
Table 4: Competition complaints and Chinese internet penetration
The table displays OLS regressions in which the dependent variables are textual measures of competition complaints in 10Kfilings. We search for four types of complaints in the 10K filings. CNComp measures competition in general; CNCompHimeasures competition with high intensity; CNIntComp measures intellectual property competition; CNIntTheft measuresintellectual property theft. All these competition measures are China-specific, meaning the words ”China” or ”Chinese”appear in the the same paragraph as the competition complaint phrases. We exclude instances if other countries are in thesame paragraph to ensure the competition discussion is truly about China. More detailed variable construction procedurescan be found in Table A1 in the Appendix. In Columns (1), (3), (5), and (7), the dependent variables are the number ofparagraphs containing the above search instances divided by the total number of paragraphs of the 10K filing. In Columns(2), (4), (6), and (8), the dependent variables are dummies that equal to 1 if we found any of the phrases in the search. Thekey independent variable CNInternet is the Chinese internet penetration ratio. All independent variables, except forlog(10kSize), are one-year lagged relative to the dependent variables. All the variables are normalized by their standarddeviations for easier interpretation. The sample covers all Compustat firms from 2001 to 2015 with 10K filings. We exclude allobservations where the total asset or sales are smaller than one million dollars. Robust standard errors clustered by firms arereported in the parentheses. Detailed definitions of the variables can be found in Table A1 in the Appendix. Coefficientsmarked with ***, **, and * are significant at the 1%, 5%, and 10% levels, respectively.
Firm FE Y Y Y Y Y Y Y YYear FE Y Y Y Y Y Y Y YN 62,892 62,892 62,892 62,892 62,892 62,892 62,892 62,892
37
Table 5: Placebo tests - Competition from other countries and Chinese internet penetration
The table displays OLS regressions in which the dependent variables are textual measures of competition complaints from10K filings. The dependent variables are constructed in a similar way as in Table 4. However, instead of measuringChina-related competition complaints, we now search for competition complaints about other regions of the world. Morespecifically, Columns (1) - (2) report searches using European Union countries, Column (3) - (4) using Japan, and Columns(5)-(6) using Canada and Mexico. All the dependent variables are the count of matched paragraphs divided by the totalnumber of paragraphs in the 10K filings. The key independent variable CNInternet is the Chinese internet penetration ratio.All independent variables, except for log(10kSize), are one-year lagged relative to the dependent variables. All the variablesare normalized by their standard deviations for easier interpretation. The sample covers all Compustat firms from 2001 to2015 with 10K filings. We exclude all observations where the total asset or the sales are smaller than one million dollars.Robust standard errors clustered by firms are reported in the parentheses. Detailed definitions of the variables can be found inTable A1 in the Appendix. Coefficients marked with ***, **, and * are significant at the 1%, 5%, and 10% levels, respectively.
Firm FE Y Y Y Y Y YYear FE Y Y Y Y Y YN 62,892 62,892 62,892 62,892 62,892 62,892
38
Table 6: U.S. Firm Innovation activities and Chinese internet penetration
The table displays OLS regressions in which the dependent variables are U.S. firms’ innovation activities. The dependentvariable in Columns (1) - (3) is the R&D expenses over sales. For missing R&D, we follow the Koh and Reeb (2015) andreplace the missing with industry average if the firm files for any patent patents applications in the past three years (includingthe current year), and 0 otherwise. The dependent variables are measures from 1, 2, or 3 years in the future. Note all thevariables are normalized by the sales from year t. The dependent variable in Columns (4) - (6) is the total number of patentapplications each year (by filing date) divided by sales. The patent data comes from Google Patents, and we match thepatents to Compustat firms using the links from Kogan, Papanikolaou, Seru, and Stoffman (2016). The dependent variablesare measures from 1, 2, or 3 years in the future. The key independent variable CNInternet is the Chinese internet penetrationratio. All independent variables are one-year lagged relative to the dependent variables. All the variables are normalized bytheir standard deviations for easier interpretation. The sample covers all Compustat firms from 2003 to 2015. We exclude allobservations where the total asset or the sales are smaller than one million dollars. Robust standard errors clustered by firmsare reported in the parentheses. Detailed definitions of the variables can be found in Table A1 in the Appendix. Coefficientsmarked with ***, **, and * are significant at the 1%, 5%, and 10% levels, respectively.
Firm FE Y Y Y Y Y YYear FE Y Y Y Y Y YN 62,738 54,626 47,413 62,738 54,626 47,413
39
Table 7: Competition in Innovation vs. Existing Products
This table compares the competition in innovation with the product market competition. Panel A shows our main tests. Thekey new independent variable, CNImport, is the import penetration ratio from China, defined for each 3-digit SIC industries.The dependent variables in Columns (1)-(4) are U.S. firm R&D expenses divided by the sales in the previous year, and thedependent variables in Columns (5)-(8) are the number of U.S. firm patents dividend by the sales in the previous years.Columns (1)-(3) and (5)-(7) include observations from 2001-2007, and Columns (4) and (8) use the full sample period(2001-2016) from our paper. The sample construction follows the same procedure as in previous tables. We exclude allobservations where the total asset or the sales are smaller than one million dollars. In Panel B, we test the effects of onlyCNImport on innovation activities. The dependent variables are the same as in Panel A. Columns (1), and (3) useobservations from 1997-2007, while the other column use the full sample in our paper (2001-2016). All independent variablesare one-year lagged relative to the dependent variables, and all the variables are normalized by their standard deviations foreasier interpretation. Robust standard errors clustered by firms are reported in the parentheses. Detailed definitions of thevariables can be found in Table A1 in the Appendix. Coefficients marked with ***, **, and * are significant at the 1%, 5%,and 10% levels, respectively.
Panel A: Competition in Innovation vs. Existing Products
Firm FE Y Y Y Y Y Y Y YYear FE Y Y Y Y Y Y Y YN 32,766 32,539 32,539 62,248 32,766 32,539 32,539 62,248
Panel B: Competition in Existing Products
XRD/Sales NPatents/Sales
1997-2007 2001 - 2016 1997-2007 2001 - 2016
(1) (2) (3) (4)
CNImport −0.035∗∗∗ −0.015∗∗ −0.027∗ −0.022∗
(0.012) (0.007) (0.014) (0.012)
Size −0.233∗∗∗ −0.031 −0.145∗∗∗ −0.065∗∗
(0.036) (0.026) (0.042) (0.027)
Firm FE Y Y Y YYear FE Y Y Y YN 46,198 74,330 46,198 74,330
40
Table 8: U.S. Innovation activities and Chinese internet penetration - Poisson Regression
The table displays poisson regressions in which the dependent variables are U.S. firms’ innovation activities. The dependentvariable in Columns (1) - (3) is the R&D expenses over sales. For missing R&D, we follow the Koh and Reeb (2015) andreplace the missing with industry average if the firm files for any patent patents applications in the past three years (includingthe current year), and 0 otherwise. The dependent variables are measures from 1, 2, or 3 years in the future. The dependentvariable in Columns (4) - (6) is the total number of patent applications each year (by filing date) dividend by sales. Thepatent data comes from Google Patents, and we match the patents to Compustat firms using the links from Kogan,Papanikolaou, Seru, and Stoffman (2016). The dependent variables are measures from 1, 2, or 3 years in the future. The keyindependent variable CNInternet is the Chinese internet penetration ratio. All independent variables are one-year laggedrelative to the dependent variables. All the variables are normalized by their standard deviations for easier interpretation.The sample covers all Compustat firms from 2003 to 2015. We exclude all observations where the total asset or the sales aresmaller than one million dollars. Robust standard errors clustered by firms are reported in the parentheses. Detaileddefinitions of the variables can be found in Table A1 in the Appendix. Coefficients marked with ***, **, and * are significantat the 1%, 5%, and 10% levels, respectively.
Year FE Y Y Y Y Y YN 60,689 52,790 45,834 60,689 52,790 45,834
41
Tab
le9:
Pat
ent
cita
tion
san
dC
hin
ese
inte
rnet
pen
etra
tion
Th
eta
ble
dis
pla
ys
OL
Sre
gre
ssio
ns
inw
hic
hth
ed
epen
den
tvari
ab
les
are
the
an
nu
al
nu
mb
erof
cita
tion
sby
Ch
ines
efi
rms
on
the
U.S
.fi
rm’s
exis
tin
gp
ate
nts
.In
Colu
mn
s(1
)-
(3),
for
each
firm
we
cou
nt
the
nu
mb
erof
new
pate
nts
that
have
cite
dth
eU
.S.
firm
’sex
isti
ng
pate
nts
inea
chyea
r.W
efu
rth
erre
qu
ire
the
firs
tass
ign
eeof
the
citi
ng
pate
nt
isa
Ch
ines
eco
mp
any,
an
dth
ep
ate
nt
isfi
led
inth
eU
Sw
ith
US
PT
O.
Th
ed
epen
den
tvari
ab
les
inC
olu
mn
s(1
)-
(3)
are
the
tota
lco
unt
nu
mb
er,
PatC
iteU
SCN
,d
ivid
edby
sale
sin
the
nex
tth
ree
yea
rs,
resp
ecti
vel
y.In
Colu
mn
s(4
)-
(6),
we
furt
her
com
pare
PatC
iteU
SCN
toth
enu
mb
erof
cita
tion
sfr
om
new
pate
nts
wh
ich
are
file
dw
ith
US
PT
Oan
dass
ign
edto
US
firm
s.T
he
dep
end
ent
vari
ab
les
inC
olu
mn
s(4
)-
(6)
are
PatC
iteU
SCN
/(P
atC
iteU
SCN
+P
atC
iteU
SUS
+1)
inth
en
ext
thre
eyea
rs,
resp
ecti
vel
y.In
Colu
mn
s(7
)-
(9),
PatC
iteC
Nco
unts
the
nu
mb
erof
new
pate
nts
file
dw
ith
Ch
ines
eP
ate
nt
Offi
ce(S
IPO
)th
at
have
cite
dth
efi
rm’s
exis
tin
gpate
nts
.W
eex
clu
de
pate
nts
that
are
file
din
SIP
Ob
ut
are
ass
ign
edto
US
com
pan
ies.
InC
olu
mn
s(1
0)
-(1
2),
we
use
PatC
iteC
N/
(PatC
iteC
N+
PatC
iteU
S+
1)
as
the
dep
end
ent
vari
ab
les,
wh
ere
the
PatC
iteU
Sis
the
tota
lco
unts
of
new
citi
ng
pate
nts
file
din
the
US
.T
he
key
ind
epen
den
tvari
ab
leC
NIn
tern
etis
the
Ch
ines
ein
tern
etp
enet
rati
on
rati
o.
All
ind
epen
den
tvari
ab
les
are
on
e-yea
rla
gged
rela
tive
toth
ed
epen
den
tvari
ab
les.
All
the
vari
ab
les
are
norm
alize
dby
thei
rst
an
dard
dev
iati
on
sfo
rea
sier
inte
rpre
tati
on
.T
he
sam
ple
cover
sall
Com
pu
stat
firm
sfr
om
2003
to2015.
We
excl
ud
eall
ob
serv
ati
on
sw
her
eth
eto
tal
ass
etor
the
sale
sare
smaller
than
on
em
illion
dollars
.R
ob
ust
stan
dard
erro
rscl
ust
ered
by
firm
sare
rep
ort
edin
the
pare
nth
eses
.D
etailed
defi
nit
ion
sof
the
vari
ab
les
can
be
fou
nd
inT
ab
leA
1in
the
Ap
pen
dix
.C
oeffi
cien
tsm
ark
edw
ith
***,
**,
an
d*
are
sign
ifica
nt
at
the
1%
,5%
,an
d10%
level
s,re
spec
tivel
y.
PatC
iteUSC
NSales
PatC
iteUSC
NPatC
iteUSC
N+PatC
iteUSU
S+1
PatC
iteCN
Sales
PatC
iteCN
PatC
iteCN
+PatC
iteUS+1
t+1
t+2
t+3
t+1
t+2
t+3
t+1
t+2
t+3
t+1
t+2
t+3
(1)
(2)
(3)
(4)
(5)
(6)
(7)
(8)
(9)
(10)
(11)
(12)
CN
Inte
rnet
0.2
28∗∗
∗0.1
75∗∗
∗0.1
55∗∗
∗0.2
13∗∗
∗0.2
23∗∗
∗0.1
96∗∗
∗0.2
18∗∗
∗0.1
39∗∗
∗0.1
07∗∗
∗0.2
97∗∗
∗0.2
71∗∗
∗0.2
71∗∗
∗
(0.0
49)
(0.0
46)
(0.0
47)
(0.0
41)
(0.0
42)
(0.0
44)
(0.0
40)
(0.0
37)
(0.0
40)
(0.0
43)
(0.0
46)
(0.0
50)
CN
Sale
sGR
−0.0
004
0.0
03
0.0
07∗
0.0
01
0.0
06
0.0
15∗∗
∗0.0
01
0.0
07∗∗
0.0
12∗∗
∗−
0.0
07∗
0.0
02
0.0
11∗∗
(0.0
03)
(0.0
03)
(0.0
04)
(0.0
04)
(0.0
04)
(0.0
05)
(0.0
03)
(0.0
03)
(0.0
03)
(0.0
04)
(0.0
04)
(0.0
04)
log(A
ge
+1)
0.0
53∗∗
∗0.0
62∗∗
∗0.0
29
−0.0
62∗∗
∗−
0.0
47∗∗
−0.0
30
−0.0
02
0.0
04
0.0
03
−0.4
24∗∗
∗−
0.4
03∗∗
∗−
0.3
84∗∗
∗
(0.0
20)
(0.0
19)
(0.0
20)
(0.0
20)
(0.0
21)
(0.0
22)
(0.0
18)
(0.0
18)
(0.0
19)
(0.0
27)
(0.0
28)
(0.0
28)
log(T
A)
−0.2
80∗∗
∗−
0.2
66∗∗
∗−
0.2
13∗∗
∗−
0.1
07∗∗
∗−
0.0
92∗∗
∗−
0.0
81∗∗
∗−
0.3
28∗∗
∗−
0.3
22∗∗
∗−
0.2
86∗∗
∗−
0.0
25
−0.0
45
−0.0
49
(0.0
33)
(0.0
35)
(0.0
35)
(0.0
26)
(0.0
28)
(0.0
30)
(0.0
33)
(0.0
34)
(0.0
37)
(0.0
28)
(0.0
29)
(0.0
31)
Ind
ust
ryQ
−0.0
51∗∗
∗−
0.0
42∗∗
∗−
0.0
52∗∗
∗−
0.0
44∗∗
∗−
0.0
42∗∗
∗−
0.0
37∗∗
∗−
0.0
25∗∗
−0.0
30∗∗
∗−
0.0
23∗
−0.0
02
−0.0
05
−0.0
04
(0.0
11)
(0.0
13)
(0.0
14)
(0.0
08)
(0.0
09)
(0.0
10)
(0.0
12)
(0.0
11)
(0.0
13)
(0.0
07)
(0.0
08)
(0.0
08)
TN
IC−
0.0
25∗∗
∗−
0.0
14
−0.0
04
−0.0
12
−0.0
04
−0.0
07
−0.0
003
−0.0
03
−0.0
07
0.0
15∗∗
0.0
15∗∗
0.0
18∗∗
(0.0
09)
(0.0
09)
(0.0
09)
(0.0
08)
(0.0
07)
(0.0
08)
(0.0
09)
(0.0
08)
(0.0
08)
(0.0
08)
(0.0
08)
(0.0
07)
JV
−0.0
12∗∗
∗−
0.0
03
0.0
04
−0.0
02
−0.0
02
−0.0
02
−0.0
08∗
−0.0
05
−0.0
08
0.0
06
0.0
01
−0.0
09
(0.0
04)
(0.0
04)
(0.0
04)
(0.0
07)
(0.0
07)
(0.0
07)
(0.0
05)
(0.0
05)
(0.0
05)
(0.0
10)
(0.0
10)
(0.0
10)
Fir
mF
EY
YY
YY
YY
YY
YY
YY
ear
FE
YY
YY
YY
YY
YY
YY
N62,8
31
54,6
26
47,4
13
62,8
31
54,7
61
47,5
81
62,8
31
54,6
26
47,4
13
62,8
31
54,7
61
47,5
81
42
Tab
le10
:P
lace
bo
test
s-
pat
ent
cita
tion
sfr
omot
her
counti
esan
dC
hin
ese
inte
rnet
pen
etra
tion
Th
eta
ble
dis
pla
ys
OL
Sre
gre
ssio
ns
inw
hic
hth
ed
epen
den
tvari
ab
les
are
the
an
nu
al
nu
mb
erof
cita
tion
sby
firm
sin
oth
erec
onom
ies
on
firm
’sex
isti
ng
pate
nts
.W
ed
efin
eth
ed
epen
den
tvari
ab
les
as
inth
eC
olu
mn
s(1
)-(3
)of
Table
9.
PatC
iteU
SJP
itare
the
nu
mb
erof
pate
nts
,w
hic
hare
file
dby
Jap
an
ese
firm
sw
ith
US
PT
Oin
yea
rt,
that
cite
firm
i’s
exis
tin
gp
ate
nts
.S
imilarl
y,P
atC
iteU
SN
Ait
are
the
pate
nt
cou
nts
file
dby
firm
sfr
om
Canad
aor
Mex
ica,
an
dP
atC
iteU
SEU
it,
the
firm
sfr
om
Eu
rop
ean
Un
ion
.T
he
key
ind
epen
den
tvari
ab
leC
NIn
tern
etis
the
Ch
ines
ein
tern
etp
enet
rati
on
rati
o.
All
ind
epen
den
tvari
ab
les
are
on
e-yea
rla
gged
rela
tive
toth
ed
epen
den
tvari
ab
les.
All
the
vari
ab
les
are
norm
alize
dby
thei
rst
an
dard
dev
iati
on
sfo
rea
sier
inte
rpre
tati
on
.T
he
sam
ple
cover
sall
Com
pu
stat
firm
sfr
om
2003
to2015.
We
excl
ud
eall
ob
serv
ati
on
sw
her
eth
eto
tal
ass
etor
the
sale
sare
smaller
than
on
em
illion
dollars
.R
ob
ust
stan
dard
erro
rscl
ust
ered
by
firm
sare
rep
ort
edin
the
pare
nth
eses
.D
etailed
defi
nit
ion
sof
the
vari
ab
les
can
be
fou
nd
inT
ab
leA
1in
the
Ap
pen
dix
.C
oeffi
cien
tsm
ark
edw
ith
***,
**,
an
d*
are
sign
ifica
nt
at
the
1%
,5%
,an
d10%
level
s,re
spec
tivel
y.
PatC
iteUSJP
Sales
PatC
iteUSN
ASales
PatC
iteUSE
USales
t+1
t+2
t+3
t+1
t+2
t+3
t+1
t+2
t+3
(1)
(2)
(3)
(4)
(5)
(6)
(7)
(8)
(9)
CN
Inte
rnet
−0.0
17
−0.0
48
−0.0
66
0.0
26
0.0
53
0.0
25
−0.0
06
−0.0
39
−0.0
38
(0.0
40)
(0.0
42)
(0.0
46)
(0.0
40)
(0.0
39)
(0.0
44)
(0.0
40)
(0.0
40)
(0.0
45)
CN
Sale
sGR
−0.0
01
0.0
05∗∗
−0.0
03
−0.0
04∗
0.0
02
−0.0
02
−0.0
003
0.0
02
0.0
0004
(0.0
02)
(0.0
02)
(0.0
03)
(0.0
02)
(0.0
03)
(0.0
03)
(0.0
02)
(0.0
02)
(0.0
02)
log(A
ge
+1)
0.0
71∗∗
∗0.0
34∗
0.0
27
0.0
77∗∗
∗0.0
66∗∗
∗0.0
57∗∗
∗0.0
67∗∗
∗0.0
11
0.0
27
(0.0
16)
(0.0
17)
(0.0
19)
(0.0
17)
(0.0
18)
(0.0
19)
(0.0
15)
(0.0
17)
(0.0
17)
log(T
A)
−0.1
87∗∗
∗−
0.1
90∗∗
∗−
0.0
30
−0.2
07∗∗
∗−
0.2
17∗∗
∗−
0.1
01∗∗
∗−
0.1
93∗∗
∗−
0.1
71∗∗
∗−
0.0
56∗
(0.0
29)
(0.0
34)
(0.0
35)
(0.0
29)
(0.0
32)
(0.0
30)
(0.0
30)
(0.0
31)
(0.0
32)
Ind
ust
ryQ
−0.0
29∗∗
∗0.0
04
−0.0
05
−0.0
22
0.0
01
−0.0
03
−0.0
25∗∗
0.0
08
−0.0
03
(0.0
11)
(0.0
12)
(0.0
12)
(0.0
13)
(0.0
12)
(0.0
14)
(0.0
12)
(0.0
13)
(0.0
13)
TN
IC0.0
16∗∗
0.0
26∗∗
∗0.0
02
−0.0
15∗
−0.0
09
−0.0
13
0.0
01
0.0
25∗∗
∗−
0.0
001
(0.0
08)
(0.0
09)
(0.0
09)
(0.0
08)
(0.0
08)
(0.0
09)
(0.0
08)
(0.0
08)
(0.0
08)
JV
−0.0
05
0.0
02
0.0
01
−0.0
02
−0.0
01
−0.0
01
−0.0
05
−0.0
01
−0.0
01
(0.0
04)
(0.0
04)
(0.0
04)
(0.0
04)
(0.0
04)
(0.0
04)
(0.0
03)
(0.0
03)
(0.0
03)
Fir
mF
EY
YY
YY
YY
YY
Yea
rF
EY
YY
YY
YY
YY
N62,8
31
54,6
26
47,5
81
62,8
31
54,6
26
47,5
81
62,8
31
54,6
26
47,5
81
43
Table 11: U.S. Firm Long-term Performance
The table displays OLS regressions in which the dependent variables are the sales growth of U.S. firms. The dependentvariable is the change of log(Sales) from the previous year. The key independent variable CNInternet is the Chinese internetpenetration ratio. All independent variables are one-year lagged relative to the dependent variables. All the variables arenormalized by their standard deviations for easier interpretation. The sample covers all Compustat firms from 2003 to 2015.We exclude all observations where the total asset or the sales are smaller than one million dollars. Robust standard errorsclustered by firms are reported in the parentheses. Detailed definitions of the variables can be found in Table A1 in theAppendix. Coefficients marked with ***, **, and * are significant at the 1%, 5%, and 10% levels, respectively.
Firm FE Y Y Y Y YYear FE Y Y Y Y YN 62,251 54,344 47,250 40,908 35,188
44
Table 12: U.S. Firm Off-Shoring Acitivities
The table displays OLS regressions in which the dependent variable is a dummy variable indicating whether U.S. firmspurchase inputs from China (Columns 1 - 3) or sell outputs to China (Columns 4 - 6). To measure offshore purchases fromChina or the sale of output to China, we use the text-based offshore network data from Hoberg and Moon (2017) and Hobergand Moon (2019). These measures are based on 10-K filings and use proximity searches to examine the vocabulary within a15 word window surrounding each mention of the word China. The proximity search identifies words associated withpurchasing input or with selling output, allowing us to identify which U.S. public firms are engaged in each activity. Theoffshore input dummy is one if the firm mentions an instance of purchasing inputs from China at least once. The offshoreoutput variable is analogously based on whether the firm mentions an instance of selling output to China at least once. Thekey independent variable CNInternet is the Chinese internet penetration ratio. All independent variables are one-year laggedrelative to the dependent variables. All the variables are normalized by their standard deviations for easier interpretation.The sample covers all Compustat firms from 2003 to 2015. We exclude all observations where the total asset or the sales aresmaller than one million dollars. Robust standard errors clustered by firms are reported in the parentheses. Detaileddefinitions of the variables can be found in Table A1 in the Appendix. Coefficients marked with ***, **, and * are significantat the 1%, 5%, and 10% levels, respectively.
Firm FE Y Y Y Y Y YYear FE Y Y Y Y Y YN 65,219 56,657 49,097 65,219 56,657 49,097
45
Table 13: Subsample analysis - by Five Year Plans
This table re-estimates regressions in Table 4 and 6 with an additional variable, FYP, which equals to 1 if the industry was ofstrategic focus for development in China’s five year plans for the relevant five-year periods. We interact the FYP dummy withthe Chinese internet penetration variable. All independent variables are one-year lagged relative to the dependent variables.All the variables are normalized by their standard deviations for easier interpretation. The sample construction follows thesame procedure as in previous tables. We exclude all observations where the total asset or the sales are smaller than onemillion dollars. Robust standard errors clustered by firms are reported in the parentheses. Detailed definitions of the variablescan be found in Table A1 in the Appendix. Coefficients marked with ***, **, and * are significant at the 1%, 5%, and 10%levels, respectively.
CNComp CNCompHi CNIntComp XRD/Sales NPatent/Sales
t+1 t+1 t+1 t+1 t+3 t+1 t+3
(1) (2) (3) (4) (5) (6) (7)
CNInternet x FYP −0.016 0.002 −0.034 −0.204∗∗∗ −0.298∗∗∗ −0.216∗∗∗ −0.242∗∗∗
Firm FE Y Y Y Y Y Y YYear FE Y Y Y Y Y Y YN 62,892 62,892 62,892 62,738 47,528 62,738 47,528
46
Table 14: Subsample analysis - by Asset Tangibility
This table re-estimates regressions in Table 4 and 6 with an additional variable, HighT, which equals to 1 if the U.S. firm’sasset tangibility is higher than the median asset tangibility in each year, and 0 otherwise. We interact the HighT dummy withthe Chinese internet penetration variable and test whether high- and low-asset tangibility firms have different reponses intheir innovation activities to Chinese competition. All independent variables are one-year lagged relative to the dependentvariables. All the variables are normalized by their standard deviations for easier interpretation. The sample constructionfollows the same procedure as in previous tables. We exclude all observations where the total asset or the sales are smallerthan one million dollars. Robust standard errors clustered by firms are reported in the parentheses. Detailed definitions of thevariables can be found in Table A1 in the Appendix. Coefficients marked with ***, **, and * are significant at the 1%, 5%,and 10% levels, respectively.
CNComp CNCompHi CNIntComp XRD/Sales NPatent/Sales
t+1 t+1 t+1 t+1 t+3 t+1 t+3
(1) (2) (3) (4) (5) (6) (7)
CNInternet x HighT 0.033∗∗ 0.026∗ 0.040∗∗ 0.063∗∗∗ 0.055∗∗∗ 0.047∗∗∗ 0.053∗∗∗
CNCompHi Dummy A dummy variable that equals to one if CNCompHi % is larger than 0, and 0
otherwise.
10-K Filing
CNIntComp % # of paragraphs that contain at least one words from the following word lists
divided by the total number of paragraphs of the 10-K filing. List 1: [China,
Chinese]; List 2: [compete, competition, competing]; List 3: [intellectual]; List
4: [property]
10-K Filing
CNIntComp
Dummy
A dummy variable that equals to one if CNIntComp % is larger than 0, and 0
otherwise.
10-K Filing
CNIntTheft % # of paragraphs that contain at least one words from the following word lists
divided by the total number of paragraphs of the 10-K filing. List 1: [China,
Chinese]; List 2: [infringe, theft, steal, stolen]; List 3: [intellectual property,
trade secret]
10-K Filing
CNIntTheft Dummy A dummy variable that equals to one if CNIntTheft % is larger than 0, and 0
otherwise.
10-K Filing
EUIntComp % # of paragraphs that contain at least one words from the following word lists
divided by the total number of paragraphs of the 10-K filing. List 1: [Europe,
European]; List 2: [compete, competition, competing]; List 3: [intellectual]; List
4: [property]
10-K Filing
EUIntTheft % # of paragraphs that contain at least one words from the following word lists
divided by the total number of paragraphs of the 10-K filing. List 1: [Europe,
European]; List 2: [infringe, theft, steal, stolen]; List 3: [intellectual property,
trade secret]
10-K Filing
JPIntComp % # of paragraphs that contain at least one words from the following word lists
divided by the total number of paragraphs of the 10-K filing. List 1: [Japan,
Japanese]; List 2: [compete, competition, competing]; List 3: [intellectual]; List
4: [property]
10-K Filing
Continued on next page
52
Table A1 – Continued from previous page
Variable Definition Source
JPIntTheft % # of paragraphs that contain at least one words from the following word lists
divided by the total number of paragraphs of the 10-K filing. List 1: [Japan,
Japanese]; List 2: [infringe, theft, steal, stolen]; List 3: [intellectual property,
trade secret]
10-K Filing
NAIntComp % # of paragraphs that contain at least one words from the following word lists
divided by the total number of paragraphs of the 10-K filing. List 1: [Mexico,
Mexican, Canada, Canadian]; List 2: [compete, competition, competing]; List
3: [intellectual]; List 4: [property]
10-K Filing
NAIntTheft % # of paragraphs that contain at least one words from the following word lists
divided by the total number of paragraphs of the 10-K filing. List 1: [Mexico,
Mexican, Canada, Canadian]; [infringe, theft, steal, stolen]; List 3: [intellectual
property, trade secret]
10-K Filing
XRD R&D expenses from Compustat. We replace the missing R&D expense ratio
(over sales) by the industry average if the firms has applied for any patents in
the past three years. We replace the other missing variables with 0.
Compustat
NPatent The number of patents that the firm applies in a year. For patents granted prior
to Nov. 1, 2010, we use the KPSS data; For patents granted after Nov. 1, 2010,
we use the patent data from Google patents.
Google Patent;
Kogan, Pa-
panikolaou, Seru,
and Stoffman
(2016)
PatCiteCN The total number of new patents that (1) are applied in SIPO (China Patent
Office), (2) assigned to a Chinese firm, and (3) cite any existing patents of the
firm
Google Patent
PatCiteUSCN The total number of new patents that (1) are applied in USPTO, (2) assigned
to a Chinese firm, and (3) cite any existing patents of the firm
Google Patent
PatCiteUSEU The total number of new patents that (1) are applied in USPTO, (2) assigned
to an European firm, and (3) cite any existing patents of the firm
Google Patent
PatCiteUSJP The total number of new patents that (1) are applied in USPTO, (2) assigned
to a Japanese firm, and (3) cite any existing patents of the firm
Google Patent
PatCiteUSNA The total number of new patents that (1) are applied in USPTO, (2) assigned
to a Mexican or Canadian firm, and (3) cite any existing patents of the firm
Google Patent
PatCiteUSUS The total number of new patents that (1) are applied in USPTO, (2) assigned
to an American firm, and (3) cite any existing patents of the firm
Google Patent
Age Number of years that the firm has been public Compustat
CNSalesGR The average sales growth of the Chinese public company of the same 2-digit
SIC industry
CSMAR; Capital
IQ
Industry Q Weighted average of peer firms’ market-to-book ratios. The weights are the
similarity scores from the TNIC network
Compustat;
Hoberg and
Phillips (2016)
TNIC Sum of the similarity scores in the TNIC network Hoberg and
Phillips (2016)
JV Joint venture intensity for each 3-digit SIC industry-year. It is calculated as:
for each 3-digit SIC industry-year, JV = sum of the sales of all firms that have
mentioned ”joint venture” in their 10K filings / sum of sales of all firms
Hoberg and
Phillips (2016);
Compustat
Sales Sales of the firm Compustat
TA Total asset of the firm Compustat
AssetTangibility property, plant and equipment over total assets Compustat
CNInternet Macro The variable is constructed similarly to CNInternet. Instead of using the weights
from public firms, we use the industry weights from the total assets informa-
tion from China Data Online. We hand-matched each industry to 2-digit SIC
industries.
CNNIC Reports;
China Data On-
line
Continued on next page
53
Table A1 – Continued from previous page
Variable Definition Source
CNInternet Top1 The variable is constructed similarly to CNInternet. Instead of using the value-
weighted measure using all the provinces whose weights are above 10%, we put
100% weight on the province with the highest total assets of the industry
CNNIC Reports;
Capital IQ; China
Data Online
54
Online Appendix: Not for publication
A. Robustness Checks
Table OA1: Robustness - Weights using China-A-share firms
The table shows that our results are robust to the construction of the internet penetration ratio. In particular, we restrict theuniverse of public firms to only A-share firms, or firms that are listed on the Shanghai or Shenzhen Stock Exchanges. Thedependent variables in Columns (1)-(3) are the same as in Table 4; the dependent variables in Columns (4) and (5) are thesame as in Table 6; the dependent variables in Columns (6) and (7) are the same as in Table 9. All dependent variables aremeasured in year t + 1, and the independent variables are measured in year t. All variables are standardized to have unitvariance for ease of interpretation. The sample includes all Compustat firms from 2001 to 2015 with available 10K filings onthe EDGAR system. We exclude all observations where the total assets or sales are smaller than one million dollars. Robuststandard errors clustered by firms are reported in the parentheses. Detailed definitions of the variables can be found in TableA1 in the Appendix. Coefficients marked with ***, **, and * are significant at the 1%, 5%, and 10% levels, respectively.
Firm FE Y Y Y Y Y Y YYear FE Y Y Y Y Y Y YN 62,892 62,892 62,892 62,738 62,738 62,831 62,831
55
Table OA2: Robustness - Top Internet Penetration Year
The table shows that our results are robust to the construction of the internet penetration ratio. Instead of using aweighted-average measure, we use the internet penetration ratio from the province-year where the province has the mostoutput for that industry. The dependent variables in Columns (1)-(3) are the same as in Table 4; the dependent variables inColumns (4) and (5) are the same as in Table 6; the dependent variables in Columns (6) and (7) are the same as in Table 9.All dependent variables are measured in year t + 1, and the independent variables are measured in year t. All variables arestandardized to have unit variance for ease of interpretation. The sample includes all Compustat firms from 2001 to 2015 withavailable 10K filings on the EDGAR system. We exclude all observations where the total assets or sales are smaller than onemillion dollars. Robust standard errors clustered by firms are reported in the parentheses. Detailed definitions of the variablescan be found in Table A1 in the Appendix. Coefficients marked with ***, **, and * are significant at the 1%, 5%, and 10%levels, respectively.
Firm FE Y Y Y Y Y Y YYear FE Y Y Y Y Y Y YN 62,892 62,892 62,892 62,738 62,738 62,831 62,831
56
Table OA3: Robustness - Excluding the Largest Industry in Each Province
The table excludes the largest industry in each province to examine if local government pressure or lobbying for this industryimpacts our results. The dependent variables in Columns (1)-(3) are the same as in Table 4; the dependent variables inColumns (4) and (5) are the same as in Table 6; the dependent variables in Columns (6) and (7) are the same as in Table 9.All dependent variables are measured in year t + 1, and the independent variables are measured in year t. All variables arestandardized to have unit variance for ease of interpretation. The sample includes all Compustat firms from 2001 to 2015 withavailable 10K filings on the EDGAR system. We exclude all observations where the total assets or sales are smaller than onemillion dollars. Robust standard errors clustered by firms are reported in the parentheses. Detailed definitions of the variablescan be found in Table A1 in the Appendix. Coefficients marked with ***, **, and * are significant at the 1%, 5%, and 10%levels, respectively.
Firm FE Y Y Y Y Y Y YYear FE Y Y Y Y Y Y YN 62,892 62,892 62,892 62,738 62,738 62,831 62,831
57
Table OA4: Robustness - Weights from Macro Data
The table shows that our results are robust to the construction of the internet penetration ratio. Instead of using the publicfirms’ data, we instead use the province-industry-level aggregate output to calculate the weights. The data is fromChinaDataOnline. The dependent variables in Columns (1)-(3) are the same as in Table 4; the dependent variables inColumns (4) and (5) are the same as in Table 6; the dependent variables in Columns (6) and (7) are the same as in Table 9.All dependent variables are measured in year t + 1, and the independent variables are measured in year t. All variables arestandardized to have unit variance for ease of interpretation. The sample includes all Compustat firms from 2001 to 2015 withavailable 10K filings on the EDGAR system. We exclude all observations where the total assets or sales are smaller than onemillion dollars. Robust standard errors clustered by firms are reported in the parentheses. Detailed definitions of the variablescan be found in Table A1 in the Appendix. Coefficients marked with ***, **, and * are significant at the 1%, 5%, and 10%levels, respectively.
Firm FE Y Y Y Y Y Y YYear FE Y Y Y Y Y Y YN 62,892 62,892 62,892 62,738 62,738 62,831 62,831
58
Table OA5: Robustness of Table 6 Excluding Zero R&D Firms
This table tests the robustness of Table 6 by using subsample excluding observations where XRD/Sales equals 0. Thedependent variable in Columns (1) - (3) is the R&D expenses over sales. For missing R&D, we follow the Koh and Reeb(2015) and replace the missing with industry average if the firm files for any patent patents applications in the past three years(including the current year), and 0 otherwise. The dependent variables are measures from 1, 2, or 3 years in the future. Noteall the variables are normalized by the sales from year t. The dependent variable in Columns (4) - (6) is the total number ofpatent applications each year (by filing date) divided by sales. The patent data comes from Google Patents, and we match thepatents to Compustat firms using the links from Kogan, Papanikolaou, Seru, and Stoffman (2016). The dependent variablesare measures from 1, 2, or 3 years in the future. The key independent variable CNInternet is the Chinese internet penetrationratio. All independent variables are one-year lagged relative to the dependent variables. All the variables are normalized bytheir standard deviations for easier interpretation. The sample covers all Compustat firms from 2001 to 2015. We exclude allobservations where the total asset or the sales are smaller than one million dollars. Robust standard errors clustered by firmsare reported in the parentheses. Detailed definitions of the variables can be found in Table A1 in the Appendix.
Firm FE Y Y Y Y Y YYear FE Y Y Y Y Y YN 28,177 24,574 21,360 28,177 24,574 21,360
59
Table OA6: Robustness - Excluding joint ventures
The table shows that our results are robust to the possible biases from joint ventures. We exclude firms that have everreported joint ventures with China in their 10-K filings. The dependent variables in Columns (1)-(3) are the same as in Table4; the dependent variables in Columns (4) and (5) are the same as in Table 6; the dependent variables in Columns (6) and (7)are the same as in Table 9. All dependent variables are measured in year t + 1, and the independent variables are measured inyear t. All variables are standardized to have unit variance for ease of interpretation. The sample includes all Compustatfirms from 2001 to 2015 with available 10K filings on the EDGAR system. We exclude all observations where the total assetsor sales are smaller than one million dollars. Robust standard errors clustered by firms are reported in the parentheses.Detailed definitions of the variables can be found in Table A1 in the Appendix. Coefficients marked with ***, **, and * aresignificant at the 1%, 5%, and 10% levels, respectively.
Firm FE Y Y Y Y Y Y YYear FE Y Y Y Y Y Y YN 56,198 56,198 56,198 55,900 55,900 55,993 55,993
60
Table OA7: Innovation Activities of Firms in Targeted Industries in Five Year Plans
The table shows how our variables of interests differ for five-year plans-targeted versus non-targeted industries. The keyindependent variable is FYP, which equals to 1 if the industry was of strategic focus for development in China’s five yearplans for the relevant five-year periods. The dependent variables in Columns (1)-(3) are the same as in Table 4; the dependentvariables in Columns (4) and (5) are the same as in Table 6; the dependent variables in Columns (6) and (7) are the same asin Table 9. All dependent variables are measured in year t + 1, and the independent variables are measured in year t. Allvariables are standardized to have unit variance for ease of interpretation. The sample includes all Compustat firms from 2001to 2015 with available 10K filings on the EDGAR system. We exclude all observations where the total assets or sales aresmaller than one million dollars. Robust standard errors clustered by firms are reported in the parentheses. Detaileddefinitions of the variables can be found in Table A1 in the Appendix. Coefficients marked with ***, **, and * are significantat the 1%, 5%, and 10% levels, respectively.
Firm FE Y Y Y Y Y Y YYear FE Y Y Y Y Y Y YN 62,892 62,892 62,892 62,738 62,738 62,831 62,831
61
Table OA8: Robustness - Clustering Standard Errors by Industry x Year
The table shows the regression results with standard errors clustered by 3-digit SICxYear. The dependent variables inColumns (1)-(3) are the same as in Table 4; the dependent variables in Columns (4) and (5) are the same as in Table 6; thedependent variables in Columns (6) and (7) are the same as in Table 9. All dependent variables are measured in year t + 1,and the independent variables are measured in year t. All variables are standardized to have unit variance for ease ofinterpretation. The sample includes all Compustat firms from 2001 to 2015 with available 10K filings on the EDGAR system.We exclude all observations where the total assets or sales are smaller than one million dollars. Robust standard errorsclustered by 3-digit SIC Industry x Year are reported in the parentheses. Detailed definitions of the variables can be found inTable A1 in the Appendix. Coefficients marked with ***, **, and * are significant at the 1%, 5%, and 10% levels, respectively.
Firm FE Y Y Y Y Y Y YYear FE Y Y Y Y Y Y YN 62,892 62,892 62,892 62,738 62,738 62,831 62,831
62
Table OA9: Robustness of Table 6 Not Filling Missing R&D
This table tests the robustness of Table 6 by not filling missing R&D as in Koh and Reeb (2015). The dependent variable inColumns (1) - (3) is the R&D expenses over sales. The dependent variables are measures from 1, 2, or 3 years in the future.Note all the variables are normalized by the sales from year t. The key independent variable CNInternet is the Chineseinternet penetration ratio. All independent variables are one-year lagged relative to the dependent variables. All the variablesare normalized by their standard deviations for easier interpretation. The sample covers all Compustat firms from 2001 to2015. We exclude all observations where the total asset or the sales are smaller than one million dollars. Robust standarderrors clustered by firms are reported in the parentheses. Detailed definitions of the variables can be found in Table A1 in theAppendix.
Because our primary focus is on competition in the market for innovation, it also follows
that our predictions should be particularly strong for U.S. firms that have stronger growth
options, as innovation is a large fraction of firm value for these firms. Analogously, firms
with few growth options are likely more impacted by competition in the market for existing
products.
We first examine whether our results are stronger for U.S. firms with high versus low
growth options as measured by each firm’s market-to-book ratio. To do so, we start with the
models we ran in prior sections of this study, but add an interaction between the internet
dummy and an additional dummy variable, HighQ, which equals to one if the firm has an
above-median industry market-to-book ratio in the prior year. We also include the HighQ
dummy itself in the model. The dependent variables include the complaint measures from
Table 4, and the innovation measures from Table 6. Table OA10 shows the results.
Columns (1) to (3) show that higher market-to-book firms complain more about competi-
tion from China, and complain more in the context of paragraphs discussing innovation. As
documented in the existing literature, these high valuation firms tend to have more growth
options and are more innovative. As a result, their overall valuations load highly on their
ability to control markets for innovation in their sectors, and direct competition from Chinese
peers on the margin of innovation production should be particularly relevant. The coeffi-
cient of the interaction term is generally one-third as large as the coefficient of the internet
penetration level alone, suggesting an economically large difference between the high Q and
low Q firms.
We also find that these high value firms have innovation activities that are also more
sensitive to Chinese internet penetration. As shown in Columns (4) to (7), these high
market-to-book ratio firms more severely scale back on their R&D expenses and patenting
activities when internet penetration is high. The coefficient of the interaction term for R&D
in Column (4) is -0.061, almost half the size of the coefficient of the internet penetration
variable itself, which is -0.150. The effect is also economically large for patenting activities.
We conclude that our results for competition in the market for innovation are stronger
for U.S. firms that that have more valuable growth options and thus more potential exposure
to competitive threats that are uniquely in the market for innovation production.
64
Table OA10: Subsample analysis - by Q
This table re-estimates regressions in Table 4 and 6 with an additional variable, HighQ, which equals to 1 if the U.S. firm’s Qis higher than the median Q in each year, and 0 otherwise. We interact the HighQ dummy with the Chinese internetpenetration variable and test whether high- and low-Q firms have different responses in their innovation activities to Chinesecompetition. All independent variables are one-year lagged relative to the dependent variables. All the variables arenormalized by their standard deviations for easier interpretation. The sample construction follows the same procedure as inprevious tables. We exclude all observations where the total asset or the sales are smaller than one million dollars. Robuststandard errors clustered by firms are reported in the parentheses. Detailed definitions of the variables can be found in TableA1 in the Appendix. Coefficients marked with ***, **, and * are significant at the 1%, 5%, and 10% levels, respectively.
CNComp CNCompHi CNIntComp XRD/Sales NPatent/Sales
t+1 t+1 t+1 t+1 t+3 t+1 t+3
(1) (2) (3) (4) (5) (6) (7)
CNInternet x HighQ 0.030∗∗ 0.026∗∗ 0.021 −0.062∗∗∗ −0.064∗∗∗ −0.047∗∗∗ −0.058∗∗∗
Firm FE Y Y Y Y Y Y YYear FE Y Y Y Y Y Y YN 62,892 62,892 62,892 62,738 47,413 62,738 47,413
65
C. China import penetration
In this section, we explain how we construct the import penetration variable from China. The
variable is constructed by combining several databases. We obtain gross output by industry
from the BEA’s website. We also obtain import and export data from Peter Schott’s website.
Formally, the import penetration variable is defined as
Import PenetrationCN =ImportCN
Gross Output + Total Import - Total Export
One particular challenge in merging these datasets is that BEA does not strictly follow
a standard industry classification. According to BEA’s website, “BEA’s industry groupings
generally follow the North American Industry Classification System”19. However, there
are two types of exceptions. First, one BEA industry is often matched to several NAICS
industries. Second, the links are not of the same granularity across BEA industries. For
example, in the detailed industry gross output file from BEA, while most industries are
matched to six-digit NAICS industries, some are matched to three-digit or even two-digit
NAICS industries.
We construct the China import penetration variable with the following steps. First,
we define industries using the four-digit NAICS codes, which are similar to the three-digit
SIC industry classifications. Then we aggregate the import/export data, which uses a six-
digit NAICS code, into four-digit NAICS code groups. Note several industries in the im-
port/export data also only have two-digit or three-digit industry information. For these
industries, we thus calculate the import penetration for the broader industries only.
Next, we merge the industry gross output data to the import/export data. Note for
industries that have zero China import, the import penetration ratio is just zero. Therefore,
the merge is essentially a “left join” with the import/export data as the master dataset.
In the merging process, there are 19 four-digit SIC industries in the import/export data
that are not matched. We list the non-matched industries in the table below. Furthermore,
we also provide the reasons for non-matching and our solutions to address the issue.
NAICS industry Problem How we handle the issue
1124 Multiple industries Using NAICS industry 112
1125 Multiple industries Using NAICS industry 112
19https://www.bea.gov/resources/learning-center/what-to-know-industries. The BEAindustry-NAICS link file can be downloaded from https://apps.bea.gov/industry/xls/
underlying-estimates/GDPbyInd_VA_Components_1998-2017.xlsx. In the excel file, the tab named“NAICS code” contains the link table. A more detailed discussion of the industry classification methods canbe found in https://www.bea.gov/sites/default/files/2018-04/2017-industry-code-guide.pdf