1 Internet Appendix for “Mutual Fund Performance and the Incentive to Generate Alpha” Diane Del Guercio and Jonathan Reuter * In Table IA.I, we replicate the summary statistics reported in Table I except that we add the institutional segment. We classify a fund as being institutional when at least 75% of its assets are sold through share classes focused on that segment. Collectively, institutional funds manage a relatively small 8.4% of the assets invested in nonspecialized domestic equity. Notably, 26.9% of institutional assets are invested in passive index funds, and both actively managed and index institutional funds have the lowest average expense ratio of the three segments. In Table IA.II, we replicate the panel regressions of monthly fund flow on past performance measures reported in Table II except that we expand the sample to include the institutional segment. To establish the robustness of our findings in Table II, we also include specifications that omit lagged fund flows or fund-level controls. For each specification, the table reports the coefficients on the control variables that were included but unreported in Table II. In columns (8), (9), and (10), we find that fund flows in the institutional segment behave similarly to broker-sold funds in that they are significantly related to lagged raw returns and insignificantly related to risk-adjusted returns. Like broker-sold funds, the coefficient on risk- adjusted returns is significantly different from the coefficient in the direct-sold segment (p-values * Citation format: Del Guercio, Diane, and Jonathan Reuter, Internet Appendix for “Mutual Fund Performance and the Incentive to Generate Alpha,” Journal of Finance [doi:10.1111/jofi.12048]. Please note: Wiley-Blackwell is not responsible for the content or functionality of any supporting information supplied by the authors. Any queries (other than missing material) should be directed to the authors of the article.
Transcript
1
Internet Appendix for “Mutual Fund Performance and the Incentive to Generate Alpha”
Diane Del Guercio and Jonathan Reuter*
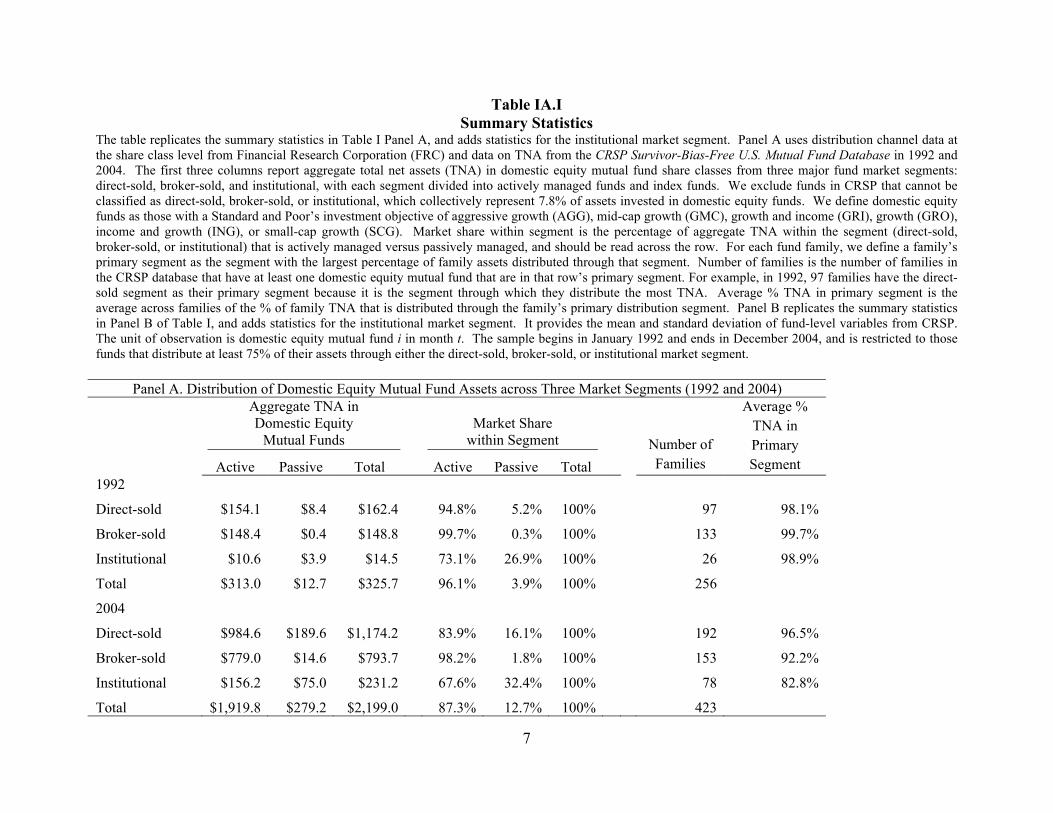
In Table IA.I, we replicate the summary statistics reported in Table I except that we add
the institutional segment. We classify a fund as being institutional when at least 75% of its
assets are sold through share classes focused on that segment. Collectively, institutional funds
manage a relatively small 8.4% of the assets invested in nonspecialized domestic equity.
Notably, 26.9% of institutional assets are invested in passive index funds, and both actively
managed and index institutional funds have the lowest average expense ratio of the three
segments.
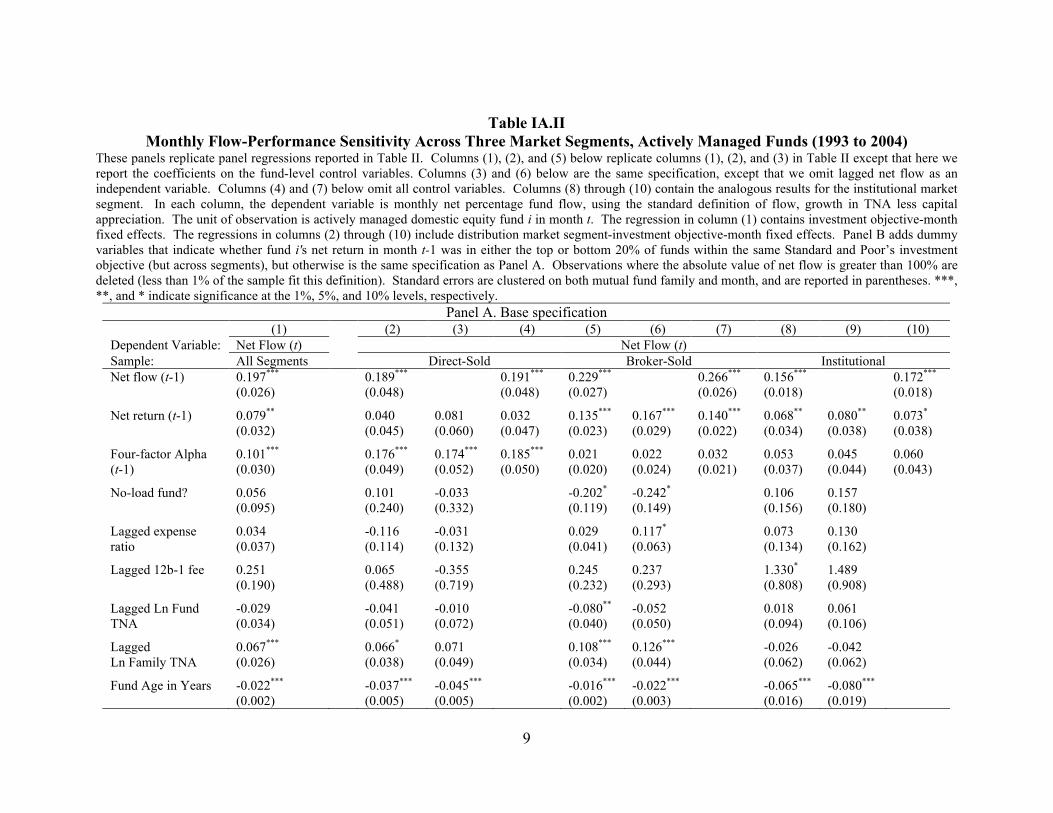
In Table IA.II, we replicate the panel regressions of monthly fund flow on past
performance measures reported in Table II except that we expand the sample to include the
institutional segment. To establish the robustness of our findings in Table II, we also include
specifications that omit lagged fund flows or fund-level controls. For each specification, the
table reports the coefficients on the control variables that were included but unreported in Table
II. In columns (8), (9), and (10), we find that fund flows in the institutional segment behave
similarly to broker-sold funds in that they are significantly related to lagged raw returns and
insignificantly related to risk-adjusted returns. Like broker-sold funds, the coefficient on risk-
adjusted returns is significantly different from the coefficient in the direct-sold segment (p-values
* Citation format: Del Guercio, Diane, and Jonathan Reuter, Internet Appendix for “Mutual Fund
Performance and the Incentive to Generate Alpha,” Journal of Finance [doi:10.1111/jofi.12048]. Please
note: Wiley-Blackwell is not responsible for the content or functionality of any supporting information
supplied by the authors. Any queries (other than missing material) should be directed to the authors of the
article.
2
of 0.029, 0.027, and 0.039 in columns (8), (9), and (10)). None of our earlier inferences on the
broker-sold and direct-sold segments change.
In Table IA.III, we report the results of regressions intended to match the specification
reported in Table VI of Bergstresser, Chalmers, and Tufano (2009), who test for differences in
return chasing behavior across the broker-sold and direct-sold segments. They regress flows in
calendar year t on raw returns in calendar year t and calendar year t-1, and find that the
sensitivity of flows to raw returns is similar in both segments. Their evidence is not directly
comparable to ours because they report results based on annual flows and do not include risk-
adjusted performance measures in their regressions. Specifications (2) and (4) are intended to
match their specification as closely as possible, where they separately estimate flow sensitivity to
positive performance. When we control only for raw returns in specifications (1) and (2), we
also find that the sensitivity of flows to raw returns is similar in the direct-sold and broker-sold
segments. When we simultaneously control for raw returns and four-factor alphas in
specifications (3) and (4), however, we find that sensitivity of flows to four-factor alphas is
limited to the direct-sold segment. Note that while the estimated sensitivity of flows to alpha in
the direct-sold segment tends to be higher than the estimated sensitivity of flows to raw returns in
the broker-sold segment, we cannot reject Bergstresser, Chalmers, and Tufano’s finding that the
overall tendency to chase past returns is at least as strong in the broker-sold segment. This is
because a one-standard deviation increase in four-factor alpha (2.56%) is smaller than a one-
standard deviation increase in raw returns (5.61%).
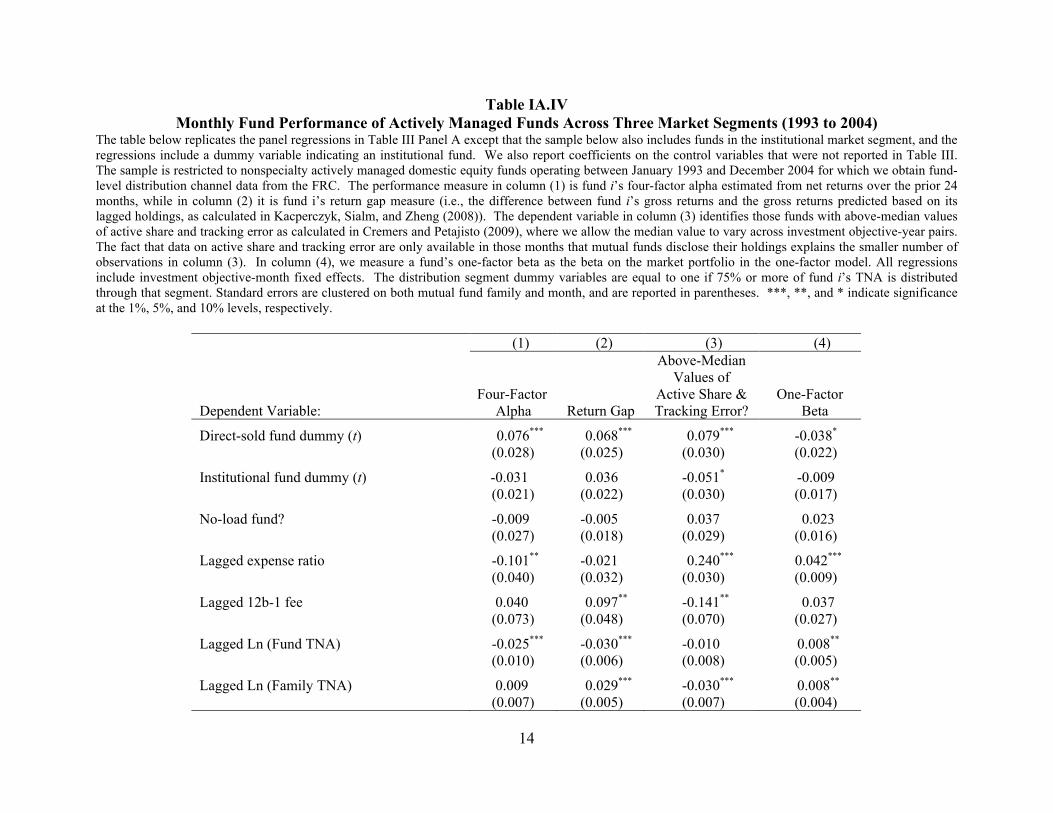
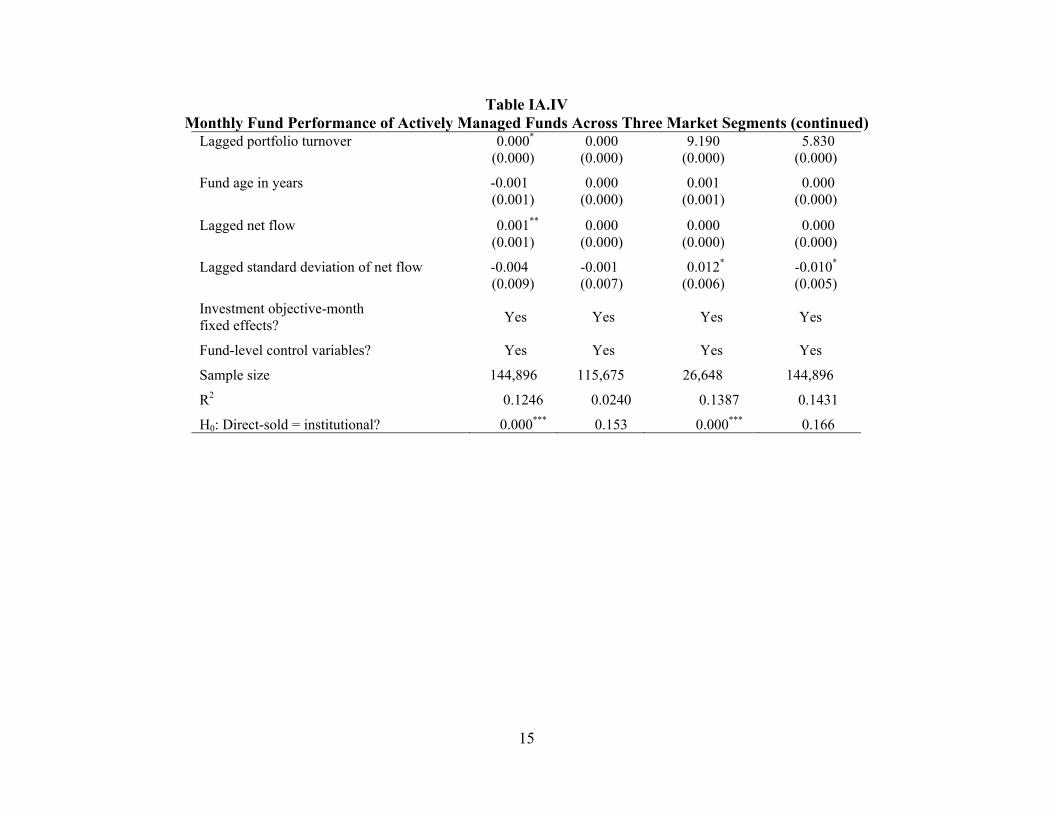
Table IA.IV replicates Table III except that we include institutional funds, and in the
regression we include a dummy variable equal to one if the fund is institutional. The omitted
dummy is the indicator variable for broker-sold funds. We also report the coefficients on the
3
control variables that were included but unreported in Table III. None of our inferences on the
broker-sold and direct-sold segments change. Regarding the institutional segment, we find that
active share is significantly lower than in the broker-sold segment. Both four-factor alpha and
active share are significantly higher in the direct-sold segment relative to the institutional
segment (p-values of 0.000 in both cases), while return gap and one-factor beta are not
significantly different across the two segments.
Table IA.V replicates Table III Panels A and B except that we restrict the sample to funds
with a ticker, Morningstar rating (which ensures the fund is at least three years old), and
Morningstar investment objective. This filter eliminates 43.2% of our fund-month observations,
primarily because it limits our sample period to the years 1996 to 2002. This specification is
intended to show that our results are not driven by incubation bias (Evans (2010)). The results
are similar to those of Panels A and B of Table III, with only a few exceptions. In Panel B,
within the sample of small cap funds, the difference in the four-factor alphas of direct-sold and
broker-sold funds increases from 17.4 to 22.5 basis points per month (p-value of 0.020), and the
difference in return gaps increases from 12.0 to 27.5 basis points per month (p-value of 0.000).
On the other hand, we do not find that the one-factor betas of direct-sold funds are significantly
different from those of broker-sold funds. This suggests that the tilt toward higher betas in the
full sample might be driven by the incubation of broker-sold funds.
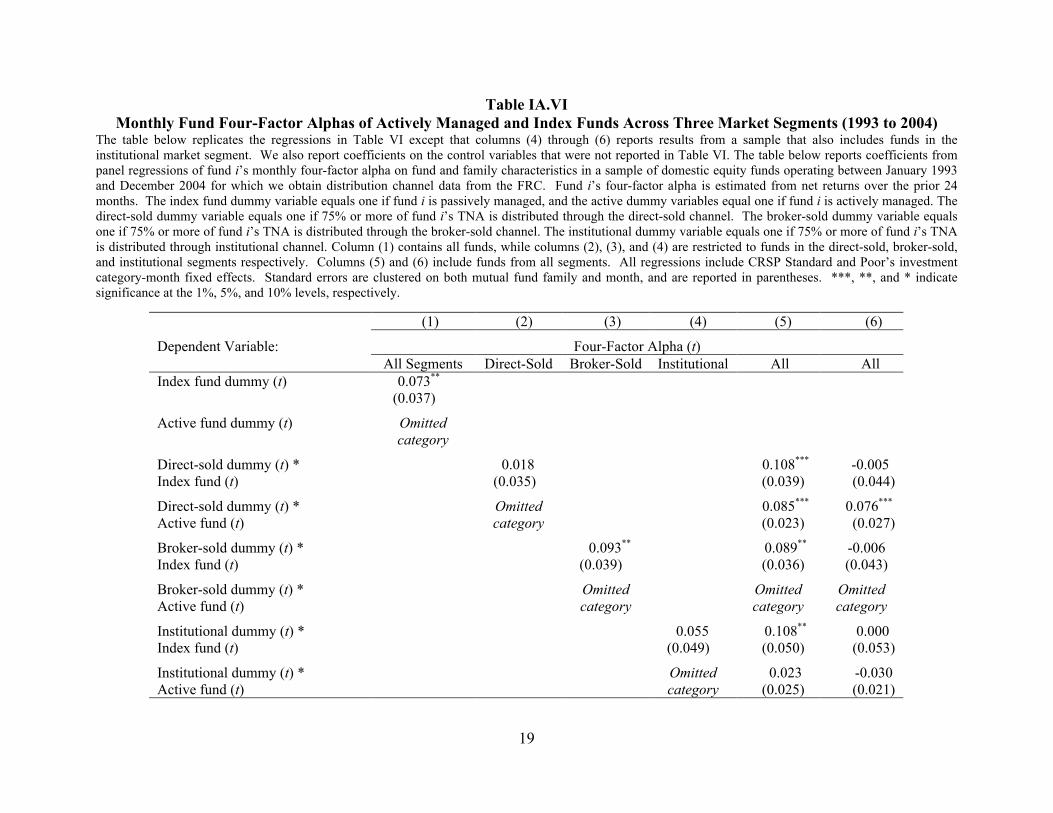
Table IA.VI replicates Table VI except that we report in column (4) the results of a
regression in which we restrict the sample to institutional funds. We also report the coefficients
on the control variables that are included but not reported in Table VI. The dependent variable is
fund i's four-factor alpha in month t, which we estimate using fund i’s after-fee returns over the
prior 24 months. The independent variable of interest is a dummy variable indicating whether
4
fund i is an index fund. In column (4), we find that the estimated difference in performance for
institutional index funds is slightly smaller than in the full sample (5.5 basis points per month)
but also statistically indistinguishable from zero (p-value of 0.263). We note that the estimated
difference in risk-adjusted after-fee returns is almost exactly equal to the 5.3 basis point
difference in fees. In columns (4) and (5), we pool all of the observations but distinguish
between actively and passively managed funds available in the three different market segments.
Excluding fund-level control variables, the estimated coefficients on the five dummy
variables measure average risk-adjusted, after-fee performance relative to the average broker-
sold actively managed fund (which is the omitted category). In column (5), we see that the
results on direct-sold actively managed funds relative to broker-sold funds are similar to those in
Table VI. In column (5), the performance of direct-sold actively managed funds is statistically
indistinguishable from the performance of the index funds available in all three segments. In
addition, while we estimate that broker-sold actively managed funds underperform institutional
actively managed funds by 2.3 basis points per month, this difference is not significant (p-value
of 0.362). In column (6), we include control variables and find that inferences do not change
from Table VI.
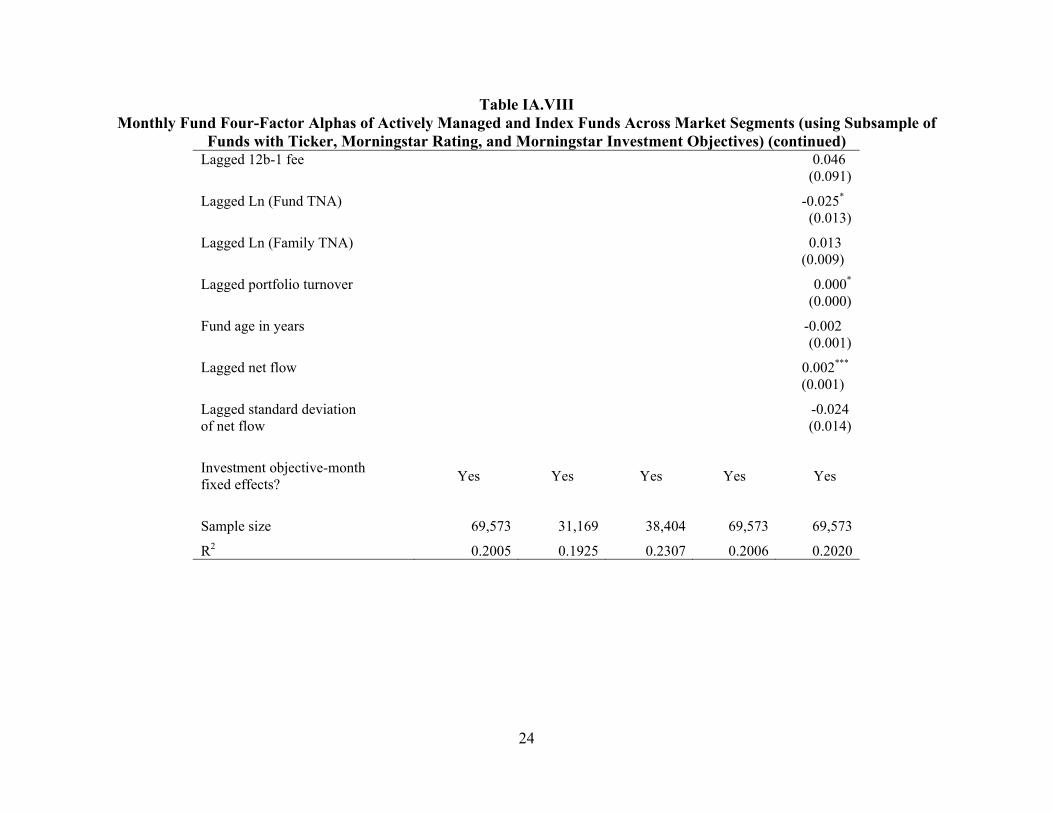
Table IA.VII repeats the analysis of Table VI but using the methodology of Fama and
MacBeth (1973) while Table IA.VIII restricts the sample to funds with a ticker, Morningstar
rating, and Morningstar investment objective. In both tables, we find similar results to those in
Table VI. In Table IA.VII, the estimated underperformance of actively managed funds relative
to index funds is 0.3 basis points per month in the direct-sold segment (p-value of 0.931) versus
10.1 basis points per month in the broker-sold segment (p-value of 0.011). In Table IA.VIII, the
estimated underperformance of actively managed funds is 0.6 basis points per month in the
5
direct-sold segment (p-value of 0.914) versus 11.0 basis points per month in the broker-sold
segment (p-value of 0.064). The one exception is in column (1) of Table IA.VIII, when we
estimate a pooled regression on the smaller sample of funds with a ticker and Morningstar data.
The estimated underperformance of actively managed funds relative to index funds matches the
estimate of 6.6 basis points per month in Table IA.VII, but is not statistically significant (p-value
of 0.155).
6
REFERENCES
Bergstresser, Daniel, John Chalmers, and Peter Tufano, 2009, Assessing the costs and benefits of
brokers in the mutual fund industry, Review of Financial Studies 22, 4129–4156.
Evans, Richard, 2010, Mutual fund incubation, Journal of Finance 65, 1581–1611.
Fama, Eugene F., and James D. MacBeth, 1973, Risk, return, and equilibrium: Empirical tests,
Journal of Political Economy 81, 607-636.
Kacperczyk, Marcin, Clemens Sialm, and Lu Zheng, 2008, Unobserved actions of mutual funds,
Review of Financial Studies 21, 2379–2416.
7
Table IA.I Summary Statistics
The table replicates the summary statistics in Table I Panel A, and adds statistics for the institutional market segment. Panel A uses distribution channel data at the share class level from Financial Research Corporation (FRC) and data on TNA from the CRSP Survivor-Bias-Free U.S. Mutual Fund Database in 1992 and 2004. The first three columns report aggregate total net assets (TNA) in domestic equity mutual fund share classes from three major fund market segments: direct-sold, broker-sold, and institutional, with each segment divided into actively managed funds and index funds. We exclude funds in CRSP that cannot be classified as direct-sold, broker-sold, or institutional, which collectively represent 7.8% of assets invested in domestic equity funds. We define domestic equity funds as those with a Standard and Poor’s investment objective of aggressive growth (AGG), mid-cap growth (GMC), growth and income (GRI), growth (GRO), income and growth (ING), or small-cap growth (SCG). Market share within segment is the percentage of aggregate TNA within the segment (direct-sold, broker-sold, or institutional) that is actively managed versus passively managed, and should be read across the row. For each fund family, we define a family’s primary segment as the segment with the largest percentage of family assets distributed through that segment. Number of families is the number of families in the CRSP database that have at least one domestic equity mutual fund that are in that row’s primary segment. For example, in 1992, 97 families have the direct-sold segment as their primary segment because it is the segment through which they distribute the most TNA. Average % TNA in primary segment is the average across families of the % of family TNA that is distributed through the family’s primary distribution segment. Panel B replicates the summary statistics in Panel B of Table I, and adds statistics for the institutional market segment. It provides the mean and standard deviation of fund-level variables from CRSP. The unit of observation is domestic equity mutual fund i in month t. The sample begins in January 1992 and ends in December 2004, and is restricted to those funds that distribute at least 75% of their assets through either the direct-sold, broker-sold, or institutional market segment.
Panel A. Distribution of Domestic Equity Mutual Fund Assets across Three Market Segments (1992 and 2004) Aggregate TNA in
Domestic Equity Mutual Funds
Market Share
within Segment
Active Passive Total Active Passive Total Number of Families
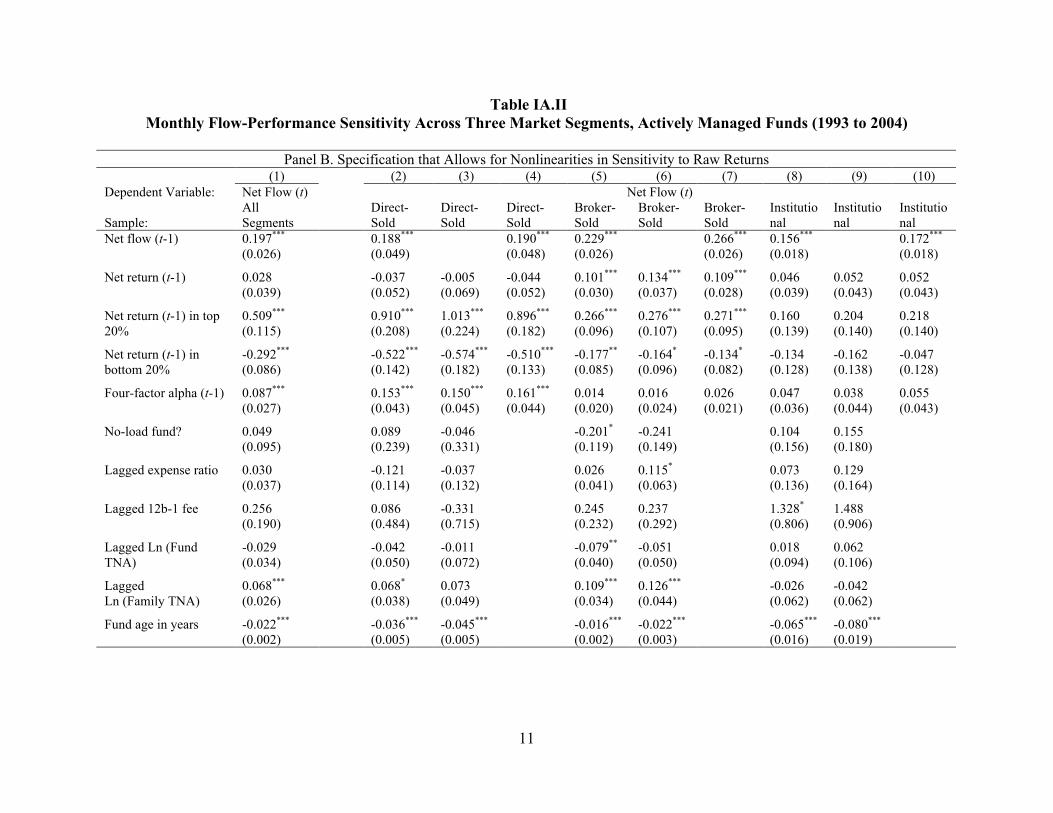
Monthly Flow-Performance Sensitivity Across Three Market Segments, Actively Managed Funds (1993 to 2004) These panels replicate panel regressions reported in Table II. Columns (1), (2), and (5) below replicate columns (1), (2), and (3) in Table II except that here we report the coefficients on the fund-level control variables. Columns (3) and (6) below are the same specification, except that we omit lagged net flow as an independent variable. Columns (4) and (7) below omit all control variables. Columns (8) through (10) contain the analogous results for the institutional market segment. In each column, the dependent variable is monthly net percentage fund flow, using the standard definition of flow, growth in TNA less capital appreciation. The unit of observation is actively managed domestic equity fund i in month t. The regression in column (1) contains investment objective-month fixed effects. The regressions in columns (2) through (10) include distribution market segment-investment objective-month fixed effects. Panel B adds dummy variables that indicate whether fund i's net return in month t-1 was in either the top or bottom 20% of funds within the same Standard and Poor’s investment objective (but across segments), but otherwise is the same specification as Panel A. Observations where the absolute value of net flow is greater than 100% are deleted (less than 1% of the sample fit this definition). Standard errors are clustered on both mutual fund family and month, and are reported in parentheses. ***, **, and * indicate significance at the 1%, 5%, and 10% levels, respectively.
Panel A. Base specification (1) (2) (3) (4) (5) (6) (7) (8) (9) (10) Dependent Variable: Net Flow (t) Net Flow (t) Sample: All Segments Direct-Sold Broker-Sold Institutional Net flow (t-1) 0.197***
(0.026) 0.189***
(0.048) 0.191***
(0.048) 0.229***
(0.027) 0.266***
(0.026) 0.156***
(0.018) 0.172***
(0.018) Net return (t-1) 0.079**
(0.032) 0.040
(0.045) 0.081 (0.060)
0.032 (0.047)
0.135*** (0.023)
0.167*** (0.029)
0.140*** (0.022)
0.068**
(0.034) 0.080**
(0.038) 0.073*
(0.038) Four-factor Alpha (t-1)
0.101*** (0.030)
0.176*** (0.049)
0.174*** (0.052)
0.185*** (0.050)
0.021 (0.020)
0.022 (0.024)
0.032 (0.021)
0.053 (0.037)
0.045 (0.044)
0.060 (0.043)
No-load fund? 0.056
(0.095) 0.101
(0.240) -0.033
(0.332) -0.202*
(0.119) -0.242*
(0.149) 0.106
(0.156) 0.157
(0.180) Lagged expense ratio
0.034 (0.037)
-0.116 (0.114)
-0.031 (0.132)
0.029 (0.041)
0.117*
(0.063) 0.073 (0.134)
0.130 (0.162)
Lagged 12b-1 fee 0.251 (0.190)
0.065 (0.488)
-0.355 (0.719)
0.245 (0.232)
0.237 (0.293)
1.330*
(0.808) 1.489
(0.908) Lagged Ln Fund TNA
-0.029
(0.034) -0.041
(0.051) -0.010
(0.072) -0.080**
(0.040) -0.052
(0.050) 0.018
(0.094) 0.061
(0.106) Lagged Ln Family TNA
0.067*** (0.026)
0.066* (0.038)
0.071 (0.049)
0.108*** (0.034)
0.126*** (0.044)
-0.026 (0.062)
-0.042 (0.062)
Fund Age in Years -0.022*** (0.002)
-0.037*** (0.005)
-0.045*** (0.005)
-0.016*** (0.002)
-0.022*** (0.003)
-0.065*** (0.016)
-0.080*** (0.019)
10
Table IA.II
Monthly Flow-Performance Sensitivity Across Three Market Segments, Actively Managed Funds (1993 to 2004)
Panel A. Base specification (continued) H0: Coefficient on lagged net flows is equal to direct
0.460
0.158
0.527
0.706
H0: Coefficient on lagged net return is equal to direct
0.033**
0.124
0.015**
0.583
0.983
0.463
H0: Coefficient on 4-factor alpha is equal to direct
0.001***
0.002***
0.001***
0.029***
0.027**
0.037***
Include investment-objective-month fixed effects?
Yes
Yes
Yes
Yes
Yes
Yes
Yes
Yes
Yes
Yes
Include investment-objective-month-segment fixed effects?
Table IA.III Monthly Flow-Performance Sensitivity using Specification in Bergstresser, Chalmers, and Tufano (2009)
This table reports panel regressions in which the dependent variable is monthly net percentage fund flow, using the standard definition of flow, growth in TNA less capital appreciation. The unit of observation is actively managed fund i in month t. All regressions include the following fund-level control variables interacted with market segment fixed effects, the coefficients of which are not reported: lagged expense ratio, lagged no-load fund dummy, lagged 12b-1 fee, lagged log of fund TNA, lagged log of family TNA, and current fund age measured in years. All regressions also include market segment-investment objective-month fixed effects. The specification is intended to match Table 6 of Bergstresser, Chalmers, and Tufano (2009), except that we use monthly flow instead of annual flow, and we exclude index funds. Standard errors are clustered on both mutual fund family and month, and are reported in parentheses. ***, **, and * indicate significance at the 1%, 5%, and 10% levels, respectively. (1) (2) (3) (4) Dependent Variable: Net Flow (t) Net Flow (t) Net Flow (t) Net Flow (t) Sample:
Table IA.IV Monthly Fund Performance of Actively Managed Funds Across Three Market Segments (1993 to 2004)
The table below replicates the panel regressions in Table III Panel A except that the sample below also includes funds in the institutional market segment, and the regressions include a dummy variable indicating an institutional fund. We also report coefficients on the control variables that were not reported in Table III. The sample is restricted to nonspecialty actively managed domestic equity funds operating between January 1993 and December 2004 for which we obtain fund-level distribution channel data from the FRC. The performance measure in column (1) is fund i’s four-factor alpha estimated from net returns over the prior 24 months, while in column (2) it is fund i’s return gap measure (i.e., the difference between fund i’s gross returns and the gross returns predicted based on its lagged holdings, as calculated in Kacperczyk, Sialm, and Zheng (2008)). The dependent variable in column (3) identifies those funds with above-median values of active share and tracking error as calculated in Cremers and Petajisto (2009), where we allow the median value to vary across investment objective-year pairs. The fact that data on active share and tracking error are only available in those months that mutual funds disclose their holdings explains the smaller number of observations in column (3). In column (4), we measure a fund’s one-factor beta as the beta on the market portfolio in the one-factor model. All regressions include investment objective-month fixed effects. The distribution segment dummy variables are equal to one if 75% or more of fund i’s TNA is distributed through that segment. Standard errors are clustered on both mutual fund family and month, and are reported in parentheses. ***, **, and * indicate significance at the 1%, 5%, and 10% levels, respectively.
(1) (2) (3) (4) Dependent Variable:
Four-Factor
Alpha
Return Gap
Above-Median Values of
Active Share & Tracking Error?
One-Factor Beta
Direct-sold fund dummy (t) 0.076***
(0.028) 0.068***
(0.025) 0.079***
(0.030) -0.038*
(0.022) Institutional fund dummy (t)
-0.031
(0.021) 0.036
(0.022) -0.051*
(0.030) -0.009
(0.017) No-load fund? -0.009
(0.027) -0.005
(0.018) 0.037
(0.029) 0.023
(0.016) Lagged expense ratio -0.101**
(0.040) -0.021
(0.032) 0.240***
(0.030) 0.042***
(0.009) Lagged 12b-1 fee
0.040
(0.073) 0.097**
(0.048) -0.141**
(0.070) 0.037
(0.027) Lagged Ln (Fund TNA) -0.025***
(0.010) -0.030***
(0.006) -0.010
(0.008) 0.008**
(0.005) Lagged Ln (Family TNA)
0.009
(0.007) 0.029***
(0.005) -0.030***
(0.007) 0.008**
(0.004)
15
Table IA.IV Monthly Fund Performance of Actively Managed Funds Across Three Market Segments (continued)
Table IA.V Monthly Fund Performance Across Market Segments (using Subsample of Funds with Ticker, Morningstar Rating, and
Morningstar Investment Objectives) (1996 to 2002) Panel A replicates the panel regressions in Table III Panel A except that in the sample below we require funds to have a ticker, Morningstar rating, and Morningstar investment objective. Panel B further restricts the sample to actively managed small-cap growth funds, but is otherwise identical to Panel A. Data availability for the Morningstar rating and investment objectives restricts the sample in both panels to the 1996 to 2002 period. The table below reports coefficients from panel regressions of fund i’s monthly performance on fund and family characteristics. The performance measure in column (1) is fund i’s four-factor alpha estimated from net returns over the prior 24 months, while in column (2) it is fund i’s return gap measure (i.e., the difference between fund i’s gross returns and the gross returns predicted based on its lagged holdings, as calculated in Kacperczyk, Sialm, and Zheng (2008)). The dependent variable in column (3) identifies those funds with above-median values of active share and tracking error as calculated in Cremers and Petajisto (2009), where we allow the median value to vary across investment objective-year pairs. The fact that data on active share and tracking error are only available in those months that mutual funds disclose their holdings explains the smaller number of observations in column (3). In column (4), we measure a fund’s one-factor beta as the beta on the market portfolio in the one-factor model. All regressions include investment objective-month fixed effects. The direct-sold segment dummy variable is equal to one if 75% or more of fund i’s TNA is distributed through the direct-sold segment. Standard errors are clustered on both fund family and month, and are reported in parentheses. ***, **, and * indicate significance at the 1%, 5%, and 10% levels, respectively.
Panel A. All Actively Managed Domestic Equity Funds (1) (2) (3) (4) Dependent Variable:
Four-Factor
Alpha
Return Gap
Above-Median Values of
Active Share & Tracking Error?
One-Factor Beta
Direct-sold fund dummy (t) 0.079*
(0.043) 0.074**
(0.031) 0.070**
(0.035) 0.000
(0.019) No-load fund? -0.011
(0.047) -0.002
(0.028) 0.022
(0.047) 0.004
(0.018) Lagged expense ratio -0.086***
(0.025) -0.051
(0.040) 0.150***
(0.046) 0.031***
(0.009) Lagged 12b-1 fee
0.043
(0.094) 0.160***
(0.060) -0.070
(0.098) 0.036
(0.027) Lagged Ln (Fund TNA) -0.025*
(0.014) -0.043***
(0.009) -0.007
(0.010) 0.006
(0.005) Lagged Ln (Family TNA)
0.013
(0.009) 0.038***
(0.009) -0.034***
(0.009) 0.000
(0.004)
17
Panel A. All Actively Managed Domestic Equity Funds (continued) Lagged portfolio turnover 0.000*
Table IA.VI Monthly Fund Four-Factor Alphas of Actively Managed and Index Funds Across Three Market Segments (1993 to 2004)
The table below replicates the regressions in Table VI except that columns (4) through (6) reports results from a sample that also includes funds in the institutional market segment. We also report coefficients on the control variables that were not reported in Table VI. The table below reports coefficients from panel regressions of fund i’s monthly four-factor alpha on fund and family characteristics in a sample of domestic equity funds operating between January 1993 and December 2004 for which we obtain distribution channel data from the FRC. Fund i’s four-factor alpha is estimated from net returns over the prior 24 months. The index fund dummy variable equals one if fund i is passively managed, and the active dummy variables equal one if fund i is actively managed. The direct-sold dummy variable equals one if 75% or more of fund i’s TNA is distributed through the direct-sold channel. The broker-sold dummy variable equals one if 75% or more of fund i’s TNA is distributed through the broker-sold channel. The institutional dummy variable equals one if 75% or more of fund i’s TNA is distributed through institutional channel. Column (1) contains all funds, while columns (2), (3), and (4) are restricted to funds in the direct-sold, broker-sold, and institutional segments respectively. Columns (5) and (6) include funds from all segments. All regressions include CRSP Standard and Poor’s investment category-month fixed effects. Standard errors are clustered on both mutual fund family and month, and are reported in parentheses. ***, **, and * indicate significance at the 1%, 5%, and 10% levels, respectively.
(1) (2) (3) (4) (5) (6) Dependent Variable: Four-Factor Alpha (t) All Segments Direct-Sold Broker-Sold Institutional All All Index fund dummy (t) 0.073**
(0.037)
Active fund dummy (t) Omitted category
Direct-sold dummy (t) * Index fund (t)
0.018
(0.035) 0.108***
(0.039) -0.005
(0.044) Direct-sold dummy (t) * Active fund (t)
Omitted category
0.085*** (0.023)
0.076*** (0.027)
Broker-sold dummy (t) * Index fund (t)
0.093**
(0.039) 0.089**
(0.036) -0.006 (0.043)
Broker-sold dummy (t) * Active fund (t)
Omitted category
Omitted category
Omitted category
Institutional dummy (t) * Index fund (t)
0.055
(0.049) 0.108**
(0.050) 0.000
(0.053) Institutional dummy (t) * Active fund (t)
Omitted category
0.023 (0.025)
-0.030 (0.021)
20
Table IA.VI Monthly Fund Four-Factor Alphas of Actively Managed and Index Funds Across Three Market Segments (continued)
Table IA.VII Monthly Fund Four-Factor Alphas of Actively Managed and Index Funds Across Market Segments (1993 to 2004):
Fama-MacBeth Regressions The table reports the results of monthly Fama-MacBeth (1973) regressions instead of the panel regressions of Table VI. The reported coefficients and R2 are the average coefficients and R2 across 143 months. Fund i’s four-factor alpha is estimated from net returns over the prior 24 months. The index fund dummy variable equals one if fund i is passively managed, and the active dummy variables equal one if fund i is actively managed. The direct-sold dummy variable equals one if 75% or more of fund i’s TNA is distributed through the direct-sold channel. The broker-sold dummy variable equals one if 75% or more of fund i’s TNA is distributed through the broker-sold channel. Column (1) contains all retail funds, while columns (2) and (3) are restricted to funds in the direct-sold or broker-sold segments. Columns (4) and (5) include funds from both segments. All regressions include CRSP Standard and Poor’s investment category-month fixed effects. ***, **, and * indicate significance at the 1%, 5%, and 10% levels, respectively.
(1) (2) (3) (4) (5) Dependent Variable: Four-Factor Alpha (t) Sample: Both Segments Direct-Sold Broker-Sold Both Segments Index fund dummy (t) 0.066*
(0.034)
Active fund dummy (t) Omitted category
Direct-sold dummy (t) * Index fund (t)
0.003
(0.037) 0.105***
(0.038) 0.005
(0.047) Direct-sold dummy (t) * Active fund (t)
Omitted category
0.080*** (0.018)
0.103*** (0.027)
Broker-sold dummy (t) * Index fund (t)
0.101**
(0.039) 0.095**
(0.039) -0.022 (0.044)
Broker-sold dummy (t) * Active fund (t)
Omitted category
Omitted category
Omitted category
Lagged expense ratio
-0.146***
(0.042) No-load fund?
-0.039 (0.024)
Lagged 12b-1 fee
0.103
(0.065)
22
Table IA.VII Monthly Fund Four-Factor Alphas of Actively Managed and Index Funds Across Market Segments (1993 to 2004):
Table IA.VIII Monthly Fund Four-Factor Alphas of Actively Managed and Index Funds Across Market Segments (using Subsample of
Funds with Ticker, Morningstar Rating, and Morningstar Investment Objectives) (1996 to 2002) The table below replicates the panel regressions of Table VI, except that in the sample below we require funds to have a ticker, Morningstar rating, and Morningstar investment objective. Data availability for the Morningstar rating and investment objectives restricts the sample to the 1996 to 2002 period. Fund i’s four-factor alpha is estimated from net returns over the prior 24 months. The index fund dummy variable equals one if fund i is passively managed, and the active dummy variables equal one if fund i is actively managed. The direct-sold dummy variable equals one if 75% or more of fund i’s TNA is distributed through the direct-sold channel. The broker-sold dummy variable equals one if 75% or more of fund i’s TNA is distributed through the broker-sold channel. Column (1) contains all retail funds, while columns (2) and (3) are restricted to funds in the direct-sold or broker-sold segments. Columns (4) and (5) include funds from both segments. All regressions include CRSP Standard and Poor’s investment category-month fixed effects. Standard errors are clustered on both mutual fund family and month, and are reported in parentheses. ***, **, and * indicate significance at the 1%, 5%, and 10% levels, respectively.
(1) (2) (3) (4) (5) Dependent Variable: Four-Factor Alpha (t) Sample: Both Segments Direct-Sold Broker-Sold Both Segments Index fund dummy (t) 0.066
(0.046)
Active fund dummy (t) Omitted category
Direct-sold dummy (t) * Index fund (t)
0.006
(0.054) 0.099**
(0.048) -0.016
(0.057) Direct-sold dummy (t) * Active fund (t)
Omitted category
0.077*** (0.027)
0.077* (0.042)
Broker-sold dummy (t) * Index fund (t)
0.110*
(0.059) 0.103*
(0.059) 0.014
(0.044) Broker-sold dummy (t) * Active fund (t)
Omitted category
Omitted category
Omitted category
Lagged expense ratio
-0.086***
(0.025) No-load fund?
-0.007 (0.043)
24
Table IA.VIII Monthly Fund Four-Factor Alphas of Actively Managed and Index Funds Across Market Segments (using Subsample of
Funds with Ticker, Morningstar Rating, and Morningstar Investment Objectives) (continued) Lagged 12b-1 fee