32
www.opa-europe.org 2007 Europe Data 1 Internet Access At Work A Media Consumption study Results for Europe 2006/2007 (Wave 2) Conducted by SKOPOS market insight (Wave 1 completed in 2004)
| Date post: | 01-Nov-2014 |
| Category: |
Business |
| Upload: | innovacting |
| View: | 2,042 times |
| Download: | 0 times |

www.opa-europe.org2007 Europe Data 1
Internet Access At WorkA Media Consumption study
Results for Europe
2006/2007 (Wave 2)
Conducted by SKOPOS market insight
(Wave 1 completed in 2004)

www.opa-europe.org2007 Europe Data 2
Two types of Internet users were queried for this study
At Work Internet Users
Accessed Internet from work within
past 30 days for non-email purposes
Non-work Internet Users
Accessed Internet from home, school or
elsewhere – but not work – within past
30 days

www.opa-europe.org2007 Europe Data 3
At work users from 6 countries were polled for this research
Spain
13%
Switzerland
3%
UK
21%France
17%
Germany
29%
Italy
17%
Base: All respondents (weighted): 2006 (136154)
www.opa-europe.org
Demographics
Europe

www.opa-europe.org
18-24
16%
25-34
25%
35-44
25%
45-54
19%
55+
15%
At Work Users in Europe are mostly male, over 35 and very highly educated
Base: All respondents (weighted): 136154
Base: At work (weighted): 2006 (96318)
Base: Non work (weighted): 2006 (39837)
566235+
6475Univ.+
433918-34
4742Female
5358Male
Non Work
%
At Work
%
(At least 4 years at University)
Demographics
2007 Europe Data 5

www.opa-europe.org
At Work users in Europe are the main decision makers both at home and At Work
2344Authorise company spending
2941Income 50K€ +
7489Major household purchases
6072 Household Grocery Shopping
Non Work
%
At Work
%
Q29. Do you do at least half the grocery shopping for your household?
Q30. And do you have at least half of the say in major household purchases (e.g. cars, computers)?
Q44. Which classification best describes your total pre-tax household income in euros?
Q35. How much spending (in EUR) do you typically authorise for your company each year?
Spending behaviour
2007 Europe Data 6
Base: At work (weighted): 2006 (96318)
Base: Non work (weighted): 2006 (39837)
www.opa-europe.org2007 Europe Data 7
Internet Behaviour and Attitudes

www.opa-europe.org2007 Europe Data 8
At Work Internet use in Europe has remained stable since 2004
Q25. Which of the following do you do less often at work as a result of using the Internet?
6%
10%
10%
12%
17%
19%
19%
20%
23%
23%
27%
6%
7%
7%
9%
12%
12%
13%
19%
20%
27%
24%
Attend meetings in person
Listen to music
Work
Listen to radio
Spend time with colleagues
Watch television
Read books
Leave office to run errands
Read magazines
Talk on the phone
Read newspapers
2004
2007
Base: At work users (weighted):2006 (96318)
Things At Work users do LESS often as a result of using the internet

www.opa-europe.org2007 Europe Data 9
In 2007, more European users feel the Internet improves their productivity At Work
Q23. Please indicate your agreement with the following statements related to your use of the Internet at
work (agree net % shown)
67%
69%
69%
72%
80%
81%
89%
62%
64%
60%
68%
76%
82%
88%
I tend to use the Web for short bursts of focused
activity at work
The Internet is the main way I keep in touch with
business/financial news while I’m at work
The Internet allows me to take care of personal
tasks while at work
The Internet is the main way I keep in touch with
technology news while I’m at work
The Internet has improved my productivity at work
Internet news is the main way I keep in touch with
world events while I’m at work
I have a set of web sites I regularly visit while at
work
2004
2007
Chart 1 of 2
Agreement with statements related to use of Internet at work
Base: At work users (weighted): 2006 (96318)

www.opa-europe.org2007 Europe Data 10
Chart 2 of 2
19%
27%
32%
33%
39%
62%
62%
20%
38%
41%
31%
37%
53%
59%
I spend more time at the office because of my access to
the Internet
I tend to spend more time on a web site when I’m at work
than at home
I am more involved in the web sites I visit while at work
Internet sports news is the main way I keep in touch with
sports news and events while I’m at work
I am more likely to navigate deeper into a web site while at
work
Internet news is the main way I keep in touch with local
news while I’m at work
I often use the Internet to work while I’m at home
2004
2007
Q23. Please indicate your agreement with the following statements related to your use of the Internet at
work (agree net % shown)
Agreement with statements related to use of internet at work
European users spend more time on
News and Information sites in 2007
Base: At work users (weighted): 2006 (96318)

www.opa-europe.org2007 Europe Data 11
Visiting news and information sites is the number
one reason European At Work users access the
Internet
At Work Users (%)
From workFrom home/school/
elsewhere
News/current events 78 69
Education/Learning 61 49
Local or regional information 60 62
Research companies or vendors 56 33
Check weather 51 54
Research products or services for purchases 50 56
Travel planning/reservations 47 71
Other 44 49
Customer service/technical support 44 43
Get information on special interest/hobbies 42 35
Q17. For which of the following reasons do you access the Internet?
Chart 1 of 3
Base: At work (weighted): 2007 (96318)
Reasons for accessing the Internet

www.opa-europe.org2007 Europe Data 12
At Work Users (%)
From work
From home/school/
elsewhere
Investment/transactions/online banking 39 56
Buy products or services 38 65
Entertainment planning (dining, movies, etc.) 33 68
Buy tickets 28 53
Get information on sports/check sports scores 25 35
Find/research employment opportunities 24 38
Read blogs or make blog entries 23 38
Health and health-related information 20 44
Listen to music 19 46
Find used goods for purchase (online auctions, classifieds, etc.) 19 40
Q17. For which of the following reasons do you access the Internet?
Chart 2 of 3
Base: At work (weighted): 2007 (96318)
Visiting news and information sites is the
number one reason European At Work users
access the InternetReasons for accessing the Internet

www.opa-europe.org2007 Europe Data 13
At Work Users (%)
From work
From home/school/
elsewhere
Download music/ multimedia files/software utilities 16 55
Watch online video 16 41
Get information on food and cooking 15 40
Check RSS-feed via RSS-reader 14 16
Make phone calls (e.g. Skype) 12 34
Get information on automobiles 10 24
Home improvement/decorating 10 29
Online games 8 28
Download Podcasting-files 7 18
Participate in personals/dating services 5 14
Get information on parenting/babies 5 13
Q17. For which of the following reasons do you access the Internet?
Chart 3 of 3
Base: At work (weighted): 2007 (96318)
Visiting news and information sites is the
number one reason European At Work users
access the InternetReasons for accessing the Internet

www.opa-europe.org2007 Europe Data 14
European users still spend the majority of their time on News and Information sites
-34Blogs
1931Radio
2435Ticketing services
4657Weather
-77Search engines
At Work Users (%)
2007 2004
News 82 80
Entertainment planning 52 37
Hobbies 48 36
Computer / SW 47 44
Travel 46 40
Educational 41 31
Music 31 21
Q18. Which types of web sites do you typically visit in an average 7-day week?
-39Blogs
2338Radio
2034Ticketing services
4150Weather
-71Search engines
Non Work Users (%)
2007 2004
News 81 76
Entertainment planning 48 42
Hobbies 54 44
Computer / SW 46 43
Travel 41 36
Educational 43 37
Music 45 32
Chart 1 of 3
Base: At work (weighted): 2006 (96318)
Base: Non work (weighted): 2006 (39837)
Sites visited in a typical week 7-day week

www.opa-europe.org2007 Europe Data 15
European users still spend the majority of their time on News and Information sites
1016Real Estate
2524Message boards
1321Games
2225Online auctions
1325Food/cooking
2126Job listings
3026Popular Culture
2130Retail shopping
2429Sports
-37Business News Websites
3932Financial services
At Work Users (%)
2007 2004
Electronics 24 15
Health/Fitness 21 16
Q18. Which types of web sites do you typically visit in an average 7-day week?
1013Real Estate
3021Message boards
2629Games
2626Online auctions
2129Food/cooking
2828Job listings
3427Popular Culture
2525Retail shopping
2633Sports
-20Business News Websites
3619Financial services
Non Work Users (%)
2007 2004
Electronics 21 19
Health/Fitness 25 16
Chart 2 of 3
Base: At work (weighted): 2006 (96318)
Base: Non work (weighted): 2006 (39837)
Sites visited in a typical week 7-day week

www.opa-europe.org2007 Europe Data 16
European users still spend the majority of their time on News and Information sites
99Dating Services
-13Home Improvement
913Classifieds
1010Automobile
-7Parenting/Babies
At Work Users (%)
2007 2004
Q18. Which types of web sites do you typically visit in an average 7-day week?
187Dating Services
-10Home Improvement
1213Classifieds
1514Automobile
-5Parenting/Babies
Non Work Users (%)
2007 2004
Chart 3 of 3
Base: At work (weighted): 2006 (96318)
Base: Non work (weighted): 2006 (39837)
Sites visited in a typical week 7-day week

www.opa-europe.org2007 Europe Data 17
Media Consumption
differences
www.opa-europe.org2007 Europe Data 18
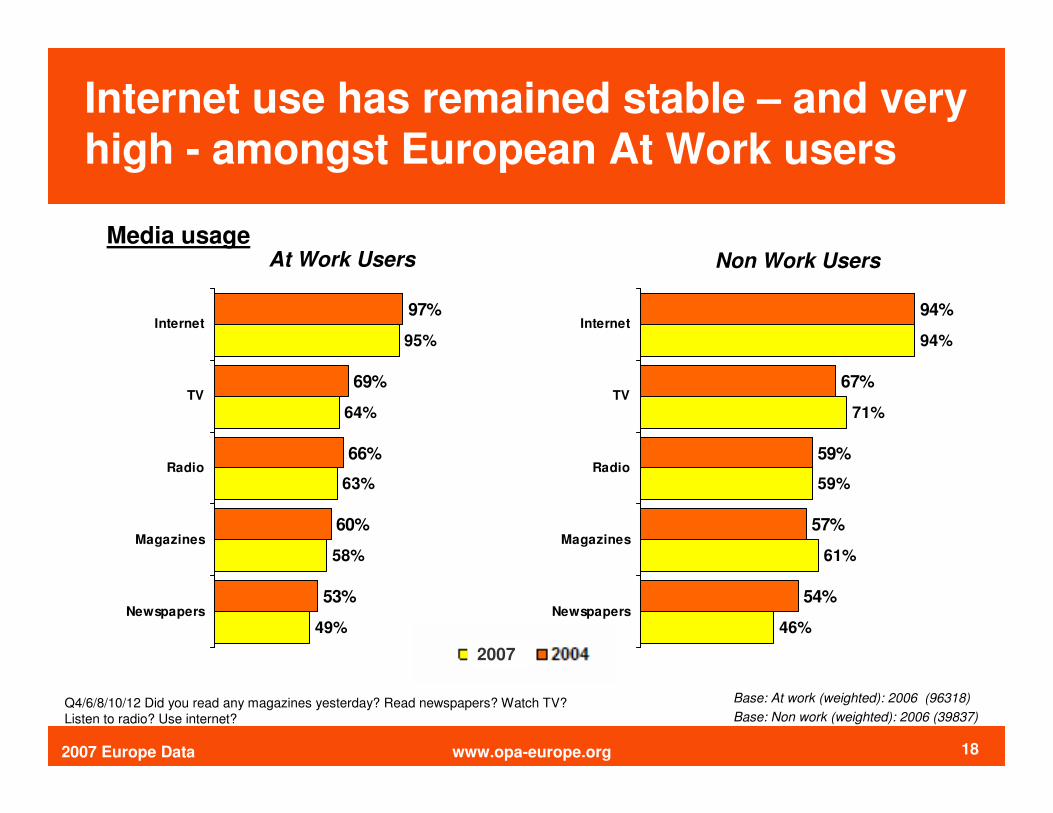
Internet use has remained stable – and very high - amongst European At Work users
49%
58%
63%
64%
95%
53%
60%
66%
69%
97%
Newspapers
Magazines
Radio
TV
Internet
46%
61%
59%
71%
94%
54%
57%
59%
67%
94%
Newspapers
Magazines
Radio
TV
Internet
At Work Users Non Work Users
Q4/6/8/10/12 Did you read any magazines yesterday? Read newspapers? Watch TV?
Listen to radio? Use internet?
Media usage
Base: At work (weighted): 2006 (96318)
Base: Non work (weighted): 2006 (39837)
2007

www.opa-europe.org2007 Europe Data 19
16% 15%
25%20%
29%
69%
38%
13%
6% 4%
12%8%
11%
75%
25%
3%0%
10%
20%
30%
40%
50%
60%
70%
80%
90%
100%
Morning
6.00 - 9.00
Daytime
9.00-12.00
Daytime II
12.00-16.30
Early
Fringe
16.30-18.00
Early
Fringe II
18.00 19.00
Primetime
19.00-23.00
Late Fringe
23.00-1.00
Late Night
1.00-6.00
TV 2004
TV 2007
TV consumption has dropped in Europe since 2004, except during primetime
Q5. Between which hours did you watch TV yesterday...? Base: At work (weighted): 2006 (61167)
Chart 3 of 5
Total Media Audience by Day Part - At Work Users - TV

www.opa-europe.org2007 Europe Data 20
24%
37%
23%19%
29%
41%
14%
7%
16%
24% 25%
16% 16%
30%
9%
2%0%
10%
20%
30%
40%
50%
60%
70%
80%
90%
100%
Morning
6.00 - 9.00
Daytime
9.00-12.00
Daytime II
12.00-
16.30
Early
Fringe
16.30-
18.00
Early
Fringe II
18.00
19.00
Primetime
19.00-
23.00
Late Fringe
23.00-1.00
Late Night
1.00-6.00
Magazines 2004
Magazines 2007
Magazine reading has mainly dropped throughout the day in Europe
Q7. Between which hours did you read magazines yesterday...? Base: At work (weighted): 2006 (56275)
Chart 2 of 5
Total Media Audience by Day Part - At Work Users - MAGAZINES
www.opa-europe.org2007 Europe Data 21
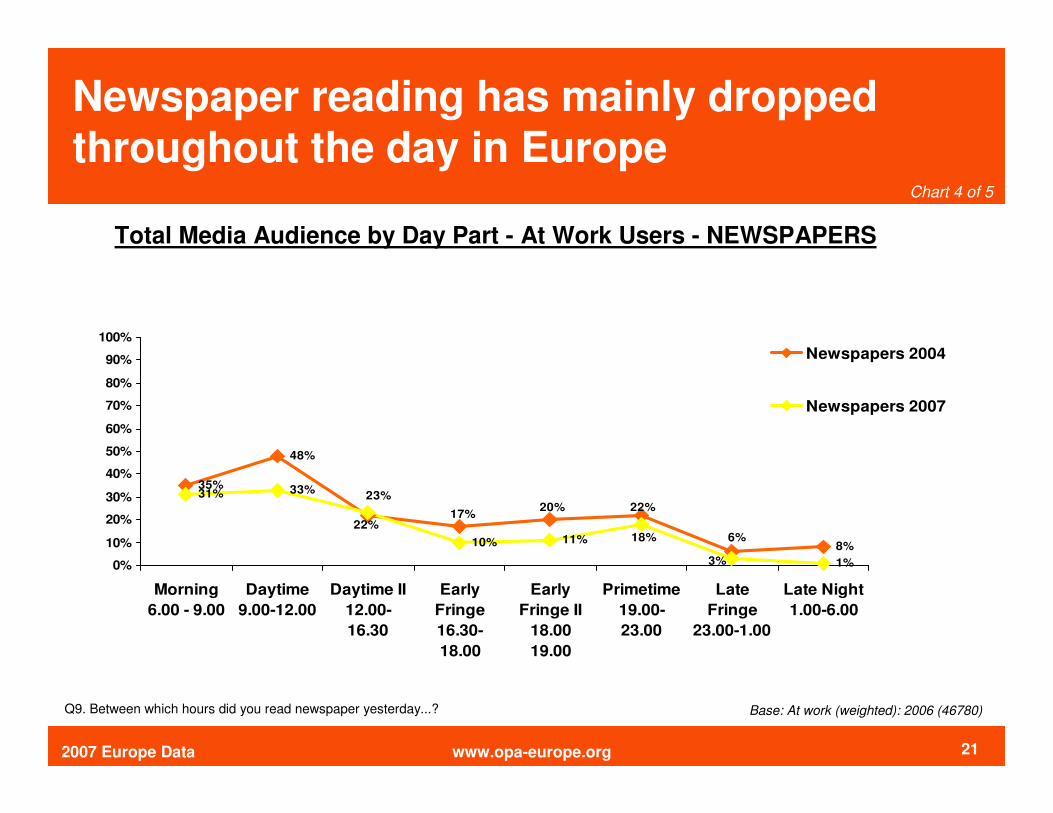
35%
48%
8%
31% 33%
10% 11%
1%
6%
22%20%17%
22%
3%
18%
23%
0%
10%
20%
30%
40%
50%
60%
70%
80%
90%
100%
Morning
6.00 - 9.00
Daytime
9.00-12.00
Daytime II
12.00-
16.30
Early
Fringe
16.30-
18.00
Early
Fringe II
18.00
19.00
Primetime
19.00-
23.00
Late
Fringe
23.00-1.00
Late Night
1.00-6.00
Newspapers 2004
Newspapers 2007
Newspaper reading has mainly dropped throughout the day in Europe
Q9. Between which hours did you read newspaper yesterday...? Base: At work (weighted): 2006 (46780)
Chart 4 of 5
Total Media Audience by Day Part - At Work Users - NEWSPAPERS

www.opa-europe.org2007 Europe Data 22
66%
44%
29%32%
38%
32%
15%10%
54%
30%
23%20% 20% 21%
8%3%
0%
10%
20%
30%
40%
50%
60%
70%
80%
90%
100%
Morning
6.00 - 9.00
Daytime
9.00-12.00
Daytime II
12.00-16.30
Early
Fringe
16.30-18.00
Early
Fringe II
18.00 19.00
Primetime
19.00-23.00
Late Fringe
23.00-1.00
Late Night
1.00-6.00
Radio 2004
Radio 2007
Radio listening has dropped significantly throughout the day in Europe
Q11. Between which hours did you listen to the radio yesterday...? Base: At work (weighted): 2006 (60741)
Chart 5 of 5
Total Media Audience by Day Part - At Work Users - RADIO

www.opa-europe.org2007 Europe Data 23
61%
44%
68% 67%
10%
14%
46%
84%
67%
31%
22%
46%
37%
84% 83%
31%
0%
10%
20%
30%
40%
50%
60%
70%
80%
90%
100%
Morning
6.00 - 9.00
Daytime
9.00-12.00
Daytime II
12.00-16.30
Early
Fringe
16.30-18.00
Early
Fringe II
18.00 19.00
Primetime
19.00-23.00
Late Fringe
23.00-1.00
Late Night
1.00-6.00
Internet 2004
Internet 2007
European Internet use still highest in the morning, with a new peak during primetime
Q13. How long did you spend on the Internet (for non-email purposes) yesterday, between...? Base: At work (weighted): 2006 (91824)
Chart 1 of 5
Total Media Audience by Day Part - At Work Users - INTERNET

www.opa-europe.org2007 Europe Data 24
Attitudes toward
Online Advertising
www.opa-europe.org2007 Europe Data 25
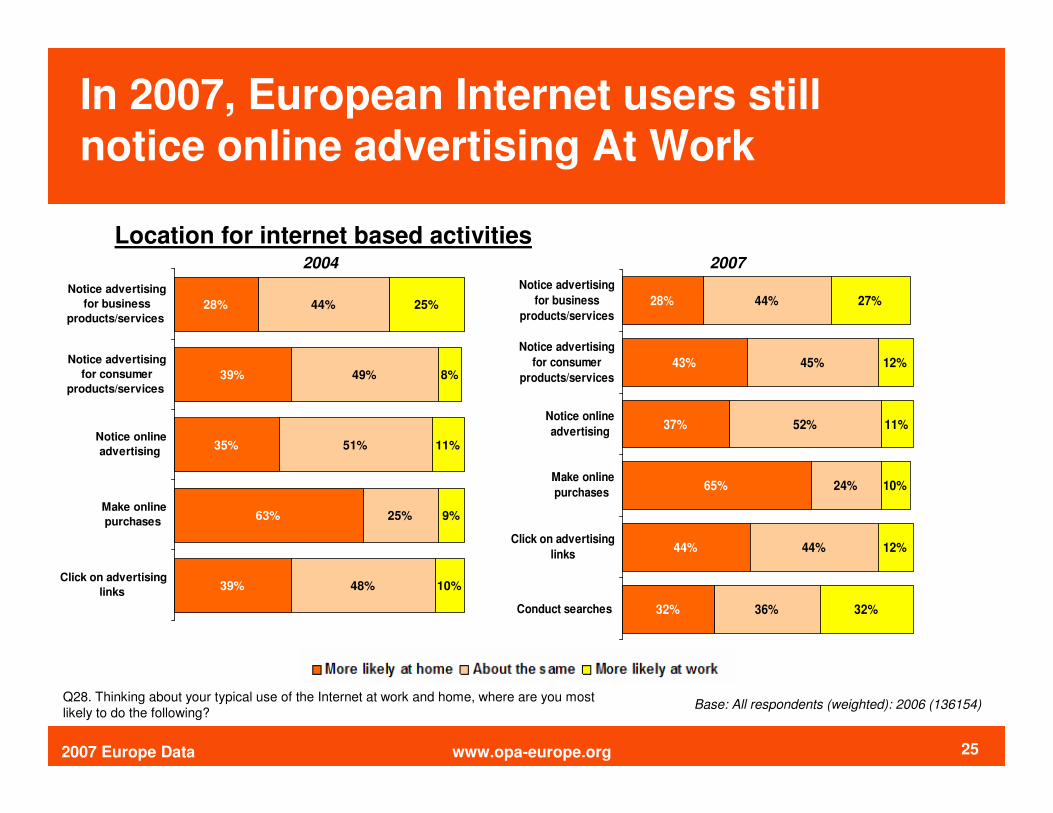
In 2007, European Internet users still notice online advertising At Work
Q28. Thinking about your typical use of the Internet at work and home, where are you most
likely to do the following?
39%
63%
35%
39%
28%
48%
25%
51%
49%
44%
10%
9%
11%
8%
25%
Click on advertising
links
Make online
purchases
Notice online
advertising
Notice advertising
for consumer
products/services
Notice advertising
for business
products/services
32%
44%
65%
37%
43%
28%
36%
44%
24%
52%
45%
44%
32%
12%
10%
11%
12%
27%
Conduct searches
Click on advertising
links
Make online
purchases
Notice online
advertising
Notice advertising
for consumer
products/services
Notice advertising
for business
products/services
2004 2007
Base: All respondents (weighted): 2006 (136154)
Location for internet based activities

www.opa-europe.org2007 Europe Data 26
2%
4%
11%
14%
48%
1%
3%
10%
13%
52%
Radio
TV
Magazines
Newspapers
Internet
2%
8%
18%
8%
57%
2%
8%
18%
19%
48%
Radio
TV
Magazines
Newspapers
Internet
Chart 1 of 4
Q26. Please give your impressions of advertising you see on each of the following media.
For each statement select all the media types you think apply
Preferences for advertising aspects by media type
European At Work users largely prefer the Internet for new product information…
Base: At work users (weighted): 2006 (96318)
2007
Where I prefer to receive information about
companies
Where I prefer to find out about new
products
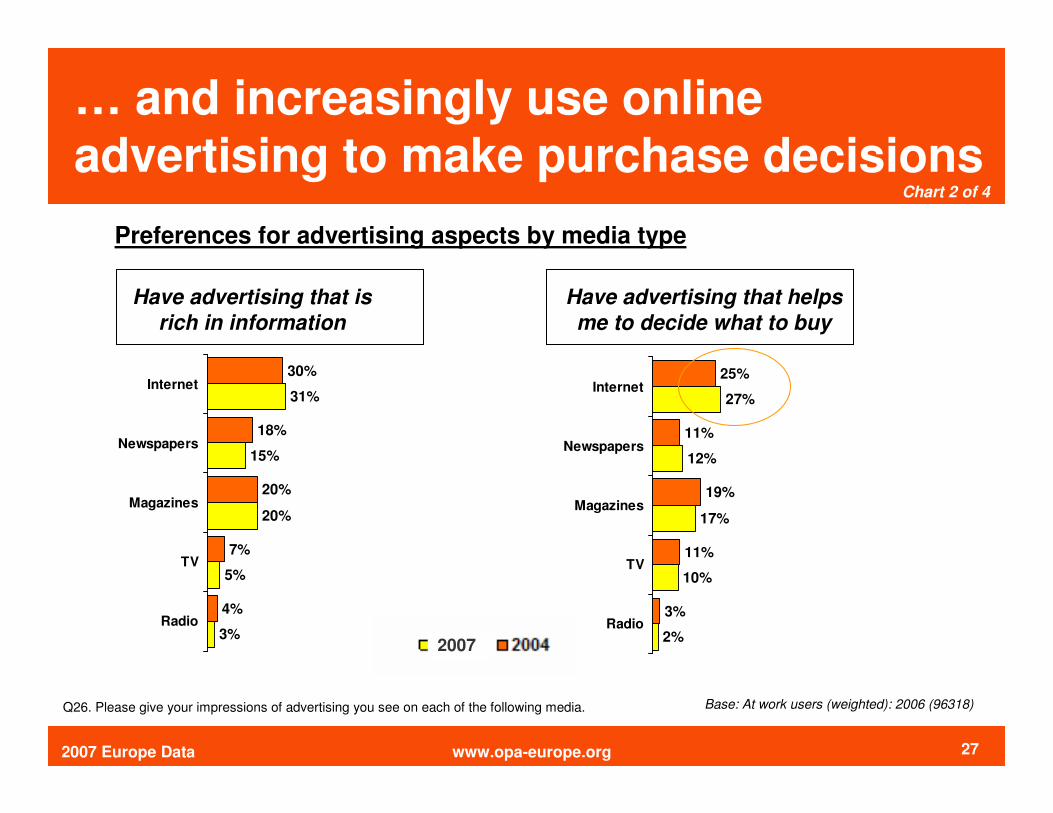
www.opa-europe.org2007 Europe Data 27
3%
5%
20%
15%
31%
4%
7%
20%
18%
30%
Radio
TV
Magazines
Newspapers
Internet
2%
10%
17%
12%
27%
3%
11%
19%
11%
25%
Radio
TV
Magazines
Newspapers
Internet
Chart 2 of 4
Q26. Please give your impressions of advertising you see on each of the following media.
Preferences for advertising aspects by media type
… and increasingly use online
advertising to make purchase decisions
Base: At work users (weighted): 2006 (96318)
2007
Have advertising that is
rich in information
Have advertising that helps
me to decide what to buy

www.opa-europe.org2007 Europe Data 28
28%
68%
36%
21%
38%
35%
61%
34%
23%
53%
Radio
TV
Magazines
Newspapers
Internet
9%
40%
10%
6%
8%
10%
44%
13%
7%
8%
Radio
TV
Magazines
Newspapers
Internet
Chart 3 of 4
Q26. Please give your impressions of advertising you see on each of the following media.
Preferences for advertising aspects by media type
European At Work users more tolerant
of online advertising than in 2004…
Base: At work users (weighted): 2006 (96318)
2007
Have too much advertising
Have advertising I remember for a long time

www.opa-europe.org2007 Europe Data 29
Have interesting
advertising
6%
20%
21%
10%
22%
8%
27%
21%
11%
19%
Radio
TV
Magazines
Newspapers
Internet
Chart 4 of 4
Q26. Please give your impressions of advertising you see on each of the following media.
Preferences for advertising aspects by media type
European At Work users find online advertising more interesting than any other
Base: At work users (weighted): 2006 (96318)
2007

www.opa-europe.org2007 Europe Data 30
Conclusions – online advertising reaches a high potential client base At Work
• Media consumption habits have definitively
changed – Internet now dominates daytime AND primetime media consumption in Europe
• Visiting news and information sites is the number one reason European “At Work” users
access the Internet
• Internet advertising considered the most
innovative, informative and relevant
www.opa-europe.org2007 Europe Data 31
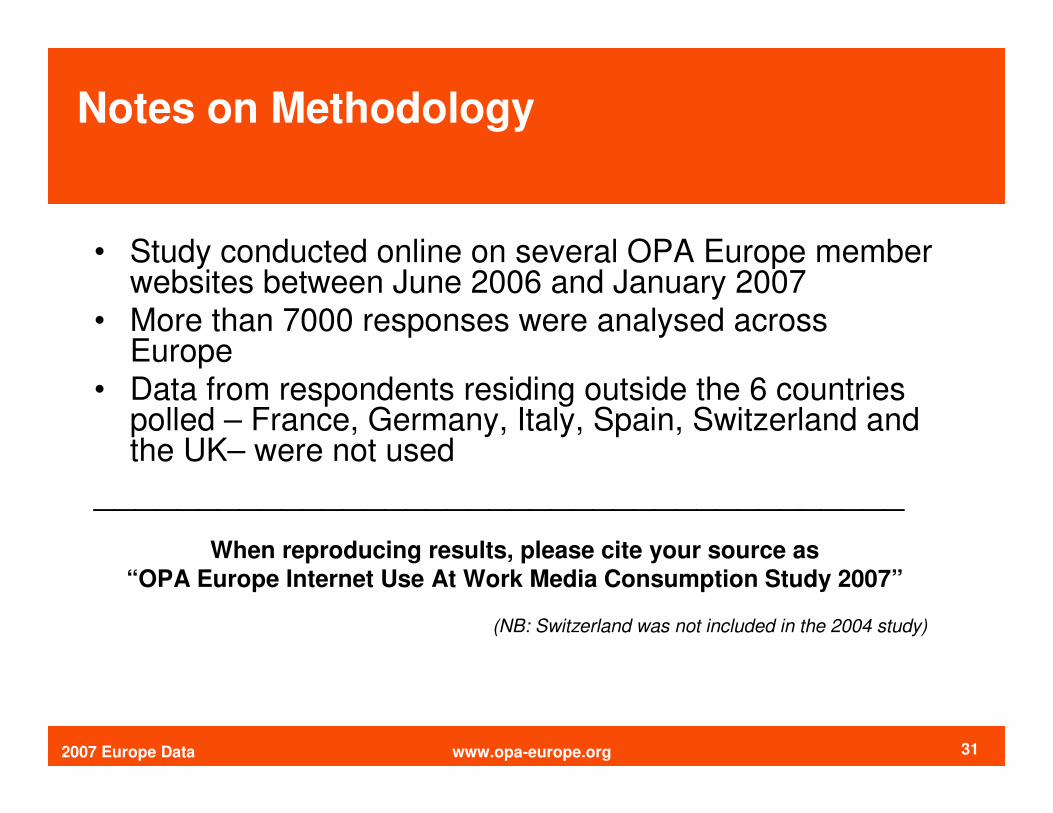
Notes on Methodology
• Study conducted online on several OPA Europe member websites between June 2006 and January 2007
• More than 7000 responses were analysed across Europe
• Data from respondents residing outside the 6 countries polled – France, Germany, Italy, Spain, Switzerland and the UK– were not used
_______________________________________
When reproducing results, please cite your source as
“OPA Europe Internet Use At Work Media Consumption Study 2007”
(NB: Switzerland was not included in the 2004 study)
www.opa-europe.org2007 Europe Data 32
For more information on the
Internet At Work Media Consumptionstudy, please visit
www.opa-europe.org


