Internet Intrusions: Internet Intrusions: Global Characteristics Global Characteristics and Prevalence and Prevalence Presented By: Zhichun Li Presented By: Zhichun Li Using slides from Vinod Yegneswaran’s presentation at SIGMETRICS 20
Transcript
Internet Intrusions: Internet Intrusions: Global Characteristics Global Characteristics and Prevalenceand Prevalence
Presented By: Zhichun LiPresented By: Zhichun Li
Using slides from Vinod Yegneswaran’s presentation at SIGMETRICS 2003
OverviewOverview
Data SourcesData Sources Intrusion CharacteristicsIntrusion Characteristics
– Port and source DistributionPort and source Distribution Projection to the global address Projection to the global address
spacespace Implications of Shared InformationImplications of Shared Information
– Does information sharing help?Does information sharing help?– How much information is needed?How much information is needed?
GoalsGoals
This papers aims to:This papers aims to: Show the volume of intrusions Show the volume of intrusions
attemptsattempts Show the distribution of intrusionsShow the distribution of intrusions
– In terms of both source and victimIn terms of both source and victim Show the impact of various scan Show the impact of various scan
typestypes Expand findings to the global scopeExpand findings to the global scope
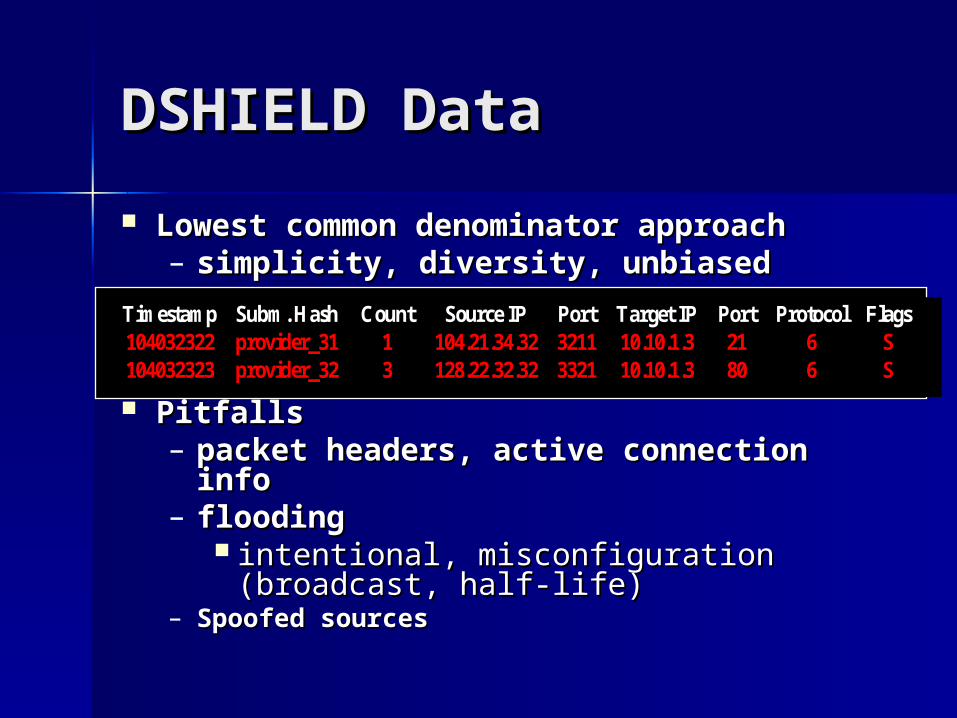
Data SourcesData Sources
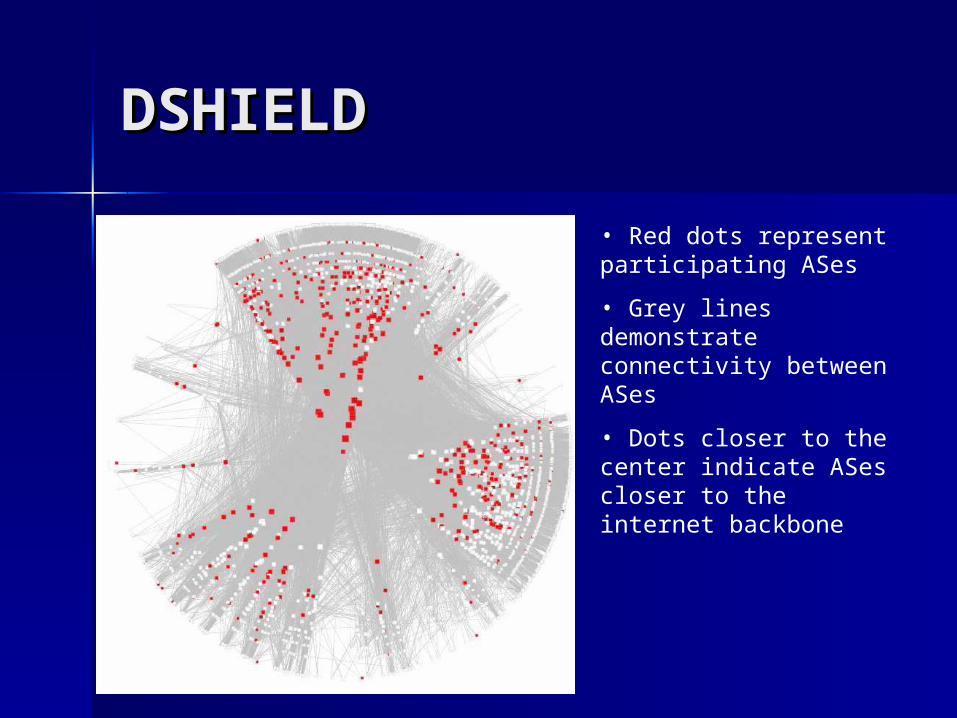
To extend the findings to the global To extend the findings to the global scope, the data must:scope, the data must:
Come from many ASesCome from many ASes Be spread both geographically Be spread both geographically
and over the IP address spaceand over the IP address space
DSHIELDDSHIELD
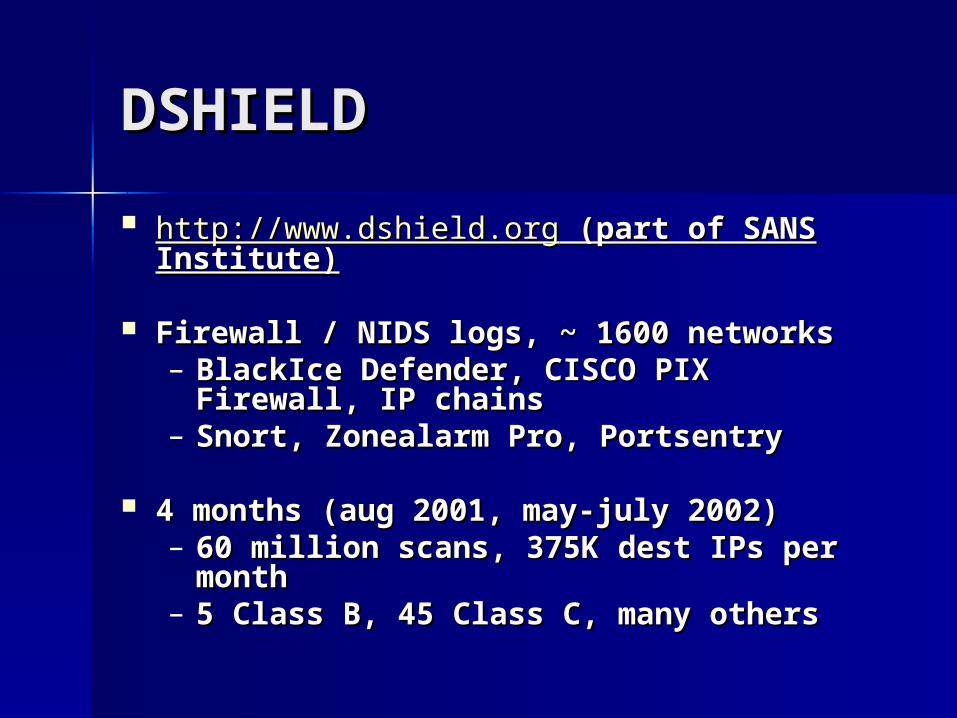
http://www.dshield.orghttp://www.dshield.org (part of SANS (part of SANS Institute)Institute)
Vertical ScanVertical Scan– Multiple ports on 1 victim by 1 sourceMultiple ports on 1 victim by 1 source
Horizontal ScanHorizontal Scan– 1 port on multiple victims by 1 source1 port on multiple victims by 1 source
Coordinated ScansCoordinated Scans– Multiple sources aimed at a /24 spaceMultiple sources aimed at a /24 space
Stealth ScansStealth Scans– Horizontal or verticalHorizontal or vertical– Characterized by a very low frequencyCharacterized by a very low frequency
Intrusion Intrusion CharacteristicsCharacteristics Port DistributionPort Distribution
– Monitor the destination port for Monitor the destination port for intrusion attemptsintrusion attempts
Source DistributionSource Distribution– Look for trends in the source Look for trends in the source
address associated with intrusionsaddress associated with intrusions– Group intrusions into port 80, port Group intrusions into port 80, port
1433, and non-worm scans1433, and non-worm scans
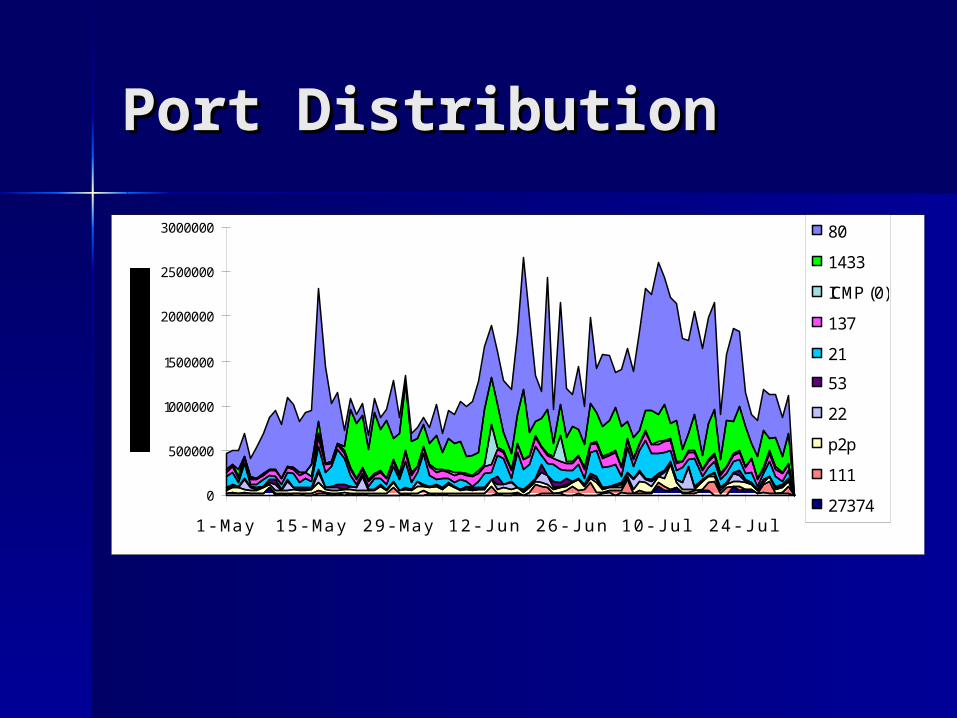
Port DistributionPort Distribution
0
500000
1000000
1500000
2000000
2500000
3000000
1-May 15-May 29-May 12-Jun 26-Jun 10-Jul 24-Jul
80
1433
ICMP (0)
137
21
53
22
p2p
111
27374
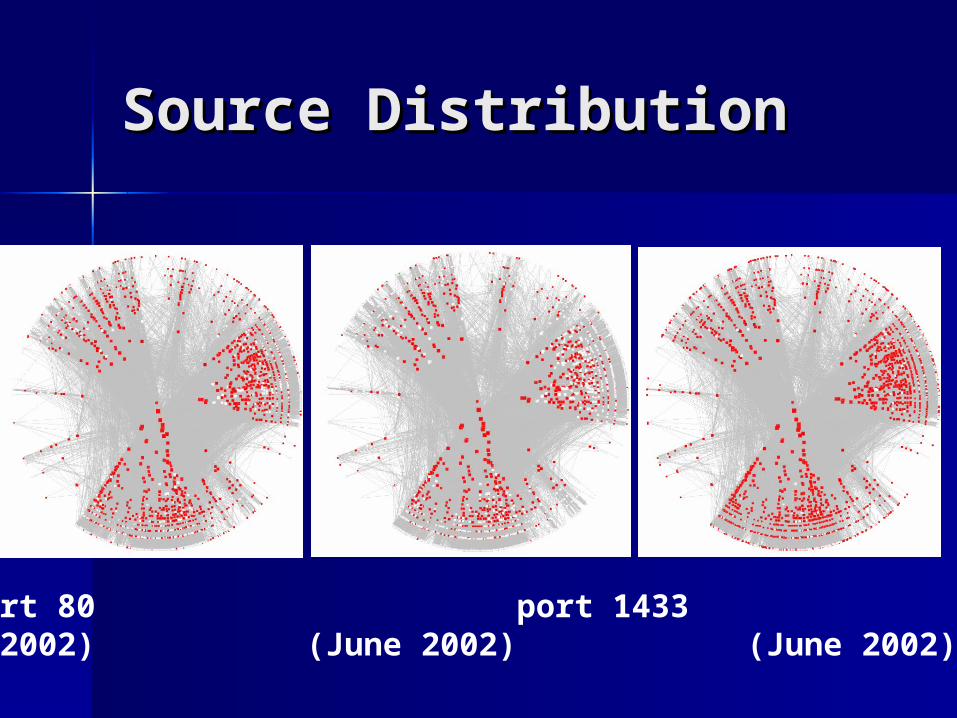
Source DistributionSource Distribution
port 80 port 1433 non-worm (June 2002) (June 2002) (June 2002)
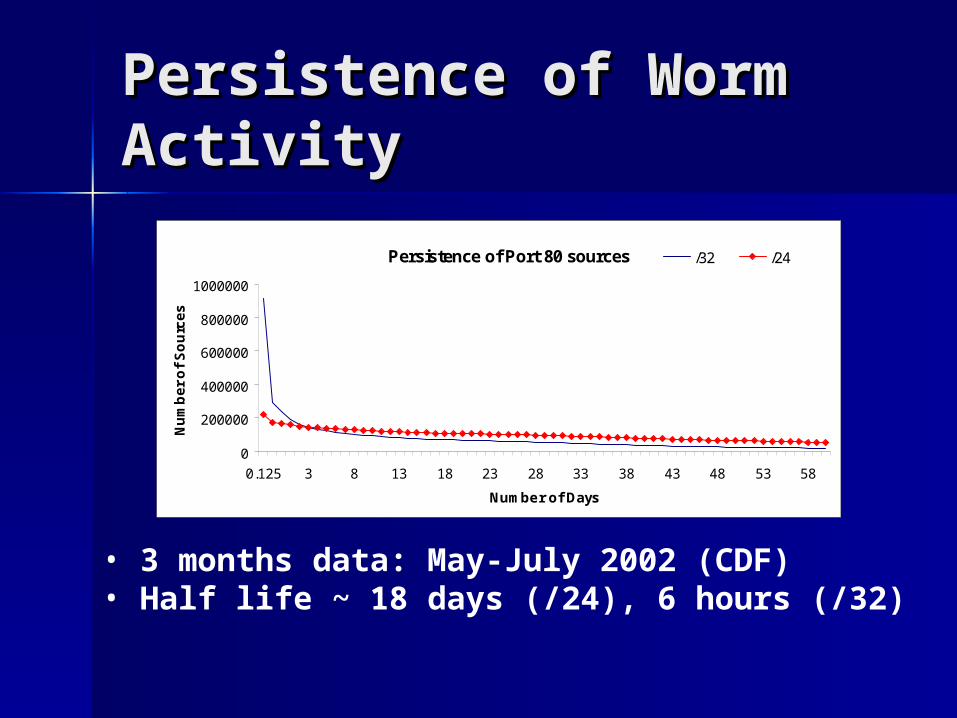
Persistence of Worm Persistence of Worm ActivityActivity
Persistence of Port 80 sources
0
200000
400000
600000
800000
1000000
0.125 3 8 13 18 23 28 33 38 43 48 53 58
Number of Days
Nu
mb
er
of
So
urc
es
/32 /24
• 3 months data: May-July 2002 (CDF)• Half life ~ 18 days (/24), 6 hours (/32)
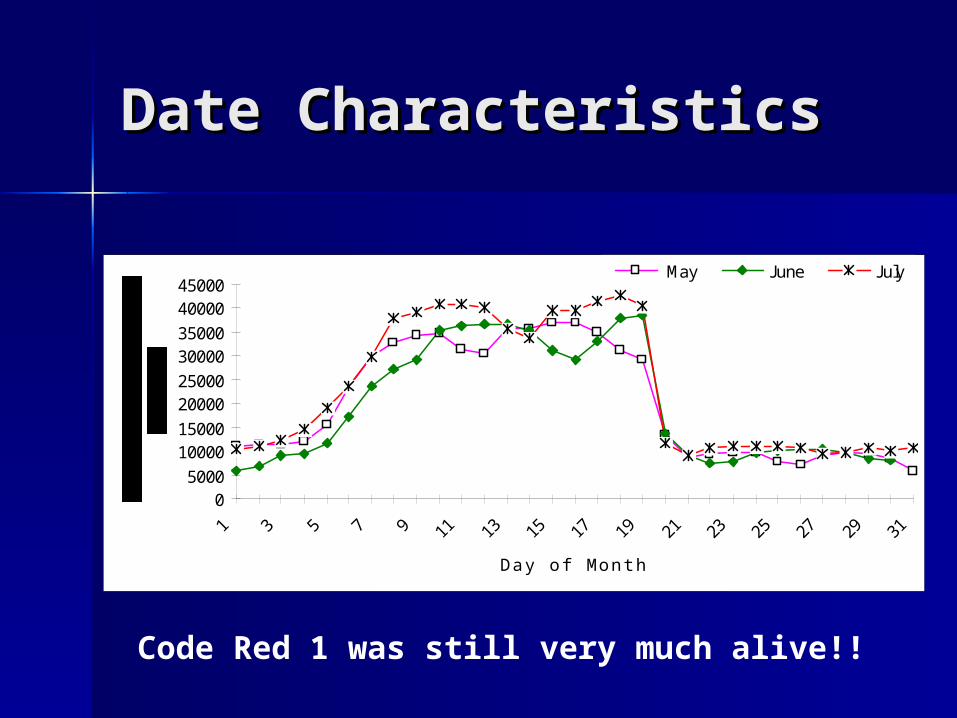
Date CharacteristicsDate Characteristics
05000
1000015000
2000025000
3000035000
4000045000
1 3 5 7 9 11 13 15 17 19 21 23 25 27 29 31
Day of Month
May June July
Code Red 1 was still very much alive!!
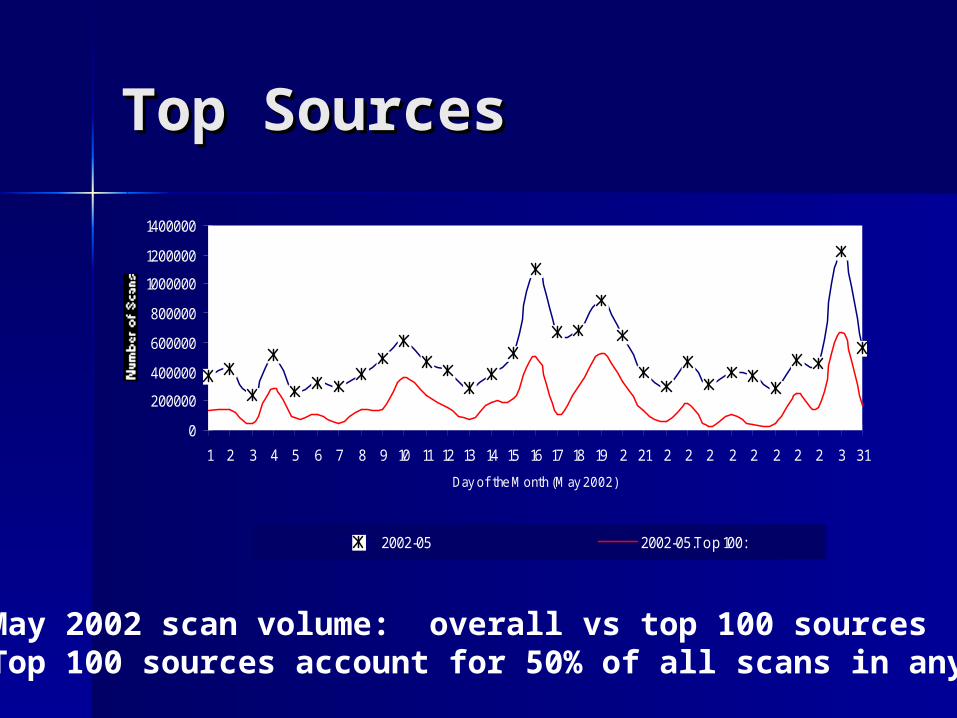
Top SourcesTop Sources
Mainly applies to non-worm scansMainly applies to non-worm scans Results will show that only a few Results will show that only a few
sources are responsible for a sources are responsible for a significant amount of the scanssignificant amount of the scans– Zipf DistributionZipf Distribution
Argument for a blacklistArgument for a blacklist
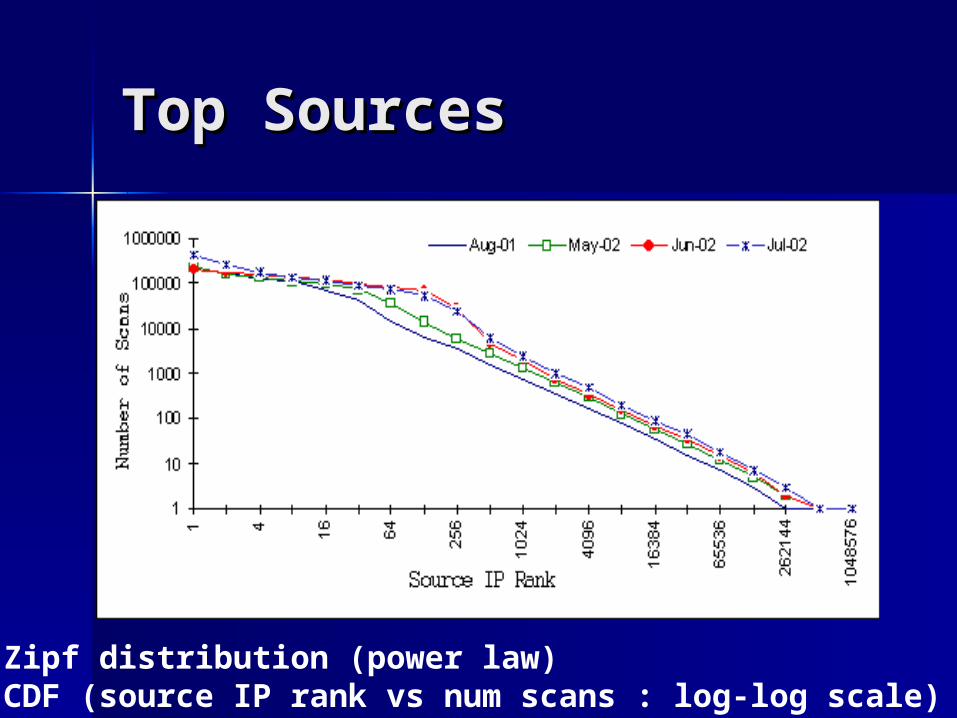
Top SourcesTop Sources
• Zipf distribution (power law)• CDF (source IP rank vs num scans : log-log scale)
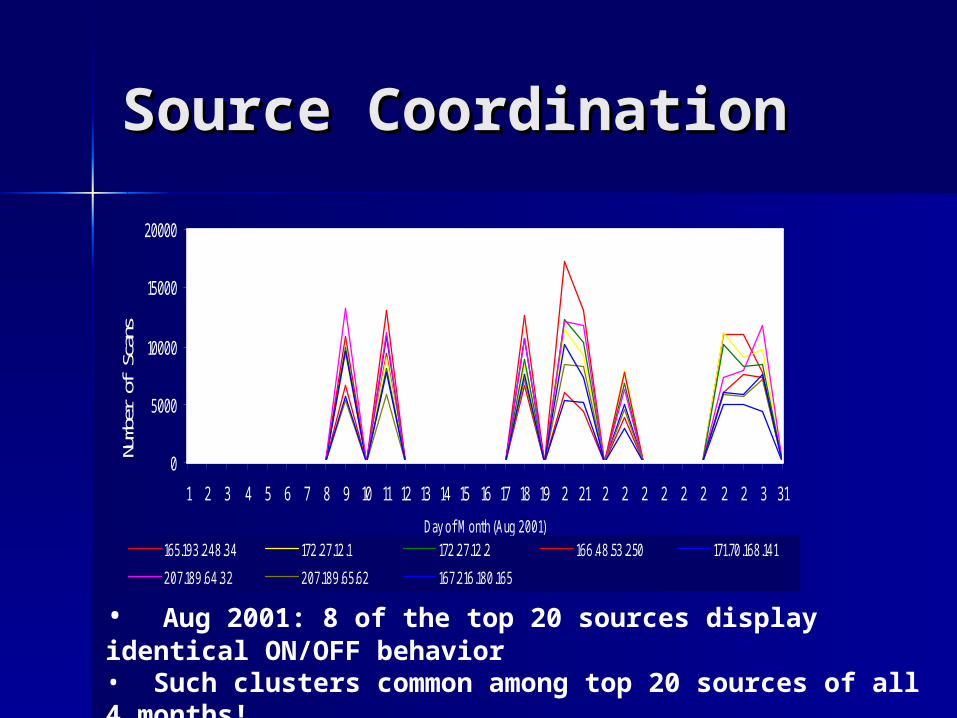
• Aug 2001: 8 of the top 20 sources display identical ON/OFF behavior• Such clusters common among top 20 sources of all 4 months!• All sources scan more than 5 distinct /16s.
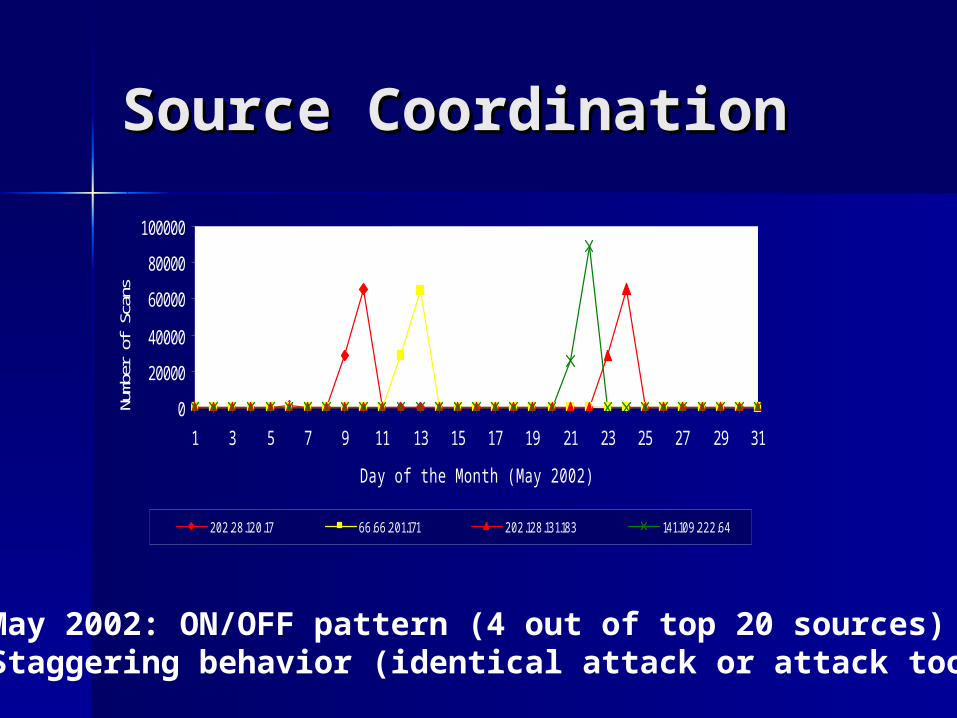
• May 2002: ON/OFF pattern (4 out of top 20 sources)• Staggering behavior (identical attack or attack tool)
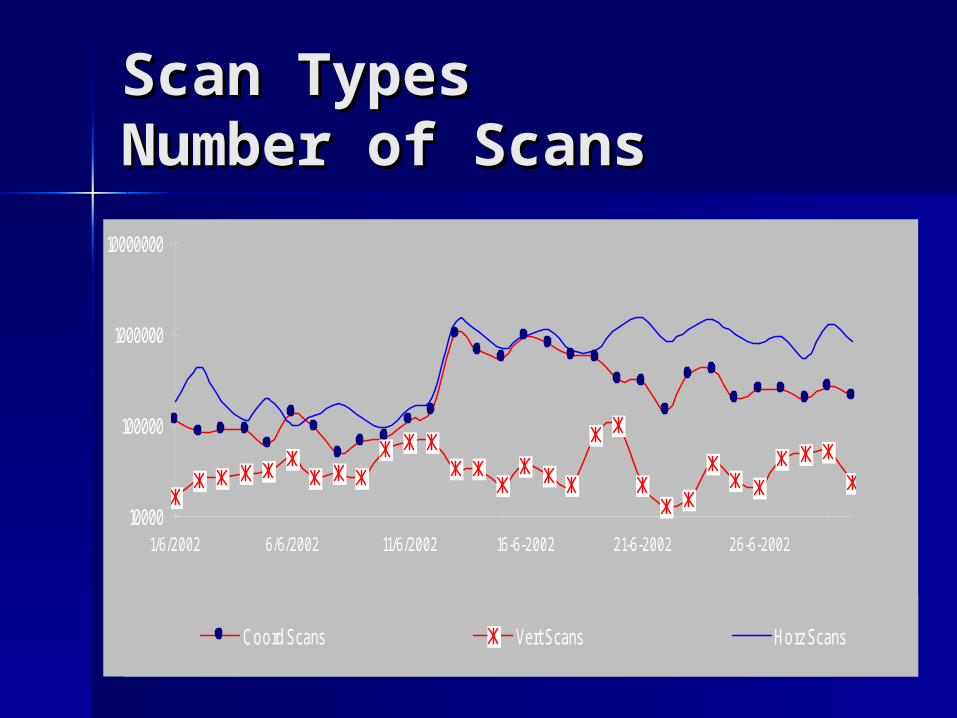
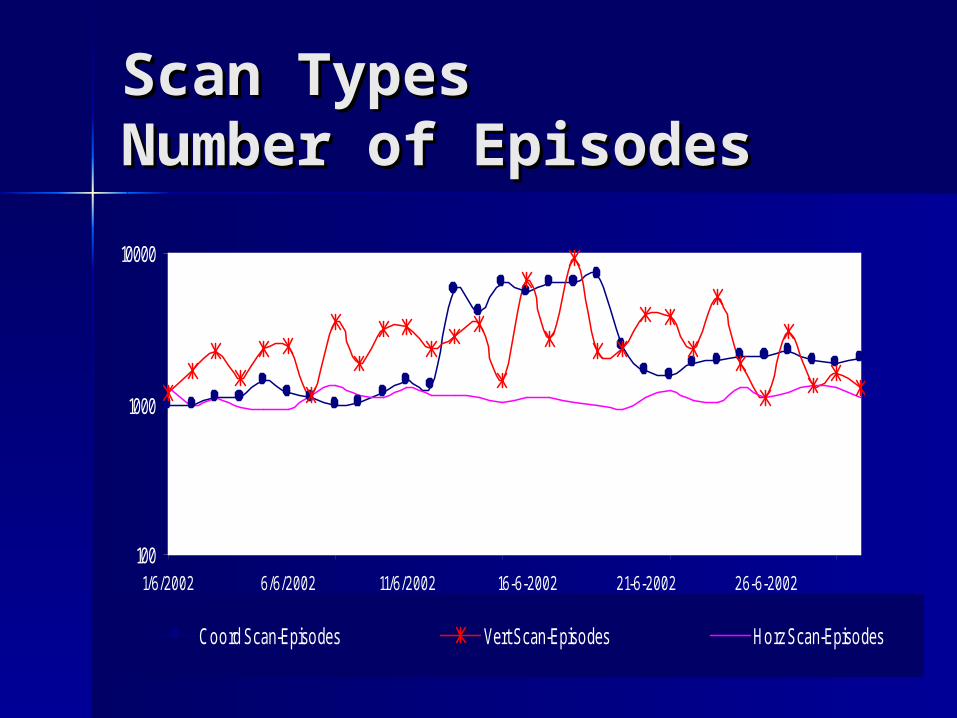
Identification of Scan Identification of Scan TypesTypes Still look at only non-worm scansStill look at only non-worm scans Horizontal scans make up the majority Horizontal scans make up the majority
of the scansof the scans More vertical scan episodesMore vertical scan episodes Surprisingly high number of Surprisingly high number of
coordinated scanscoordinated scans Stealth scans occur much less Stealth scans occur much less
frequently, but are usually vertical frequently, but are usually vertical scansscans
Scan TypesScan TypesNumber of ScansNumber of Scans
Coord Scan-Episodes Vert Scan-Episodes Horz Scan-Episodes
Global ProjectionsGlobal Projections
Question: How has the scanning Question: How has the scanning trend changed over the past year?trend changed over the past year?– Must extend the data to the entire Must extend the data to the entire
internetinternet Simply average the data and Simply average the data and
multiply by 2multiply by 23232
– Possible because data comes from a Possible because data comes from a broad range of sourcesbroad range of sources
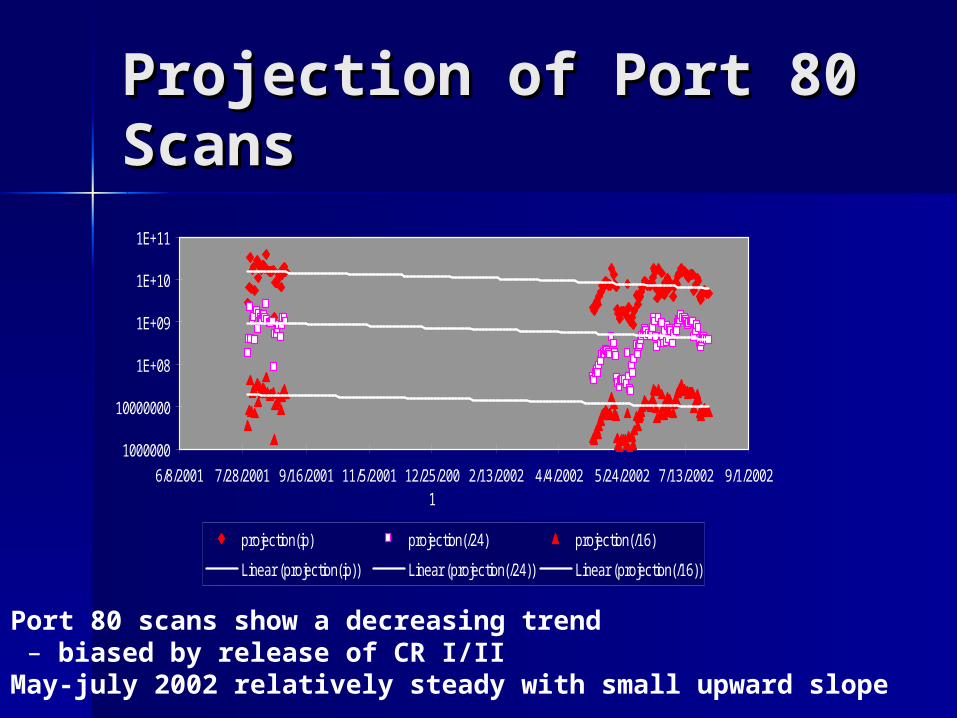
Projection of Port 80 Projection of Port 80 ScansScans
1000000
10000000
1E+08
1E+09
1E+10
1E+11
6/8/2001 7/28/2001 9/16/2001 11/5/2001 12/25/2001
2/13/2002 4/4/2002 5/24/2002 7/13/2002 9/1/2002
projection(ip) projection(/24) projection(/16)
Linear (projection(ip)) Linear (projection(/24)) Linear (projection(/16))
• Port 80 scans show a decreasing trend– biased by release of CR I/II
• May-july 2002 relatively steady with small upward slope
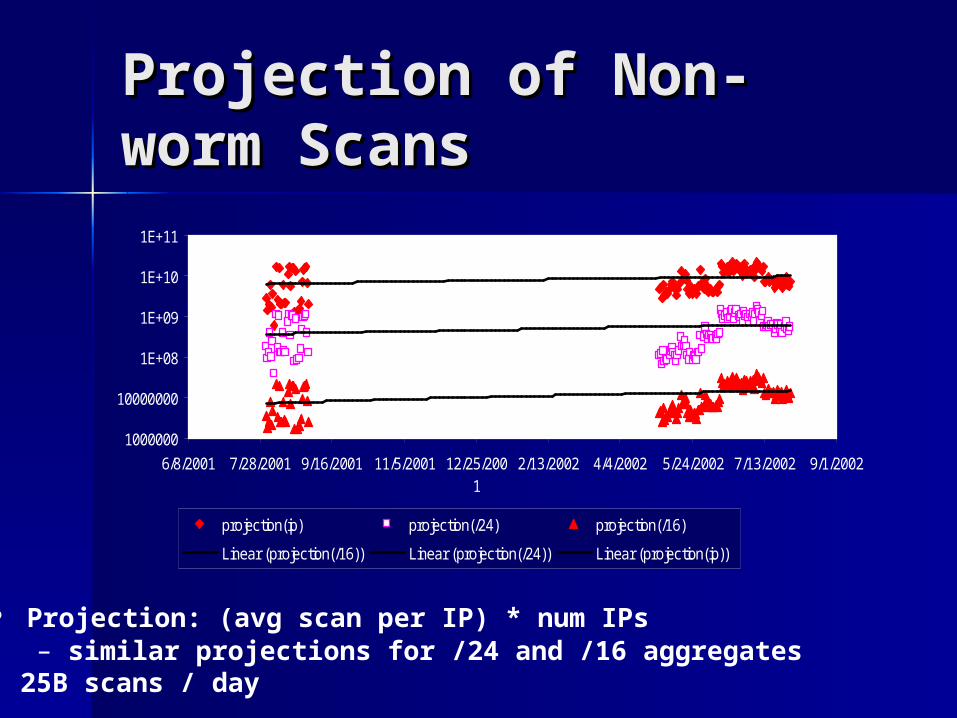
Projection of Non-Projection of Non-worm Scansworm Scans
1000000
10000000
1E+08
1E+09
1E+10
1E+11
6/8/2001 7/28/2001 9/16/2001 11/5/2001 12/25/2001
2/13/2002 4/4/2002 5/24/2002 7/13/2002 9/1/2002
projection(ip) projection(/24) projection(/16)
Linear (projection(/16)) Linear (projection(/24)) Linear (projection(ip))
• Projection: (avg scan per IP) * num IPs– similar projections for /24 and /16 aggregates
• 25B scans / day
Implications of Shared Implications of Shared InformationInformation Many have looked to pool Many have looked to pool
resourcesresources Do not identify speed of attacksDo not identify speed of attacks Can gain a view of trends in Can gain a view of trends in
attacks, thoughattacks, though
Information Theoretic Information Theoretic ApproachApproach Relative EntropyRelative Entropy – measure of the – measure of the
distributional similarity between distributional similarity between two variablestwo variables
Marginal Utility Marginal Utility – amount of – amount of information gained by adding information gained by adding more samplesmore samples
Information Theoretic Information Theoretic ApproachApproach Goal – how much does adding Goal – how much does adding
intrusion logs improve the intrusion logs improve the resolution of identifying “worst resolution of identifying “worst offenders”offenders”
Can be measured using marginal Can be measured using marginal utilityutility– Number of experiments is the Number of experiments is the
number of logs identifiednumber of logs identified
Evaluation of Marginal Evaluation of Marginal Utility ApproachUtility Approach Use 100 /16’s and 100 /24’s from Use 100 /16’s and 100 /24’s from
the total data setsthe total data sets– Chosen at randomChosen at random
Received promising results about Received promising results about the amount gained from adding the amount gained from adding more data setsmore data sets
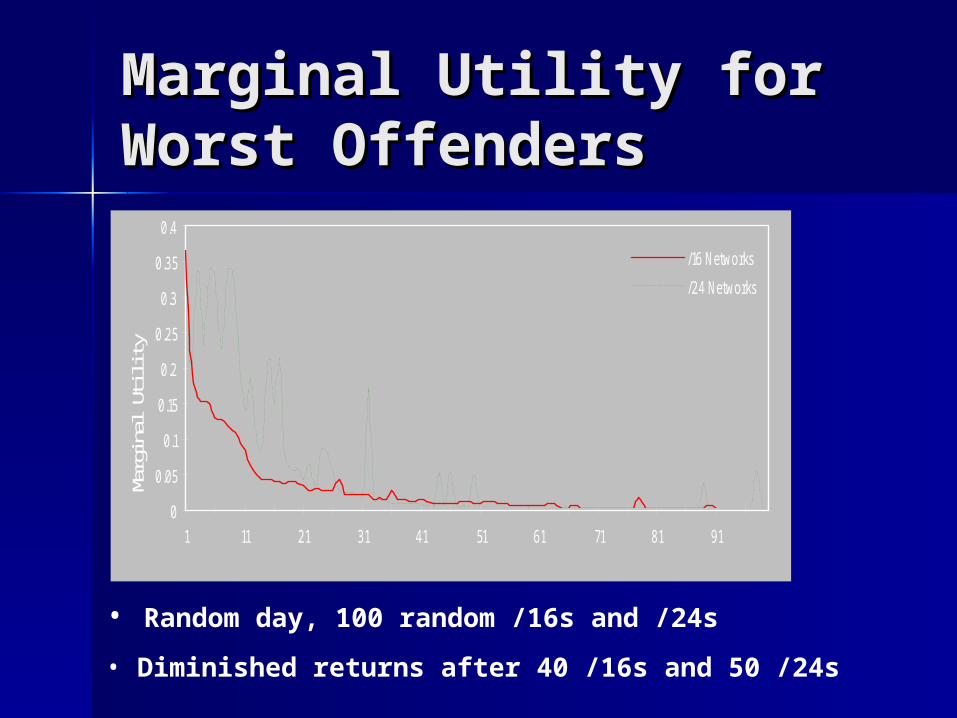
Marginal Utility for Marginal Utility for Worst OffendersWorst Offenders
0
0.05
0.1
0.15
0.2
0.25
0.3
0.35
0.4
1 11 21 31 41 51 61 71 81 91
Marg
inal
Uti
lity
/16 Networks
/24 Networks
• Random day, 100 random /16s and /24s
• Diminished returns after 40 /16s and 50 /24s
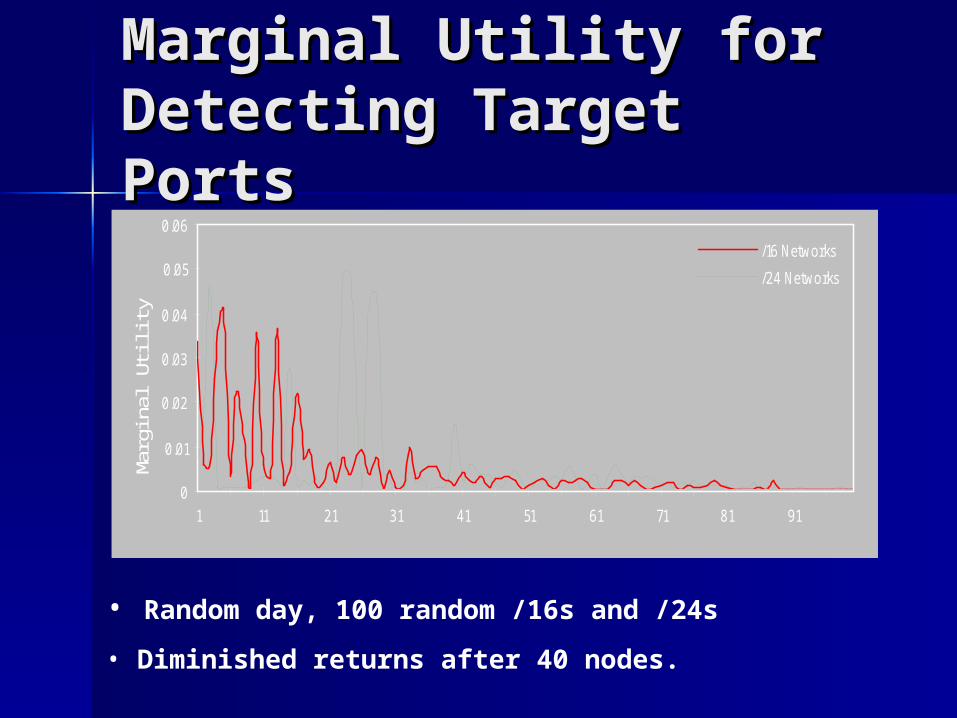
Marginal Utility for Marginal Utility for Detecting Target PortsDetecting Target Ports
0
0.01
0.02
0.03
0.04
0.05
0.06
1 11 21 31 41 51 61 71 81 91
Marg
inal
Uti
lity
/16 Networks
/24 Networks
• Random day, 100 random /16s and /24s
• Diminished returns after 40 nodes.
ConclusionConclusion
A lot of scanning directed away from A lot of scanning directed away from port 80port 80– 25B scans per day, 25% non port 8025B scans per day, 25% non port 80
A set of worst offenders does exist who A set of worst offenders does exist who are responsible for a lot of the are responsible for a lot of the scanningscanning
Combining data from multiple sites Combining data from multiple sites gives more informationgives more information– Data from larger sites is more usefulData from larger sites is more useful
Backup for discussionBackup for discussion
Data biasData bias– Different platforms: BlackIce Different platforms: BlackIce
Defender, CISCO PIX, ZoneAlarm, Defender, CISCO PIX, ZoneAlarm, Linux IPchains, Portsentry and SnortLinux IPchains, Portsentry and Snort
– 1600 firewall/NIDS across geography 1600 firewall/NIDS across geography and IP spaceand IP space
Internet Intrusion vs. Internet Intrusion vs. ScanScan Scan is the most common and Scan is the most common and
versatile type of intrusionversatile type of intrusion Normally, before compromising Normally, before compromising
hackers need to use scan to find hackers need to use scan to find out venerability out venerability
From scans we can know the From scans we can know the attempts from hackersattempts from hackers
spoof bouncespoof bounce
Up to now, not widely usedUp to now, not widely used Although we cannot track where Although we cannot track where
you send the scan packet but still you send the scan packet but still can track the receiver or sensor.can track the receiver or sensor.
Known existing tools: Idlescan Known existing tools: Idlescan
projection of whole projection of whole InternetInternet Pretty rough but should workPretty rough but should work The set of provider networks are The set of provider networks are
reasonably well distributed (both reasonably well distributed (both geographically and over the IP geographically and over the IP space)space)
Using the routable IP space from Using the routable IP space from BGP table should be a better plan.BGP table should be a better plan.
Information sharing Information sharing vs. privacyvs. privacy What shared are scanning What shared are scanning
attempts, which may be attempts, which may be malicious, so share them malicious, so share them normally won’t hurt people’s normally won’t hurt people’s privacy. privacy.
We also may build in BGP like We also may build in BGP like policy control into information policy control into information sharing.sharing.
scan episodesscan episodes
The scans sent by one attackerThe scans sent by one attacker
100 16's and 100 24’s100 16's and 100 24’s
DSHIELD Data set: 5 Class B, 45 DSHIELD Data set: 5 Class B, 45 Class C, many othersClass C, many others
Here the 100 16’s is 100 /16 Here the 100 16’s is 100 /16 prefix, although only 5 is full.prefix, although only 5 is full.
SSame thing for 100 24’same thing for 100 24’s
Scan SpeedScan Speed
Stealth scanStealth scan– Internal between scans should less Internal between scans should less
180seconds.180seconds. horizontal scans and vertical horizontal scans and vertical
scansscans– 1 hour is the upper bound1 hour is the upper bound– NNormal time interval is much less.ormal time interval is much less.
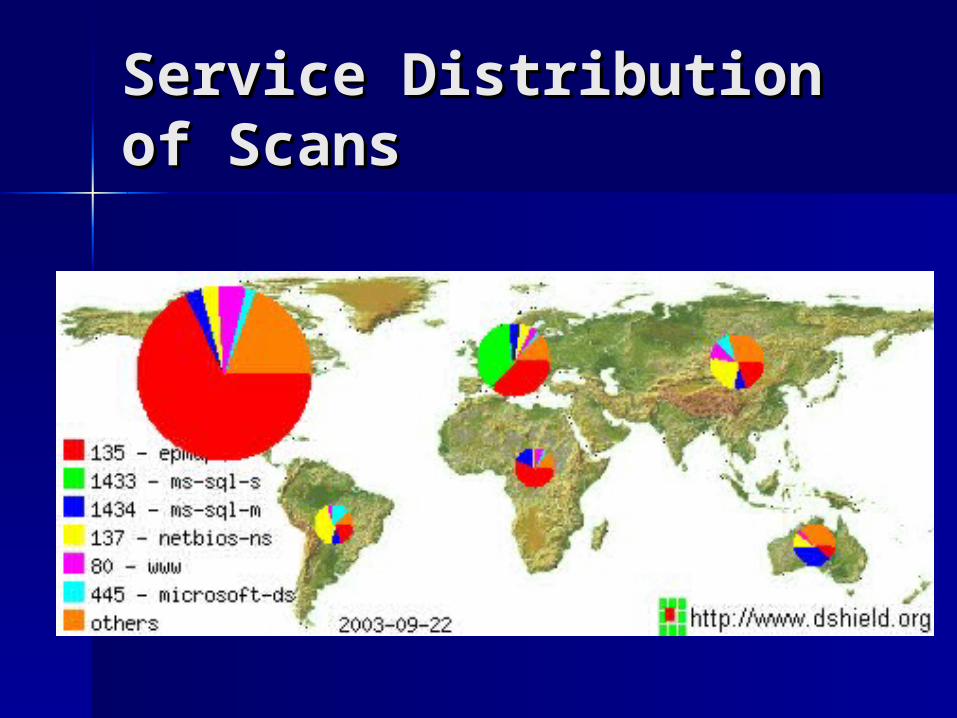
Service Distribution of Service Distribution of ScansScans