48
1

1

2

3
Interoperability of Mobile Devices for Crisis Management
Outcomes of the 1st JRC ECML Crisis Technology Workshop on Mobile Interoperability for International Field Deployment, 12-13 March 2012
Markus Rester,
Tom De Groeve,
Alessandro Annunziato,
Daniele Galliano,
Andreas Hirner,
Luca Vernaccini,
Stefano Paris
EUROPEAN COMMISSION JOINT RESEARCH CENTRE Institute for the Protection and Security of the Citizen
Global Security and Crisis Management
11 May 2012

4
1 Executive Summary .................................................................................................................................... 6
1.1 Outcomes .......................................................................................................................................... 6
1.2 Status-Quo and Further Development Needs ................................................................................... 7
1.3 Process for developing systems ........................................................................................................ 7
2 Workshop and Experiment Overview ........................................................................................................ 8
2.1 Scenario and Storyline ....................................................................................................................... 8
2.2 Workflow ........................................................................................................................................... 8
2.3 Technical Framework Requirements ................................................................................................. 9
2.3.1 Data Exchange Formats ................................................................................................................. 9
2.3.2 Shared Map of eOSOCC in ECML ................................................................................................... 9
2.3.3 Feed Validation ............................................................................................................................ 11
2.3.4 Categorization, Tagging, and Keywords ...................................................................................... 11
3 Evaluation Scope ...................................................................................................................................... 11
4 Outcomes of the Experiment ................................................................................................................... 12
4.1 Technical Interoperability: Theory .................................................................................................. 12
4.2 Technical Interoperability: Practice ................................................................................................. 12
4.3 Experiment: Field Team Observations ............................................................................................ 13
4.4 Experiment: OSOCC Situation Assessment Results ......................................................................... 15
4.4.1 Situation Assessment Outcome by eOSOCC ................................................................................ 15
4.4.2 Incoming Feeds of Mobile Systems ............................................................................................. 21
4.4.3 Situation Assessment Outcome by pOSOCC ............................................................................... 24
4.4.4 Comparison of Situation Assessments: eOSOCC vs. pOSOCC ..................................................... 26
4.4.5 Discussion of Experiment Outcomes (Hot Wash-Up) .................................................................. 28
4.5 Panel / Group Discussion: Assessment of Technological Interoperability ...................................... 30
4.5.1 Panel / Group Discussion Outcome ............................................................................................. 30
4.6 Panel / Focus Group Discussion: Assessment of Utility of Mobile Systems for OSOCCs ................ 32
4.6.1 Panel / Group Discussion Outcome ............................................................................................. 32
5 Recommendations ................................................................................................................................... 35
5.1 Status-Quo and Further Development Needs ................................................................................. 35
5.2 Process for developing systems ...................................................................................................... 35
6 Acknowledgements .................................................................................................................................. 36
7 Annex A: Participating Systems ................................................................................................................ 37
7.1.1 Alice by Astri Polska Sp. z o.o., Warszawa, Poland ...................................................................... 37
7.1.2 ASIGN/GEO-PICTURES by AnsuR, Fornebu, Norway ................................................................... 37
7.1.3 EpiCollect by Imperial College, London, United Kingdom ........................................................... 38
7.1.4 Field Reporting Tool (FRT) by JRC, Ispra, Italy ............................................................................. 38
7.1.5 GINA System by GINA Software s.r.o., Czech Republic ............................................................... 39
7.1.6 iGDACS by JRC, Ispra, Italy ........................................................................................................... 39
7.1.7 Open Data Kit by University of Washington and Google (presented by UN WFP) ..................... 40
8 Annex B: System Set Up / System Customization Form ........................................................................... 41
9 Annex C: Field Experience Form – Mobile Device Usage ......................................................................... 42
10 Annex D: Field Experience Form – Paper Based Information Collection ................................................. 43
11 Annex E: Marker template for providing information to be collected by field teams ............................. 44
12 Annex F: Overview Map of Placed Markers and NO GO Zones ............................................................... 45
13 Annex G: OSSOC Instructions and Templates .......................................................................................... 46

5
Figure 1: System of systems overview. ........................................................................................................... 10
Figure 2: Map viewer used by eOSOCC in ECML. Web based applications of three participating systems.... 10
Figure 3: Map viewer application used by eOSOCC showing all 7 final feeds. ................................................ 15
Figure 4: Process of information collection and briefing material production by three eOSOCC leaders.. .... 16
Figure 5: Situation map prepared for briefing by eOSOCC.............................................................................. 18
Figure 6: Priority needs prepared for briefing by eOSOCC. ............................................................................. 19
Figure 7: Plan of action prepared for briefing by eOSOCC. ............................................................................. 20
Figure 8: Number of incoming information in the feeds by system. .............................................................. 22
Figure 9: Number of incoming information in the feeds by system. Normalized by number of devices. ...... 22
Figure 10: Total cumulative number of incoming information to be handled in the eOSOCC. ...................... 23
Figure 11: Process of information collection and mapping in pOSOCC.. ........................................................ 24
Figure 12: Situation map prepared by pOSOCC also used for briefing. .......................................................... 25
Table 1: Supported data exchange formats. ..................................................................................................... 9
Table 2: Systems overview -- Supported formats and communication channels. .......................................... 12
Table 3: Systems overview - Additional functionality on server-side application........................................... 12
Table 4: Overview of final feeds by system. .................................................................................................... 17
Table 5: Major differences between eOSOCC and pOSOCC maps .................................................................. 26
Table 6: Minor differences between eOSOCC and pOSOCC maps .................................................................. 27

6
1 Executive Summary
The 1st JRC ECML Crisis Technology Workshop on Mobile Interoperability for International Field Deployment
(ACRIMAS Pilot Case) took place in the European Crisis Management Laboratory (ECML) of the Joint
Research Centre in Ispra, Italy, from 12 to 13 March 2012. 37 participants attended the workshop. They
were coming from: 11 EU countries and Norway, Brazil and US, 3 UN agencies, and 2 NGOs.
The workshop's purpose was to measure the added value of mobile assessment technology for rapid
situation assessment in international emergency operations. Seven mobile assessment systems were
deployed among the participants and needed to provide, in an interoperable way, real-time data to a single
electronic On-Site Operations Coordination Centre (eOSOCC). The performance of the systems was
benchmarked against a traditional paper-based assessment that was conducted simultaneously (pOSOCC).
The following systems participated in the experiment with active attendance of the respective technology
providers, except Open Data Kit which was set up ad hoc by a participant:
• Alice by Astri Polska Sp. z o.o., Warszawa, Poland
• ASIGN/GEO-PICTURES by AnsuR, Fornebu, Norway
• EpiCollect by Imperial College, London, United Kingdom
• Field Reporting Tool (FRT) by JRC, Ispra, Italy
• GINA System by GINA Software s.r.o., Czech Republic
• iGDACS by JRC, Ispra, Italy
• Open Data Kit by University of Washington and Google, USA
The field experiment took place on the JRC site in Ispra. 42 Markers were placed over an area of
approximately 550000 m2. The clearly visible markers only contained a numerical ID and a verbal
description of the situation encountered on the placed location. The eOSOCC received real-time
information from the field teams via the feed URLs provided by the technology providers. All participating
systems were able to provide either GeoRSS or KML feeds. All information streams appeared in the eOSOCC
on a single map utilizing OpenLayers.
The evaluation of the experiment was done collaboratively by practitioners, field experts, strategic level
personnel working with national and international headquarters of civil protection and crisis management,
and JRC staff.
1.1 Outcomes
In general, the experiment was a success: all data feeds reached the eOSOCC, all teams left on time, and
there were no major problems during the field exercise. Devices were able to use either GPRS/3G or were
able to utilize the available WiFi network hotspots on site to transfer their data.
The final map with all incoming feeds in the eOSOCC was very cluttered due the great number of devices,
field teams, and different systems. The eOSOCC team leaders reported that there was considerable
information overload. As much as 328 entities of information (placemarks, tracks, polygons, etc.) were
simultaneously streamed to the eOSOCC. Therefore sophisticated editing, filtering, and visualization
functionalities (e.g., multiple views) have to be available for OSOCC staff.

7
By the time the first teams arrived back from the field, most information had been processed and was
available on a summarized situation map. The eOSOCC team then converted the available information in a
priority list and action items. After each team leader was consulted to confirm and correct information, the
eOSOCC was ready for presentation, including an electronic map and action documents.
The pOSOCC leaders used the A0 map they produced for presentation and they had an overview of the
priorities which they marked also with post-it notes. They did not prepare any documents in writing to be
shared or communicated.
Both paper and electronic OSOCC reached similar situation awareness. The final map based briefing
material is almost identical with very few exceptions. Interestingly both OSOCC teams made mistakes with
regard to the exact positions. The mistakes of the eOSOCC team made in transferring accurate data to the
briefing material underline the need for an OSOCC software suite covering the whole workflow of
procedures essential in OSOCC operations.
The outcomes showed that both paper and electronic OSOCCs reached a similar situation awareness in the
same time, identifying similar needs and locations for prioritization, but only the eOSOCC had products
available as sharable electronic maps and documents. The pOSOCC would need at least 30 minutes to come
to the same result. The other advantage of the eOSOCC was the possibility to monitor a situation changing
over time and the possibility to keep track of the situation (awareness) evolution.
1.2 Status-Quo and Further Development Needs
Mobile technology is mature and can be deployed in an interoperable way. However, as soon as it comes to
interoperable sharing, the information of each and every system leaves the proprietary applications for
processing and analyzing the data. Therefore, processing tools and training to these are needed.
The main impression from the eOSOCC team was that there is a lot of potential. Having access in real-time
to field information was felt to be extremely useful. However, at the moment tools and procedures are
missing for exploiting this benefit. Most important are tools to curate, filter, manipulate, edit, and delete
assessment information of all teams (i.e. post processing tools). A dedicated OSOCC software suite is
needed that gives full control over the data to OSOCC staff. The participants encouraged a follow-up
workshop after such tools are developed.
1.3 Process for developing systems
The group of practitioners gave some concrete recommendations on how mobile technology can be
improved and integrated in humanitarian operations. They considered workshops like this one an essential
tool, but it is more important to have a dedicated community that has regular activities or meetings on the
topic to keep the momentum of development ongoing. A forum for technology providers to exchange ideas
and products would be also useful. The contribution of practitioners to this dedicated community is of
great importance because only they can ensure the very vital input for a user and task driven development
of proper ICT systems.
Besides physical workshops or exercises, tools like table top exercises and dedicated technical
teleconferences are as important. Gradual integration in Standard Operating Procedures and adaptation of
training curriculums is a way to integrate mature technology in the existing assessment practices of
operational organizations. The more open the architectures and standards of these technologies are, the
likelier is the integration and adaption process.

8
2 Workshop and Experiment Overview
The 1st JRC Crisis Technology Workshop on Mobile Interoperability for International Field Deployment
(ACRIMAS Pilot Case) took place in the European Crisis Management Laboratory (ECML) of the Joint
Research Centre in Ispra, Italy, from 12 to 13 March 2012.
The workshop was co-organised with ACRIMAS, the FP7 project aimed at discussing and testing
coordinated response solutions from crisis managers and first responders across Europe in order to prepare
a large Demonstration Project in crisis management for FP8. One of the tasks of this project was to run a
demonstration of a crisis management situation. This ACRIMAS Pilot Case demonstrated that controlled
experiments are a useful way to assess and advance crisis management technology.
37 participants attended the workshop. They were coming from: 11 EU countries and Norway, Brazil and
US, 3 UN agencies (Office for Coordination of Humanitarian Affairs (OCHA), World Food Programme (WFP)
and Development Programme (UNDP)) and 2 NGOs (MapAction, Technology Sans Frontières).
The workshop's purpose was to measure the added value of mobile assessment technology for rapid
situation assessment in international emergency operations. Seven mobile assessment systems were
deployed among the participants and needed to provide, in an interoperable way, real-time data to a single
electronic On-Site Operations Coordination Centre (eOSOCC). The performance of the systems was
benchmarked against a traditional paper-based assessment that was conducted simultaneously (pOSOCC).
2.1 Scenario and Storyline
A disaster assessment operation must be set up in an international environment. Teams from various
countries arrive on scene, each with their own tools and approaches to assess a situation and communicate
it to a coordination centre. In order to set up a coordinated and integrated operation plan, the On-Site
Operations Coordination Centre (OSOCC) must be able to receive, process, and visualize information from
all teams. The time to agree and set up an interoperable data transmission system must be reduced to a
minimum in order to start the assessment as fast as possible. The focus is on collecting categorized
information to get the "big picture" of the situation.
The simulated situation is comparable to a natural disaster outside the EU. Many teams arrive and one of
the first international organizations being on site coordinates all activities. In this event this role was played
by the UN OCHA team, which has a long experience in this task in real situations. The main objective is the
assessment of a rather stable situation shortly after the event occurred. There are no tactical security
issues like public unrest, riots, or plundering that have to be dealt with.
On 12.03.2012 at 0037 hours local time a major earthquake hit the Varese area. The small town of "JRC
Ispra" was particularly affected. Several buildings probably collapsed and many are likely to be seriously
damaged. There are rumors that some areas and districts are especially struck with massive damages to
houses.
2.2 Workflow
The OSOCC leaders announced the categories of information needed for assessment and planning, e.g.
need for water purification equipment, spotted spontaneous refugee camps. Technology providers then set

9
up their systems as quickly as possible. Customization, configuration, and negotiation on the fly for
interoperability were other key elements in in this exercise.
The assignments of participants to 6 field teams were communicated and the teams deployed to the field
with mobile devices to assess the situation. Participants were teamed up also in interchangeable couples:
one person collected data with the mobile devices and the second recorded the very same data
traditionally. After returning from the field one person went to the eOSOCC and the other reported to the
pOSOCC.
The technology providers had about 15 minutes to train the users of the field teams. This training not only
covered the technological aspects of the system use but also the semantics of the information to be
collected (categories to be used according to OSOCC needs).
Technology providers then joined the field teams thus one mobile device of each of the 7 participating
systems was accompanied or operated by an expert user. Other devices of the same system were assigned
to other field teams and operated by novice users.
The field teams were deployed in different sectors on the JRC site. There they found clearly visible
"markers" on situations they should report (see Annex E: Marker template for providing information to be
collected by field teams). An overview paper map of the locations of the markers was available to all
participants (see Annex F: Overview Map of Placed Markers and NO GO Zones). The two OSOCC teams tried
to make sense of all incoming information and had to draft first steps of action according to their situation
assessment (see Annex G: OSSOC Instructions and Templates).
After all field teams had arrived back and the two OSOCC teams had presented their conclusions, a hot
wash-up discussion focused on the technology issues experienced in the exercise.
2.3 Technical Framework Requirements
2.3.1 Data Exchange Formats
The workshop focused on interoperability of mobile devices for crisis management, so the technological
requirements for exchanging information were a key parameter. The experiment was meant to be as
realistic as possible, i.e. the need for ad hoc collaboration of different teams arriving on the scene with
different systems, and this includes also the team of the eOSOCC with their respective Information and
Communication Technology (ICT) systems. Therefore common and recognized data interchange standards
had to be chosen. All participating systems were able to provide either GeoRSS or KML feeds that were
"consumed" by the eOSOCC (see Table 1).
Standard Reference
GeoRSS simple http://georss.org/simple
KML http://www.opengeospatial.org/standards/kml/
Table 1: Supported data exchange formats.
2.3.2 Shared Map of eOSOCC in ECML
In the eOSOCC all information streams appeared on a single map utilizing OpenLayers. This setup can be
described as a system of systems (see Figure 1).

10
Figure 1: System of systems overview.
The eOSOCC received real-time information from the field teams via the feed URLs provided by the
technology providers. The field area was well covered by GSM networks. In many areas on site it was
possible to utilize hotspots (i.e. open WiFi networks). Communication channels were not the focus of the
experiment so satellite communication was not encouraged.
Beside the shared map there was room for display of mapping systems of the different technology
providers which have different functionality, like filtering etc. For systems displayed on the big wall screen
of the eOSOCC for demonstration purposes a URL to a web based system was needed (see Figure 2). There
was also an interactive whiteboard system available to run proprietary desktop applications, again for
demonstration purposes.
Figure 2: Right side of display: map viewer (http://dma.jrc.it/map/) used by eOSOCC in ECML. Left side shows proprietary web based applications of three participating systems.
eOSOCC Map
Prop. Map 2
Prop. Map 3
Server 1 Server
2 Server 3
KML GeoRSS
Proprietary map displays via HTTP to show extended functionality
Prop.
Display 1

11
2.3.3 Feed Validation
Technology providers have been asked in advance to check whether their feeds are valid by checking it with
a validator, e.g. http://googlemapsapi.blogspot.com/2007/06/validate-your-kml-online-or-offline.html or
http://www.feedvalidator.org/. Also the map application at http://dma.jrc.it/map/, implementing the
OpenLayers framework, was available to them to check if their feeds are visualized properly in general.
2.3.4 Categorization, Tagging, and Keywords
For the eOSOCC team not only technical but also semantic interoperability is an issue. The readability and
utility of a single map with all incoming streams depends on shared vocabularies or at least negotiated
"translations" of used categorizations. The experiment accounted for this by providing last minute
information on the categories to use before the teams deployed to the field. In case of a KML feed the
technology providers are in control of the symbols. Being able to adapt to the requested information help
the OSOCC team in sense-making considerably. In case of GeoRSS either the system is adaptable to provide
the required tagging or the meaning of the used tags has to be negotiated with the eOSOCC. Requested
information categories by the OSOCC leaders were:
Needs (e.g., water, shelter)
Infrastructure (e.g., status of buildings)
Danger / Hazards (e.g., contamination, HazMat)
The following systems participated in the experiment with active attendance of the respective technology
providers (see Annex A: Participating Systems for short system descriptions, product URLs, and screenshots
of server side / desktop applications):
Alice by Astri Polska Sp. z o.o., Warszawa, Poland
ASIGN/GEO-PICTURES by AnsuR, Fornebu, Norway
EpiCollect by Imperial College, London, United Kingdom
Field Reporting Tool (FRT) by JRC, Ispra, Italy
GINA System by GINA Software s.r.o., Czech Republic
iGDACS by JRC, Ispra, Italy
In addition, there was an ad hoc participation of a seventh system. United Nations World Food Programme
utilizes Open Data Kit (ODK) and this system was set up by a participant of UN WFP on the fly and joined
the experiment as well:
Open Data Kit by University of Washington and Google, USA
3 Evaluation Scope
The evaluation of the experiment was done collaboratively by practitioners, field experts, strategic level
personnel working with national and international headquarters of civil protection and crisis management,
and JRC staff. This ensured real, down-to-earth criticism on the usefulness of mobile systems and their
interoperability and fosters the validity of the results. The planned scope of evaluation of the
interoperability experiment conducted during the workshop was threefold:
1. Technical aspects of interoperability: What is the status quo of participating systems, what are the
shortcomings, and what future development needs have to be tackled?

12
2. Utility of mobile devices in the assessment and planning phases of crisis management: Added value
or just more complexity?
3. Towards adaption of mobile devices for crisis management by authorities: What are the needs and
requirements of authorities, how are they met by current systems, and what actions are needed to
drive an adaption process?
4 Outcomes of the Experiment
4.1 Technical Interoperability: Theory
For the field systems to communicate with the On-Site Operations Coordination Centre (OSOCC) well
established standards need to be supported. Table 2 and Table 3 give an overview of the supported data
exchange formats, available communication channels, and additional functionalities of the proprietary
control and administration interfaces of the systems.
System Supported Data Formats for Information Sharing Communication Channels
KML GeoRSS GPX XML
(SOAP) shapefile
WMS/ WFS
GPRS/3G WiFi Satellite
Alice X X X X X X
ASIGN/GEO-PICTURES
X X
API under
development
X X X
Designed for SatCom. Now
adapted to handheld systems.
EpiCollect X X X
GINA X X X X Planned X X X
FRT X X X X X X
iGDACS X X X X X X
ODK X X X
Table 2: Systems overview -- Supported formats and communication channels.
System Additional Functionality of Server-Side / Desktop Application
Alice Moderate Layers (Content) depending on user login authentication; Turning on/off predefined symbols; Events history managment; Import new layers (static or dynamic ones)
ASIGN/GEO-PICTURES
Filter, Sort, Edit, Send, Download, Mission Administration, etc.1
EpiCollect Filter, Edit, Chart Views, Project Administration
GINA Mission Control; Content, Tasks and Needs Management; Reporting; History Browsing
FRT Voice Annotations in the Field, Automatically Print Report, Read Out Loud Support
iGDACS Add Data (Digitizing)
ODK Visualize, Export, Publish
Table 3: Systems overview - Additional functionality on server-side application.
4.2 Technical Interoperability: Practice
Technology providers tested their feeds with the map application available in the ECML (see section Feed
Validation). The time needed for modification of systems to provide compatible feeds - OpenLayers is very
strict in what is accepted in streams - was reported by the system providers:
1 Available for PC (Mac, Windows, Linux) and Mobile (Android, iPhone).
Extensive list of features includes: rapid mapping, interface to satellite EO data ordering, project management, tracking, dynamic survey templates, receiver functions, send to many, send via email, sms, ftp or dedicated receivers, pre-written captions, server can adjust / correct positions, category and priority settings for all photos, supports video clips, zoom in on regions of interest in full resolution, can integrate to various map/GIS servers, minimizes bandwidth requirements, robust design and protocols for poor links, operational for years and used in missions. Ready to apply.

13
Epicollect, FRT, iGDACS, ODK: No time needed. KML is supported natively by default.
ASIGN/GEO-PICTURES: Feeds needed minor changes to be processed by DMA map application.
Alice: Adjustments were already made for previous JRC workshop. One more day was needed for
additional changes.
Gina: Small KML modifications were necessary. The definition of proper layers and the installation
of Ispra map data took only minutes.
After the OSOCC introduced the scenario to field teams, all systems had to be set up to share the collected
information with the eOSOCC. In addition, the system had to be customized to support the information
needs of the eOSOCC. This often included the definition of appropriate assessment forms to collect the
required data or the introduction of agreed tags to categorize the collected information.
Field team members were provided with a form to record relevant observations for these two initial stages
of the experiment (see Annex B: System Set Up / System Customization Form). Unfortunately workshop
participants were very reserved in filling out these forms (return rate 10%, duly filled forms 2,5%). So,
forms proved to be an improper scientific method to gather data for technology assessment in this setting
of senior experts. The few filled forms stated very fast set up times for 3 systems (between 5 to 15 minutes)
and very little expertise needed to get the systems up and running. No further details are given due to the
low return rate.
In general, the experiment was a success: all data feeds reached the eOSOCC, all teams left on time, and
there were no major problems during the field exercise. Devices with no GSM connectivity due to missing
Italian SIM cards were able to utilize the available WiFi networks on site.
4.3 Experiment: Field Team Observations
The field experiment took place on the JRC site in Ispra. 42 Markers were placed over an area of
approximately 550000 m2. The clearly visible markers only contained a numerical ID and a verbal
description of the situation encountered on the placed location (see Annex E: Marker template for
providing information to be collected by field teams). For areas (e.g., possible camp site) a small detail map
gave an indication of the outline. No categories, titles or the like were given. It was part of the experiment
to see how the field teams encoded the given information semantically according to the needs stated by
the OSOCC.
The results of the experiment should not be influenced by the need to search very hard for the markers. In reality information that has to be reported is clearly visible. So the field teams received a very coarse overview map of the places of markers. This map only showed the location of markers giving no other details (see Annex F: Overview Map of Placed Markers and NO GO Zones). Field teams, consisting of members utilizing mobile devices as well as members applying traditional paper based data collection methods, were provided with 2 forms accordingly:
For the mobile device usage a diary was kept recording relevant meta-information on set actions (e.g.,
reporting on markers giving timestamp and marker ID to be able to cross-check their reception) or
usability problems, troubles in semantic encoding of encountered information, etc. (see Annex C: Field
Experience Form – Mobile Device Usage).
For the paper based collection of information there was a simple form just asking for team
identification, timestamp, marker ID, and recorded information. Any meta-comments on the paper
based process were also mentioned on this form which main purpose is to provide uniform artifacts for
the OSOCC as well as for later analysis (see Annex D: Field Experience Form – Paper Based Information
Collection).

14
Whereas the forms for plain data collection were usually used, the feedback forms for problems with the
mobile devices showed a similar return rate as the system setup forms (2,5%). Since it is not valid to derive
any conclusions from this data, it is given here without details of the affected system(s):
Missing ability to cancel a report or delete a photo if taken in error
Missing ability to scroll through the message to add or amend + view before sending
Missing ability to add more than one photo to a report
When viewing the report's location on the map the respective marker should change colour so you
know which one it is
When selecting a report from the map it should show written coordinates in order to be able to pass on
by voice / radio
Too small buttons for people with large hands/fingers
In bad weather conditions device too fragile

15
4.4 Experiment: OSOCC Situation Assessment Results
Two OSOCC assessments were presented at the end of the experiment: one prepared by a team which was
provided with real-time data streams form the different mobile systems (eOSOCC) and the other one
prepared by a team which received the paper based collected data from the field teams after their return
to the respective headquarter (pOSOCC).
4.4.1 Situation Assessment Outcome by eOSOCC
The eOSOCC started receiving data as soon as the teams left the base. Information from all teams was
shown on a single map using real-time feeds, each with the symbols chosen by the system providers who
decided on KML as format for sharing information (7 in total). The icon mapping for one GeoRSS feed –
which per design does not include icon data - was chosen in the dma map viewer application.
The first 30 minutes were spent discussing how to use and process the data. The eOSOCC team could not
fall back on well-trained procedures and had to come up with a way to analyse the information. After few
attempts (including using on-line digitizing), the eOSOCC decided to work in pairs: one person read the
integrated map with all real-time feeds and a second person recorded analyzed information on a
PowerPoint-based map.
The final map of the viewer application with all incoming feeds was very cluttered due the great number of
devices, field teams, and different systems (see Figure 3). Even zooming in to a very detailed level could
only partially ease this because of multiple reports on the very same information by different field teams or
by devices of different systems. The eOSOCC team leaders reported in the hot wash-up after the
experiment and also in the discussion on the next day that there was considerable information overload. Of
course, in reality the likelihood that two teams visit the same spot is much lower than in the exercise. On
the other hand participants discussed that in reality different stakeholders collect and report information
according to their interest. So again for instance the very same building could be reported as searched by
one organization and as providing temporary storage space by another one.
Figure 3: Map viewer application used by eOSOCC showing all 7 final feeds.

16
The integrated map was read by visualizing one feed at the time and hiding the others (see Table 4), to
avoid confusion with symbols. The analysts cycled through the information continuously, trying to keep up
with the new information (not easily distinguished from old information) using a variety of symbols. The
FRT system produced also automatic paper printouts of recorded information while the field team was still
out (see Figure 4). This was useful for understanding and taking notes.
By the time the first teams arrived (at 15:45), most information had been processed and was available on a
summarized situation map in PowerPoint. The eOSOCC team then converted the available information in a
priority list and action items (in PowerPoint tables). Around 16:15, each team leader was consulted to
confirm and correct information. By 16:30, the eOSOCC was ready for presentation, including an electronic
map and action documents.
Figure 4: Process of information collection and briefing material production by three eOSOCC leaders. On the desk next to the keyboard lies an automatic paper printout of the FRT system
used in addition to electronically visualized incoming information.

17
Alice
ASIGN/GEO-PICTURES
EpiCollect
FRT
Gina
iGDACS
ODK
Table 4: Overview of final feeds by system. Base layer satellite map removed to boost data visibility.

18
The process in recording incoming information and generating the final briefing map of the assessed
situation (see Figure 5) can be summarized as follows:
1. All participating mobile systems provided either GeoRSS or KML feeds that were "consumed" by
the eOSOCC.
2. In the eOSOCC all incoming information streams appeared on a single map utilizing OpenLayers.
3. The single map was visualized on a big wall display but could be interacted with also on a desktop
computer.
4. Briefing material was produced according to tasks utilizing the template document (see Annex G:
OSSOC Instructions and Templates).
Figure 5: Situation map prepared for briefing by eOSOCC

19
The eOSOCC team compiled also a list of top and medium priority needs for the briefing on their situation
assessment (see Figure 6). The prioritized list of the necessary steps resulting from their assessment was:
1. Top: Search and rescue of 30 missing and trapped people.
2. Top: WASH, shelter, and food for 600 displaced people.
3. Medium: Health support for 600 displaced people.
4. Medium: Bring in more experts (assessment teams, camp managers, engineer, etc.)
5. Medium: Bring in transportation and equipment.
Figure 6: Priority needs prepared for briefing by eOSOCC.

20
Figure 7: Plan of action prepared for briefing by eOSOCC.
Following the top and medium priorities, a detailed list of assignments to deal with the identified priority
needs was presented (see Figure 7). The assignments not only made use of the given resources from the
provided list of available equipment (see Annex G: OSSOC Instructions and Templates), but also included
available resources and equipment reported by field teams (i.e. intact and well equipped local fire brigade,
food supplies). For Equipment that was neither listed in the available resources nor discovered in the field,
the plan of action requested the bringing in of these resources.
1. Available USAR teams: rescue trapped people
2. Available water purification unit: purify reported water resources
3. Reported fire brigade: assist USAR team at burning building, neutralize gas cylinder risk.
4. Reported food supplies: to be transported to reported camp site.
5. Needed shelter + WASH equipment: to be sent in and set up at camp sites.
6. Needed experts: assessment teams, emergency coordinator, camp managers, engineers for road
assessment.
7. Reported hazards: to be sealed off (contaminated area, blocked roads, collapsed bridge).
Observations of the processes, procedures, and activities in the eOSOCC by note takers of JRC staff included
also the following:
The information represented by the icons on the map (but not shown explicitly) is so important that it
has to be accessible in a much easier way than by clicking through hundreds of small icons.
21
Standardized icons are missing and would help very much in reading and understanding the map.
For processing the incoming information, icons of viewed reports should be faded out or become
transparent to reflect the status of the information.
Drawing functionality in map viewer is missing.
Filter by time functionality in map viewer is missing.
Moderate, delete, flag as important, hide if not important functionalities are missing.
Communication / chat with field teams is missing.
4.4.2 Incoming Feeds of Mobile Systems
The core experiment started around 14:30 when the first field teams left the OSOCC building after the
systems have been set up and the basic user training has been held. Few minutes later the first reports
arrived in the eOSOCC (see Figure 8). The absolute number of information entities by system was of course
influenced by the number of devices in the field for each system (Alice: 3, ASIGN/GEO-PICTURES: 3,
EpiCollect: 3, FRT: 1, Gina: 6, iGDACS: 2, ODK: 1). For a normalized picture see Figure 9. Also the way some
systems encode the recorded information differed significantly. Some used e.g., three <Placemark>
encodings to describe one discovered information by adding shape areas and color shadings as additional
<Placemark> entities.
The Alice system seemingly starts much earlier in providing information. This was due to the fact that the
system providers used it already in the introductory briefing by the OSOCC teams to record e.g., the
directions the 6 field teams should head first to avoid that all field teams report on the very same markers
in the field while other information is never reported. The Alice system can easily record information for
"remote" locations (other than device's actual one) and that was utilized here. This turned out to be a
"wanted" feature as some of the other systems do not support this properly.
Another very noteworthy aspect is the massive spike in the Alice feed between 15:30 and 15:55. These
were 61 placemarks within the area of collapsed high rise buildings. It could either be due to usability
problems, system failure, or user misuse. They were edited (i.e. deleted) as the timestamps suggest
immediately after return from the field. Also the ASIGN/GEO-PICTURES feed was corrected at 16:15 even
though only for 1 entry. Whereas the causes for the irrelevant data points remain unclear it shows one
important fact: direct access to data for modification, updating, or deletion is necessary by all means. From
an interoperability aspect these data control functionalities must not stop at the particular system level but
have also to be available to the OSOCC team that has to deal with many different data input streams.
ODK was set up on the fly during the experiment and installed on one device without connectivity in the
field. Therefore all information became available just after return to the eOSOCC when they were uploaded
to the system server.
Two data series had to be reconstructed using the creation timestamps of the reports in the final feed. This
is considered acceptable because there was good 3G coverage and lots of WiFi hotspots available during
the experiment. In case of Gina there was obviously a problem with the caching script that saved all the
incoming feeds every five minutes. With EpiCollect the reason was quite different. A faulty device on which
the time was not set and therefore was returning data that didn't have associated timestamps. This invalid
data broke the feed. Of course, this problem was fixed immediately after the workshop by the system
providers.

22
Figure 8: Number of incoming information (placemarks, tracks, polygons, etc.) in the feeds by system. Remark: number of used devices varying between 1 and 6.
Figure 9: Number of incoming information (placemarks, tracks, polygons, etc.) in the feeds by system. Normalized by number of used devices.
23
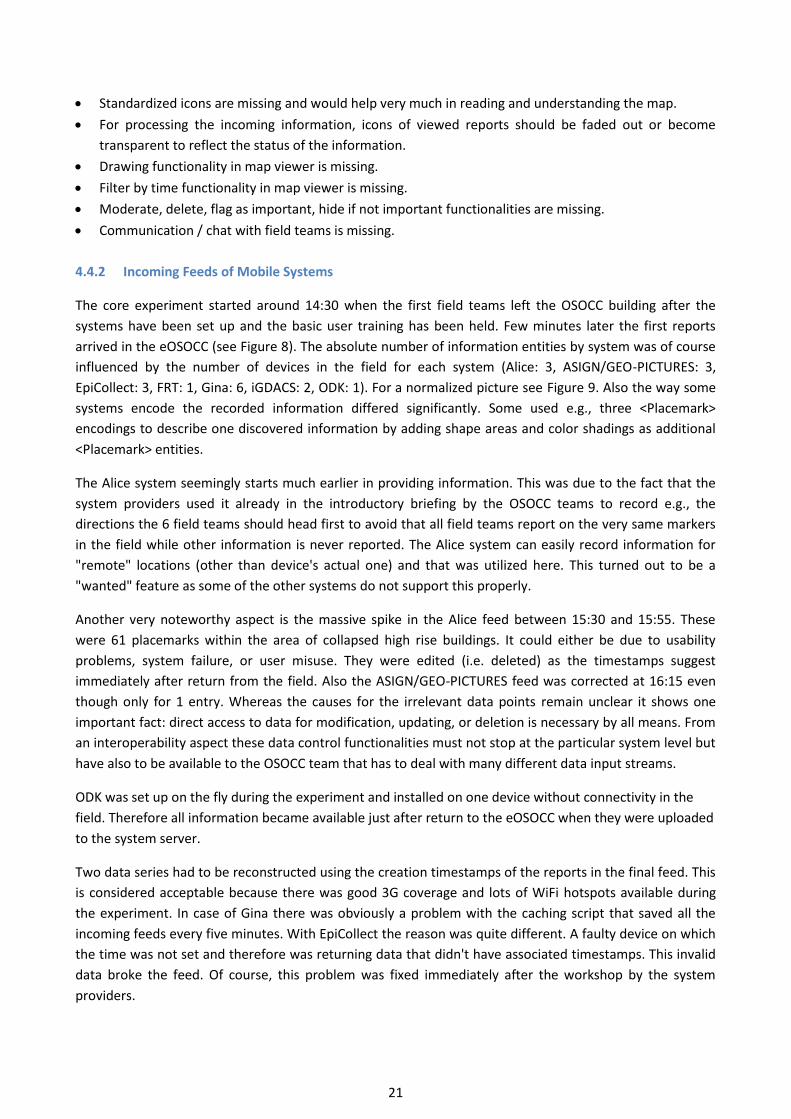
There was significant information overload the eOSOCC team had to deal with. As much as 328 entities of
information (placemarks, tracks, polygons, etc.) at 15:50 were simultaneously streamed to the eOSOCC (see
Figure 10). Therefore sophisticated editing, filtering, and visualization functionalities (e.g., multiple views)
have to be available for OSOCC staff.
Figure 10: Total cumulative number of incoming information (placemarks, tracks, polygons, etc.) to be handled in the eOSOCC.
24
4.4.3 Situation Assessment Outcome by pOSOCC
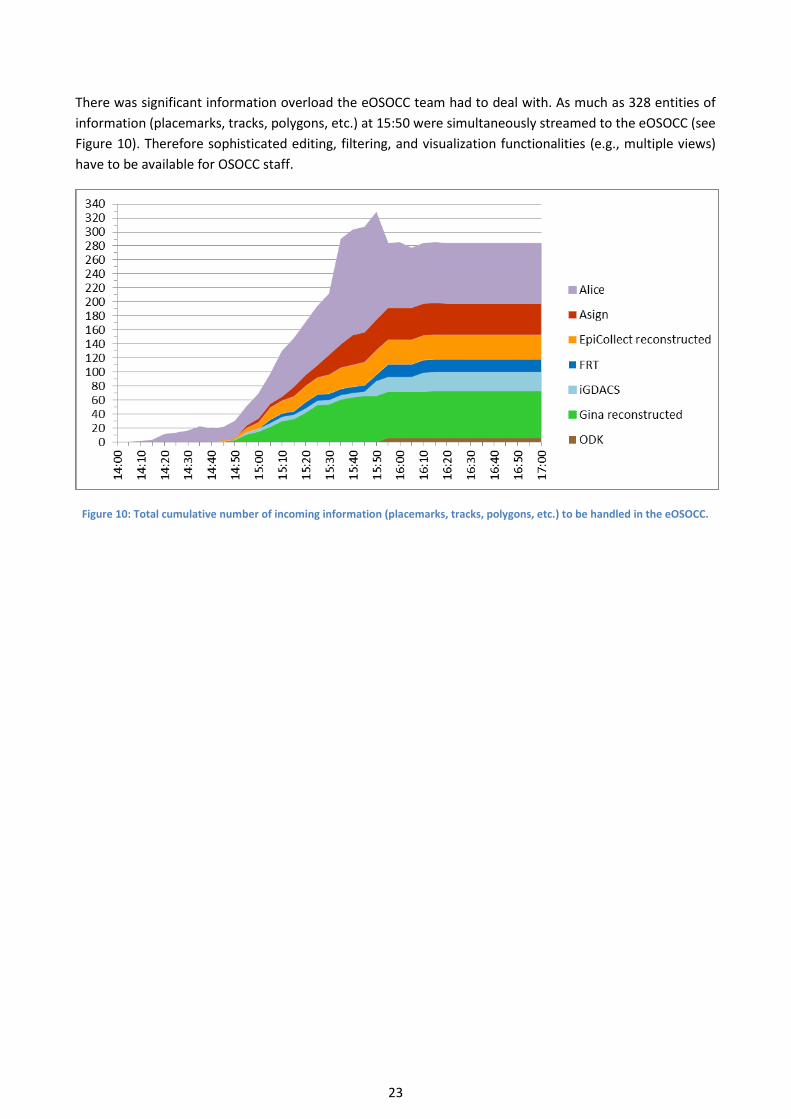
While the teams were collecting data, the pOSOCC prepared procedures and paper map support for
receiving information. These were procedures were well known by the experienced OSOCC staff and took
little time to prepare. By the time the first teams arrived (at 15:40), information could be processed in a
very organized way. Information was collected in three categories: humanitarian needs, infrastructure and
hazards. It was drawn directly on a transparent layer on the large paper map.
The process in recording incoming information and generating the final map of the assessed situation (see
Figure 11) can be summarized as follows:
1. The pOSOCC leader used a big empty map (A0) of the site.
2. A layer of transparent film fixed to the map was used for recording the collected information from
the field.
3. The pOSOCC received the field groups one by one with one or two representatives only.
4. Permanent markers of different colors were used to represent different categories of information.
5. Finally, pOSOCC leaders utilized post-it markers to summarize the most relevant information they
wanted to highlight in the briefing.
Figure 11: Process of information collection and mapping in pOSOCC. Two pOSOCC leaders receiving reports by field team representative.
25
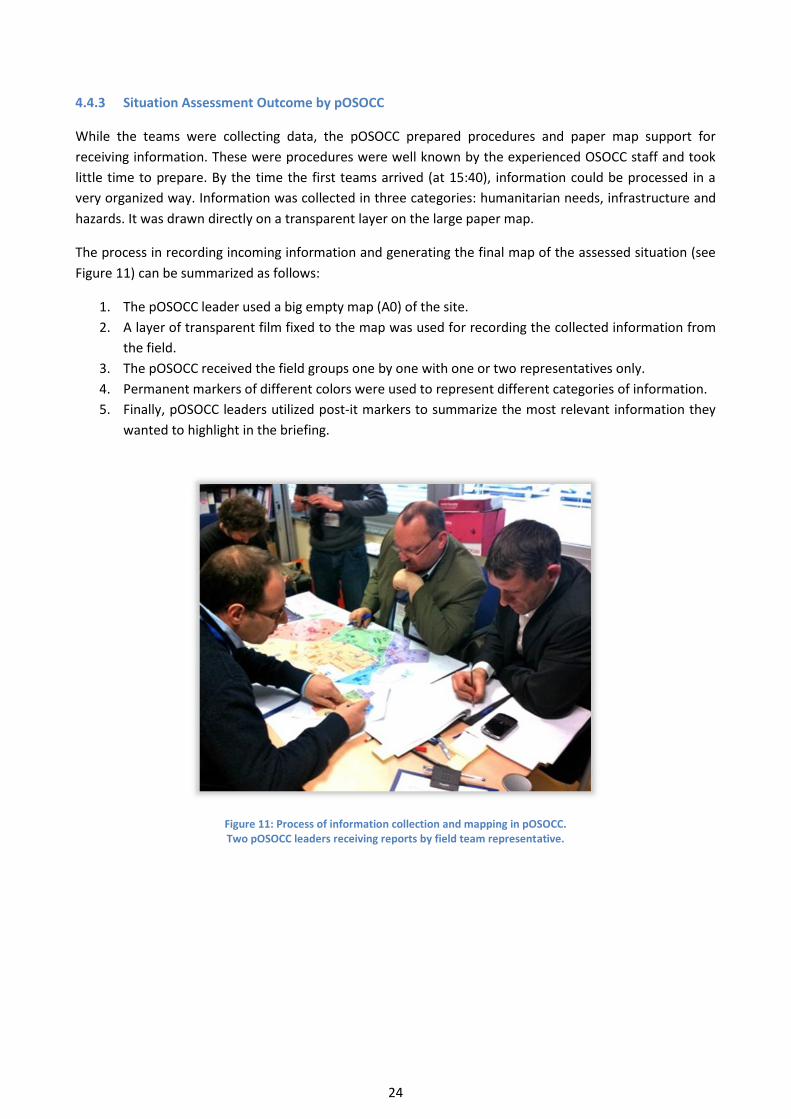
By 16:30, the map was ready for presentation. The OSOCC leaders had an overview of the priorities which
they marked also with post-it notes for the presentation, but did not prepare any documents in writing to
be shared or communicated (see Figure 12).
Figure 12: Situation map prepared by pOSOCC also used for briefing. For the presentation most important information was marked with post-its by the pOSOCC leaders.
Observations of the processes, procedures, and activities in the pOSOCC by note takers of JRC staff included also the following:
Some groups gave a very brief and condensed report on only essential information
Other groups were too verbose trying to report too many details.
Some groups could refer the information to given unique identifier numbers of markers in the field, as
was requested by the pOSOCC team leaders.
Other groups were not able to provide this information because they only took notes on street
numbers and/or building numbers which hindered efficient mapping of the incoming information.
Basic - though incomplete - information was recorded on the map and successfully supplemented by
more detailed reports coming in later.

26
4.4.4 Comparison of Situation Assessments: eOSOCC vs. pOSOCC
Both paper and electronic OSOCC reached similar situation awareness. The final map based briefing
material (see Figure 5 on page 18 and Figure 12 on page 25) is almost identical with very few exceptions to
be described in detail below (see Table 5). Interestingly both OSOCC teams made mistakes with regard to
the exact positions. Two very important facts are missing in the eOSOCC briefing map and one factitious
information (no marker placed in the field) shows up but on a wrong position (unclear whether incorrectly
mapped or incorrectly reported).
Correct information eOSOCC pOSOCC
Marker 36: 400 displaced people Correct position But 600 displaced people stated.
Correct position. No number of people stated.
No marker placed in the field, but information on gas cylinders reported by field teams to both OSOCCs
Correct position. Wrong position (ca. 140 meters) Labeled with "Y40??" showing confusion with marker 40. Marker 40 mapped correctly but also labeled "G40??" showing mentioned confusion.
Markers 28+29: 2 sides of blocked road
Correct position in feeds But transferred incorrectly into briefing map (250 meters off, identifying wrong road).
Both markers mapped correctly.
Marker 5: Partially collapsed building. Unknown number of people missing. Marker 6: Road Blocked from here towards N Marker 7: Completely collapsed building.
Correct positions. Correct relative position of 3 markers. But wrong position on map (140 meters off). Confusion because on the paper map there are no buildings. Labeled as "USAR", "Road Block North??", "USAR??"
Marker 13: Probably many people stuck in collapsed building of reinforced concrete building.
MISSING Correct position. Labeled "G13 USAR".
Marker 18: Large area of collapsed high rise buildings. All through roads blocked
MISSING Correct position. Labeled "G18 USAR High Rise". Building of marker 5 included in area boundaries.
No marker placed. "Potential (narrow) road for transport". Source unclear. Not part of any feed. Probably 155 meters off.
--
Table 5: Major differences between eOSOCC and pOSOCC maps
The mistakes of the eOSOCC team made in transferring accurate data to the briefing material underline the
need for an OSOCC software suite covering the whole workflow of procedures essential in OSOCC
operations. This was also an outcome of the evaluation discussion sessions (see below).

27
The following minor details (see Table 6) are listed for sake of completeness of the comparison of eOSOCC
and pOSOCC outcomes and do not indicate strengths or weaknesses of neither of the two modes of
operation.
Correct information eOSOCC pOSOCC
Marker 33: Structure collapsed. No people trapped.
Not mentioned as not essential. Correct position. Labeled "USAR (no trapped)"
Marker 37: Structure collapsed. No people trapped.
Correct position. Mapped as collapsed building.
Correct position. Mapped as "WASH Food Shelter" with wrong ID "Y36". Confusion most likely due to the fact that marker was vandalized by unknown suspects who changed content2. Marker 36 across street labeled "Y37"
Marker 35: Rumors of 5 missing persons in this area.
Correct position. Labeled "5 people missing" + "USAR"
Correct position. Labeled "USAR?"
2 intact fuel stations Not shown on briefing map as not essential.
Shown on map due to being complete information collection.
Table 6: Minor differences between eOSOCC and pOSOCC maps
2 "Vandalized" marker: "Structure collapsed. All people drinking coffee"

28
4.4.5 Discussion of Experiment Outcomes (Hot Wash-Up)
After the presentations of the outcomes of the two OSOCC teams all workshop participants shared their
experiences in a hot wash-up and discussed the perceived processes and procedures, and the results of the
experiment. The main points in this discussion were as follows:
"Assessment has to be very concise and very clear! Some teams came back and even
did not know exactly where they have been."
This relates very likely to the wrong position of markers 5, 6, and 7 of the pOSOCC since it was stated by
one of the pOSOCC leaders. The unreliability in case of this information was recognized by the pOSOCC as
there were no buildings on the paper map were they mapped this information. Here mobile devices add a
lot of trust to incoming information by giving precise location coordinates.
"Assessment is a professional activity of trained experts. How can untrained people
contribute?"
Part of the nature of the experiment design was to provide novice users with devices they never have seen
before and to see how easily they can be used. Nevertheless even if the devices were unfamiliar the users
themselves all have experience in disaster management on different levels. The context here focuses more
on the sometimes very promising idea of crowd sourcing. There the users use their own devices but are
very likely to be totally inexperienced when it comes to disaster management or field assessment. So
information provided by such users has to be dealt with caution.
"In the eOSOCC interactive communication with the field teams was missing. The
speed gain of the eOSOCC does not outweigh this missing communication."
"Voice communication (VHF) [with field teams] was missing."
It was mentioned on more than one occasion that although ICT offers so much possibilities of new and
improved procedures for OSOCC operations a reduction to only computer mediated information flow is not
desirable. Communication back channels are needed to verify and validate incoming information or assure
correct interpretation. Field team members gain so much insight in the field that can be of great value also
for cross checking the final "big picture" of the situation assessment.
"Incoming real time data is like a dream come true for any OSOCC team. Filtering
mechanisms for handling the incoming streams are necessary."
The information overload was an issue for the eOSOCC team leaders. The incoming streams were simply
"consumed" and interaction with was very limited. Manipulation of the data was not possible at all. This
starts with features that simplify the process of reading the continuous streams by marking analyzed
information and ends with complex editing capabilities to fuse different reports and compiling authoritative
interpretation. It has to be possible to delete, edit, and create data.

29
"It is necessary to deal with changes in time. A situation usually is not static.
Snapshots should be supported in a proper way."
A disaster assessment may change with every piece of additional information that becomes available. In a
traditional way of working this might not be of great importance as there are clear stages defined by
briefings of returning field teams. Discussions probably take place in groups so a given amount of
information is reported, taken into account, validated, etc. which then leads to a new state of assessment.
If this more discrete process turns more and more into a continuous one there has to be a change in
procedures as well. A new piece of information may lead to a re-interpretation of other already known
facts. If this later turns out to be faulty data a rollback in the assessment has to be performed. Such
operations might be supported by snapshots but maybe more complex interdependence graphs are
needed on which changes can be performed on.
"What is the added value of pictures to a report? How to interpret and integrate the
information a picture provides in the information processing?"
The question arose on what the added value of pictures in field reports actually is. Whereas some might
argue that one picture is worth more than a thousand words it is obvious that a picture has to be read and
interpreted to support sense making. If there are e.g., structural engineers in the field assessing the
stability of partially collapsed buildings their expert opinion on the building is valued in the OSOCC and not
colorful pictures that probably show few, if any, aspects that led to the expert's conclusive assessment
whether this building is safe for USAR operations or not.
Pictures on the other hand become much more important in the case of crowd sourcing where untrained
people submit information to be evaluated by OSOCC staff or expert teams. Here pictures might also add to
the credibility and trustworthiness of crowd sourcing information discussed above.
"Usability is an issue. It was possible to send [electronic] reports with no data in
them."
While in general most of the participating systems can be described as mature and ready for deployment
even the most advanced ones will show the one or the other weakness when undergoing stress tests. Even
if it is on purpose that it is possible to send empty reports (maybe for quickly reporting one owns location)
it is still questionable especially for users new to a system. As with any ICT minimal or even no training
should be necessary to utilize it. Giving the own system into the hands of novice users and even people that
are not domain experts in crisis management or field assessment is always a very fruitful experience for
iterative technology enhancement.
30
4.5 Panel / Group Discussion: Assessment of Technological Interoperability
The second day of the workshop was dedicated to discussions on usability, interoperability, and utility of
mobile devices for crisis management driven by the experiences from the experiment. Methodologically
these sessions have been designed as "extended" focus group discussions with 6 people on a panel giving
key statements to foster a fruitful discussion, one moderator, and active participation of the audience. At
any time at least 2 note takers documented the statements of the participants.
On the plus side, there was massive involvement of the audience and a lively discussion took place. The
downside of course directly related to this was that the group was way too big for a traditional focus group
discussion procedure adhering to a question guideline. The different topics that were discussed were very
diverse and the designed question guideline visible on a projector screen was merely giving an impression
of central questions for the session:
Q: System setup and system use is easy (learnability, usability)?
Q: System customization (e.g., categories, labels, tags, forms, …) is possible to meet different
needs?
Q: Systems are able to interoperate with each other (compatibility, information granularity,
symbology, etc.)?
Q: What enhancements and developments are necessary to improve technical interoperability?
Session 1 focused on interoperability from a more technological viewpoint. So, the panel was composed of
7 technology providers (Alice, ASIGN/GEO-PICTURES, EpiCollect, FRT, GINA, iGDACS, ODK) and moderation
was done by a senior JRC scientist.
4.5.1 Panel / Group Discussion Outcome
The outcome of putting all the different streams together was a mess! […] Is it
feasible to establish a universal symbology?
A standard library of icons, tags, etc. to be used by all information and data providers definitely would help
in reading a map of combined feeds. Participants mentioned also that even if such standardization would
take place there will always be situations that are not covered by any given set. Furthermore, the question
arose in the discussion on who would be the authority to develop or at least approve this library.
Data collection tools are useful but the context matters so much. Different users
have different views on the very same information or situation to assess.
In a real crisis situation many different stakeholders are present who all collect data on very different levels
according to their interests (e.g., building X is collapsed vs. 10000 people need food & water). It would be a
pity not to use this information but powerful data handling functionalities have to be available to deal with
the different scopes of this data and integrate them to contribute to a situation assessment.
31
Semantic interoperability has two sides. On the one hand the technology providers
have to provide feeds that allow desired data handling. On the other hand the
OSOCC staff should have every possibility to handle the data to their needs. For
instance assign icons on a one by one basis.
This important statement raises the justified question on how to define interoperability. It posits the
necessity not to stop at a technological level but to include users' needs when talking about interoperable
information. When the task at hand is the interpretation and sense-making of data and information the
user needs every support to categorize, merge, or subdivide these information chunks according to the
bigger picture that is developed in this process. The latter was discussed also in the session on the utility of
mobile devices for OSOCC operations (see section 4.6 Panel / Focus Group Discussion: Assessment of Utility
of Mobile Systems for OSOCCs).
"Analysis in eOSOCC was done on 'paper' as well because the needed functionalities
e.g., to edit the incoming data, are missing." "[It] is possible to edit the data. But for
that you have to open up the server side applications of the various systems." "An
API could be a solution for e.g., turning on/off reports, etc."
A first step to give OSOCC staff access to the data could be the provision of an application programming
interface (API). So the analysts could for instance easily exclude data entries from the input stream that
they do not need (any more). Again standardization would be necessary for all the systems of different
providers supporting these API standards. Using such an approach OSOCC staff would 'operate' on the
original data of the different systems. Whether this is wanted and/or sufficient is a question that was
addressed again later in the next discussion session.

32
4.6 Panel / Focus Group Discussion: Assessment of Utility of Mobile Systems for OSOCCs
Again, as described above the designed question guideline visible on a projector screen was merely giving
an impression of central questions for the session:
Q: Does the use of multiple mobile devices/systems lead to the creation of more accurate and
timelier maps?
Q: Does the use of multiple mobile devices/systems enable more accurate and timelier response
plans?
Q: Can a single map showing feeds from different devices be understood by practitioners?
Q: What enhancements and developments are necessary to improve the experienced
shortcomings?
Session 2 focused on interoperability and utility of different systems working together for OSOOC
operations. Accordingly the panel was composed of 3 experienced OSOCC leaders (Austrian Ministry of
Defence and Sports, Danish Emergency Management Agency, UN WFP) and moderation was done by a
senior crisis manager of UN OCHA.
4.6.1 Panel / Group Discussion Outcome
"In the chaos of real disaster situations technology often is not that helpful. At later
stages of crisis management it definitely is useful. But in general, technology use for
technology's sake is a bad idea."
At the beginning of the evaluation session on the utility of mobile devices for crisis management very
fundamental questions were raised: What is the real benefit of technology usage? Is there an unquestioned
process of introduction of (new) technology driven by unjustified hopes or false promises? Any ICT
development or introduction should be user driven. If and only if it contributes to the tasks at hand it is
worth looking into that technology. There was suspicion among the participants that sometimes software
takes the center of stage in technology adoption processes disregarding the (maybe missing) users' needs.
"Mobile devices are useful but don't trust the technology or rely solely on it. You
always need a fallback solution if technology fails."
The well-known vulnerability that goes hand in hand with the introduction of any ICT system has to be
addressed properly. Computers, servers, devices, or software will fail. Back-up systems add security but
one has also prepare for the worst case. What happens if all collected data from the field is lost or just
becomes inaccessible for some time? Proper procedures have to be established that ensure continuing
OSOCC operability in case of total ICT failure. Automatic paper based dumps of collected data, analyzed
information, and situational assessment could be worth looking into. Relying solely on technology not only
introduces vulnerability but also could limit one's scope of action. Interoperability of incoming paper based
information with used ICT systems has to be equally ensured as interoperability of different technological
systems.
"One should combine paper and electronic procedures. An interactive whiteboard
and separate logging system could make sense."

33
Drawing on a map, sketching plans of action, or manually marking points of priority are not actions
performed after a situational assessment took place to communicate the outcome but are integrated parts
of coming to an understanding of a situation. The value of - in the context of omnipresent ICT - such
"antiqued" working practices should be accounted for in providing ICT solutions allowing for this.
Interactive whiteboard systems displaying high precision real-time data but in the same time allowing to
collaboratively draw and scribble with digital ink while analyzing and interpreting are one example of a
fruitful combination of this two worlds.
"Both field teams and OSOCCs should have technology support staff."
The more complex utilized and deployed ICT becomes, the more support is needed for the smooth
operation of these systems. Crisis managers, field assessment experts, etc. should be able to concentrate
completely on their challenging tasks and not have to deal with system setup, bug fixing, or
troubleshooting ICT. Against the background of the already mentioned certainty of failure of technological
systems at some time this becomes the more important.
It was mentioned by participants that different organizations provide already such support packages:
International Humanitarian Partnership (IHP) offers different modules e.g., information and
communications technology support, a tented office and equipment for the setup and management of an
OSOCC, basic staff functions within an OSOCC, etc. Also the WFP or ECHO have similar offerings.
"[You] cannot push devices or technology on the humanitarian community. The
different organizations have to show up with their own devices. And as coordinator
you just want to tell them to download this or that application and use it."
It was mentioned on several occasions in the discussion that ICT systems should be as open as possible.
They should be able to interoperate and share information. Different information needs may be addressed
by different data collection applications that should be able to install without any problems on any devices
present in the field. Open system architectures, open protocol standards, and open interface specifications
should be developed and/or adopted for a maximum of flexibility and interoperability.
"The validity of information is key. It is about the trustworthiness of the source. One
problem with electronic systems is that information comes in so fast that there is no
time for validation."
"Crowd sourcing is a huge resource. The open question is how to use the information
and how to validate it."
In traditional reporting situations validation is an integral part of the field team members reporting to
OSOCC staff who is able to ask for clarification or even request help in the interpretation of the reported
information. Participants stated that in an eOSOCC it is not possible to question every incoming piece of
information and ensure its validity. This could either be addressed by having enough trust in the source or
by establishing procedures that provide validation capacity like de-briefing sessions.
When it comes to crowd sourcing, of course, de-briefing sessions are not possible but by the size of the
crowd the reported information may become trustworthy to some extent. Trust in and validation of crowd
sourcing information remained an open question in the discussion.

34
"[Tools] are needed to create and provide a moderated new feed available to field
teams."
Already in the hot wash-up discussion immediately after the experiment the need for a back channel was
stated. Whereas at that time information verification and validation was the crucial factor for this request,
here a new quality of communication is addressed: feeding the "big picture" back to the field teams
providing them also with an up to date situational awareness. Parts of this communication include
command and control aspects but from a self-organization viewpoint: for instance all teams see in real time
where the other field teams currently are thus being able to direct their own next movements to areas still
to assess. Or a live picture of current needs allows e.g., teams in close range to react autonomously.
"Making sense of the information is critical. Huge amount of information is collected
easily. But processing and sense-making is the problem."
"[The] flood of incoming information was not understandable for the OSOCC team."
"The categorization and interpretation should take place in the OSOCC and therefore
tools are needed to support this."
"We have seen automated data collection but there is no automated data analysis
so far."
Probably one of the most prominent outcomes of the discussion on the utility of mobile devices was the
need for proper software tools to deal with the collected data. As indicated in the four citations above
several levels of information processing have to be addressed. It starts with rather simple functionalities
like selecting different data sources and filtering specific report categories. More complex operations on
the data include e.g., encoding of categorizations / interpretations and establishing relationships between
data have to be available to OSOCC staff. And finally, to some extent even automatic data analysis should
be possible.
"Future research should investigate on how to produce a common operational
picture of a situation. Currently maps are sent around and updated constantly. For
this technology support is also needed."
"End users want systems that are capable also to produce overviews e.g., what is
needed for how many people."
An OSOCC software suite should also be able to generate reports that are needed to communicate a
current situation. Periodic situation reports (SitReps) usually have to be produced on an evolving crisis.
Summarizations of different aspects (water & food needs, hazards, security threats, etc.) on very detailed
or rather abstract levels are often needed. These reports - at least partially - could be generated fully
automatic by the ICT system(s) in the OSOCC used to assess the situation.

35
5 Recommendations
The outcomes showed that both paper and electronic OSOCCs reached a similar situation awareness in the
same time, identifying similar needs and locations for prioritization, but only the eOSOCC had products
available as sharable electronic maps and documents. The pOSOCC would need at least 30 minutes to come
to the same result. The other advantage of the eOSOCC was the possibility to monitor a situation changing
over time (to be precise in this case a changing situation awareness as all placed markers were static) and
the possibility to keep track of the situation (awareness) evolution.
5.1 Status-Quo and Further Development Needs
Mobile technology is mature and can be deployed in an interoperable way. However, as soon as it comes to
interoperable sharing, the information of each and every system leaves the proprietary applications for
processing and analyzing the data. Therefore, processing tools and training to these are needed.
The main impression from the eOSOCC team was that there is a lot of potential. Having access in real-time
to field information was felt to be extremely useful. However, at the moment tools and procedures are
missing for exploiting this benefit. Most important are tools to curate, filter, manipulate, edit, and delete
assessment information of all teams (i.e. post processing tools). While part of this can be achieved by APIs
to the different systems, a non-destructive way to edit or delete data is also needed because the original
feeds might be required for other purposes as well. This implies the import of feeds into a dedicated
OSOCC software suite that gives full control over the data to OSOCC staff. For the development of such a
software suite available design guidelines originating from the research areas of Information Visualization
and Visual Analytics should be considered as the information processing needs in an OSOCC are closely
related to the exploration and sense-making cycles inherent in the mentioned research fields. The
participants encouraged a follow-up workshop after such tools are developed.
5.2 Process for developing systems
The group of practitioners gave some concrete recommendations on how mobile technology can be
improved and integrated in humanitarian operations. They considered workshops like this one an essential
tool, but it is more important to have a dedicated community that has regular activities or meetings on the
topic to keep the momentum of development ongoing. A forum for technology providers to exchange ideas
and products would be useful. The contribution of practitioners to this dedicated community is of great
importance because only they can ensure the very vital input for a user and task driven development of
proper ICT systems.
Besides physical workshops or exercises, tools like table top exercises and dedicated technical
teleconferences are as important. Gradual integration in Standard Operating Procedures and adaptation of
training curriculums is a way to integrate mature technology in the existing assessment practices of
operational organizations. The more open the architectures and standards of these technologies are, the
likelier is the integration and adaption process.

36
6 Acknowledgements
Thanks to Christian Flachberger (Frequentis AG) and Piotr Koza (Astri Polska) for permission to use some of
their photos taken during the workshop in this report.
Thanks to Luca Vernaccini and Andreas Hirner for additional note taking during the experiment and the
discussions and Lina Saltenyte for great organizational support.
Very special thanks to Thomas Peter (UN OCHA), Flemming Nielsen (Danish Emergency Management
Agency), Alois Hischmugl (DMAT Consulting), Andrea Di Lolli (Turin Fire Brigade), and Dunja Dujanovic (UN
WFP) for leading the OSOCC operations during the experiment.

37
7 Annex A: Participating Systems
The following 7 systems participated in the experiment, of which 6 with active attendance of the respective
technology providers. All of them offer sophisticated functionalities in their server side or desktop
applications (cf. screenshots of desktop or web-based applications).
7.1.1 Alice by Astri Polska Sp. z o.o., Warszawa, Poland
ALICE (Adaptive Layers for Information and Collaboration in Emergency) allows for rapid exchange of
information between the various rescue units in the field and between field units and headquarter. ALICE
provides a variety of information (GIS data, aerial and satellite images, units' localization, meteorological
data, etc.) directly to the user in the field. ALICE was created with the strong support of Polish firemen and
was designed according to the philosophy that to share an operational picture and to support decision
making a shared geographic environment is crucial. [cf. http://www.astripolska.pl/0,1,93.html]
7.1.2 ASIGN/GEO-PICTURES by AnsuR, Fornebu, Norway
ASIGN (Adaptive System Image-communications in Global Networks) is an innovative Image
Communications Solution, providing the most efficient transfer of high quality photos, videos and other
sensory data. The fundamental challenges in digital communications form the basis for ASIGN: The need for
rapid access to high quality visual data from remote field sites anywhere in the world. […] ASIGN allows all
images the observer wants, in any resolution required, to be sent to an operations centre. [cf.
http://www.ansur.no/index.php?option=com_content&view=article&id=100&Itemid=99]

38
7.1.3 EpiCollect by Imperial College, London, United Kingdom
EpiCollect.net provides a web application for the generation of forms and freely hosted project websites […]
for many kinds of mobile data collection projects. Data can be collected using multiple mobile phones
running either the Android Operating system or the iPhone (using the EpiCollect mobile app) and all data
can be synchronised from the phones and viewed centrally (using Google Maps) via the Project website or
directly on the phones. [cf. http://www.epicollect.net/]
7.1.4 Field Reporting Tool (FRT) by JRC, Ispra, Italy
The Field Reporting Tool supports crisis situation awareness and post crisis needs assessments. During all
phases of crisis management, it facilitates exchange data between headquarters and field teams in the
most efficient and secure way to ensure timely shared situation awareness, and to better serve the field
teams with shared situation assessments. All the information is stored in a common repository and shared
among all the crisis players through a web portal and other geographic aware systems.

39
7.1.5 GINA System by GINA Software s.r.o., Czech Republic
GINA is an interactive map software for mobile devices permitting navigation in difficult terrain, teams'
coordination, and effective exchange of geographic information. Due to its features, GINA is destined for
crisis management centres, rescue teams and other groups operating in difficult conditions. […]GINA is easy
to control, because the use of the application has been inspired by an ordinary paper map. Just like you can
draw on a map with a pen and stick a pin of various colours in it, GINA enables you to insert your own
drawings […]. [cf. http://www.ginasystem.com/gina-system.htm]
7.1.6 iGDACS by JRC, Ispra, Italy
iGDACS provides near real-time information about natural disasters and gives the possibility to send back
information in the form of a geo-located image and/or text. The Global Disaster Alert and Coordination
System (GDACS) is a cooperation framework between the United Nations, the European Commission and
disaster managers worldwide to improve alerts and information exchange. iGDACS is intended to tap the
abundant information about disasters available from people who actually experience them. Reports of the
iGDACS users are used to improve the overall situational picture. [cf. http://i.gdacs.org/]

40
7.1.7 Open Data Kit by University of Washington and Google (presented by UN WFP, HQ office in
Rome)
Open Data Kit (ODK) is an open source data collection tool for Android phones, developed by the University
of Washington with the collaboration of Google. It has developed a large user community and is currently in
use in many developing and developed countries. It consists of 3 components: "build" for building the data
collection forms in the XForms format, "collect" which is the app for the data collection that runs on android
phones and transmits the data using mobile internet connection, and "aggregate" which is a server
application to receive, publish and export the data. Aggregate can be installed on the cloud-based Google
Application Engine, or on a local server. The World Food Programme is currently developing customised
versions of Open Data Kit and of FrontlineSMS to enable ODK to work with SMS-based text messaging and
to enhance some of the mobile and server's data collection capabilities. [cf. http://www.opendatakit.org]

41
8 Annex B: System Set Up / System Customization Form
Please record relevant aspects of the system set up (project/mission creation, user administration, …) and
the system customization process (definition of forms, labels, tags, …) in your team.
System ASIGN FRT EpiCollect
Alice iGDACS GINA
Procedure to Set Up Information Sharing
Time Needed
Expertise Needed
Remarks
Procedure to Customize System (Forms, Tags, Labels, Icons, …)
Time Needed
Expertise Needed
Remarks

42
9 Annex C: Field Experience Form – Mobile Device Usage
Please record all relevant aspects of your field mission: e.g., report submission (to be able to cross-check
their reception), usability problems, semantic encoding of encountered information, …
Team System
ASIGN FRT Alice iGDACS EpiCollect GINA
Time Marker
Mobile Device Usage -- Action / Observation / Problem

43
10 Annex D: Field Experience Form – Paper Based Information Collection
Please record all collected information on this paper. You might also include comments on e.g., troubles of
semantic encoding of encountered information, …
Team
Time Marker
Recorded Information / Meta-Comments

44
11 Annex E: Marker template for providing information to be collected by field
teams
MMaarrkkeerr IIDD NNuummbbeerr
Description of actual situation encountered at placed location. No title or categorization is used as it is part of the experiment how field teams encode discovered information semantically to fulfill the information needs stated by the OSOCC. Field teams can decide to leave marks on visited locations to communicate to other teams which may arrive later on the same spot. It is not actively encouraged by a dedicated form area but possible on space intentionally left blank on this marker sheet. Whether to leave marks or not is left to the field teams and/or instructions given by the OSOCC.
This marker was placed for the 1st JRC Crisis Technology Workshop on Mobile Interoperability for Crisis Management, 12-13 March 2012 by the Crisis Monitoring and Response Technologies (CRITECH) Action, Global Security and Crisis Management (Globesec) Unit, Institute for the Protection and Security of the Citizen (IPSC).
Please do not remove! For inquiries contact: Markus Rester, -3805, [email protected]

45
12 Annex F: Overview Map of Placed Markers and NO GO Zones
All field teams received the following overview map to lead them to the placed markers.
Please, do not enter any zones marked grey!
Please, do not photograph any sensitive areas, including nuclear installations, any entrances to the JRC
site, the site perimeter fence, Security staff, vehicles or details of related installations!
Prefer close-ups to wide angle shots that would eventually allow the straightforward identification of the
location and any inherent details!
Security Service may ask to review the collection of photographs and take any necessary measures to avoid
the disclosure of JRC Ispra site images containing details deemed sensitive. In case Security Service
addresses you please refer them to our contact person from Security Service being aware of our workshop:
Teijo Lehtinen +39 0332 78 [removed]

46
13 Annex G: OSSOC Instructions and Templates

47

48


