The University of Sydney Page 1
Interpretation of corneal
tomography
Presented by
Chameen Samarawickrama- Westmead Hospital
- Liverpool Hospital
- University of Sydney
- University of New South Wales
The University of Sydney Page 2
Financial disclosures
– Early Career Research Fellowship (Westmead Charitable Trust)
The University of Sydney Page 3
Uses of corneal tomography
– Cataract
– Toric IOL insertion
– Lens densimetry
– Post-refractive IOL calculations
– Limbal relaxing incisions
– Cornea/refractive
– Ectasias
– Intra-corneal ring segments
– Corneal graft planning
– Ocular surface diseases
– Pterygia
– Scars
– Salzman nodules
– Glaucoma
– Anterior chamber depth
– Angle estimation
The University of Sydney Page 4
Torics at Westmead
– Westmead Hospital Audit
Aug – Oct 2016
– 22 ophthalmologists
– 5 registrars
– 2 fellows
– 22 toric IOL
– Pre-op cyl: 1.61 ± 0.9
– Post-op cyl: 1.23 ± 0.23
Pre-op cyl Post-op cyl Change
4.25 -1.75 -6
-3.50 -1.25 2.25
-1.5 -1 0.5
2.5 0 -2.5
2.25 -1 -3.25
-3 -1.75 1.25
-1.25 -3 -1.75
1.75 -0.75 -2.5
3.5 -3.25 -6.75
1 -0.50 -1.5
2 -0.50 -0.25
1.25 -1.0 -2.25
2 -1.0 -3
2.25 -0.75 -3
1.25 -0.5 -1.75
1 -1 -2
The University of Sydney Page 5
Introduction of a
toric pathway
– Regular astigmatism
– Even bow tie pattern
– Axis of astigmatism
– Match within 15 deg
– Power of astigmatism
– Match within 0.5D
The University of Sydney Page 6
Power of appropriate utilization of tomography
– Feb – April 2018
– 29 torics (25 followed pathway)
– By 1 month
– 26 of 29 had uncorrected vision of 6/12 or better
– 21 (78%) had SER within 0.5D of target
Mean preop versus postop cylinder
Available
data n = 34 Preoperative
1 Month Postoperative
P-value
Refractive Cylinder (D)
Mean ± SD Range
2.77 ± 1.48 1.75 to 5.12
0.89 ± 0.96 0 to 1.75
0.006
The University of Sydney Page 7
Aims
1. Understand differences between tomography and topography
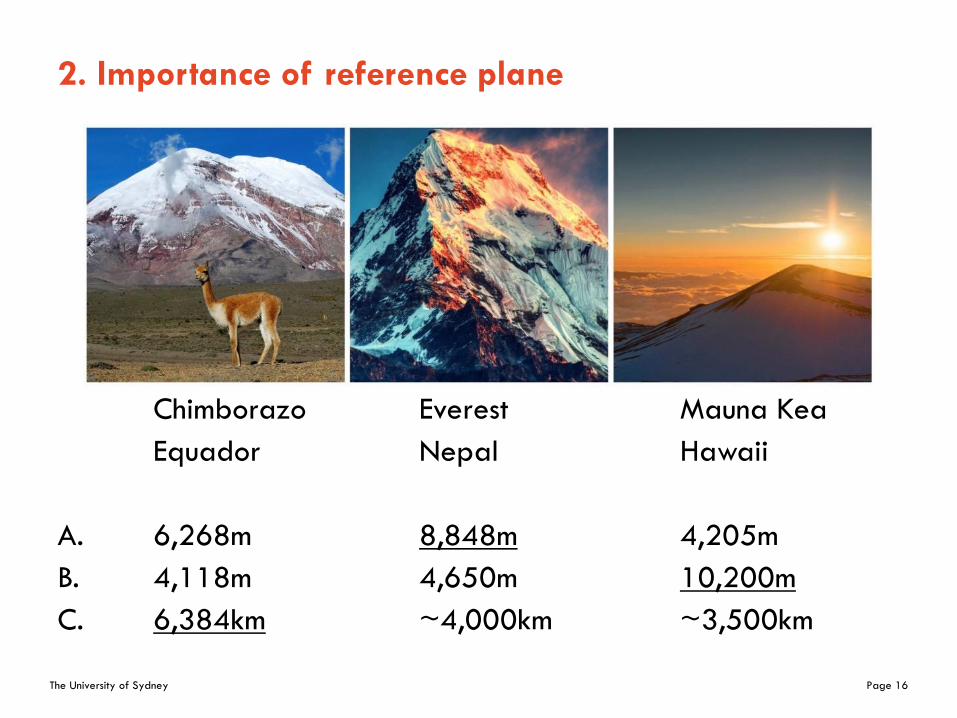
2. Reference plane and standardized settings
3. Systematically read tomography maps
4. Examples of common pathologies
5. Specific maps that are useful for diagnosis of ectasia
The University of Sydney Page 8
1. Methods to assess cornea
Red reflex
Retinoscopy
Keratometry
Keratoscopy
Topography*
Tomography☨
* Topography: 2-dimensional surface mapping☨Tomography: 3-dimensional modelling
The University of Sydney Page 9
Topography
– 2-dimensional mapping of surface contours
– Accuracy and data acquisition affected by:– Working distance
– Disc size
– Alignment with cornea
– Focusing of rings (increased difficulty with peripheral cornea)
– No central corneal data
– Susceptibility to error due to corneal irregularity
– Anterior surface data only
– Data from 60% of corneal surface (limitations with peripheral ectasias)
The University of Sydney Page 10
Effect of misalignment
– Misalignment of corneal apex with reference axis
Danger of
misdiagnosis if
only looking at
curvature!
The University of Sydney Page 11
Tomography is different
– 3-dimensional digital rotating Scheimpflug ELEVATION based system
– Rotating camera takes optical cross-sectional images
– Reconstructs complete anterior segment
The University of Sydney Page 14
Advantages of a Scheimpflug system
– Camera rotates around fixation point– Minimises artifacts generated by small
movements
– More accurate image registration
– Huge number of data points– Up to 138,000 analyzable data points
per map
– Accurate anterior and posterior surface data
– Cross-sectional data allows accurate pachymetry
– Reconstructions based on elevation data (not curvature)
– Not dependent of reflectionsIrregular surfaces
Corneal opacities
Post-op posterior surface
Corneal apex
The University of Sydney Page 16
2. Importance of reference plane
Chimborazo Everest Mauna Kea
Equador Nepal Hawaii
A. 6,268m 8,848m 4,205m
B. 4,118m 4,650m 10,200m
C. 6,384km ~4,000km ~3,500km
The University of Sydney Page 19
Standard settings for BFS
– Diameter of 8mm
– Not too flat, not too steep
– Most maps will contain only valid data
– Missing data is usually not an issue except in markedly abnormal corneas
– Standardized interpretation
– Belin and Ambrosio screening indicies are set to BFS Dia=8mm
– Float setting
– Allows software to move the reference BFS radius to best match the individual cornea
– Elevation scale
– Set to -75 microns to +75 microns
– Standardized colour scheme
The University of Sydney Page 22
B. Look at the pictures
Front
elevation
Back
elevation
Thickness
Curvature
The University of Sydney Page 25
4
3
2
1
Normal elevation values
Back elevation Front elevation
Normal <6µm <8µm
Suspect 6 - 15µm 8 - 17µm
Pathological >15µm* >17µm
The University of Sydney Page 26
C. Detailed numbers - shape
Anterior and posterior corneal
surface data
K1 and K2 – simulated K’s
representing calculated power of
surface
Km – mean K within 3mm zone
Axis – axis of astigmatism (note if set
for flat or steep)
Astig – amount of astigmatism
(difference between K1 and K2)
The University of Sydney Page 27
Detailed numbers - thickness
Pachymetry data
Pachy apex = corneal apex
Thinnest local may defer in KCN
- Normal > 500 µm
- Suspect 480 – 500 µm
- Pathology < 480 µm
Kmax data
Steepest K on anterior cornea
KPD
Anterior K – true net K
Influence of posterior corneal K
The University of Sydney Page 29
Regular vs irregular astigmatism
Regular astigmatism Irregular astigmatism
The University of Sydney Page 36
Summary
– Tomography is different to topography
– Newer generation of scanning technology
– Powerful tool to aid in diagnosis and management of many common conditions
– Best results are achieved with standardizing the settings and displays
– Using a systematic method of interpretation it is possible to consistently diagnose many corneal pathologies
– Pattern recognition!