23
Interpreting Motion Graphs
| Date post: | 29-Dec-2015 |
| Category: |
Documents |
| Upload: | joella-strickland |
| View: | 221 times |
| Download: | 0 times |

Interpreting Motion Graphs
Motion• A change in position measured by
distance and time.

Speed• The rate at which an object moves.
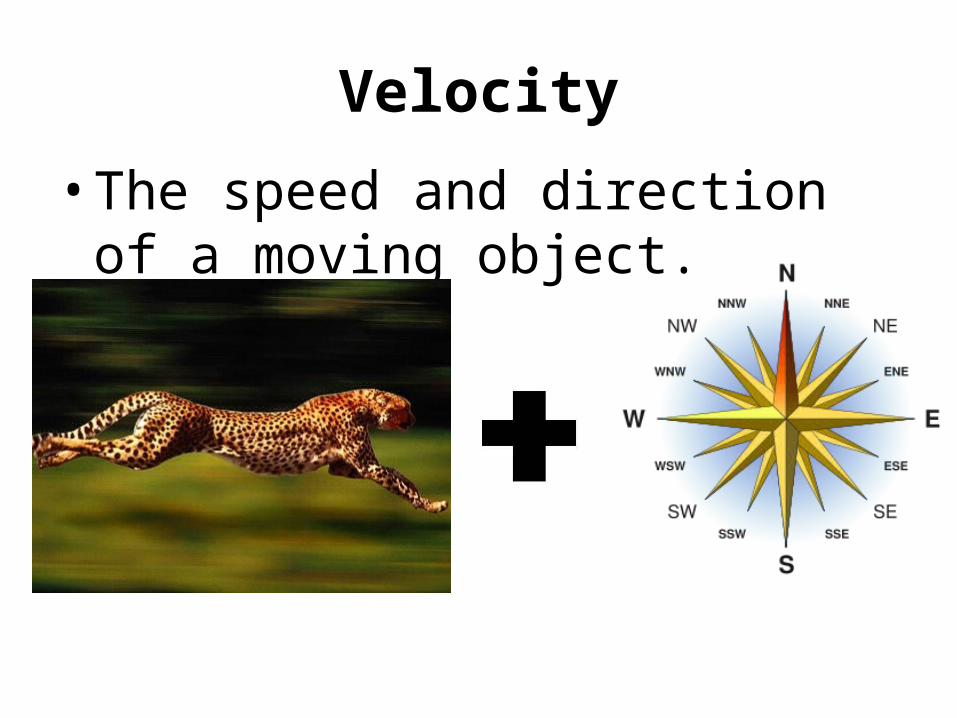
Velocity
• The speed and direction of a moving object.

Acceleration
• The rate, speed, or direction changes.

Reference Point• A place or object used for comparison to
determine if something is in motion.
So…a fly is sitting on the shoulder of a man sitting in a car. The car is traveling at 60 mph. Is the fly in motion?

Key Points
• A straight line shows constant speed.
• A curved line shows average speed.
• A horizontal line shows no motion.
• Time is on the x-axis, distance (OR SPEED) is on the y-axis.
• The steeper the graph, the faster the motion.

Distance-Time Graphs
• Time is always on the x-axis. Distance is always on the y-axis.
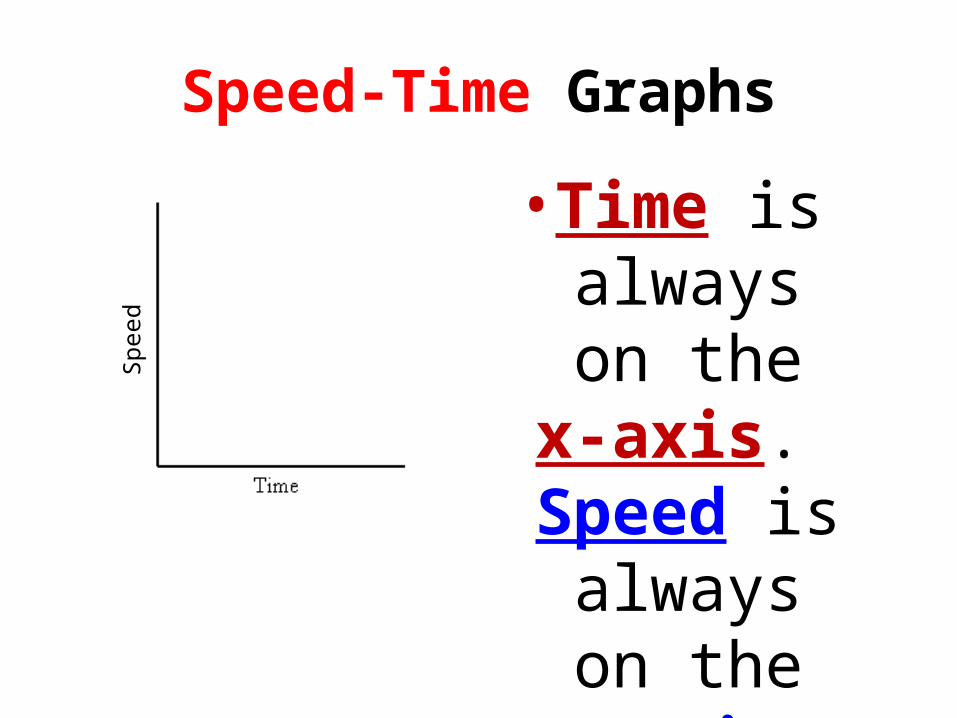
Speed-Time Graphs
• Time is always on the x-axis.
Speed is always on the y-axis.
Spe
ed

Distance-Time: NO MOTION
• Time is increasing, but distance does
NOT change. It is NOT MOVING…
NO MOTION…AT REST.

Speed-Time: CONSTANT SPEED
• Time is increasing, but
speed does NOT change. It is moving at a
constant speed.
Spe
ed
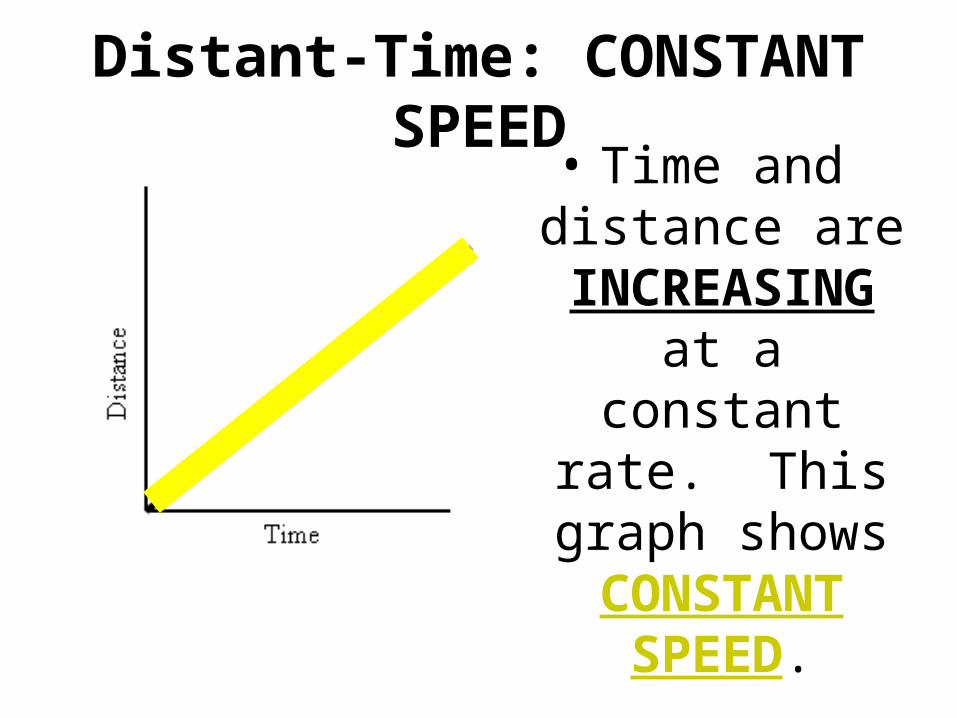
Distant-Time: CONSTANT SPEED• Time and distance are
INCREASING at a constant rate. This
graph shows CONSTANT
SPEED.

Speed-Time: CONSTANT SPEED• Time and
speed are INCREASING at
a constant rate. This
graph shows CONSTANT
SPEED.
Spe
ed

Distance-Time: CONSTANT SPEED• This graph shows a
change in direction (meaning the object
is headed back to the starting point).
This graph also shows CONSTANT
SPEED.

Speed-Time: CONSTANT SPEED• This graph shows time is INCREASING
while speed is DECREASING at a
constant rate. This graph also shows
CONSTANT SPEED.
Speed

Distance-Time: FASTER SPEED
• A steeper line shows greater
distance traveled in a given time.
The STEEPER THE LINE, the HIGHER THE
SPEED.

Speed-Time: FASTER SPEED• A steeper line
shows speed increasing in
shorter amount of time. The
STEEPER THE LINE, the
HIGHER THE SPEED.
Spe
ed

Distance-Time: ACCELERATION• In a given time,
the distance the object
moves is getting larger, it is
ACCELERATING. The curve
upward shows an INCREASE in
SPEED.
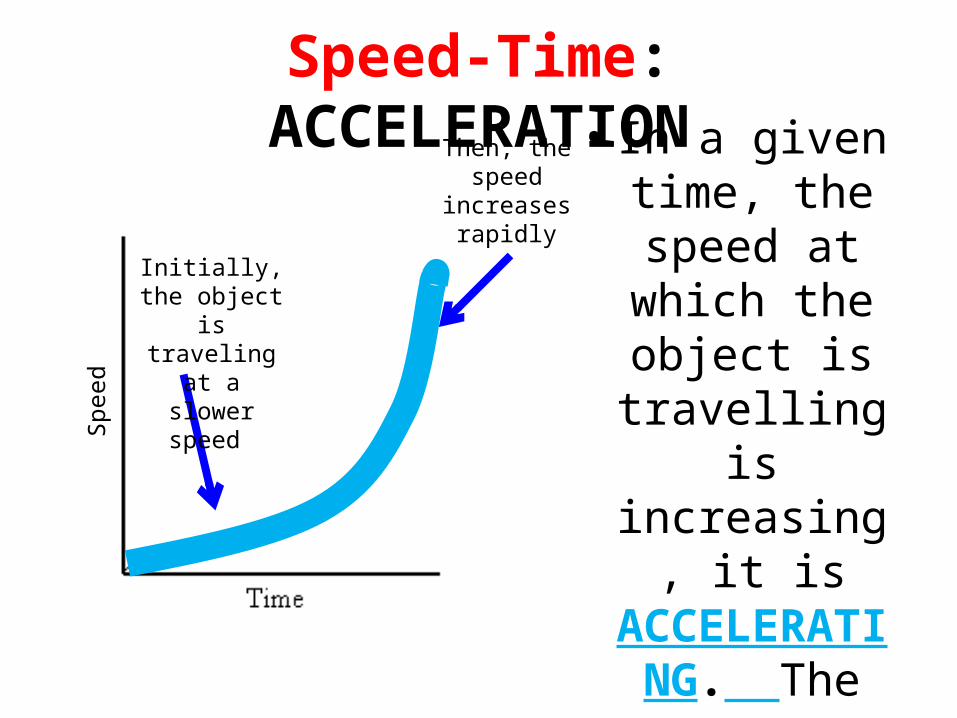
Speed-Time: ACCELERATION• In a given time,
the speed at which the object is
travelling is increasing, it is ACCELERATING.
The curve upward shows an INCREASE in
SPEED.
Spe
ed
Initially, the object is
traveling at a slower speed
Then, the speed
increases rapidly

Distance-Time: DECELERATION• This graph is
the same as above, but the
curve downward
shows DECELERATION or a DECREASE
IN SPEED.

Speed-Time: DECELERATION• In a given time,
the speed at which the object
is travelling is decreasing, it is DECELERATING.
The curve downward shows
a DECREASE IN SPEED.
Spe
ed
The speed rapidly declines and the object
slows down
Initially, the object is traveling at a very fast
speed.

Putting it all together
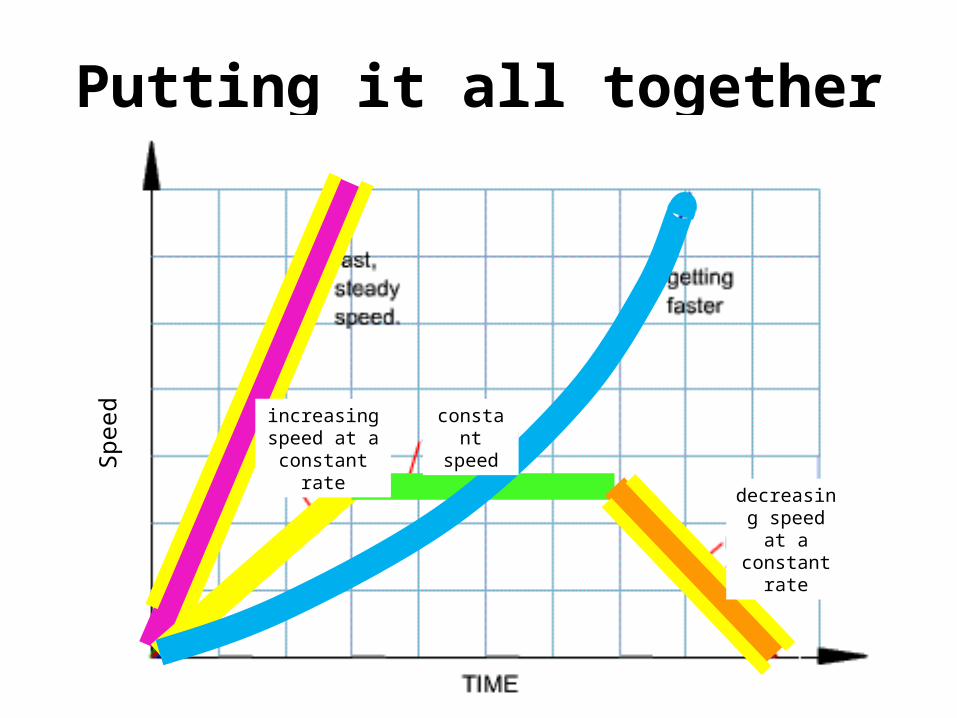
Putting it all togetherS
peed constant
speed
decreasing speed at a constant
rate
increasing speed at a
constant rate


