12
District 3 State of the Corridor Report July 2010 Interstate 80 & Capital City Freeway 0 nterstate 80 & Ca nt CALTRANS DISTRICT 3 corridor system management plan

Dis
tric
t
3
State of the Corridor ReportJuly 2010
Interstate 80 & Capital City Freeway0nterstate 80 & Cant
CALTRANS DISTRICT 3corridor system management plan

state of the corridor report [ 1 ]

CALTRANS DISTRICT 3corridor system management plan
State Of the Corridor ReportInterstate 80 & Capital City Freeway
July 2010

state of the corridor report [ 1 ]

Interstate 80 & Capital City Freeway state of the corridor report [ 1 ]
Overview Corridor System Management Plans (CSMP) are comprehensive operations and management plans intended to
maintain and enhance corridor mobility through the integrated management of all major transportation modes
within the corridor. This includes highways and freeways, parallel and connecting local and regional roadways,
public transit and bikeways, along with intelligent transportation technologies, which could include ramp meter-
ing, coordinated traffi c signals, changeable message signs for traveler information, such as incident management,
bus/carpool lanes and car/vanpool programs, and transit strategies. Together, these facilities comprise the CSMP
managed network. CSMP success is based on the premise of managing a selected set of transportation compo-
nents within a designated corridor as a system rather than as independent units. Each CSMP identifi es current
management strategies, existing travel conditions and mobility challenges, corridor performance management,
proposed management strategies, and needed capital improvements.
2010 Report on Interstate 80 & Capital City Freeway
Corridor System Management Plan

Interstate 80 & Capital City Freeway state of the corridor report [ 2 ]
Purpose of the State of the Corridor Report
The annual State of the Corridor (SOTC) Report maintains the momentum started by the completion of the fi rst CSMP by reporting on the ongoing implementation of CSMP strategies and movement towards true integrated multimodal corridor system management, as well as anticipated corridor mobility challenges, and impediments to CSMP imple-mentation. It is important to note that the analysis of performance in the fi rst report since the completion of the CSMP is limited to the State Highway System (SHS) only due to the lack of performance data for the non-SHS transportation modes. Future editions of this report will include a more comprehensive report on the performance of the various transportation modes within the corridor, regardless of ownership, as we move toward integrated performance mea-surement, management and operations
Proposition 1B Bond Project Status
CSMPs were developed for corridors associated with the Corridor Mobility Improvement Account (CMIA) and Highway 99 Bond Programs, supported by the Highway Safety, Traffi c Reduction, Air Quality, and Port Security Bond Act of 2006, Proposition 1B. One project on Interstate 80 (I-80) / State Route (SR) 51 was awarded CMIA funds. The status of the project is as follows:
I-80 “Fixing the Bottleneck” High Occupancy Vehicle Lanes (HOV) Project: The remaining two phases of the “Fixing the Bottleneck” HOV and auxiliary lane project in Roseville should be completed by 2011, one year ahead of schedule. Phase 2 of the project consists of constructing both eastbound and westbound HOV and auxiliary lanes from west of the Sacramento/Placer County line to Miners’ Ravine Bridge with bridge widening and ramp modifi cations and is scheduled for completion in 2010. Phase 3 of this project, which extends the HOV and auxiliary lanes from Miners’ Ravine Bridge to east of the SR 65 interchange and widens Miners’ Ravine Bridge in both directions, is scheduled for completion by 2011. Major Corridor Accomplishments
I-80 “Across the Top” HOV Lanes Project: The California Transportation Commission approved using $65 million of CMIA saving for the I-80 “Across the Top” HOV project in May 2010 and construction is anticipated to begin in the Spring of 2011. This project will construct bus/carpool lanes between the Sacramento River Bridge and the Watt Avenue Sac-ramento Regional Transit (SacRT) light rail station. This project has been identifi ed in the I-80 CMSP as one of the “Key Projects” considered most critical to corridor mobility. The project also includes construction of auxiliary lanes and Traffi c Operations Systems in select locations. This is a notable success that will greatly enhance mobility options in the corridor by providing signifi cant travel time advantages to express bus services and carpools serving job centers in downtown Sacramento and the Roseville areas.
I-80 / Sierra College Boulevard Interchange: This project modifi ed the existing interchange to correct traffi c op-erational defi ciencies by widening the overcrossing and reconstructing all the ramps. The project was completed on schedule in July 2009
I-80 / SR 65 Interchange Project Study Report (PSR): The I-80/SR65 PSR was completed in June 2009. The project proposes constructing bi-directional HOV direct connector lanes between I-80 and SR 65, replacing the eastbound to northbound (NB) SR 65 loop-connector with a fl yover connector, structure widening of the east Roseville viaduct and possible replacement of the Taylor Road over crossing, and widening the southbound (SB) SR 65 and westbound I-80 to northbound SR 65 connectors. The project will soon be in the Project Approval and Environmental Document stage of development.

Interstate 80 & Capital City Freeway state of the corridor report [ 3 ]
I-80 / Eureka Road On-Ramp Improvements: The City of Roseville is administering this project, which will result in better functioning of the I-80/ Eureka Road interchange and eliminate backups on the eastbound mainline. Proposed improvements include constructing a fourth travel lane on westbound Eureka Road beginning east of North Sunrise Avenue and extending to the eastbound I-80 on-ramp, modifying the existing intersection striping to include two lanes onto the eastbound I-80 on-ramp, and widening the eastbound Eureka Road off -ramp. The project is currently in the design phase and construction is anticipated to begin in March 2011.
High Occupancy Toll (HOT) Lanes: A feasibility study to examine establishing HOT lanes on I-80 between I-5 in Sacra-mento and SR 65 in Roseville has been completed. The HOT lanes would utilize HOV lanes on I-80. The study assumed that the “Across the Top” HOV and auxiliary lanes project in Sacramento County would be constructed. The study, which was funded by a Caltrans Planning Partnership grant and jointly managed by Caltrans, the Sacramento Area Council of Governments (SACOG), and the Placer County Transportation Planning Agency (PCTPA), concluded that the capital and operations costs to develop and maintain HOT lanes would exceed projected revenue for many years. The study indicated that HOT lanes would have to be subsidized and will not pay for themselves until approximately 2035.
Sacramento Regional Transit Double Tracking: Funding has been approved for SacRT to double track the light rail line from downtown Sacramento to the I-80 / Watt Avenue interchange. Construction of this project should be completed by 2012. This project will allow limited stop service from downtown to the Watt/I-80 light rail station.
ARRA Funded Traffi c Operations System Project: The CSMP notes that a critical component of resolving mobility challenges is the need for detailed data, analysis, and communication regarding system performance. To move toward meeting these needs, work began to install Changeable Message Signs (CMS) and Closed Circuit Television Cameras (CCTV) along I-80. These are fi nanced entirely by the American Recovery and Reinvestment Act of 2009. CCTVs will be installed at the Rocklin Road, Taylor Road and SR 65 interchanges. A CMS will be installed on the west bound Rocklin Road on-ramp.

P
erfo
rman
ce M
easu
res
(2008 D
ata
)
To
tal
Veh
icle
Ho
urs
of
Dela
y2
To
tal
Veh
icle
Ho
urs
of
Dela
y2
Min
ute
s o
f
Del
ay
per
Veh
icle
2
Min
ute
s o
f
Del
ay
per
Per
son
2
Veh
icle
Tra
vel
Tim
e (M
inu
tes)
2
Co
un
ty
Lo
cati
on
P
ost
Mil
es
Dis
tan
ce
(Mil
es)
Av
era
ge
Da
ily
Tra
ffic
1
LO
S1
Da
ily
P
eak
Ho
ur3
P
eak
Ho
ur3
P
eak
Ho
ur3
P
eak
Ho
ur3
Dis
tres
sed
Pa
vem
ent
(la
ne
mil
es)
4
20
06
-20
09
Rep
ort
ed
Co
llis
ion
Ra
te
Co
mp
aris
on
(%)5
ST
AT
E H
IGH
WA
Y S
YS
TE
M:
I-
80
SO
L
SR
11
3 N
ort
h t
o Y
OL
/SO
L C
ou
nty
lin
e 4
2.6
7/4
4.7
2
2.0
5
11
5,0
00
C
9
2
0
.02
0
.03
1
.92
9
6
0%
YO
L/S
OL
Co
un
ty l
ine
to M
ace B
l. I
C
0.0
0/
2.6
8
2.6
8
12
5,0
00
E
1
57
3
1
0.2
3
0.2
5
2.8
3
2
58
%
Mac
e B
l. I
C t
o U
.S.
50
ju
nct
ion
2
.68
/ 9
.55
6
.88
1
45
,00
0
F
2,2
98
2
29
0
.41
0
.46
7
.21
1
5
5%
Y
OL
U.S
. 5
0 j
un
ctio
n t
o Y
OL
/SA
C C
ou
nty
lin
e 9
.55
/ 1
1.7
2
2.1
7
90
,00
0
D
21
4
23
0
.19
0
.21
2
.26
3
6
4%
YO
L/S
AC
Co
un
ty l
ine
to I
-5 j
un
ctio
n
0.0
0/
2.5
5
2.5
5
90
,00
0
D
11
2
16
0
.12
0
.13
2
.47
4
7
4%
I-5
ju
nct
ion
to
SR
51
2
.55
/ 1
0.9
9
8.4
4
14
9,0
00
F
1
,86
9
41
3
3.0
2
3.3
2
11
.46
1
8
65
%
SA
C
SR
51
to
SA
C/P
LA
Co
un
ty l
ine
10
.99
/18
.00
7
.01
2
24
,00
0
F
65
5
15
9
0.5
4
0.6
6
7.3
2
18
6
9%
SA
C/P
LA
Co
un
ty l
ine
to S
R 6
5 j
un
ctio
n
0.0
0/
4.1
6
4.1
6
16
5,0
00
F
9
68
2
21
1
.12
1
.23
5
.02
5
6
9%
P
LA
S
R 6
5 j
un
ctio
n t
o S
ierr
a C
oll
ege
Blv
d.
IC
4.1
6/
7.4
2
3.2
6
11
9,0
00
E
1
51
2
1
0.2
3
0.2
5
3.4
9
5
41
%
TO
TA
L
--
39
.19
--
--
6,
433
1,11
5 5
.88
6
.54
4
3.9
8
65
--
S
R 5
1
SA
C
U.S
. 5
0/S
R 9
9 j
ct. to
Ard
en W
y./
SR
16
0 I
C
0.0
0/
4.3
5
4.3
5
16
3,0
00
F
2,
255
670
5.9
6
6.7
6
10
.31
2
1
35
%
A
rden
Wy
./S
R 1
60
IC
to
I-8
0 I
C
4.3
5/
8.8
6
4.6
1
13
7,0
00
F
84
8 21
9 2
.11
2
.32
6
.62
3
9
6%
TO
TA
L
--
8.8
6
--
--
3,10
3 88
9 8
.07
9
.08
1
6.9
3
5
--
1 S
ou
rce:
Sta
te H
igh
wa
ys-
Av
erag
e D
ail
y T
raff
ic (
AD
T)
and
Lev
el o
f S
erv
ice
(LO
S)
cal
cula
ted
base
d o
n 2
008
Cal
tran
s’ T
raff
ic V
olu
mes
on
Ca
lifo
rnia
Hig
hw
ays
an
d H
igh
wa
y C
ap
aci
ty M
an
ua
l. L
OS
cal
cula
tio
ns
base
d o
n 2
00
8 P
eak
Ho
ur
Vo
lum
es.
2
So
urc
e: D
ela
y i
s th
e av
era
ge
add
itio
nal
tra
vel
tim
e b
y v
ehic
les/
per
son
s tr
avel
ing
un
der
60
mp
h.
Dat
a d
eriv
ed f
rom
20
09
PeM
S’s
tra
ffic
dat
a.
3 P
eak
Ho
ur
is d
uri
ng
PM
. 4 S
ou
rce:
20
08
Cal
tran
s’ D
ivis
ion
of
Main
ten
ance
Pa
vem
ent
Su
mm
ary
Rep
ort
. D
istr
esse
d p
avem
ent
is c
ateg
ori
zed
as
(1)
“Maj
or
Str
uct
ura
l D
istr
ess
” w
hic
h i
nd
icate
s th
e p
avem
ent
has
sev
ere
cra
ckin
g a
nd
is
lik
ely
to
hav
e a
po
or
rid
e,
(2)
“Min
or
Str
uctu
ral
Dis
tres
s”,
w
hic
h i
nd
icate
s th
e p
avem
ent
has
mo
dera
te c
rack
ing
an
d m
ay h
ave
a p
oo
r ri
de,
and
(3
) “P
oo
r R
ide Q
uali
ty (
On
ly)”
, w
hic
h i
nd
icat
es t
he
pav
emen
t ex
hib
its
few
cra
cks
bu
t h
as
a p
oo
r ri
de
con
dit
ion
. 2
00
9 d
ata
no
t av
aila
ble
as
of
Jun
e 3
, 2
01
0.
5 S
ou
rce:
20
06
th
rou
gh
20
09
Cal
tran
s’ T
raff
ic A
cci
den
t S
urv
eill
an
ce
an
d A
na
lysi
s S
yst
em (
TA
SA
S)
sum
mar
y d
ata
of
the
per
cen
tag
e ab
ov
e, o
r b
elo
w,
the
stat
ewid
e av
era
ge
for
fata
l, i
nju
ry a
nd
pro
pert
y d
amag
e-o
nly
co
llis
ion
s o
n c
om
para
ble
fa
cili
ties.
Pe
rfo
rma
nce
Me
asu
res
Cont
inuo
us c
orrid
or m
onito
ring
and
perf
orm
ance
mea
sure
s ar
e an
inte
gral
par
t of c
orrid
or m
anag
emen
t and
inve
stm
ent d
ecis
ion
mak
ing
to h
elp
iden
tify
imm
edia
te, e
f-fi c
ient
, and
eff e
ctiv
e sy
stem
ope
ratio
nal s
trat
egie
s an
d ca
pita
l im
prov
emen
ts.
Perf
orm
ance
mea
sure
s pr
ovid
e th
e im
port
ant,
dyna
mic
dai
ly in
form
atio
n ne
eded
to ra
pidl
y ad
dres
s ope
ratio
nal p
robl
ems c
ause
d by
recu
rren
t and
non
-rec
urre
nt tr
affi c
con
gest
ion.
The
2009
CSM
P id
entifi
ed
perf
orm
ance
mea
sure
s for
the
SHS,
loca
l roa
dway
s, an
d tr
ansi
t to
be u
sed
as p
art o
f the
corr
idor
syst
em m
anag
emen
t pro
cess
. As n
oted
pre
viou
sly,
th
ere
is li
mite
d or
a la
ck o
f cur
rent
per
form
ance
dat
a fo
r city
and
cou
nty
stre
ets,
and
ther
e is
nee
d to
dev
elop
add
ition
al tr
ansi
t and
new
bic
ycle
per
form
ance
mea
sure
s. A
s su
ch, t
his
Repo
rt o
nly
incl
udes
SH
S pe
rfor
man
ce m
easu
res.
As
we
cont
inue
to s
triv
e to
est
ablis
h a
mul
ti-m
odal
CSM
P, fu
ture
iter
atio
ns w
ill in
clud
e lo
cal r
oadw
ays,
tran
sit,
and
bicy
cle
perf
orm
ance
mea
sure
s.
Tabl
e 1
incl
udes
the
perf
orm
ance
mea
sure
s tha
t wer
e in
itial
ly id
entifi
ed
in th
e 20
09 C
SMP
and
have
bee
n up
date
d us
ing
2009
PeM
S an
d Ta
ch R
un d
ata.
The
200
9 CS
MP
used
20
07 d
ata
from
a n
umbe
r of d
iff er
ent s
ourc
es b
ecau
se o
f inc
onsi
sten
t and
unr
elia
ble
PeM
S co
vera
ge. S
ince
the
com
plet
ion
of th
e 20
09 C
SMP
addi
tiona
l det
ectio
n ha
s bee
n co
mpl
eted
off e
ring
bett
er P
eMS
cove
rage
and
mor
e re
liabl
e da
ta.
As a
resu
lt, w
e w
ill u
se th
is R
epor
t and
the
2009
per
form
ance
mea
sure
s as
our
bas
elin
e to
trac
k sy
stem
pe
rfor
man
ce a
nd fu
ture
ann
ual “
Stat
e of
the
Corr
idor
” rep
orts
will
incl
ude
run-
char
ts in
dica
ting
chan
ges i
n th
e pe
rfor
man
ce m
easu
res i
n lo
gica
l tim
e in
crem
ents
.
Ta
ble
1:
Inte
rsta
te 8
0 (
I-8
0)
an
d C
ap
ita
l C
ity
Fre
ew
ay
(S
R 5
1)
CS
MP
Hig
hw
ay
Pe
rfo
rma
nce
Me
asu
res
Su
mm
ary

Interstate 80 & Capital City Freeway state of the corridor report [ 5 ]
Moving Forward
The following key opportunities and challenges should be addressed as we move forward to implement system man-agement within this corridor
Transit and Bicycle Performance Measures: The analysis of transit performance was limited to one performance mea-sure – Available Daily/Peak Hour Capacity (%). This measure compares ridership with capacity on a daily and peak hour basis. The intent was to indicate how well transit was performing relative to ridership increases over time. However, the usefulness of this measure has proven questionable, given the likelihood of the routes changes and limited data availability. In addition, the 2009 CSMP did not include bicycle performance measures, though, committed to working with stakeholders to establish them. In an eff ort to establish additional performance measures for transit and bikes, we will continue to work with our local and regional partners to develop useful performance measures for alternative transportation modes, including performance measures being developed by SACOG as part of the Metropolitan Trans-portation Plan update process.
Sacramento Regional Transit Service Cuts: In response to an estimated $25 million budget shortfall for Fiscal Year 2011, the SacRT District Board of Directors approved major service reductions to bus, light rail, and paratransit service. Included in this service reduction, is the elimination of all six of the Sacramento Regional Transit District’s peak hour time only Express Bus Routes featured in the I-80/SR 51 CSMP. These include Routes 100 (Antelope), 101 (Don Julio), 102 (Hillsdale), 104 (Sunset), 106 (Madison), and 107 (Greenback).
I-80 / Rocklin Road Interchange Improvements: The City of Rocklin is administering this project. While the City is still completing some preliminary work, the project has been proposed for inclusion in the Sacramento Area Council of Governments (SACOG) 2011 MTP update. Proposed improvements include constructing one eastbound auxiliary lane on I-80 from east of the SR 65 separation to the Rocklin Road eastbound off -ramp and reconstructing the eastbound and westbound on/off -ramps at Rocklin Road. These improvements are needed to address congestion and safety is-sues associated with increased traffi c due to the growth of the South Placer County region.
SR 51 Corridor Development Plan: The Capital City Freeway (SR 51) is a key regional roadway which presents a signifi -cant challenge due to the enormous level of traffi c it accommodates and its constrained location. For example, one of the many bottlenecks on SR 51 occurs where four northbound lanes drop down to three lanes at the E Street onramp. Furthermore, the proposed signifi cant development at Cal Expo, relocation of the Sacramento Zoo, and other pro-posed developments in the vicinity of SR 51 will further contribute to unacceptable congestion on SR 51. Accordingly, the Corridor Development Plan is being prepared to identify the most effi cient and eff ective improvement projects, including the feasibility, scope, and cost of HOV lanes, auxiliary lanes, ramp modifi cations, and other operational im-provements. This report is scheduled for completion by June 2011.
Operational Improvements Projects: The I-80/SR51 CSMP recognizes that since the construction of California’s SHS is virtually completed in the Sacramento region, major emphasis has largely shifted to focused capacity expansions, system maintenance, and operational improvements such as ramp meters, ramp widening, auxiliary lanes, and ramp merge extensions. To address these needs, Caltrans is currently developing PSRs for the high priority operational im-provement projects that will be most eff ective in relieving congestion. Caltrans will seek funding for these projects through all available means, including SACOG regional discretionary programs. These projects include:
• Eastbound I-80, construct three auxiliary lanes from Interstate 5 to Truxel Road – EA 1F130K.

Element County/PM Location
Interstate 80
CCTV Sac/1.30 W. El Camino Avenue
RMS Pla/3.95 WB SR 65
RMS Pla/4.50 EB SR 65
RMS Pla/6.27 EB Rocklin Road
RMS Sac/1.20 WB W. El Camino Ave (EB)
RMS Sac/1.35 WB W. El Camino Ave (WB)
RMS Sac/10.79 EB Watt Ave @ RT Station
RMS Sac/16.67 EB Antelope Road
TMS Pla/5.10 Rocklin Road
State Route 51
RMS Sac/0.09 SB 30th
/T Street
RMS Sac/0.59 SB N Street @ 29th
Street
RMS Sac/1.07 SB 29th
/H Street
RMS Sac/2.00 SB Richards Blvd
RMS Sac/4.07 Arden Way (WB)
RMS Sac/4.09 NB Route 160
RMS Sac/4.10 SB Arden Way (EB)
RMS Sac/4.20 NB Arden Way (EB)
RMS Sac/4.23 NB Arden Way (WB)
RMS Sac/5.37 SB Marconi Avenue
Interstate 80 & Capital City Freeway state of the corridor report [ 6 ]
In addition, the following additional operational improvement needs have been identifi ed to optimize system perfor-mance. To help facilitate the implementation of these projects, Caltrans will include these projects in our 3 Year PSR Program in anticipation of the pursuit of regional discretionary funding. The feasibility and prioritization of the SR 51 projects will be analyzed more closely within the SR 51 Corridor Development Plan:
• Northbound and southbound SR 51, add auxiliary lanes from Marconi to Watt• Southbound SR 51, add auxiliary lane from Exposition slip off -ramp to Exposition loop on-ramp• Northbound SR 51, add auxiliary lane from Arden off -ramp to the SR 160 on-ramp• Northbound SR 51, add auxiliary from north of J Street to Arden• Southbound SR 51, add ramp meters and HOV bypass lanes, where feasible, at all on-ramps from H Street to Florin Road (Highway 99)• Southbound and northbound SR 51, add ramp meters and HOV bypass lanes, where feasible, at all on-ramps from Arden to Watt
Intelligent Transportation Systems: Intelligent Transportation Systems (ITS) are a key component of corridor system management. ITS provides an opportunity to improve mobility through the corridor by using low cost strategies to improve overall effi ciency without adding capacity. An array of technologies are used to detect and manage trans-portation activities in the corridor such as Closed Circuit Television System (CCTV), Changeable Message Signs (CMS), Extinguishable Message Signs (EMS), Electronic Tag Readers (ETR), Highway Advisory Radio (HAR), Ramp Meters (RMS), Roadside Weather Information System (RWIS), and Traffi c Monitoring Stations (TMS). These elements are typically spaced every ½ mile in the urbanized areas of District 3.
The use of the ITS tools in conjunction with the Regional Transportation Management Center improve effi ciency by collecting and disseminating traffi c information to the travelling public. This helps reduce delay and improve safety within the corridor. The May 2009 CSMP identifi ed a variety of system management strategies and elements currently being used on the managed network and their locations. The following table shows existing ITS needs for which fund-ing still must be found:
Interstate 80 & Capital City Freeway state of the corridor report [ 7 ]
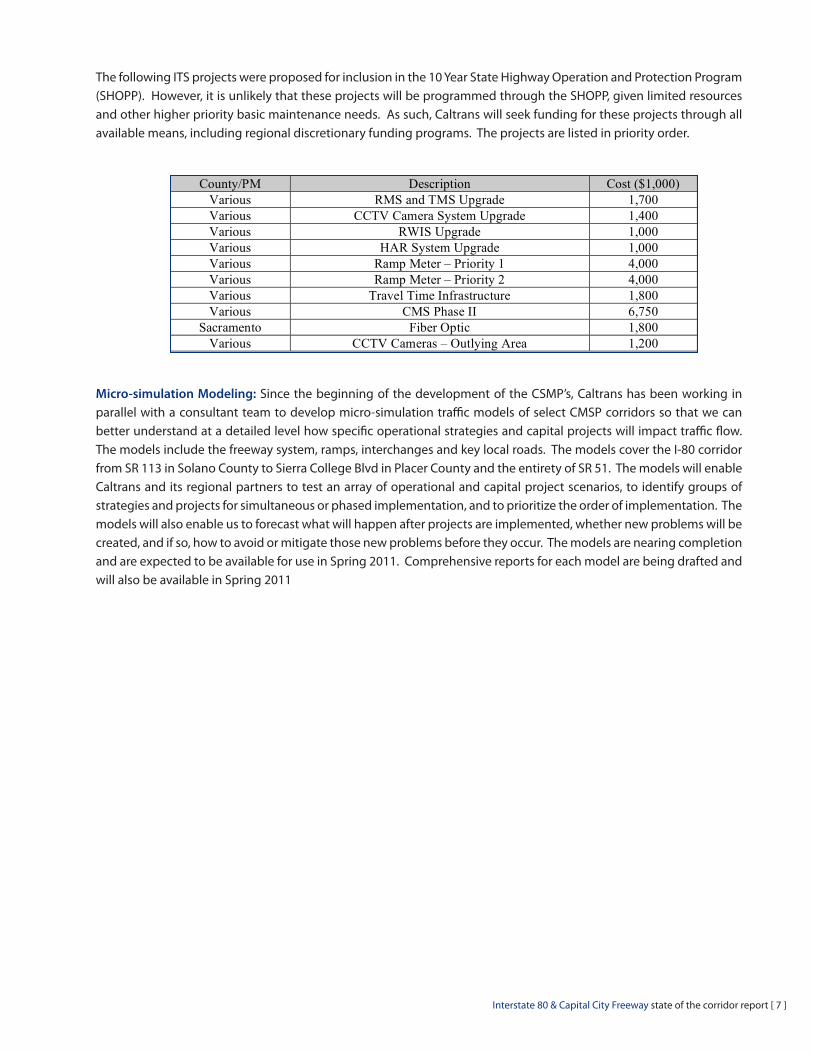
The following ITS projects were proposed for inclusion in the 10 Year State Highway Operation and Protection Program (SHOPP). However, it is unlikely that these projects will be programmed through the SHOPP, given limited resources and other higher priority basic maintenance needs. As such, Caltrans will seek funding for these projects through all available means, including regional discretionary funding programs. The projects are listed in priority order.
Micro-simulation Modeling: Since the beginning of the development of the CSMP’s, Caltrans has been working in parallel with a consultant team to develop micro-simulation traffi c models of select CMSP corridors so that we can better understand at a detailed level how specifi c operational strategies and capital projects will impact traffi c fl ow. The models include the freeway system, ramps, interchanges and key local roads. The models cover the I-80 corridor from SR 113 in Solano County to Sierra College Blvd in Placer County and the entirety of SR 51. The models will enable Caltrans and its regional partners to test an array of operational and capital project scenarios, to identify groups of strategies and projects for simultaneous or phased implementation, and to prioritize the order of implementation. The models will also enable us to forecast what will happen after projects are implemented, whether new problems will be created, and if so, how to avoid or mitigate those new problems before they occur. The models are nearing completion and are expected to be available for use in Spring 2011. Comprehensive reports for each model are being drafted and will also be available in Spring 2011
County/PM Description Cost ($1,000)
Various RMS and TMS Upgrade 1,700
Various CCTV Camera System Upgrade 1,400
Various RWIS Upgrade 1,000
Various HAR System Upgrade 1,000
Various Ramp Meter – Priority 1 4,000
Various Ramp Meter – Priority 2 4,000
Various Travel Time Infrastructure 1,800
Various CMS Phase II 6,750
Sacramento Fiber Optic 1,800
Various CCTV Cameras – Outlying Area 1,200


