This is a repository copy of Interventions Targeting Child Undernutrition in Developing Countries May Be Undermined by Dietary Exposure to Aflatoxin.
White Rose Research Online URL for this paper:http://eprints.whiterose.ac.uk/124824/
Version: Accepted Version
Article:
Watson, S, Gong, YY orcid.org/0000-0003-4927-5526 and Routledge, M (2017) Interventions Targeting Child Undernutrition in Developing Countries May Be Undermined by Dietary Exposure to Aflatoxin. Critical Reviews in Food Science and Nutrition, 57 (9). pp. 1963-1975. ISSN 1040-8398
Items deposited in White Rose Research Online are protected by copyright, with all rights reserved unless indicated otherwise. They may be downloaded and/or printed for private study, or other acts as permitted by national copyright laws. The publisher or other rights holders may allow further reproduction and re-use of the full text version. This is indicated by the licence information on the White Rose Research Online record for the item.
Takedown
If you consider content in White Rose Research Online to be in breach of UK law, please notify us by emailing [email protected] including the URL of the record and the reason for the withdrawal request.
aflatoxin G2 (AFG2). AFB1 is the most potent toxin and is the most prevalent, accounting for 53
an average of 70% of the total aflatoxin content in food, although this may vary depending on 54
the strain of the fungus and local conditions. Aflatoxin M1 (AFM1) is a toxic metabolite of 55
aflatoxin B1, which can be found in milk of lactating mothers, and milk and meat of animals 56
exposed to aflatoxin. 57
58
Human exposure to contaminated food is highest in countries with high consumption of 59
susceptible staple crops grown and stored under optimal fungal growth conditions. Aflatoxin 60
exposure often causes acute outbreaks and sometimes fatal liver toxicity (7). Chronic exposure 61
can increase the risk of liver cancer (8), in particular through an interaction with the hepatitis B 62
virus. There is increasing evidence that aflatoxin plays a role in other health effects such as 63
hepatomegaly (9), immune suppression (10-12) and growth faltering in children (13, 14). 64
Chronic aflatoxin exposure is evident throughout life, including the critical first 1,000 days 65
(15). 66
67
With the increasing evidence that aflatoxin can exacerbate the effects of undernutrition, and 68
contribute to growth faltering, it is likely that aflatoxin exposure has inhibited the expected 69
growth improvement predicted for nutritional intervention programs. In this review we will 70
summarise the burden of childhood undernutrition and the current achievement of nutritional 71
specific interventions for improving child growth, review the evidence for aflatoxin exposure 72
exacerbating undernutrition and reflect on the necessity for considering aflatoxin exposure in 73
nutritional intervention programs. 74
75
5
Child undernutrition and nutrition specific interventions in the developing world 76
77
Protein energy malnutrition 78
Protein energy malnutrition (PEM), considered to be the leading form of childhood malnutrition 79
in developing countries, includes the disorders kwashiorkor, marasmus and marasmus- 80
kwashiorkor, which are differentiated by the balance between inadequate protein intake and 81
other energy sources (16). PEM is often a consequence of suboptimal breastfeeding, delayed 82
and/ or inadequate supplementation of appropriate complementary foods, lack of diet diversity 83
and infection that can lead to decreased absorption of essential nutrients. 84
85
In 2000, the WHO estimated that 26.7% of children < 5 years of age in developing countries 86
had PEM (17). There is a lack of recently conducted population based studies that have 87
investigated the prevalence of the different types of PEM in developing countries. Kwashiorkor, 88
oedematous malnutrition, has been included within the estimates for the prevalence of, and 89
deaths attributable to, severe acute malnutrition (SAM) (weight-for-height (WHZ) below -3, 90
according to WHO standards (18)). In 2011 the global prevalence of SAM in children < 5 years 91
was 3% (19 million) with higher percentages observed in central Africa (5.6%) and south-92
central Asia (5.1%) (1). 93
94
A recent systematic review evaluated the effectiveness of inpatient management for SAM using 95
the WHO protocol, as well as community-based treatments in low- and middle-income settings 96
(19). The authors found that case fatality rates for inpatient management of SAM, following 97
the WHO protocol, which involves fluid management and micronutrient supplementation, 98
ranged from 3.4% to 35%. Only two studies reported nutrition recovery rates, which were 99
79.7% and 83.3%. For the community-based treatment of SAM that involves the use of ready-100
6
to-use therapeutic food (RUTF), 51% of children were more likely to achieve nutritional 101
recovery than a standard care group. Although, this systematic review was limited in the 102
availability of high quality studies, the nutritional recovery rates of the interventions reviewed 103
were advantageous. The authors have concluded that future studies are warranted to compare 104
approaches to managing SAM and this includes identifying and tackling other aggravating 105
determinants of SAM. 106
107
Growth faltering 108
Stunting (height-for-age Z score (HAZ) < 2), wasting (weight-for-height Z score (WHZ) < 2) 109
and underweight (weight-for-age Z score (WAZ) < 2) (18) are major indicators of child 110
undernutrition. Severe undernutrition is considered when Z sores are <3. In 2011, 111
approximately 165 million (25.7%) children under the age of five years globally had stunted 112
growth, 52 million (8%) were classified as wasting and 100 million (16%) were underweight 113
(20). South-central Asia (36% stunted, 15% wasting and 30% underweight) as well as East 114
(42% stunted) and West Africa (36% stunted and 22% underweight) had the highest prevalence. 115
Growth faltering in early life is a predisposing risk factor for poor cognitive development, 116
reduced educational outcomes and economic productivity, as well as reduced survival in 117
adulthood (1). Micronutrient deficiencies alongside recurring infections are some of the well-118
recognised causes of child growth faltering in developing countries. There are three 119
micronutrient deficiencies of public health concern in developing countries; vitamin A, Iron 120
and zinc deficiency. Interventions (supplementation) targeting these specific micronutrients and 121
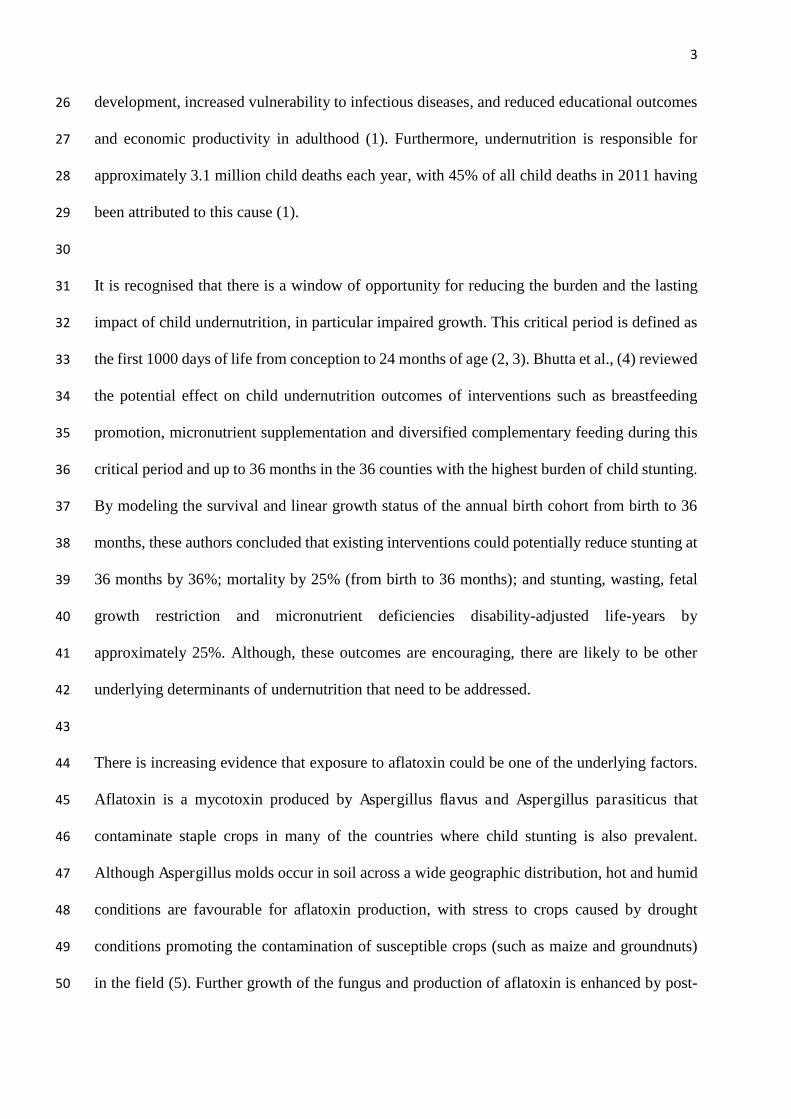
their impact on growth outcomes are summarised in table 1. 122
123
Zinc deficiency 124
7
A recent analysis conducted by Wessells and Brown (21) estimated the global prevalence of 125
zinc deficiency (ZD) as 17% in 188 countries, using zinc intake obtained from FAO food 126
balance sheets, with zinc and phytate contents calculated using a nutrient composition database 127
(table 1). Low-income countries such as those in sub-Saharan Africa and South Asia were most 128
at risk with a ZD prevalence of over 25% (21). ZD is primarily caused by low intake of animal 129
products and exacerbated by persistent diarrhoea (22, 23). ZD can negatively impact the 130
immune system, thereby enhancing susceptibility to infectious diseases such as diarrhoea, 131
malaria and pneumonia, especially in children (22). It may also aggravate intestinal 132
permeability and chronic inflammation, both pathways that underlie environmental 133
enteropathy, which is a sub-clinical condition involving reduced intestinal function that can 134
affect micronutrient absorption (23). Zinc has a fundamental role in cell division and growth; 135
thus, it can result in decreased concentrations of circulatory Insulin-like Growth Factor 1 (IGF-136
1), a possible pathway for slowed child growth in Zinc deficient children (24). 137
138
ZD in developing countries coincides with the high prevalence of stunted growth in children 139
observed in these countries (1, 21). In fact, assessing the number of children < 5 years old that 140
have stunted growth has been considered to be a proxy for zinc deficiency (21, 25), although 141
this is an indirect method of measuring ZD, and consequently is subject to confounding factors. 142
It would be expected, therefore, that zinc supplementation would have a positive effect on 143
growth. Four meta-analyses (26-29) have been identified that have investigated the impact of 144
zinc supplementation on growth indices in childhood (table 1). Three meta-analyses found that 145
zinc supplementation had a significant positive effect on linear growth (26, 27, 29) and two 146
found it had a positive effect on weight gain (26, 27). In contrast, Ramakrishnan et al. (28) 147
found no effect of zinc supplementation on linear growth or weight change but did find a 148
significant positive effect on change in WHZ score. Although it is apparent from the 149
8
aforementioned evidence that zinc can have a positive impact on growth, it is important to 150
highlight that its effect is only marginal. 151
152
Iron deficiency 153
Iron deficiency (ID) is the leading cause of anaemia (haemoglobin < 110g/L) and accounts for 154
~50% of all cases (30). For this reason anaemia is typically used as a proxy for ID. Stevens et 155
al. (31) estimated the global prevalence of total and severe anaemia in three population groups 156
known to be most vulnerable to these conditions; women of child bearing age (15-49 years), 157
children (6-59 months) and pregnant women. Using representative population based data 158
collected from 107 countries, it was evident that anaemia is of epidemic proportions worldwide 159
(table 1). Regional analysis showed Central and West Africa as having the highest prevalence 160
of anaemia and severe anaemia in children aged < 5 years in 1995 (80% and 9.7%) and 2011 161
(71% and 4.9%). The high prevalence observed in developing parts of the world is mostly likely 162
due to diets low in iron rich foods alongside poor absorption and diets high in phytate 163
compounds that inhibit iron absorption (32). Parasite infections as well as tuberculosis and HIV 164
are also thought to be risk factors. 165
166
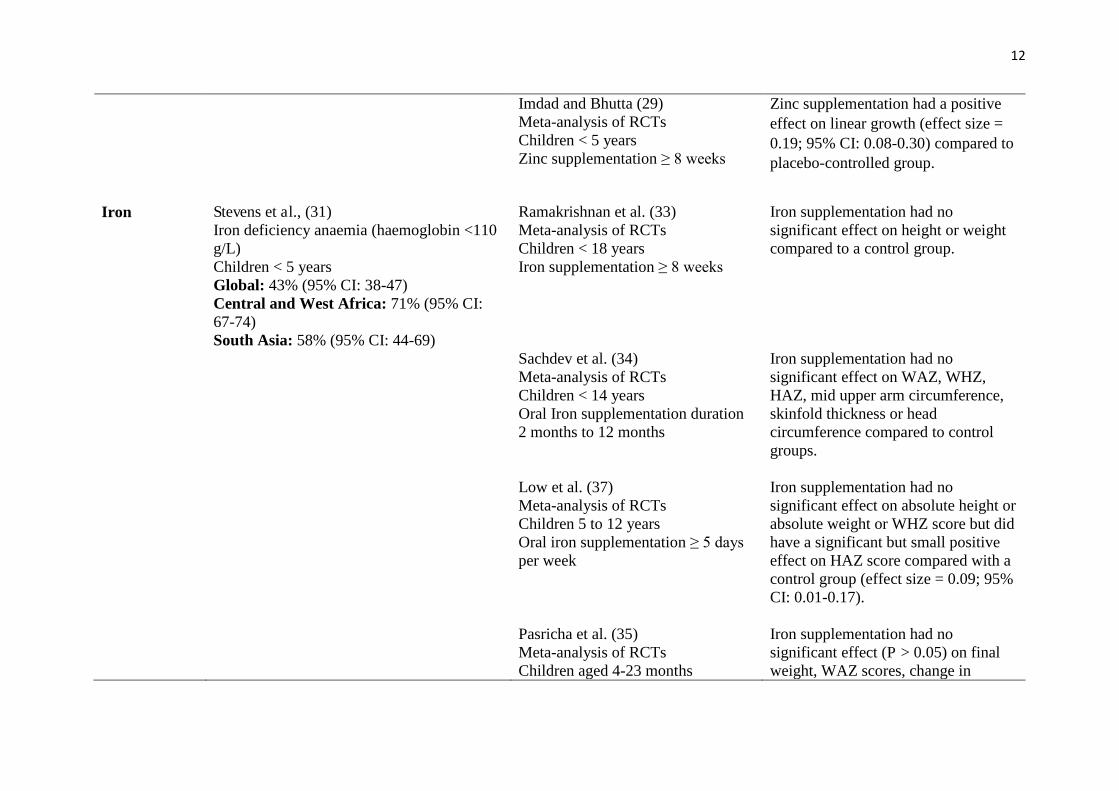
Poor growth and cognitive development during childhood have been suggested as major 167
consequences of iron deficiency; although, the evidence supporting these suggestions is 168
inconclusive. For example, several systematic reviews and meta-analyses of randomized 169
controlled trials (RCTs) have failed to discover a positive effect of iron supplementation on 170
different growth parameters in children (table 1) (33-36). However, a recent systematic review 171
and meta-analysis (37), found a small positive effect on growth (HAZ) in children that were 172
aged between 5 and 12 years. Likewise, systematic reviews have reported that iron 173
supplementation can have an impact on cognitive development especially in older children (37, 174
9
38) but appears to be ineffectual in young children and infants (35, 36, 38, 39). This evidence 175
indicates that iron supplementation may have more of an impact on growth performance and 176
cognitive development during mid-childhood. Of course, this may challenge the view that 177
interventions targeting growth should occur in the first 1,000 days of life (2, 3), as beyond this 178
timeframe interventions are considered to be ineffectual. Nevertheless, it is noticed that the 179
positive effect on growth reported in these studies (37) was only marginal, indicating that iron 180
supplementation targeting mid childhood may only have limited success as a public health 181
intervention. 182
183
Vitamin A deficiency 184
According to a WHO (40) report, vitamin A deficiency (VAD), defined as having serum 185
(plasma) retinol concentrations less than < 0.70 たmol/l or having a history of night blindness in 186
more severe cases, is considered a major public health problem in developing countries, 187
specifically in Asia and sub-Saharan Africa. In that report, the global prevalence of VAD 188
measured between 1995 and 2005 in pregnant women was 15.3% and when stratified according 189
to WHO regions, Africa and Asia had the highest rates (14.3% and 18.4%). This trend was also 190
observed in children under 5 years old. Global prevalence was 33.3%, with Africa (41.6%) and 191
Asia (33.5%) having higher rates than other parts of the world. 192
193
The developing fetus and preschool aged children are considered to be at-risk populations, 194
owing to the rapid growth and subsequent increased nutritional requirements during these 195
stages of the life course. In developing countries these additional nutritional requirements are 196
frequently not met owing to the lack of diet diversity, as well as the affordability of foods high 197
in vitamin A such as animal products, citrus fruits and dark green vegetables. 198
199
10
Over the past decade, some observational studies have found that maternal VAD was associated 200
with lower birth weight (41, 42). In contrast, according to a recent systematic review and meta-201
analysis vitamin A supplementation during pregnancy had no positive effect on birth weight 202
(43). Furthermore, vitamin A supplementation during childhood showed little or no effect on 203
growth performance in several RCTs (33, 44-47). 204
11
Table 1: Major micronutrient deficiencies of public health concern: prevalence, supplementation and growth outcomes in children Micronutrient Prevalence Micronutrient supplementation on
growth. Evidence from systematic reviews and meta-analyses
Effects on physical growth (95%CI)
Zinc Wessells and Brown (21) Using country specific FAO food balance sheets All ages (> 6months) Global: 17.3 ± 11.1% sub-Saharan Africa: 25.6 ± 12.2% South Asia: 29.6 ± 3.6% Prevalence of inadequate zinc intake was correlated with the prevalence of stunting in children < 5 years (r = 0.48; p <0.001)
Brown et al. (26) Meta-analysis of RCTs Children <12 years or prepubertal Zinc supplementation ≥ 8 weeks
Zinc supplementation had a positive effect on change in height (effect size = 0.35; 95% CI: 0.19-0.51) and change in weight (effect size = 0.31; 95% CI: 0.18-0.44). There was no significant effect on WHZ.
Brown et al. (27) Meta-analysis of RCTs Infants, pre-schooler and older pre-pubertal Zinc supplementation 2 weeks to 15 months
Zinc supplementation had a positive effect on change in height (effect size = 0.17; 95% CI: 0.08-0.26), change in weight (effect size = 0.12; 95% CI: 0.05-0.19) and a small marginal effect on change in WHZ score (effect size = 0.06; 95% CI: 0.00-0.12) compared with control groups.
Ramakrishnan et al. (28) Meta-analysis of RCTs Children ≤5 years Zinc supplementation ≥ 8 weeks
Zinc supplementation had no significant positive effect on change height or weight gain but did have a small positive effect on WHZ score (effect size = 0.06; 95% CI: 0.01-0.11) in comparison with placebo-controlled groups.
12
Imdad and Bhutta (29) Meta-analysis of RCTs
Children < 5 years Zinc supplementation ≥ 8 weeks
Zinc supplementation had a positive effect on linear growth (effect size = 0.19; 95% CI: 0.08-0.30) compared to placebo-controlled group.
Iron Stevens et al., (31)
Iron deficiency anaemia (haemoglobin <110 g/L) Children < 5 years Global: 43% (95% CI: 38-47) Central and West Africa: 71% (95% CI: 67-74) South Asia: 58% (95% CI: 44-69)
Ramakrishnan et al. (33) Meta-analysis of RCTs Children < 18 years Iron supplementation ≥ 8 weeks
Iron supplementation had no significant effect on height or weight compared to a control group.
Sachdev et al. (34) Meta-analysis of RCTs Children < 14 years Oral Iron supplementation duration 2 months to 12 months
Iron supplementation had no significant effect on WAZ, WHZ, HAZ, mid upper arm circumference, skinfold thickness or head circumference compared to control groups.
Low et al. (37) Meta-analysis of RCTs Children 5 to 12 years Oral iron supplementation ≥ 5 days per week
Iron supplementation had no significant effect on absolute height or absolute weight or WHZ score but did have a significant but small positive effect on HAZ score compared with a control group (effect size = 0.09; 95% CI: 0.01-0.17).
Pasricha et al. (35) Meta-analysis of RCTs Children aged 4-23 months
Iron supplementation had no significant effect (P > 0.05) on final weight, WAZ scores, change in
13
Daily oral iron supplementation weight, final length, HAZ scores, change in length or weight for length z score in comparison with the control group.
Thompson et al. (36) Meta-analysis of RCTs Children 2 to 5 years Oral iron supplementation ≥ 5 days per week
Iron supplementation had no positive effect on final height, final weight, change in height and change in weight compared to a control group
Vitamin A
WHO (40) (Serum retinol <0.70 µmol/L) Children < 5 years Global: 33.3% (95% CI: 31.1-35.4) Africa: 44.4% (95% CI: 41.3-47.5) South East Asia: 49.9% (95% CI: 45.1-54.8)
Ramakrishnan et al. (33) Meta-analysis of RCTs Children < 18 years Vitamin A supplementation ≥ 8 weeks
Vitamin A supplementation had no positive effect on absolute height change or weight change
14
It is clear from the evidence above that supplementation interventions targeting the main 205
micronutrients of public health concern in developing countries are not entirely effective in 206
improving child growth. Vitamin A supplementation markedly has no impact on child growth, 207
whereas zinc and iron supplementation seem to have peripheral effects. This suggests that there 208
are other underlying determinants of child growth faltering that need to be addressed. 209
210
Aflatoxin related undernutrition issues in the developing world 211
Aflatoxin exposure and its relationship with growth faltering. 212
The development and application of the AF-alb biomarker has enabled a number of 213
epidemiology studies examining human health effects of aflatoxin exposure (48). This 214
biomarker, which is usually measured by an ELISA method (49) has shown a good correlation 215
with aflatoxin intake in adults through a groundnut based diet in The Gambia (50), as well as 216
in children through a maize-based weaning diet in Tanzania (51). Compared to other available 217
short term (for previous 1-2 days exposure) biomarkers such as the aflatoxin DNA adduct, 218
AFM1 and aflatoxin metabolites in urine, this biomarker reflects the previous 2-3 months 219
exposure at the individual level, and is therefore more appropriate for assessing chronic 220
exposure related health outcomes. 221
222
There is mounting evidence that aflatoxin exposure occurs from gestation onwards throughout 223
life (15). Exposure occurs in utero through the transfer of aflatoxins from the mother to the 224
foetus via the placenta. Several studies have investigated this route of exposure and have found 225
detectable levels of aflatoxin or AF-alb in cord blood samples (52-56). Only a few studies have 226
examined the impact of exposure in utero on birth weight (57-59). All have reported a 227
significant inverse relationship with higher exposure in utero corresponding to lower weight at 228
15
birth. A study by de Vries et al (57) conducted in rural Kenya, examined aflatoxin levels in 229
maternal and cord blood samples. Aflatoxin was detected in over half of the maternal samples 230
and 37% of the cord blood samples. Females born to aflatoxin positive mothers had a mean 231
birth weight that was 225g lower than those born to mothers free from aflatoxin exposure. 232
Similar results were observed in a study conducted in the Middle East by Abdulrazzaq et al., 233
(58), where high aflatoxin levels in maternal and cord blood samples were significantly related 234
to lower birth weights (r = -0.654, P = 0.0001 and r = -0.565, P = 0.001, respectively). More 235
recently, a cross-sectional study of 785 pregnant Ghanaian women, after adjusting for socio-236
demographic variables and other factors, found increased odds of delivering a baby with a low 237
birth weight in the highest quartile (59). The highest quartile represented the highest levels of 238
aflatoxin exposure measured in blood during pregnancy (OR, 2.09; 95% CI: 1.19–3.68). 239
240
Aflatoxin exposure in utero may also play a role in stunted growth in early childhood (up 24 241
months). Only one study to date has explored this temporal relationship (56), and found that 242
higher levels of AF-alb in maternal blood were significantly associated with lower weight (P = 243
0.012) and height (P = 0.044) gain, after adjusting for potential confounding factors. 244
Furthermore, the authors predicted that a reduction in maternal AF-alb level from 110 pg/mg 245
to 10 pg/mg would lead to a 2 cm increase in height and a 0.8 kg increase in weight within the 246
first 24 months of life. 247
248
Usually studies that have examined exposure in utero by measuring maternal blood only 249
obtained measurements at one point in time. A recent study conducted by Castelino et al., (60) 250
explored the effect of season and gestation stage on aflatoxin exposure in pregnant women from 251
Gambia. Results showed that mean AF-alb levels were higher during the dry season than the 252
16
rainy season. AF-alb levels increased marginally from early to later gestation during the dry 253
season (41.8 vs 34.5 pg/mg; P < 0.05). Although early pregnancy has been considered a period 254
when the foetus is most vulnerable, later pregnancy marks the fast growth period of the foetus, 255
which may exert a profound adverse impact on growth. Further research is warranted to 256
determine the longer term health effects of aflatoxin exposure during both early and late 257
pregnancy. 258
259
Weaning is the transition from breast milk to solid food, and typically commences between 3 260
and 6 months. It is often a period in developing countries when children are most susceptible 261
to PEM, specifically, kwashiorkor. Because weaning foods such as maize are prone to aflatoxin 262
contamination, there may also be high aflatoxin exposure during the weaning period. This was 263
evident in a study conducted by Gong et al., (61) in Benin and Togo, as children that were fully 264
weaned had approximately 2-fold higher mean AF-alb levels than children who were still 265
partially breastfed. Although breastfeeding is a period of lower aflatoxin exposure, there is still 266
some exposure from breast milk, with aflatoxin M1 having been found in breast milk samples 267
in many studies (62). Nevertheless, AFM1, which is the hydroxylated metabolite of aflatoxin 268
that is found in milk, is less toxic than AFB1 that is found in food; therefore extending the 269
breastfeeding period may help reduce the negative health impacts, such as growth faltering, that 270
are associated with aflatoxin exposure. 271
272
The impact of aflatoxin exposure on growth is considered the most prominent during the first 273
two years after birth. One of the first studies examining the association between aflatoxin 274
exposure and child growth performance was a cross-sectional study of 480 children from Benin 275
and Togo aged between 9-months and 5 years (13). Prevalence of aflatoxin was high in this 276
17
sample with 99% of the children having detectable levels and a reported geometric mean of 277
32.8 pg/mg. Undernutrition was also evident as 33%, 6 % and 29% of the children were 278
classified as having stunted growth (HAZ <-2), wasting (WHZ <-2) and being underweight 279
(WAZ <-2); respectively. Significant negative correlations between AF-alb and each of the 280
growth parameters were observed (P = 0.001 for stunting; P = 0.047 for wasting and P = 0.005 281
for underweight). Another cross-sectional study by Turner et al., (10) found that AF-alb levels 282
were weakly associated with wasting (P = 0.034) but not with stunting or underweight. 283
284
These earlier studies were the first in determining the association of aflatoxin dietary exposure 285
with growth impairment in human subjects, and generated hypotheses for further investigations. 286
Cross-sectional studies are the best way to measure prevalence (63); however, they do have 287
limitations, as they cannot be used to establish the temporal sequence of the relationship 288
observed. A subsequent study using a longitudinal design, examined the effects of aflatoxin 289
exposure on growth in a cohort of 200 children from Benin (16-37 months) followed up over 290
8-months (14). High prevalence of aflatoxin exposure was found across the cohort with almost 291
all samples being positive for aflatoxin at each time point and with mean AF-alb levels of 37.4 292
pg/mg (February), 38.7 pg/mg (June) and 86.8 pg/mg (October). Results showed that both AF-293
alb levels measured in February and the mean AF-alb level from the three time points, were 294
inversely correlated with HAZ and WHZ growth parameters that were measured at the end of 295
the study. This relationship remained after adjusting for potential confounding factors such age, 296
sex, height, weaning status, SES and geographical location, although only for the HAZ growth 297
parameter (P < 0.001). Furthermore, there was a difference in height of 1.7 cm between the 298
highest and lowest AF-alb quartile over the 8 month period. This study has helped to show the 299
temporal relationship between aflatoxin exposure and impaired child growth. Although 300
additional longitudinal studies conducted in different geographical locations and populations 301
18
will strengthen the evidence on the likelihood of this effect being cause and effect. Furthermore, 302
plausible mechanisms that link aflatoxin exposure with impaired child growth should be 303
investigated. 304
305
Aflatoxin exposure and protein-energy malnutrition 306
It has been proposed that the development of kwashiorkor may be partly attributable to aflatoxin 307
exposure, although the evidence is circumstantial. Both aflatoxin exposure and kwashiorkor are 308
prevalent in hot and humid tropical countries where maize and rice are staples, both affect 309
children in early life and both are associated with impaired child growth (15, 64). In addition, 310
the clinical and metabolic manifestations of kwashiorkor are somewhat similar to those of 311
aflatoxin exposure, such as fatty liver and immunosuppression (65). 312
313
As shown in table 2, the association between the exposure to aflatoxin and kwashiorkor has 314
been investigated in a plethora of studies since the 1980’s (65-78). The typical study designs 315
employed by the majority of these studies were case-control or cross-sectional, and involved 316
measuring the prevalence and concentration of aflatoxin in blood and urine samples. In most 317
studies it was found that aflatoxin was detected more frequently or concentrations were higher 318
in blood samples of children with kwashiorkor in comparison with children with marasmus, 319
and healthy children (65, 68, 69, 76-78). Furthermore, aflatoxin was detected more often in 320
liver specimens from children who had died from kwashiorkor compared to other diseases and 321
other protein malnutrition disorders (66). 322
323
19
Although evidence suggests that aflatoxin exposure may be related to kwashiorkor prevalence, 324
a causal relationship has not been established. Furthermore, most of the studies did not measure 325
AF-alb levels in serum of exposed children, which has been shown to be a more reliable 326
biomarker. A fundamental step in unravelling any link between aflatoxin and kwashiorkor is to 327
understand the possibility that the metabolic manifestations of kwashiorkor affect the way that 328
aflatoxins are metabolised and excreted from the body, or vice versa. Future studies, 329
undertaking a longitudinal design are required to determine if aflatoxin exposure plays an 330
aetiological role in the causation of kwashiorkor. 331
20
Table 2. The relationship between protein energy malnutrition and aflatoxin exposure
Study Country/ study population Aflatoxin Exposure
Blood – detection (%) and mean concentration
Urine – detection (%) and mean concentration
Other – detection (%) and mean concentration
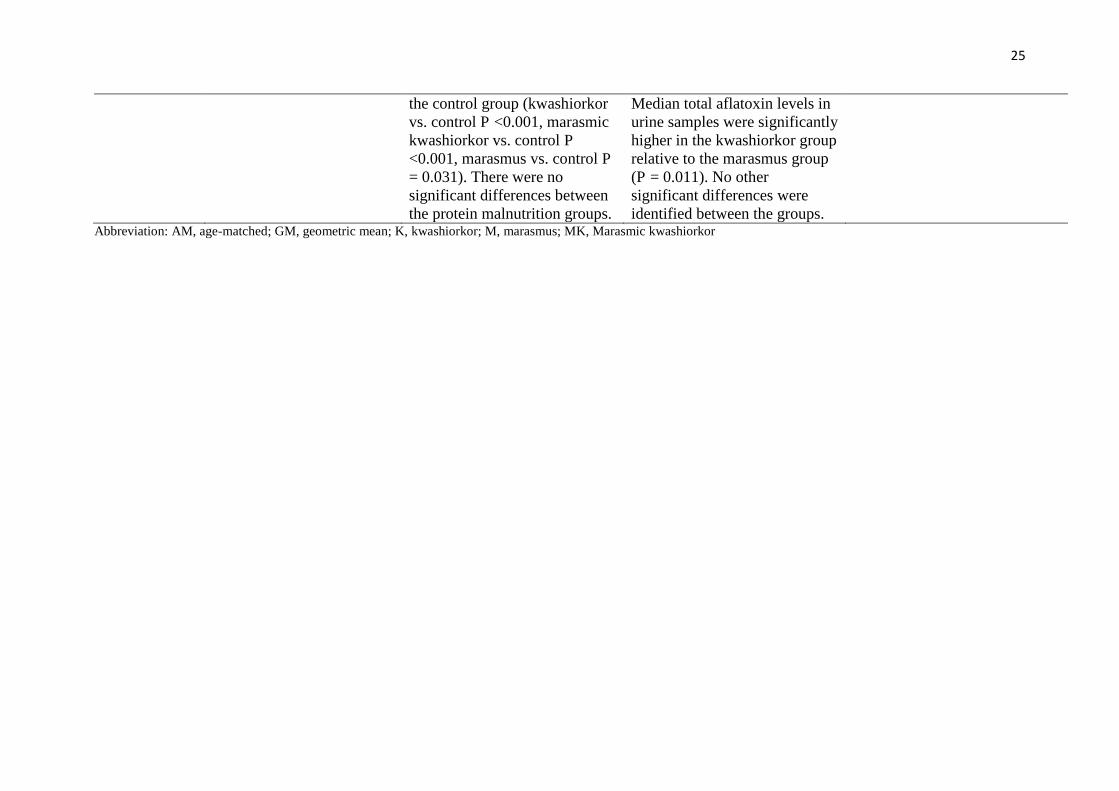
Hendrickse et al. (65)
Country: Sudan 252 children K (n = 44) MK (n = 32) M (n = 70) AM controls (n = 106)
177 samples (total aflatoxin pg/ml). K (36.4%) (GM: 706) MK (21.9%) (GM: 412) M (19.3%) (GM: 211) AM controls (15.9%) (GM: 77) The difference between the groups approached significance (P = 0.05). Kwashiorkor group mean aflatoxin concentration was significantly higher than the control group (P = 0.01).
250 samples (total aflatoxin pg/ml). K (36.4%) (GM: 706) MK (21.9%) (GM: 412) M (19.3%) (GM: 211) AM controls (15.9%) (77) No significant differences between the groups identified.
Lamplugh and Hendrickse, (66)
Country: Nigeria and South Africa 8 children (aged between 9 months and 24 months) K (n = 3) MK (n = 3) M (n = 1) Control (n = 1)
8 autopsy liver specimens. K (all three of the liver samples contained AFB1: 2000, 4900 and 1400 pg/g). MK (1 liver sample had no aflatoxins; one contained a small quantity of aflatoxin M1 (15 pg/g) and in the third sample aflatoxicol was found (8500 pg/g). M (no aflatoxins found) Control (no aflatoxin found)
21
Apeagyei et al, (67)
Country: Ghana 22 children (aged between 5 months and 48 months) K (n = 22)
22 autopsy liver specimens Aflatoxin B1 was detected in 20 of the samples (90.9%). The remaining 2 samples contained aflatoxicol (9.1%).
Coulter et al., (68)
Country: Sudan 584 children K (n = 141) MK(n = 152) M (n = 152) AM controls (n = 180)
457 samples (total aflatoxin pg/ml) K (37.7%) (GM:154) MK (28.6%) (GM: 82) M (26.3%) (GM: 77) AM controls (21.3%) (GM: 81) Difference between the number of positive samples found in each group was significant (P <0.05). No differences between the groups in concentrations of aflatoxin identified.
463 samples (total aflatoxin pg/ml) K (27.2%) (GM: 308) MK(39.0%) (GM: 490) M (26.1%) (GM: 438) AM controls (28.4%) (GM:258) No significant difference between the numbers of positive samples found in each group. No significant differences between the groups in concentrations of aflatoxin identified.
deVries et al., (69)
Country: Kenya 41 children K (n = 14) MK (n = 6) M (n = 11) Controls (n = 10)
36 samples (total aflatoxin pg/ml) K (42%) (mean: 324) MK (60%) (mean: 1294) M (45%) (mean: 261) Controls (75%) (mean: 759) No differences in detection rates.
de Vries et al., (70)
Country: Kenya 13 children K (n = 5)
K (4 out of 5 children excreted aflatoxin via urine).
K (all 5 of the children excreted aflatoxin in their stools).
22
MK (n = 7) Underweight (n = 1)
MK (5 out of 7 children excreted aflatoxin via urine). The underweight child’s urine samples tested negative for aflatoxin.
Total aflatoxin excreted (urine and stools) ranged from 0.08 ug/kg to 4 ug/kg body weight). MK (3 out of 7 children excreted aflatoxin in their stools). Total aflatoxin excreted (urine and stools) ranged from nil to 1.5 ug/kg body weight). The underweight child’s stools tested negative for aflatoxin.
Househam and Hundt (71)
Country: South Africa 320 children (mean age of 38 months) K (n = 47) M (n = 17) Controls (n = 256)
448 urine samples Aflatoxin B1, B2, G1, G2 and aflatoxicol were not detected in any of the samples.
Ramjee et al., (72)
Country: South Africa 109 children aged between 6 months and 2 years K (n = 45) M (n = 13 Underweight (n = 16) AM controls (n = 35)
109 samples K (56%) M (31%) Underweight (56%) AM controls (49%) No differences among the groups in the number of aflatoxin positive results.
50 samples K (16%) M (10%) Underweight (no samples tested) Age matched controls (25%) No differences among the groups in the number of aflatoxin positive results. The serum/ urine ratio was significantly higher in the kwashiorkor group than in the other groups (P = 0.001).
23
Adhikari et al., (73)
Country: South Africa 36 children aged between 6 months and 2 years K (n=36)
36 samples Aflatoxin was detected in 21 samples (58%)
Oyelami et al., (74)
Country: Nigeria 40 children (aged between 4 and 168 months) 20 children who died from kwashiorkor 20 children who died of other diseases
40 lung specimens K (90%) Other diseases (65%) No significant differences among the groups in the number of aflatoxin positive results.
Oyelami et al., (75)
Country: Nigeria 45 children 24 children who died from kwashiorkor (aged between 6 months and 72 months) 21 children who died of other diseases (aged between 4 months and 168 months)
45 kidney specimens (total aflatoxin pg/g) K (58%) (mean: 3851) Other diseases (62%) (mean: 1271) No significant differences among the groups in the number of aflatoxin positive results. No differences among the groups in mean concentrations of total aflatoxins.
Hatem et al., (76)
Country: Egypt 70 children (aged between 6 and 24 months) K (n = 30) M (n = 30) AM controls (n = 10)
30 samples (total aflatoxin ng/ml) K (80%) (mean: 70.58) Ma (46.7%) (mean: 25.21) AM controls (0) Aflatoxins were detected more frequently in blood samples of
30 samples (total aflatoxin ng/100ml) K (80%) (mean: M (46.7%) AM controls (0) Aflatoxins were detected more frequently in urine samples of
24
the kwashiorkor group than the marasmus group (P = 0.007). Mean serum levels of total aflatoxin were significantly higher in the kwashiorkor group relative to the marasmus group (P <0.001).
the kwashiorkor group than the marasmus group (P = 0.007). Mean levels of total aflatoxin excreted in urine were significantly higher in the kwashiorkor group relative to the marasmus group (P = 0.052).
Tchana et al., (77)
Country: Cameroon 78 children (aged between 13 months and 12 years) K (n = 31) MK (n=11) AM controls (n = 36)
42 samples (aflatoxin B1) K (35.5%) MK (45.5%) AM controls (11.1%) Detection levels of AFB1 excreted in urine were significantly higher in the kwashiorkor and marasmus kwashiorkor groups relative to the control group (P <0.05).
Onyemelukwe et al. (78)
Country: Nigeria 111 children (aged between 7 months and 60 months) K (n = 36) MK (n = 29) M (n = 13) AM controls (n = 33)
111 samples (total aflatoxin ug/L) K (88.9%) (median: 165.6) MK (93.1%) (median: 228.4) M (76.9%) (median: 234.3) AM controls (63.6%) (median: 20.7) Median serum levels of total aflatoxin were significantly higher in each protein energy malnutrition group relative to
55 samples (total aflatoxin ug/L) K (84.6%) (median: 79) M (60%) (median: 43.8) Ma (81.8%) (median: 14.4) AM controls (90.9%) (median: 42.6) No differences among the groups in the number of aflatoxin positive results.
25
the control group (kwashiorkor vs. control P <0.001, marasmic kwashiorkor vs. control P <0.001, marasmus vs. control P = 0.031). There were no significant differences between the protein malnutrition groups.
Median total aflatoxin levels in urine samples were significantly higher in the kwashiorkor group relative to the marasmus group (P = 0.011). No other significant differences were identified between the groups.
Aflatoxin exposure and micronutrient deficiencies 332
It has been hypothesized that aflatoxin exposure mediates intestinal damage resulting in 333
reduced nutrient absorption and increased intestinal permeability resulting in faltered growth 334
(79, 80). It is, therefore, possible that aflatoxin exposure exacerbates micronutrient deficiencies 335
and by reducing aflatoxin exposure the incidence of micronutrient deficiencies may be reduced 336
correspondingly. Previous research has established the relationship between aflatoxin exposure 337
and the effect on these micronutrients in feeding experiments in animal studies as reviewed by 338
Williams et al., (81). Increasing levels of aflatoxin in feed were significantly related to 339
decreasing concentrations of vitamin A in poultry (82); vitamin D concentrations in chickens 340
(83); vitamin A and E in swine (84) as well as zinc in piglets (85). 341
342
Owing to the species difference, it is difficult to directly apply these findings to humans. Only 343
a few studies have been identified that have examined the relationship between micronutrient 344
concentrations and aflatoxin exposure in humans. Two of these studies were conducted in 345
children (10, 14). As part of their investigation into the effect of aflatoxin exposure on immune 346
function in Gambian children aged between 6 and 9 years Turner et al. (10) investigated the 347
correlation between vitamins A (a- and b-carotene and lycopene) and C with AF-alb levels. 348
Vitamin C was the only micronutrient that demonstrated an inverse relationship with AF-alb (P 349
= 0.01). A study conducted by Gong et al. (14) that examined the relationship between aflatoxin 350
exposure during the post weaning period and growth faltering, measured vitamin A and zinc 351
levels to assess if they were potential confounding factors. No significant correlations between 352
vitamin A and zinc with AF-alb levels were observed. A more recent cross-sectional study (86) 353
of 147 Ghanaian adults found a significant negative correlation between AF-alb levels and 354
vitamin A concentrations in plasma samples (-0.20; p<0.05). Participants with high AF-alb 355
27
levels (>0.80 pmol/mg albumin) had a 2.6-fold greater risk of having lower vitamin A levels 356
after adjusting for potential confounding factors (odds ratio = 2.61; CI = 1.03- 6.58; P = 0.04). 357
Tang et al., (87) found similar results in another sample of 507 Ghanaian adults. A correlation 358
analysis revealed significant negative correlations between AFB1-albumin adducts and vitamin 359
A (r = -0.110; p = 0.013) and vitamin E (r = -0.149; p <0.001). 360
361
It is very difficult to draw specific conclusions based on the above evidence. Firstly, only a 362
small number of studies have been identified that have examined the relationship between 363
aflatoxin exposure and micronutrient deficiency in human subjects. Secondly, two studies 364
found no associations between vitamin A and AF-alb levels, whereas two studies did, indicating 365
that this relationship is not consistent across studies. Furthermore, the temporal relationship has 366
not yet been investigated as the above studies were cross-sectional; although Gong et al. (14) 367
was a longitudinal study, the micronutrients measured were only considered as potential 368
confounding factors for the relationship between aflatoxin exposure and impaired child growth, 369
and further explorations of these variables were not carried out. It is, consequently, still 370
unknown whether aflatoxin exposure exacerbates micronutrient deficiencies and if this 371
contributes to impaired child growth, which previous researchers have advocated (80). Future 372
studies opting for a longitudinal or experimental (RCT) design are warranted to help establish 373
whether a temporal relationship exists. 374
375
Possible mechanisms for aflatoxin’s effects on growth 376
It has been hypothesized that aflatoxin may affect child growth through one or more of three 377
mechanisms; 1) by contributing to enteropathy, 2) immune suppression and 3) modulating the 378
insulin-like growth factor (IGF) pathway through liver toxicity (79, 80). Enteropathy is a 379
28
frequent condition observed in babies in Africa, and may be partly attributable to aflatoxin 380
related toxic damage to the intestine epithelium, which leads to further “leak” of nutrients, i.e. 381
aflatoxin exacerbates the reduction of nutrient uptake in an environment where undernutrition 382
is already rife. The immune suppression effect of aflatoxin, for which there is a lot of evidence 383
in animal species (88), and increasing evidence in humans (10-12), could enhance susceptibility 384
to infections such as those causing diarrhoea, which would reduce nutrient uptake. Liver 385
toxicity due to chronic aflatoxin exposure may damage the production of Insulin like Growth 386
Factor pathway proteins (IGFs) in the liver, leading to reduced IGFs in circulation and an 387
adverse impact on child growth. A recent in vitro study using human liver cells demonstrated 388
that aflatoxin down-regulated IGFs genes and protein levels in a dose-dependent manner (89). 389
In agreement with this result, both IGF1 and IGFBP3 levels were found to be inversely 390
correlated with AF-alb biomarker in Kenyan schoolchildren. Although the effect of aflatoxin 391
on IGFs only explained about 16% of total effect of aflatoxin on child growth, given the 392
complex causes of child stunting, the data provides preliminary evidence that aflatoxin-induced 393
changes in IGFs could contribute to growth impairment where aflatoxin exposure is high (89). 394
395
Aflatoxin co-exposure with other mycotoxins on child undernutrition 396
Many countries in sub-Saharan Africa have a largely maize-based diet for both weaning food 397
and family food. It has been noted that groundnuts, although often having higher incidence and 398
levels of aflatoxin contamination than maize, rarely cause aflatoxicosis. Major aflatoxicosis 399
often occurs in populations with high maize consumption. This is partly because maize is a 400
major component of the diet and is consumed in much larger amounts than groundnuts. Another 401
possibility is that another mycotoxin, fumonisin, often co-occurs with aflatoxin in maize in 402
these regions (90-92) and it is hypothesized that the co-exposure may greatly enhance aflatoxin 403
29
toxicity, both acute (aflatoxicosis), and chronic such as the childhood hepatomegaly reported 404
in Kenya (9). 405
Weaning food was found to be frequently co-contaminated with aflatoxin and fumonisin in 406
Tanzania, and fumonisin exposure by dietary assessment has been reported to be associated 407
with child stunting and linear growth in Tanzania (93). One hundred and sixty-six children 408
(aged 6-14 months) from representative regions in Tanzania were studied longitudinally over 409
one year to examine exposure to both mycotoxins and its impact on child growth. AF-alb levels 410
tripled during the first 6 months, and further doubled during the second 6 months, with mean 411
levels of 4.7, 12.9 and 23.5 pg/mg, respectively. Fumonisin exposure measured using urinary 412
FB1 biomarker was exceedingly high at both maize harvest seasons but with a lower level 413
observed at 6 months after harvest, reflecting a field mycotoxin contamination pattern (92). 414
Urinary FB1 at recruitment were negatively associated with HAZ at both 6 months and 12 415
months from recruitment. Mean levels of urinary FB1 had an inverse association with HAZ at 416
12 months from recruitment and length velocity. The negative association between AF-alb and 417
HAZ was not significant, possibly owing to study power limitation. These data show that 418
fumonisin may contribute to child growth impairment and highlight the potential role of co-419
contamination with aflatoxin and fumonisin. More recently, Srey et al. (94) reported exposure 420
to dietary deoxynivalenol (DON), another mycotoxin with known growth inhibition in animals, 421
also occurs in these children, in agreement with food based exposure analysis in Tanzania (95). 422
This suggests that the children are frequently exposed to the three mycotoxins, all of which may 423
have an impact on growth faltering. 424
425
An increasing number of recent studies have reported multi-mycotoxin exposure in different 426
populations including some African groups (96-98). The methodology applied in these studies 427
30
typically involves simultaneous measurement of multiple mycotoxins using advanced LC-428
MS/MS technique, and this offers great advantages as it gives useful data on multi-mycotoxin 429
exposure in a population. At present validation of the approach when applied to health outcomes 430
is in its infancy. It was evident from these studies that firstly, multiple mycotoxins co-exist in 431
staple foods such as maize and their by-products (96) and secondly, human populations in 432
Africa are co-exposed to proportionally high levels of multi-mycotoxins (97, 98). Ediage et al. 433
(97) cross-sectional study found no association between stunting, wasting or underweight in 434
children aged under five, although multiple mycotoxins were found in urine samples. Whilst 435
the multi-mycotoxin measurements require further validation, these studies provide a preview 436
of the co-exposure issue and with time more will be revealed, adding further complexity to the 437
health risk studies. How to assess the health outcomes associated with multiple toxins will thus 438
be a critical challenge ahead and this will lead to a new era of multiple toxins exposure 439
assessment methodology development. 440
441
Conclusions 442
Aflatoxin exposure is highly prevalent in developing countries; often this co-exists with 443
malnutrition, enteropathy, and infectious disease in young children. The fact that over 90% of 444
samples from young children from West Africa had detectable AF-alb, in contrast to less than 445
1% in the developed world clearly demonstrates a huge public health burden associated with 446
aflatoxin in sub-Saharan Africa. The greatest challenge ahead is not only to understand how 447
these problems may interactively impact on child stunting, but more importantly to explore the 448
most effective intervention method for child undernutrition, and eventually to reduce child 449
mortality. Many supplementation trials targeting the major micronutrient deficiencies aimed at 450
improving child growth have failed to produce a significant positive effect. We believe that the 451
31
high levels of aflatoxin exposure in these populations are likely to be exacerbating the problems 452
posed by child undernutrition and that future nutrition interventions should take aflatoxin 453
exposure into account. The most effective outcomes are likely to be produced by an attack on 454
two fronts- reduction of aflatoxin exposure and improvement in nutritional status. 455
Acknowledgments
The authors declare that there are no conflicts of interest. All authors were involved in
conducting the literature search, writing and editing the article. All authors read and approved
the final article.
32
References
(1) Black RE, Victora CG, Walker SP, Bhutta ZA, Christian P, de Onis M, Ezzati M, Grantham-McGregor S, Katz J, Martorell R et al. Maternal and child undernutrition and overweight in low-income and middle-income countries. Lancet 2013;382:427-451. doi: 10.1016/S0140-6736(13)60937-X.
(2) Shrimpton R, Victoria CG, de Onis M, Lima RC, Blossner M, Clugston G. Worldwide timing of growth faltering: Implications for nutritional interventions. Pediatrics 2001;107:E75.
(3) Victora CG, de Onis M, Hallal PC, Bloessner M, Shrimpton R. Worldwide timing of growth faltering: revisiting implications for interventions. Pediatrics 2010;125:e473-e480. doi: 10.1542/peds.2009-1519.
(4) Bhutta ZA, Ahmed T, Black RE, Cousens S, Dewey K, Giugliani E, Haider BA, Kirkwood B, Morris SS, Sachdev HP et al. What works? Interventions for maternal and child undernutrition and survival. Lancet 2008;371:417-440. doi: 10.1016/S0140-6736(07)61693-6.
(5) Pitt JI, Taniwaki MH, Cole MB. Mycotoxin production in major crops as influenced by growing, harvesting, storage and processing, with emphasis on the achievement of Food Safety Objectives. Food Control 2013;32:205-215. doi:10.1016/j.foodcont.2012.11.023
(6) Mutegi CK, Wagacha JM, Christie ME, Kimani J, Karanja L. Effect of storage conditions on quality and aflatoxin contamination of peanuts (Arachis hypogaea L.). Int J AgriScience 2013;3:746-758.
(7) Azziz-Baumgartner E, Lindblade K, Gieseker K, Rogers HS, Kieszak S, Njapau H, Schleicher R, McCoy LF, Misore A, DeCock K et al. Case-control study of an acute aflatoxicosis outbreak, Kenya, 2004. Environ Health Perspect 2005;113:1779-1783.
(8) International Agency for Research on Cancer (IARC). Some traditional herbal medicines, some mycotoxins, naphthalene and styrene. IARC monographs on the evaluation of carcinogenicrisks to humans 2002:82:171-300
(9) Gong YY, Wilson S, Mwatha JK, Routledge MN, Castelino JM, Zhao B, Kimani G, Vennervald BJ, Dunne DW, Wild CP. Aflatoxin exposure may contribute to chronic hepatomegaly in Kenyan school children. Environ Health Perspect 2012;120:893-896. doi: 10.1289/ehp.1104357
(10) Turner PC, Moore SE, Hall AJ, Prentice AM, Wild CP. Modification of immune function through exposure to dietary aflatoxin in Gambian children. Environ Health Perspect 2003;111:217-220.
(11) Jiang Y, Jolly PE, Ellis WO, Wang JS, Phillips TD, Williams JH. Aflatoxin B1 albumin adduct levels and cellular immune status in Ghanaians. Int Immunol 2005;17:807-814.
(12) Jiang Y, Jolly PE, Preko P, Wang JS, Ellis WO, Phillips TD, Williams JH. Aflatoxin-related immune dysfunction in health and in human immunodeficiency virus disease. Clin Dev Immunol 2008:790309. doi: 10.1155/2008/790309.
33
(13) Gong YY, Cardwell K, Hounsa A, Egal S, Turner P, Hall AJ, Wild CP. Dietary aflatoxin exposure and impaired growth in young children from Benin and Togo: cross sectional study. BMJ 2002;325:20-21.
(14) Gong YY, Hounsa A, Egal S, Turner PC, Sutcliffe AE, Hall AJ, Cardwell K, Wild CP. Postweaning exposure to aflatoxin results in impaired child growth: a longitudinal study in Benin, West Africa. Environ Health Perspect 2004;112:1334-1338.
(15) Wild CP, Gong YY. Mycotoxins and human disease: a largely ignored global health issue. Carcinogenesis 2010;31:71-82. doi: 10.1093/carcin/bgp264.
(16) Ahmed T, Hossain M, Sanin KI. Global burden of maternal and child undernutrition and micronutrient deficiencies. Ann Nutr Metab 2012;61:8-17. doi: 10.1159/000345165
(17) World Health Organization. Nutrition for health and development: a global agenda for combating malnutrition. Geneva: World Health Organization, 2002.
(18) World health Organization Working Group. Use and interpretation of anthropometric indicators of nutritional status. Bull WHO 1986; 64:929-941.
(19) Lenters LM, Wazny K, Webb P, Ahmed T, Bhutta ZA. Treatment of severe and moderate acute malnutrition in low-and middle-income settings: a systematic review, meta-analysis and Delphi process. BMC Public Health 2013;13:S23. doi: 10.1186/1471-2458-13-S3-S23.
(20) UNICEF, WHO, World Bank. Levels and trends in child malnutrition. Joint child malnutrition estimates. New York, NY: United Nations International Children's Fund; Geneva: World Health Organization; Washington DC: World Bank, 2012.
(21) Wessells KR, Brown KH. Estimating the global prevalence of zinc deficiency: results based on zinc availability in national food supplies and the prevalence of stunting. PLoS One 2012;7:e50568. doi: 10.1371/journal.pone.0050568.
(22) Ahmed T, Hossain M, Sanin KI. Global Burden of Maternal and Child Undernutrition and Micronutrient Deficiencies. Ann Nutr Metab 2012;61:8-17. doi: 10.1159/000345165.
(23) Lindenmayer GW, Stoltzfus RJ, Prendergast AJ. Interactions between zinc deficiency and environmental enteropathy in developing countries. Adv Nutr 2014;5:1-6. doi: 10.3945/an.113.004838.
(24) Prasad AS. Discovery of human zinc deficiency: its impact on human health and disease. Adv Nutr 2013;4:176-190. doi: 10.3945/an.112.003210.
(25) de Benoist B, Darnton-Hill I, Davidsson L, Fontaine O, Hotz C. Conclusions of the joint WHO/UNICEF/IAEA/lZiNCG interagency meeting on zinc status indicators. Food Nutr Bull 2007;28:S480-S484.
(26) Brown KH, Peerson JM, Rivera J, Allen LH. Effect of supplemental zinc on the growth and serum zinc concentrations of prepubertal children: a meta-analysis of randomized controlled trials. Am J Clin Nutr 2002;75:1062-1071.
34
(27) Brown KH, Peerson JM, Baker SK, Hess SY. Preventive Zinc Supplementation among infants, preschoolers, and older prepubertal children. Food Nutr Bull 2009;30:12-40.
(28) Ramakrishnan U, Nguyen P, Martorell R. Effects of micronutrients on growth of children under 5 y of age: meta-analyses of single and multiple nutrient interventions. Am J Clin Nutr 2009;89:191-203. doi: 10.3945/ajcn.2008.26862.
(29) Imdad A, Bhutta ZA. Effect of preventive zinc supplementation on linear growth in children under 5 years of age in developing countries: a meta-analysis of studies for input to the lives saved tool. BMC Public Health 2011;11:S22. doi: 10.1186/1471-2458-11-S3-S22.
(30) UNICEF, UNU, WHO. Iron Deficiency Anaemia. Assessment, prevention and control. A guide for programme managers. Geneva, World Health Organization, 2001.
(31) Stevens GA, Finucane MM, De-Regil LM, Paciorek CJ, Flaxman SR, Branca F, Pena-Rosas JP, Bhutta ZA, Ezzati M, Nutrition Impact Model Study Group (Anaemia). Global, regional, and national trends in haemoglobin concentration and prevalence of total and severe anaemia in children and pregnant and non-pregnant women for 1995-2011: a systematic analysis of population-representative data. Lancet Glob Health 2013;1:e16-e25. doi: 10.1016/S2214-109X(13)70001-9.
(32) Zimmermann MB, Hurrell RF. Nutritional iron deficiency. Lancet 2007;370:511-520.
(33) Ramakrishnan U, Aburto N, McCabe G, Martorell R. Multimicronutrient interventions but not vitamin A or iron interventions alone improve child growth: results of 3 meta-analyses. J Nutr 2004;134:2592-2602.
(34) Sachdev H, Gera T, Nestel P. Effect of iron supplementation on physical growth in children: systematic review of randomised controlled trials. Public Health Nutr 2006;9:904-920.
(35) Pasricha SR, Hayes E, Kalumba K, Biggs BA. Effect of daily iron supplementation on health in children aged 4-23 months: a systematic review and meta-analysis of randomised controlled trials. Lancet Glob Health 2013;1:e77-e86. doi: 10.1016/S2214-109X(13)70046-9.
(36) Thompson J, Biggs B, Pasricha SR. Effects of daily iron supplementation in 2- to 5-Year-Old Children: systematic review and meta-analysis. Pediatrics 2013;131:739-753. doi: 10.1542/peds.2012-2256.
(37) Low M, Farrell A, Biggs BA, Pasricha SR. Effects of daily iron supplementation in primary-school-aged children: systematic review and meta-analysis of randomized controlled trials. CMAJ 2013;185:E791-E802. doi: 10.1503/cmaj.130628.
(38) Sachdev H, Gera T, Nestel P. Effect of iron supplementation on mental and motor development in children: systematic review of randomised controlled trials. Public Health Nutr 2005;8:117-132.
(39) Szajewska H, Ruszczynski M, Chmielewska A. Effects of iron supplementation in nonanemic pregnant women, infants, and young children on the mental performance and
35
psychomotor development of children: a systematic review of randomized controlled trials. Am J Clin Nutr 2010;91:1684-1690. doi: 10.3945/ajcn.2010.29191.
(40) World Health Organization. Global prevalence of vitamin A deficiency in populations at risk 1995-2005: WHO global database on vitamin A deficiency. Geneva, World Health Organization, 2009.
(41) Gazala E, Sarov B, Hershkovitz E, Edvardson S, Sklan D, Katz M, Friger M, Gorodischer R. Retinol concentration in maternal and cord serum: its relation to birth weight in healthy mother-infant pairs. Early Hum Dev 2003;71(1):19-28.
(42) Tielsch JM, Rahmathullah L, Katz J, Thulasiraj RD, Coles C, Sheeladevi S, Prakash K. Maternal night blindness during pregnancy is associated with low birthweight, morbidity, and poor growth in south India. J Nutr 2008;138:787-792.
(43) Thorne-Lyman AL, Fawzi WW. Vitamin A and carotenoids during pregnancy and maternal, neonatal and infant health outcomes: a systematic review and meta-analysis. Paediatr Perinat Epidemiol 2012;26:36-54. doi: 10.1111/j.1365-3016.2012.01284.x.
(44) Rivera JA, Hotz C, Gonzalez-Cossio T, Neufeld L, Garcia-Guerra A. The effect of micronutrient deficiencies on child growth: a review of results from community-based supplementation trials. J Nutr 2003;133:4010S-4020S.
(45) Mahawithange ST, Kannanga KK, Wickremasinghe R, Chandrika UG, Jansz ER, Karunaweera ND, Wickremasinghe AR. Impact of vitamin A supplementation on health status, and absenteeism of school children in Sri Lanka. Asia Pac J Clin Nutr 2007;16:94-102.
(46) Chhagan MK, Van den Broeck J, Luabeya KA, Mpontshane N, Tomkins A, Bennish ML. Effect on longitudinal growth and anemia of zinc or multiple micronutrients added to vitamin A: a randomized controlled trial in children aged 6-24 months. BMC Public Health 2010;10:145. doi: 10.1186/1471-2458-10-145.
(47) Lima AA, Soares AM, Lima NL, Mota RM, Maciel BL, Kvalsund MP, Barret LJ, Fitzgerald RP, Blaner WS, Guerrant RL. Effects of vitamin A supplementation on intestinal barrier function, growth, total parasitic, and specific Giardia spp infections in Brazilian children: a prospective randomized, double-blind, placebo-controlled trial. J Pediatr Gastroenterol Nutr 2010;50:309-315. doi: 10.1097/MPG.0b013e3181a96489.
(48) Routledge MN, Gong YY. Developing biomarkers of human exposure to mycotoxins. In: De Saeger S, ed. Determining mycotoxins and mycotoxigenic fungi in food and feed. Cambridge, UK: Woodhead Publishing Limited, 2011:225-244.
(49) Chapot B, Wild CP. ELISA for quantification of aflatoxin-albumin adducts and their application to human exposure assessment. In: Warhol, M, van Velzen D, Bullock GR, eds. Techniques in diagnostic pathology. San Diego CA, USA: Academic Press 1991;2:135-155.
(50) Wild CP, Hudson GJ, Sabbioni G, Chapot B, Hall AJ, Wogan GN, Whittle H, Montesano R, Groopman JD. Dietary intake of aflatoxins and the level of albumin-bound aflatoxin in peripheral blood in the Gambia, West Africa. Cancer Epidemiol Biomarkers Prev 1992;1:229-234.
36
(51) Routledge MN, Kimanya ME, Shirima CP, Wild CP, Gong YY. Quantitative correlation of aflatoxin biomarker with dietary intake of aflatoxin in Tanzanian children. Biomarkers 2014;19:430-435. doi: 10.3109/1354750X.2014.924998.
(52) Maxwell SM, Apeagyei F, De Vries HR, Mwanmut DD, Hendrickse RG. Aflatoxins in breast milk, neonatal cord blood and sera of pregnant women. J Toxicol. Toxin Rev 1989;8:19-29.
(53) Denning DW, Allen R, Wilkinson AP, Morgan MR. Transplacental transfer of aflatoxin in humans. Carcinogenesis 1990;11:1033-1035.
(54) Wild CP, Rasheed FN, Jawla MF, Hall AJ, Jansen LA, Montesano R. In-utero exposure to aflatoxin in West Africa. Lancet 1991;337:1602.
(55) Jonsyn FE, Maxwell SM, Hendrickse RG. Human fetal exposure to ochratoxin A and aflatoxins. Ann Trop Paediatr 1995;15:3-9.
(56) Turner PC, Collinson AC, Cheung YB, Gong YY, Hall AJ, Prentice AM, Wild CP. Aflatoxin exposure in utero causes growth faltering in Gambian infants. Int J Epidemiol 2007;36:1119-1125.
(57) de Vries HR, Maxwell SM, Hendrickse RG. Foetal and neonatal exposure to Aflatoxins. Acta Paediatr Scand 1989;78:373-378.
(58) Abdulrazzaq YM, Osman N, Yousif ZM, Trad O. Morbidity in neonates of mothers who have ingested aflatoxins. Ann Trop Paediatr 2004;24:145-151.
(59) Shuaib FM, Jolly PE, Ehiri JE, Yatich N, Jiang Y, Funkhouser E, Person SD, Wilson C, Ellis WO, Wand JS et al. Association between birth outcomes and aflatoxin B-1 biomarker blood levels in pregnant women in Kumasi, Ghana. Trop Med Int Health 2010;15:160-167. doi: 10.1111/j.1365-3156.2009.02435.x.
(60) Castelino JM, Dominguez-Salas P, Routledge MN, Prentice AM, Moore SE, Hennig BJ, Wild CP, Gong YY. Seasonal and gestation stage associated differences in aflatoxin exposure in pregnant Gambian women. Trop Med Int Health 2014;19:348-354. doi: 10.1111/tmi.12250.
(61) Gong YY, Egal S, Hounsa A, Turner PC, Hall AJ, Cardwell KF, Wild CP. Determinants of aflatoxin exposure in young children from Benin and Togo, West Africa: the critical role of weaning. Int J Epidemiol 2003;32:556-562.
(62) Khlangwiset P, Shephard GS, Wu F. Aflatoxins and growth impairment: a review. Crit Rev Toxicol 2011;41:740-755. doi: 10.3109/10408444.2011.575766
(63) Mann CJ. Observational research methods. Research design II: cohort, cross sectional, and case-control studies. Emerg Med J 2003;20:54-60.
(64) Hendrickse RG. Of sick turkeys, kwashiorkor, malaria, perinatal mortality, heroin addicts and food poisoning: research on the influence of aflatoxins on child health in the tropics. Ann Trop Med Parasitol 1997;91:787-793.
37
(65) Hendrickse RG, Coulter JB, Lamplugh SM, Macfarlane SB, Williams TE, Omer MI, Suliman GI. Aflatoxins and kwashiorkor: a study in Sudanese children. Br Med J 1982;285:843-846.
(66) Lamplugh SM, Hendrickse RG. Aflatoxins in the livers of children with kwashiorkor. Ann Trop Paediatr 1982;2:101-104.
(67) Apeagyei F, Lamplugh SM, Hendrickse RG, Affram K, Lucas S. Aflatoxins in the livers of children with kwashiorkor in Ghana. Trop Geogr Med 1986;38:273-6.
(68) Coulter J, Hendrickse RG, Lamplugh SM, Macfarlane SB, Moody JB, Omer MI, Suliman GI, Williams TE. Aflatoxins and kwashiorkor: clinical studies in Sudanese children. Trans R Soc Trop Med Hyg 1986;80:945-951.
(69) de Vries HR, Lamplugh SM, Hendrickse RG. Aflatoxins and kwashiorkor in Kenya: a hospital based study in a rural area of Kenya. Ann Trop Paediatr 1987;7:249-251.
(70) de Vries HR, Maxwell SM, Hendrickse RG. Aflatoxin excretion in children with kwashiorkor or marasmic kwashiorkor - a clinical investigation. Mycopathologia 1990;110:1-9.
(71) Househam KC, Hundt HK. Aflatoxin exposure and its relationship to kwashiorkor in African children. J Trop Pediatr 1991;37:300-302.
(72) Ramjee G, Berjak P, Adhikari M, Dutton MF. Aflatoxins and kwashiorkor in Durban, South Africa. Ann Trop Paediatr 1992;12:241-247.
(73) Adhikari M, Ramjee G, Berjak P. Aflatoxin, kwashiorkor, and morbidity. Nat Toxins 1994;2:1-3.
(74) Oyelami OA, Maxwell SM, Adelusola KA, Aladekoma TA, Oyelese AO. Aflatoxins in the lungs of children with kwashiorkor and children with miscellaneous diseases in Nigeria. J Toxicol Environ Health 1997;51:623-628.
(75) Oyelami OA, Maxwell SM, Adelusola KA, Aladekoma TA, Oyelese AO. Aflatoxins in autopsy kidney specimens from children in Nigeria. J Toxicol and Environ Health A 1998;55:317-323.
(76) Hatem NL, Hassab HM, Abd Al-Rahman EM, El-Deeb SA, El-Sayed Ahmed RL. Prevalence of aflatoxins in blood and urine of Egyptian infants with protein–energy malnutrition. Food Nutr Bull 2005;26:49-56.
(77) Tchana AN, Moundipa PF, Tchouanguep FM. Aflatoxin contamination in food and body fluids in relation to malnutrition and cancer status in Cameroon. Int J Environ Res Public Health 2010;7:178-188. doi: 10.3390/ijerph7010178.
(78) Onyemelukwe GC, Ogoina D, Ibiam GE, Ogbadu GH. Aflatoxins in body fluids and food of Nigerian children with protein-energy malnutrition. AJFAND 2012;12:6553-6566.
38
(79) Gong YY, Turner PC, Hall AJ, Wild CP. Aflatoxin Exposure and Impaired Child Growth in West Africa: An Unexplored International Public Health Burden? In: Leslie JF, Bandyopadhyay R, Visconti A, eds. Mycotoxins: Detection Methods, Management, Public Health, and Agricultural Trade. Wallingford, UK: CABI, 2008:53-66.
(80) Smith LE, Stoltzfus RJ, Prendergast A. Food chain mycotoxin exposure, gut health, and impaired growth: a conceptual framework. Adv Nutr 2012;3:526-531. doi: 10.3945/an.112.002188.
(81) Williams JH, Phillips TD, Jolly PE, Stiles JK, Jolly CM, Aggarwal D. Human aflatoxicosis in developing countries: a review of toxicology, exposure, potential health consequences, and interventions. Am J Clin Nutr 2004;80:1106-1122.
(82) Pimpukdee K, Kubena LF, Bailey CA, Huebner HJ, Afriyie-Gyawu E, Phillips TD. Aflatoxin-induced toxicity and depletion of hepatic vitamin A in young broiler chicks: protection of chicks in the presence of low levels of NovaSil PLUS in the diet. Poult Sci 2004;83:737-744.
(83) Glahn RP, Beers KW, Bottje WG, Wideman RF, Huff WE, Thomas W. Aflatoxicosis alters avian renal function, calcium, and vitamin D metabolism. J Toxicol Environ Health 1991;34:309-321.
(84) Harvey RB, Kubena LF, Elissalde MH. Influence of vitamin E on aflatoxicosis in growing swine. Am J Vet Res 1994;55:572-577.
(85) Mocchegiani E, Corradi A, Santarelli L, Tibaldi A, DeAngelis E, Borghetti P, Bonomi A, Fabris N, Cabassi E. Zinc, thymic endocrine activity and mitogen responsiveness (PHA) in piglets exposed to maternal aflatoxicosis B1 and G1. Vet Immunol Immunopathol 1998;62:245-260.
(86) Obuseh FA, Jolly PE, Kulczycki A, Ehiri J, Waterbor J, Desmond RA, Preko PO, Jiang Y, Piyathilake CJ. Aflatoxin levels, plasma vitamins A and E concentrations, and their association with HIV and hepatitis B virus infections in Ghanaians: a cross-sectional study. J Int AIDS Soc 2011;14:53. doi: 10.1186/1758-2652-14-53.
(87) Tang L, Xu L, Afriyie-Gyawu E, Liu W, Wang P, Tang Y, Wang Y, Huebner HJ, Ankrah NA, Ofori-Adjei D et al. Aflatoxin-albumin adducts and correlation with decreased serum levels of vitamins A and E in an adult Ghanaian population. Food Addit Contam Part A Chem Anal Control Expo Risk Assess 2009;26:108-118. doi: 10.1080/02652030802308472.
(88) Bondy GS, Pestka JJ. Immunomodulation by fungal toxins. J Toxicol and Environ Health B Crit Rev 2000;3:109-143.
(89) Castelino JM, Routledge MN, Wilson S, Dunne DW, Mwatha JK, Gachuhi K, Wild CP, Gong YY. Aflatoxin exposure is inversely associated with IGF1 and IGFBP3 levels in vitro and in Kenyan schoolchildren. Mol Nutr Food Res 2014. doi: 10.1002/mnfr.201300619
(90) Kimanya ME, De Meulenaer B, Tiisekwa B, Ndomondo-Sigonda M, Devlieghere F, Van Camp J, Kolsteren P. Co-occurrence of fumonisins with aflatoxins in home-stored maize for
39
human consumption in rural villages of Tanzania. Food Addit Contam Part A Chem Anal Control Expo Risk Assess 2008;25:1353-1364. doi: 10.1080/02652030802112601.
(91) Kimanya ME, De Meulenaer B, Kolsteren PW. The Correlation between fumonisins exposure and growth retardation among infants in Rombo, Tanzania. Ann Nutr Metab 2009;55:614-614.
(92) Shirima CP, Kimanya ME, Kinabo JL, Routledge MN, Srey C, Wild CP, Gong YY. Dietary exposure to aflatoxin and fumonisin among Tanzanian children as determined using biomarkers of exposure. Mol Nutr Food Res 2013;57:1874-1881. doi: 10.1002/mnfr.201300116.
(93) Kimanya ME, De Meulenaer B, Roberfroid D, Lachat C, Kolsteren P. Fumonisin exposure through maize in complementary foods is inversely associated with linear growth of infants in Tanzania. Mol Nutr Food Res 2010;54:1659-1667. doi: 10.1002/mnfr.200900483.
(94) Srey C, Kimanya ME, Routledge MN, Shirima CP, Gong YY. Deoxynivalenol exposure assessment in young children in Tanzania. Mol Nutr Food Res 2014;58:1574-1580. doi: 10.1002/mnfr.201400012.
(95) Kimanya ME, Shirima CR, Magoha H, Shewiyo DH, De Meulenaer B, Kolsteren P,Gong YY. Co-exposures of aflatoxins with deoxynivalenol and fumonisins from maize based complementary foods in Rombo, Northern Tanzania. Food Control 2014;41:76-81.
(96) Abia WA, Warth B, Sulyok M, Krska R, Tchana A, Njobeh PB, Turner PC, Kouanfack C, Eyongetah M, Dutton M et al. Bio-monitoring of mycotoxin exposure in Cameroon using a urinary multi-biomarker approach. Food Chem Toxicol 2013;62:927-934. doi: 10.1016/j.fct.2013.10.003.
(97) Ediage EN, Di Mavungu JD, Song S, Sioen I, De Saeger S. Multimycotoxin analysis in urines to assess infant exposure: a case study in Cameroon. Environ Int 2013;57-58:50-59. doi: 10.1016/j.envint.2013.04.002.
(98) Shephard GS, Burger HM, Gambacorta L, Gong YY, Krska R, Rheeder JP, Solfrizzo M, Srey C, Sulyok M, Visconti A et al. Multiple mycotoxin exposure determined by urinary biomarkers in rural subsistence farmers in the former Transkei, South Africa. Food Chem Toxicol 2013;62:217-225. doi: 10.1016/j.fct.2013.08.040.