46
1 “Silver Producer with a Golden Future” April 2013 www.intlminerals.com
| Date post: | 13-Jan-2015 |
| Category: |
Business |
| Upload: | company-spotlight |
| View: | 955 times |
| Download: | 1 times |

1
“Silver Producer with a Golden Future”
April 2013
www.intlminerals.com
2
Cautionary Statement
Some of the statements contained in this presentation are “forward-looking statements” within the meaning of Canadian securities law requirements. Such forward-looking statements involve known and unknown risks, uncertainties and other factors that may cause our actual results, performance or achievements to differ materially from the anticipated results, performance or achievements expressed or implied by such forward-looking statements.
Forward-looking statements in this presentation include statements regarding drilling and development programs on the Company’s projects, timing of commencement of production, reserve/resource additions, completion of feasibility studies, obtaining of required environmental and production permits, timing and significance of future cash flows and dividends.
Factors that could cause actual results to differ materially from anticipated results include risks and uncertainties such as: risks relating to estimates of mineral resources and reserves; risks relating to project capital, production costs and cash flows; risks relating to obtaining mining and environmental permits; mining and development risks; risk of commodity price fluctuations; political and regulatory risk; general financial market and credit risks; other risks and uncertainties detailed in the IMZ’s Annual Information Form (dated September 28, 2012) and Management Discussion and Analysis for the year ended June 30, 2012, both of which are available at www.sedar.com.
Any forward-looking financial information provided may not be appropriate in relation to reporting under International Financial Reporting Standards (IFRS). Please refer to the Company’s latest financial statements and notes. These forward-looking statements speak only as of the date hereof. The Company undertakes no obligation to update publicly or release any revisions to these forward looking statements to reflect events or circumstances after the date hereof or to reflect the occurrence of unanticipated events.
Qualified Person: The Company’s VP Corporate Development, Nick Appleyard.
Dollar and Year References: “$” and “US$” refer to US dollars unless otherwise noted. Years refer to the respective calendar year unless otherwise noted as fiscal year (June 30).
Au = gold; Ag = silver; g/t = grams per metric tonne; M = million; $M = million dollars; Mt = million tonnes; oz or ozs = troy ounces; tpd = metric tonnes per day; Gold-to-Silver ratio for gold equivalent ounces based on 55:1 for production statistics and variable ratio for reserves and resources based on Technical Reports.
3
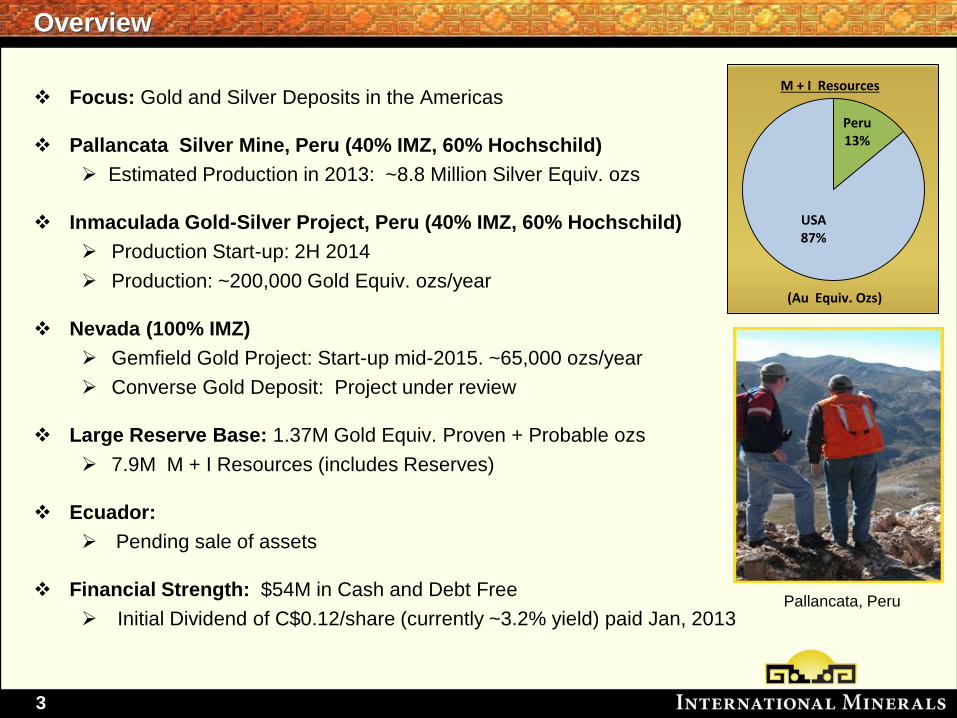
Focus: Gold and Silver Deposits in the Americas
Pallancata Silver Mine, Peru (40% IMZ, 60% Hochschild)
Estimated Production in 2013: ~8.8 Million Silver Equiv. ozs
Inmaculada Gold-Silver Project, Peru (40% IMZ, 60% Hochschild)
Production Start-up: 2H 2014
Production: ~200,000 Gold Equiv. ozs/year
Nevada (100% IMZ)
Gemfield Gold Project: Start-up mid-2015. ~65,000 ozs/year
Converse Gold Deposit: Project under review
Large Reserve Base: 1.37M Gold Equiv. Proven + Probable ozs
7.9M M + I Resources (includes Reserves)
Ecuador:
Pending sale of assets
Financial Strength: $54M in Cash and Debt Free
Initial Dividend of C$0.12/share (currently ~3.2% yield) paid Jan, 2013
Overview
Pallancata, Peru
Peru 13%
USA 87%
M + I Resources
(Au Equiv. Ozs)
4
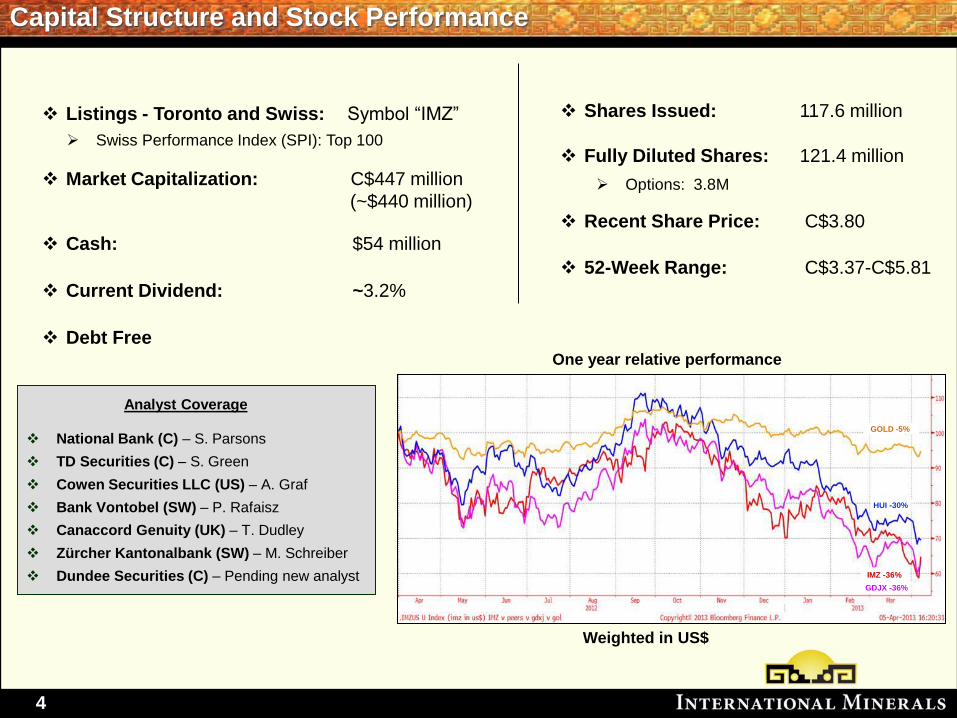
Shares Issued: 117.6 million
Fully Diluted Shares: 121.4 million
Options: 3.8M
Recent Share Price: C$3.80
52-Week Range: C$3.37-C$5.81
Capital Structure and Stock Performance
National Bank (C) – S. Parsons
TD Securities (C) – S. Green
Cowen Securities LLC (US) – A. Graf
Bank Vontobel (SW) – P. Rafaisz
Canaccord Genuity (UK) – T. Dudley
Zürcher Kantonalbank (SW) – M. Schreiber
Dundee Securities (C) – Pending new analyst
Analyst Coverage
Listings - Toronto and Swiss: Symbol “IMZ”
Swiss Performance Index (SPI): Top 100
Market Capitalization: C$447 million
(~$440 million)
Cash: $54 million
Current Dividend: ~3.2%
Debt Free
One year relative performance
Weighted in US$
GDJX -36%
GOLD -5%
HUI -30%
IMZ -36%
5
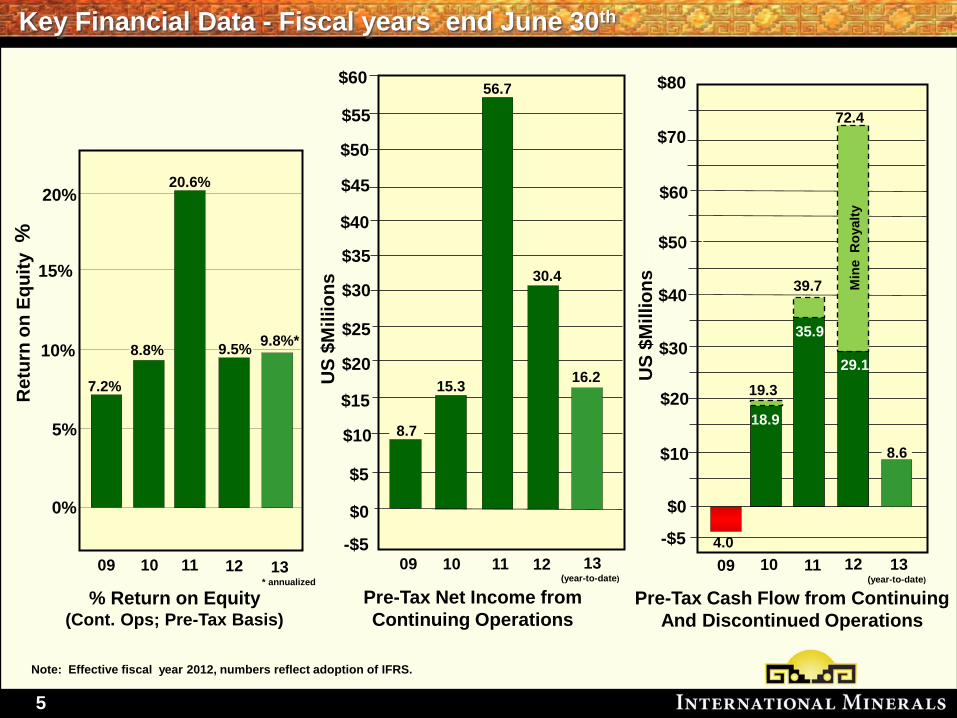
Key Financial Data - Fiscal years end June 30th
10%
5%
0%
Re
turn
on
Eq
uit
y %
% Return on Equity (Cont. Ops; Pre-Tax Basis)
Pre-Tax Net Income from
Continuing Operations
15%
7.2%
US
$M
illio
ns
Pre-Tax Cash Flow from Continuing
And Discontinued Operations
09 11 10 12
20% 20.6%
Note: Effective fiscal year 2012, numbers reflect adoption of IFRS.
13
* annualized
US
$M
illio
ns
$10
$40
$0
-$5
$30
4.0
09 11 10 12
$20
$50
$60
$70
$80
35.9
18.9
39.7
19.3
72.4
$10
$5
$0
-$5
$15
09 11 10 12
$25
56.7
$35
$30
16.2
$45
$20
$50
$55
$60
15.3
Min
e R
oyalt
y
30.4
29.1
9.8%*
$40
8.8% 9.5%
8.7
8.6
13 (year-to-date)
13 (year-to-date)
6
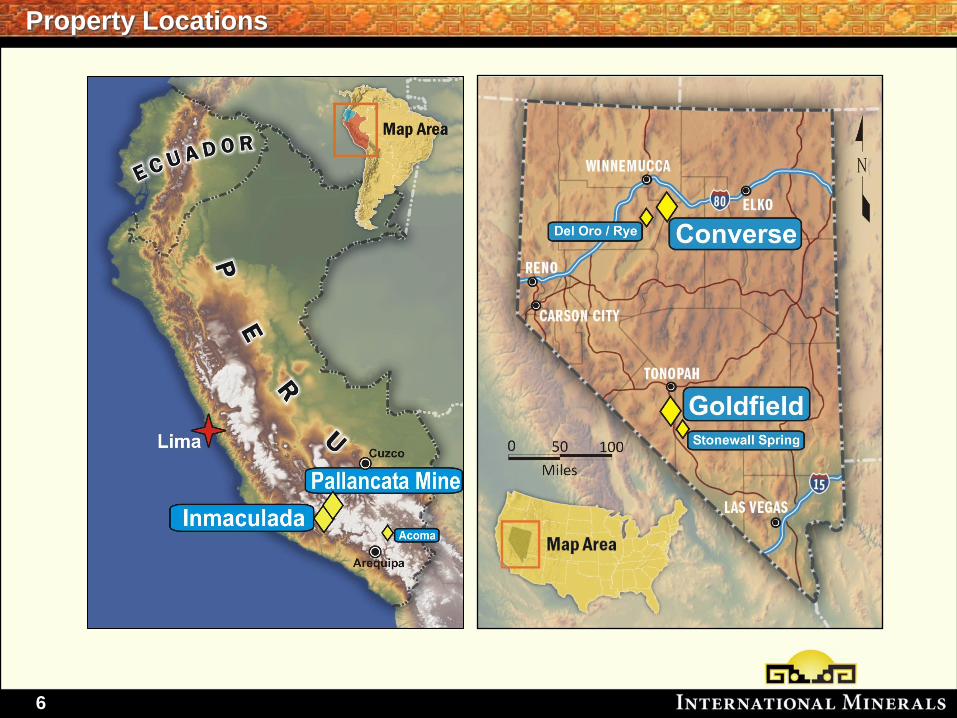
Property Locations
7
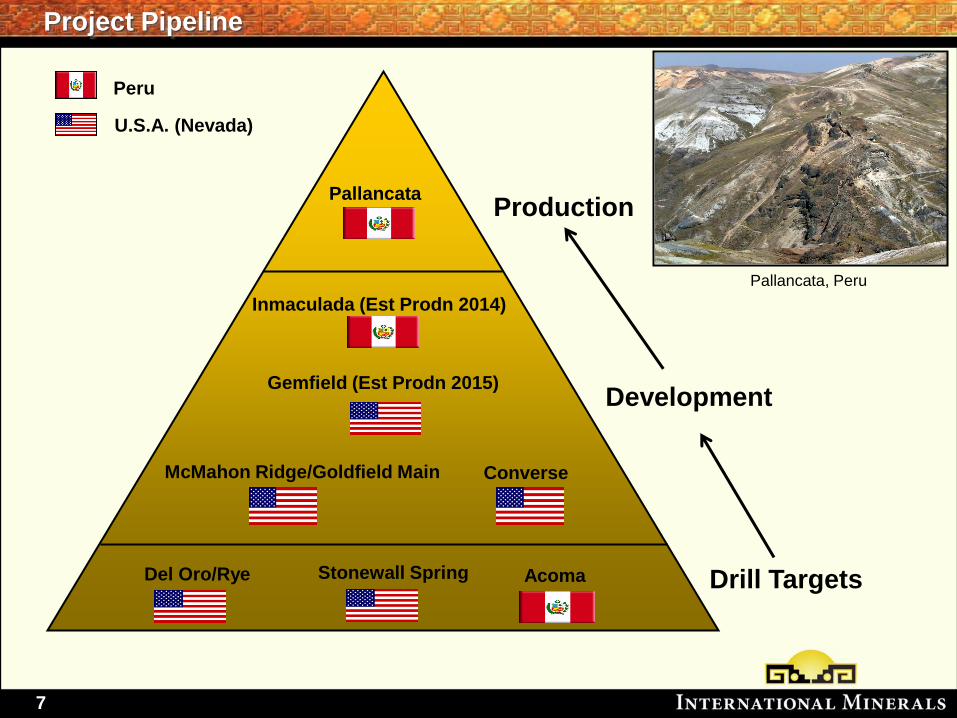
Production
Development
Drill Targets
Pallancata
Converse
Gemfield (Est Prodn 2015)
Inmaculada (Est Prodn 2014)
Project Pipeline
Peru
U.S.A. (Nevada)
Del Oro/Rye Acoma
McMahon Ridge/Goldfield Main
Pallancata, Peru
Stonewall Spring
8
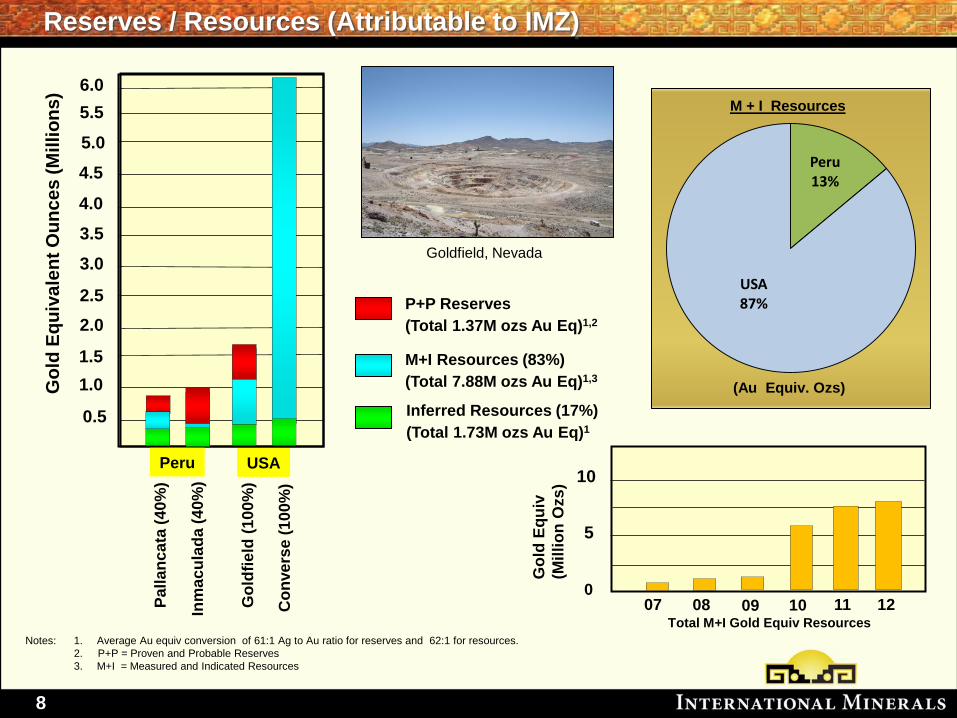
Reserves / Resources (Attributable to IMZ)
Notes: 1. Average Au equiv conversion of 61:1 Ag to Au ratio for reserves and 62:1 for resources.
2. P+P = Proven and Probable Reserves
3. M+I = Measured and Indicated Resources
5.0
4.5
4.0
3.5
3.0
2.5
2.0
1.5
1.0
0.5
M+I Resources (83%)
(Total 7.88M ozs Au Eq)1,3
P+P Reserves
(Total 1.37M ozs Au Eq)1,2
Inferred Resources (17%)
(Total 1.73M ozs Au Eq)1
5.5
Go
ld E
qu
iva
len
t O
un
ce
s (
Millio
ns
) 6.0
10
5
0
Go
ld E
qu
iv
(Mil
lio
n O
zs
)
08 10 07 09 Total M+I Gold Equiv Resources
11 12 Go
ldfi
eld
(10
0%
)
Co
nve
rse
(10
0%
)
USA
Peru 13%
USA 87%
M + I Resources
(Au Equiv. Ozs)
Goldfield, Nevada
Pa
lla
nca
ta (
40
%)
Inm
ac
ula
da (
40
%)
Peru
9
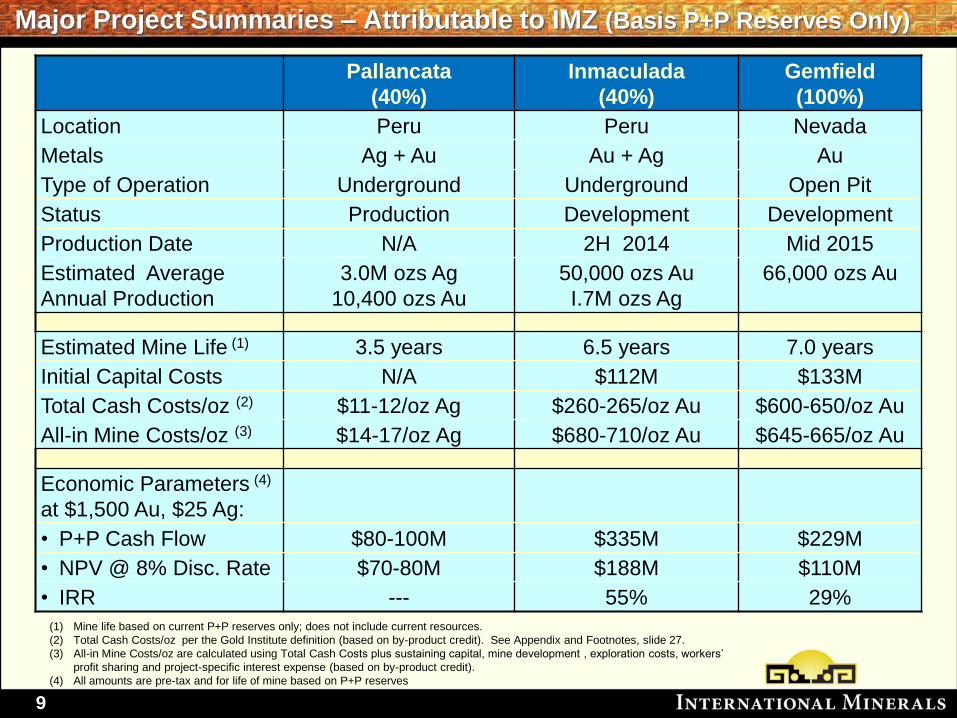
Major Project Summaries – Attributable to IMZ (Basis P+P Reserves Only)
Pallancata
(40%)
Inmaculada
(40%)
Gemfield
(100%)
Location Peru Peru Nevada
Metals Ag + Au Au + Ag Au
Type of Operation Underground Underground Open Pit
Status Production Development Development
Production Date N/A 2H 2014 Mid 2015
Estimated Average
Annual Production
3.0M ozs Ag
10,400 ozs Au
50,000 ozs Au
I.7M ozs Ag
66,000 ozs Au
Estimated Mine Life (1) 3.5 years 6.5 years 7.0 years
Initial Capital Costs N/A $112M $133M
Total Cash Costs/oz (2) $11-12/oz Ag $260-265/oz Au $600-650/oz Au
All-in Mine Costs/oz (3) $14-17/oz Ag $680-710/oz Au $645-665/oz Au
Economic Parameters (4)
at $1,500 Au, $25 Ag:
• P+P Cash Flow $80-100M $335M $229M
• NPV @ 8% Disc. Rate $70-80M $188M $110M
• IRR --- 55% 29%
(1) Mine life based on current P+P reserves only; does not include current resources.
(2) Total Cash Costs/oz per the Gold Institute definition (based on by-product credit). See Appendix and Footnotes, slide 27.
(3) All-in Mine Costs/oz are calculated using Total Cash Costs plus sustaining capital, mine development , exploration costs, workers’
profit sharing and project-specific interest expense (based on by-product credit).
(4) All amounts are pre-tax and for life of mine based on P+P reserves
10
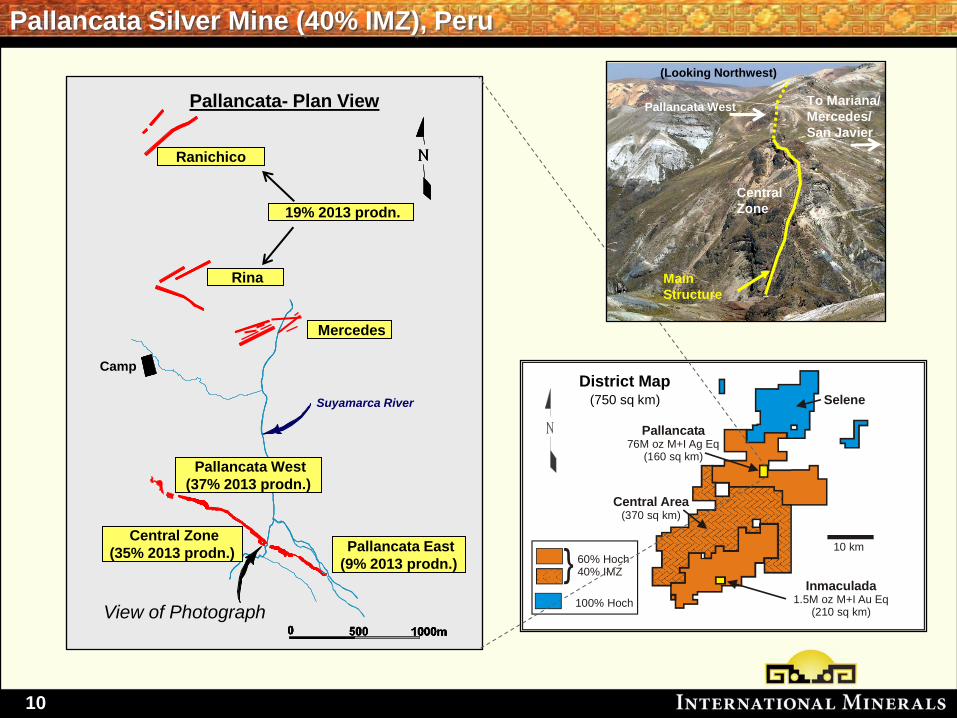
Pallancata Silver Mine (40% IMZ), Peru
Suyamarca River
Ranichico
Mercedes
Camp
Pallancata- Plan View
Central Zone
(35% 2013 prodn.)
View of Photograph
Pallancata West
(37% 2013 prodn.)
Rina
Pallancata East
(9% 2013 prodn.)
19% 2013 prodn.
Pallancata76M oz M+I Ag Eq
(160 sq km)
Central Area(370 sq km)
Selene
Inmaculada1.5M oz M+I Au Eq
(210 sq km)
10 km
100% Hoch
60% Hoch40% IMZ}
District Map (750 sq km)
Pallancata West
Central
Zone
Main
Structure
To Mariana/
Mercedes/
San Javier
(Looking Northwest)
11
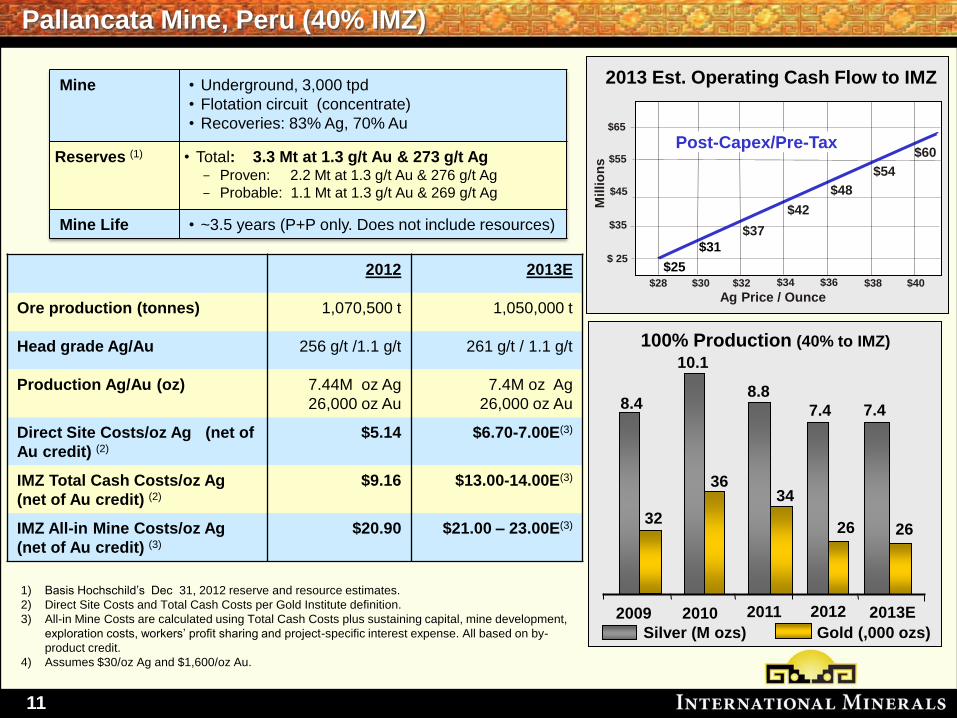
Pallancata Mine, Peru (40% IMZ)
Mine • Underground, 3,000 tpd
• Flotation circuit (concentrate)
• Recoveries: 83% Ag, 70% Au
Reserves (1) • Total: 3.3 Mt at 1.3 g/t Au & 273 g/t Ag - Proven: 2.2 Mt at 1.3 g/t Au & 276 g/t Ag
- Probable: 1.1 Mt at 1.3 g/t Au & 269 g/t Ag
Mine Life • ~3.5 years (P+P only. Does not include resources)
2012 2013E
Ore production (tonnes) 1,070,500 t 1,050,000 t
Head grade Ag/Au 256 g/t /1.1 g/t 261 g/t / 1.1 g/t
Production Ag/Au (oz) 7.44M oz Ag
26,000 oz Au
7.4M oz Ag
26,000 oz Au
Direct Site Costs/oz Ag (net of
Au credit) (2)
$5.14
$6.70-7.00E(3)
IMZ Total Cash Costs/oz Ag
(net of Au credit) (2)
$9.16 $13.00-14.00E(3)
IMZ All-in Mine Costs/oz Ag
(net of Au credit) (3)
$20.90 $21.00 – 23.00E(3)
2013 Est. Operating Cash Flow to IMZ
Ag Price / Ounce
$55
$28 $30 $32 $34 $36 $38
$45
$35
$ 25
Millio
ns
$40
$65
$48
$42
$31
$25
$60
Post-Capex/Pre-Tax
2013E 2009 2010
100% Production (40% to IMZ)
7.4
26
8.4
32
10.1
36
2011
8.8
34
2012
26
7.4
Gold (,000 ozs) Silver (M ozs)
$54
$37
1) Basis Hochschild’s Dec 31, 2012 reserve and resource estimates.
2) Direct Site Costs and Total Cash Costs per Gold Institute definition.
3) All-in Mine Costs are calculated using Total Cash Costs plus sustaining capital, mine development,
exploration costs, workers’ profit sharing and project-specific interest expense. All based on by-
product credit.
4) Assumes $30/oz Ag and $1,600/oz Au.
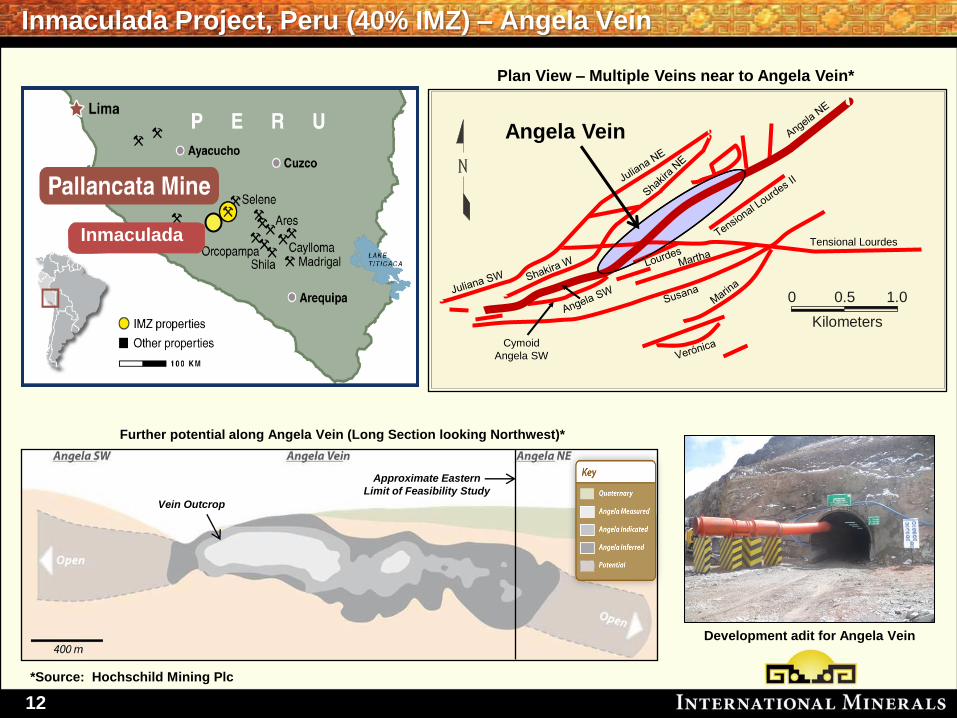
12
0 0.5 1.0
Kilometers
Angela Vein
Tensional Lourdes
Cymoid
Angela SW
Plan View – Multiple Veins near to Angela Vein*
Inmaculada
Further potential along Angela Vein (Long Section looking Northwest)*
Inmaculada Project, Peru (40% IMZ) – Angela Vein
*Source: Hochschild Mining Plc
Vein Outcrop
Approximate Eastern
Limit of Feasibility Study
Development adit for Angela Vein
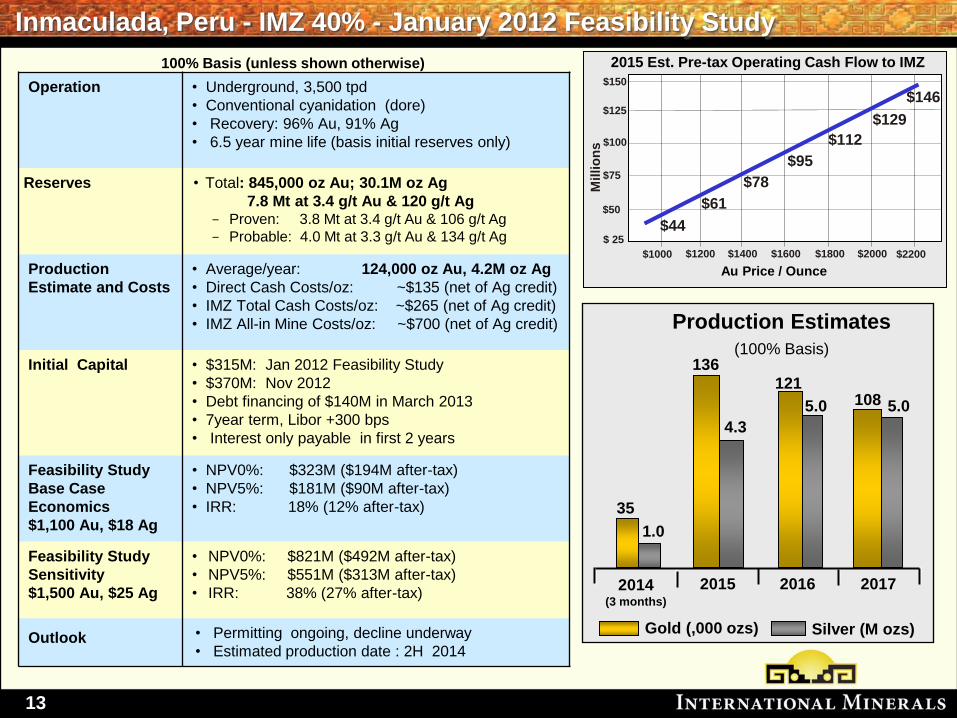
13
Inmaculada, Peru - IMZ 40% - January 2012 Feasibility Study
Operation • Underground, 3,500 tpd
• Conventional cyanidation (dore)
• Recovery: 96% Au, 91% Ag
• 6.5 year mine life (basis initial reserves only)
Reserves • Total: 845,000 oz Au; 30.1M oz Ag
7.8 Mt at 3.4 g/t Au & 120 g/t Ag - Proven: 3.8 Mt at 3.4 g/t Au & 106 g/t Ag
- Probable: 4.0 Mt at 3.3 g/t Au & 134 g/t Ag
Production
Estimate and Costs • Average/year: 124,000 oz Au, 4.2M oz Ag
• Direct Cash Costs/oz: ~$135 (net of Ag credit)
• IMZ Total Cash Costs/oz: ~$265 (net of Ag credit)
• IMZ All-in Mine Costs/oz: ~$700 (net of Ag credit)
Initial Capital • $315M: Jan 2012 Feasibility Study
• $370M: Nov 2012
• Debt financing of $140M in March 2013
• 7year term, Libor +300 bps
• Interest only payable in first 2 years
Feasibility Study
Base Case
Economics
$1,100 Au, $18 Ag
• NPV0%: $323M ($194M after-tax)
• NPV5%: $181M ($90M after-tax)
• IRR: 18% (12% after-tax)
Feasibility Study
Sensitivity
$1,500 Au, $25 Ag
• NPV0%: $821M ($492M after-tax)
• NPV5%: $551M ($313M after-tax)
• IRR: 38% (27% after-tax)
Outlook • Permitting ongoing, decline underway
• Estimated production date : 2H 2014
Production Estimates
(100% Basis)
35
1.0
136
121
4.3
5.0 108 5.0
2014 (3 months)
2015 2016 2017
Gold (,000 ozs) Silver (M ozs)
2015 Est. Pre-tax Operating Cash Flow to IMZ
Au Price / Ounce
$1000 $1200 $1400 $1600 $1800
$100
$75
$50
$ 25
Millio
ns
$125
$2000
$129
$112
$44
$61
$78
$95
$2200
$150
100% Basis (unless shown otherwise)
$146
14
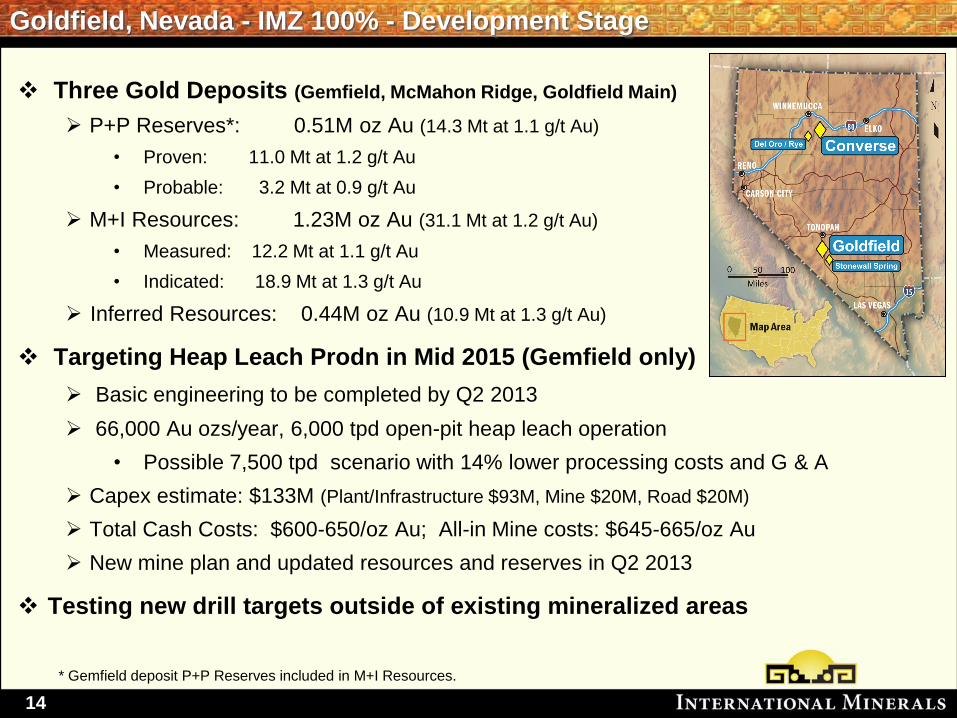
Goldfield, Nevada - IMZ 100% - Development Stage
Three Gold Deposits (Gemfield, McMahon Ridge, Goldfield Main)
P+P Reserves*: 0.51M oz Au (14.3 Mt at 1.1 g/t Au)
• Proven: 11.0 Mt at 1.2 g/t Au
• Probable: 3.2 Mt at 0.9 g/t Au
M+I Resources: 1.23M oz Au (31.1 Mt at 1.2 g/t Au)
• Measured: 12.2 Mt at 1.1 g/t Au
• Indicated: 18.9 Mt at 1.3 g/t Au
Inferred Resources: 0.44M oz Au (10.9 Mt at 1.3 g/t Au)
Targeting Heap Leach Prodn in Mid 2015 (Gemfield only)
Basic engineering to be completed by Q2 2013
66,000 Au ozs/year, 6,000 tpd open-pit heap leach operation
• Possible 7,500 tpd scenario with 14% lower processing costs and G & A
Capex estimate: $133M (Plant/Infrastructure $93M, Mine $20M, Road $20M)
Total Cash Costs: $600-650/oz Au; All-in Mine costs: $645-665/oz Au
New mine plan and updated resources and reserves in Q2 2013
Testing new drill targets outside of existing mineralized areas
* Gemfield deposit P+P Reserves included in M+I Resources.
15
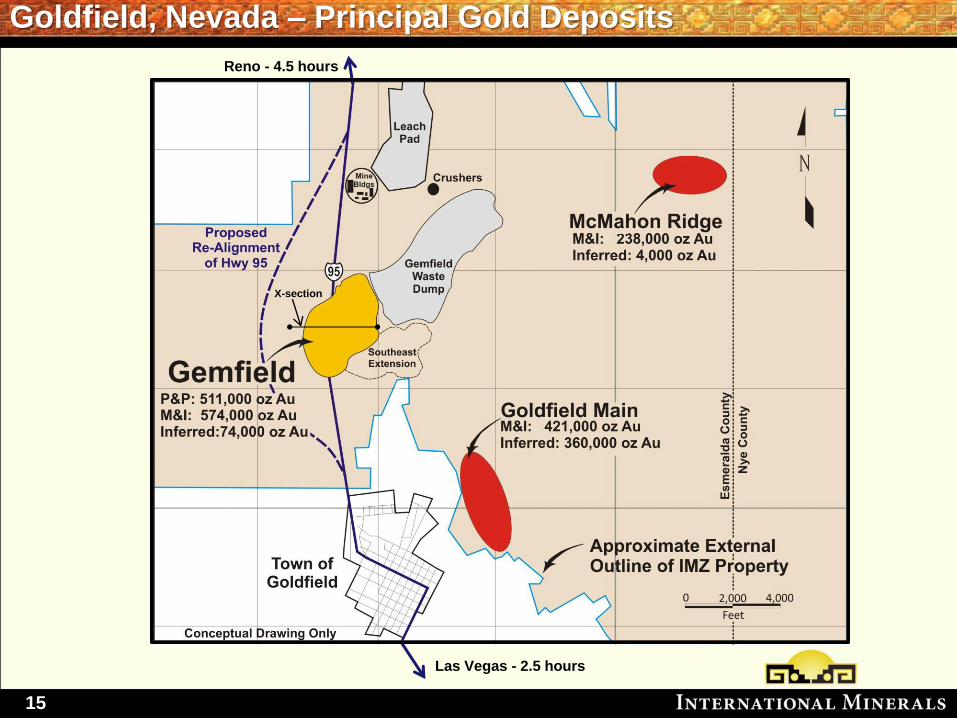
Reno - 4.5 hours
Las Vegas - 2.5 hours
Goldfield, Nevada – Principal Gold Deposits
X-section
16
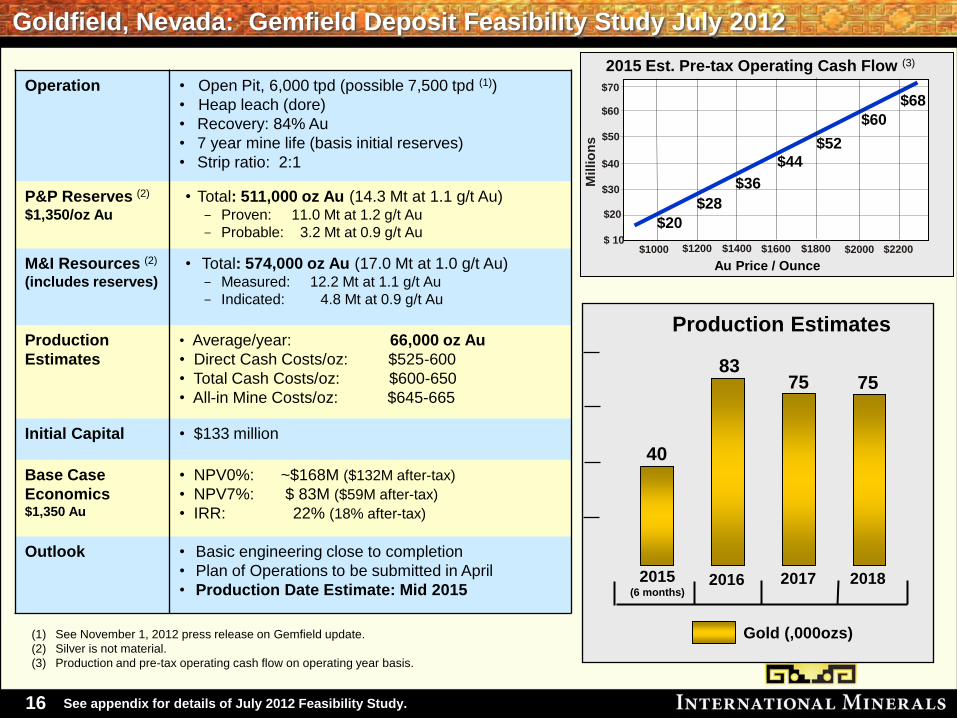
Goldfield, Nevada: Gemfield Deposit Feasibility Study July 2012
Operation • Open Pit, 6,000 tpd (possible 7,500 tpd (1))
• Heap leach (dore)
• Recovery: 84% Au
• 7 year mine life (basis initial reserves)
• Strip ratio: 2:1
P&P Reserves (2)
$1,350/oz Au
• Total: 511,000 oz Au (14.3 Mt at 1.1 g/t Au) - Proven: 11.0 Mt at 1.2 g/t Au
- Probable: 3.2 Mt at 0.9 g/t Au
M&I Resources (2)
(includes reserves)
• Total: 574,000 oz Au (17.0 Mt at 1.0 g/t Au) - Measured: 12.2 Mt at 1.1 g/t Au
- Indicated: 4.8 Mt at 0.9 g/t Au
Production
Estimates
• Average/year: 66,000 oz Au
• Direct Cash Costs/oz: $525-600
• Total Cash Costs/oz: $600-650
• All-in Mine Costs/oz: $645-665
Initial Capital
• $133 million
Base Case
Economics $1,350 Au
• NPV0%: ~$168M ($132M after-tax)
• NPV7%: $ 83M ($59M after-tax)
• IRR: 22% (18% after-tax)
Outlook • Basic engineering close to completion
• Plan of Operations to be submitted in April
• Production Date Estimate: Mid 2015
Production Estimates
40
83 75
2015 Est. Pre-tax Operating Cash Flow (3)
Au Price / Ounce
$1000 $1400 $1800
2015 (6 months)
2016 2017
Gold (,000ozs)
$40
$30
$20
$ 10
Millio
ns
$50
$2200
$68
$52
$20
$36
(1) See November 1, 2012 press release on Gemfield update.
(2) Silver is not material.
(3) Production and pre-tax operating cash flow on operating year basis.
$70
$60
See appendix for details of July 2012 Feasibility Study.
$1200 $1600 $2000
$28
$44
$60
75
2018
17
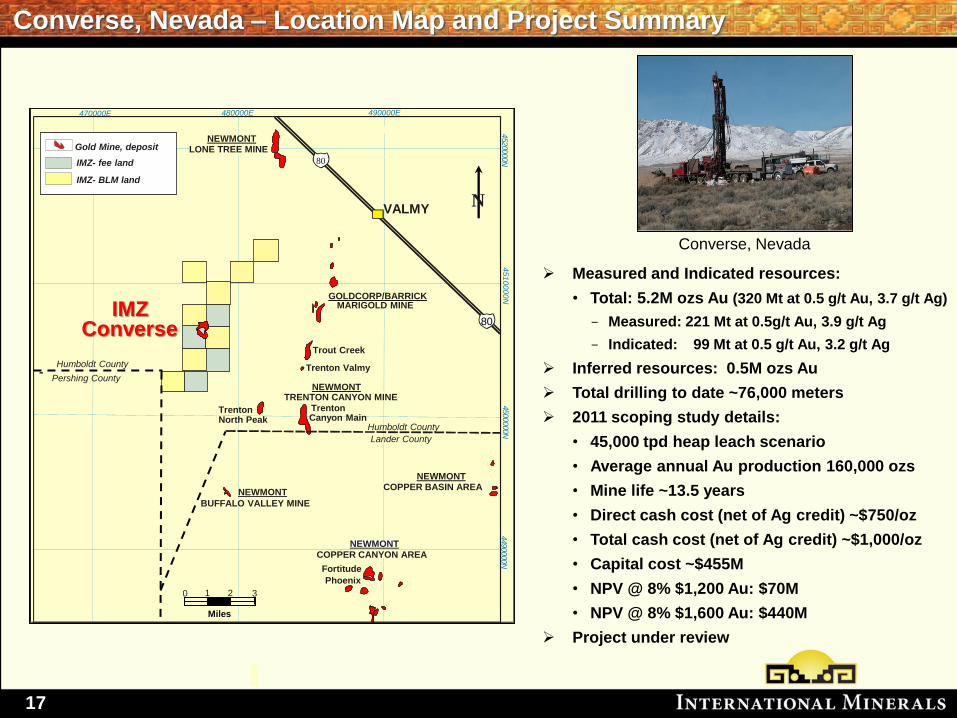
Converse, Nevada – Location Map and Project Summary
Trout Creek
Trenton Valmy
Trenton North Peak
Phoenix
Fortitude
80
4 4 9 0 0 0 0 N
4
5 0 0 0 0 0 N
4
5 2 0 0 0 0 N
490000E 470000E
Humboldt County
Lander County
Humboldt County
Pershing County
Converse IMZ MARIGOLD MINE
VALMY
Trenton Canyon Main
NEWMONT COPPER BASIN AREA
BUFFALO VALLEY MINE
NEWMONT COPPER CANYON AREA
LONE TREE MINE
480000E
80
Gold Mine, deposit
IMZ- fee land
IMZ- BLM land
N
GOLDCORP/BARRICK
45
10
00
0N
NEWMONT
NEWMONT
0 1 2 3
Miles
TRENTON CANYON MINE NEWMONT
Measured and Indicated resources:
• Total: 5.2M ozs Au (320 Mt at 0.5 g/t Au, 3.7 g/t Ag)
- Measured: 221 Mt at 0.5g/t Au, 3.9 g/t Ag
- Indicated: 99 Mt at 0.5 g/t Au, 3.2 g/t Ag
Inferred resources: 0.5M ozs Au
Total drilling to date ~76,000 meters
2011 scoping study details:
• 45,000 tpd heap leach scenario
• Average annual Au production 160,000 ozs
• Mine life ~13.5 years
• Direct cash cost (net of Ag credit) ~$750/oz
• Total cash cost (net of Ag credit) ~$1,000/oz
• Capital cost ~$455M
• NPV @ 8% $1,200 Au: $70M
• NPV @ 8% $1,600 Au: $440M
Project under review
Converse, Nevada
18
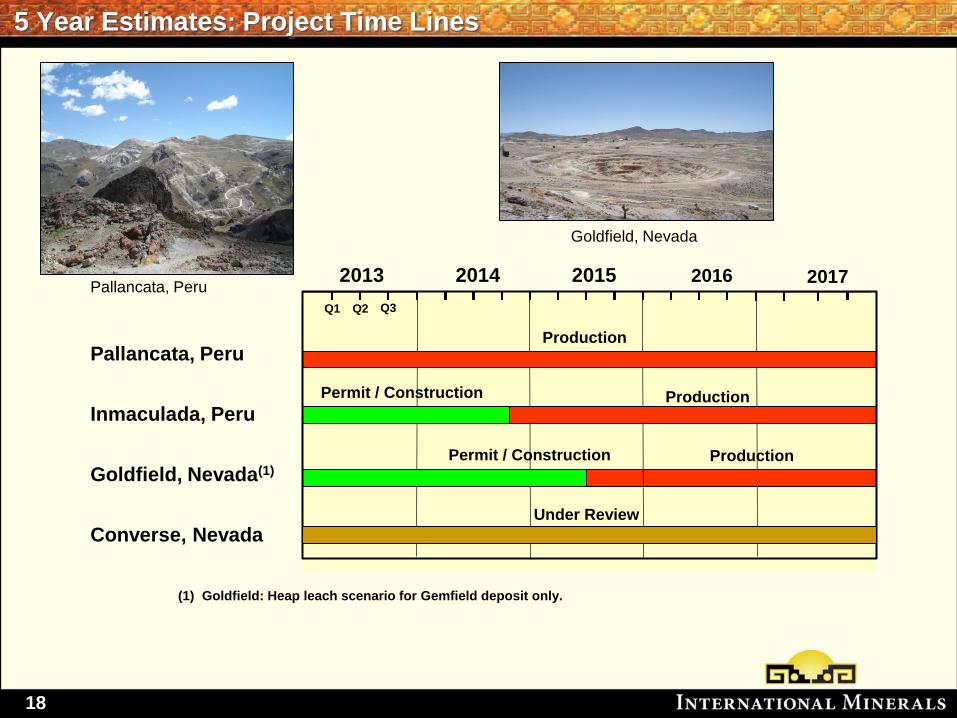
5 Year Estimates: Project Time Lines
Pallancata, Peru
Inmaculada, Peru
Goldfield, Nevada(1)
Converse, Nevada
2013 2014 2015 2016
Q1 Q2 Q3
Under Review
Permit / Construction
Permit / Construction
Production
Production
2017
Production
(1) Goldfield: Heap leach scenario for Gemfield deposit only.
Pallancata, Peru
Goldfield, Nevada
19
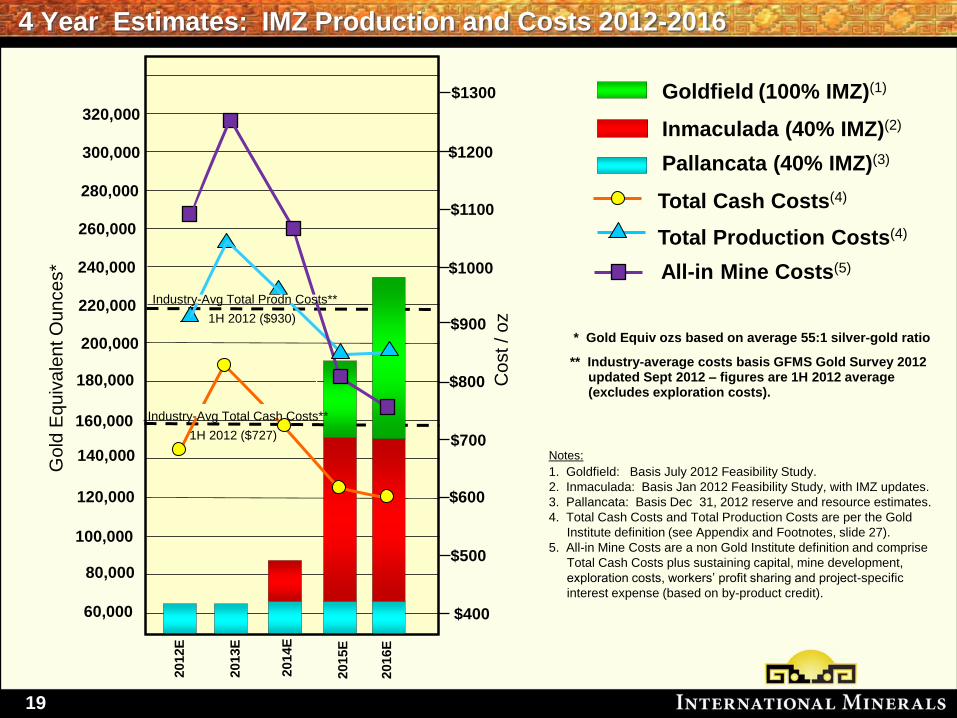
4 Year Estimates: IMZ Production and Costs 2012-2016
80,000
60,000
2016E
2012E
2013E
2014E
Go
ld E
qu
iva
len
t O
un
ce
s*
100,000
Notes:
1. Goldfield: Basis July 2012 Feasibility Study.
2. Inmaculada: Basis Jan 2012 Feasibility Study, with IMZ updates.
3. Pallancata: Basis Dec 31, 2012 reserve and resource estimates.
4. Total Cash Costs and Total Production Costs are per the Gold
Institute definition (see Appendix and Footnotes, slide 27).
5. All-in Mine Costs are a non Gold Institute definition and comprise
Total Cash Costs plus sustaining capital, mine development,
exploration costs, workers’ profit sharing and project-specific
interest expense (based on by-product credit).
120,000
140,000
160,000
180,000
Pallancata (40% IMZ)(3)
Total Cash Costs(4)
Goldfield (100% IMZ)(1)
Total Production Costs(4)
Inmaculada (40% IMZ)(2)
200,000
240,000
220,000
2015E
$1000
$800
$600 C
ost / oz
$1200
260,000
280,000
300,000
320,000
$1300
$400
* Gold Equiv ozs based on average 55:1 silver-gold ratio
** Industry-average costs basis GFMS Gold Survey 2012 updated Sept 2012 – figures are 1H 2012 average (excludes exploration costs).
$1100
$900
$700
$500
All-in Mine Costs(5)
Industry-Avg Total Prodn Costs**
1H 2012 ($930)
Industry-Avg Total Cash Costs**
1H 2012 ($727)
20
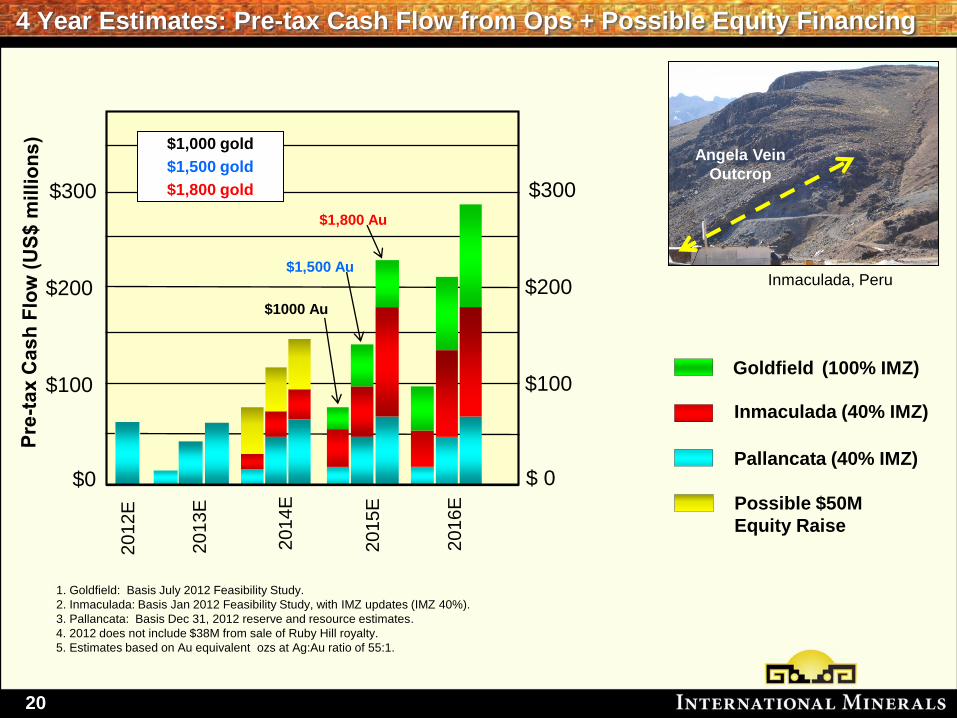
4 Year Estimates: Pre-tax Cash Flow from Ops + Possible Equity Financing
$0
2013E
2014E
2015E
$200
$100
$1,000 gold
$1,500 gold
$1,800 gold
1.1. Goldfield: Basis July 2012 Feasibility Study.
2.2. Inmaculada: Basis Jan 2012 Feasibility Study, with IMZ updates (IMZ 40%).
3.3. Pallancata: Basis Dec 31, 2012 reserve and resource estimates.
4. 2012 does not include $38M from sale of Ruby Hill royalty.
5. Estimates based on Au equivalent ozs at Ag:Au ratio of 55:1.
$300
Goldfield (100% IMZ)
Pallancata (40% IMZ)
Inmaculada (40% IMZ)
2016E
$ 0
$200
$100
$300
$1000 Au
$1,500 Au
$1,800 Au
Inmaculada, Peru
2012E
Angela Vein
Outcrop
Possible $50M
Equity Raise
21
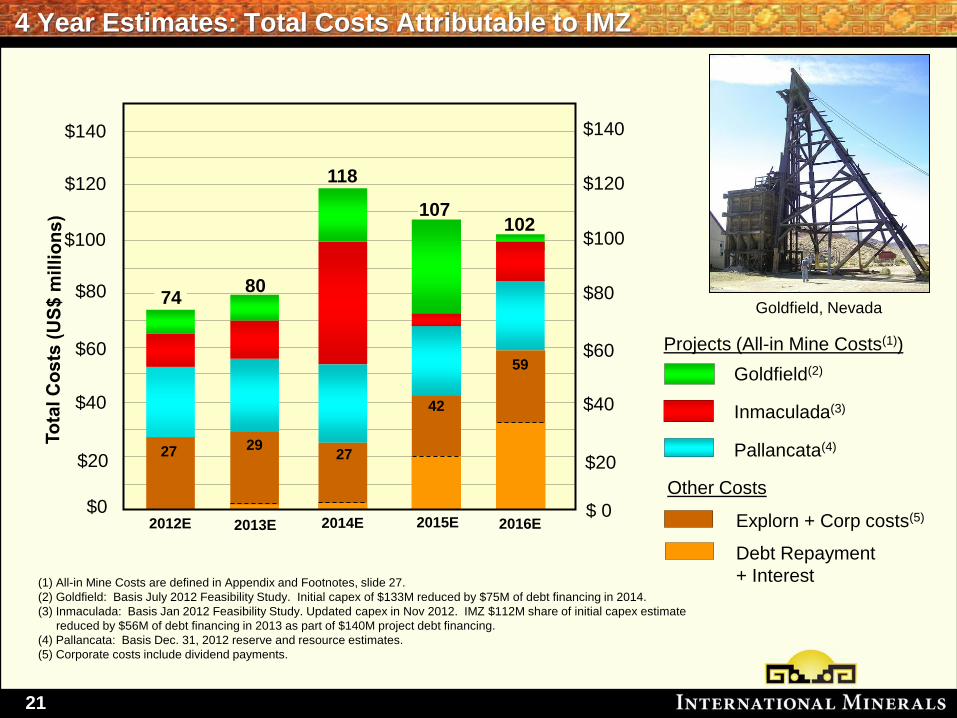
4 Year Estimates: Total Costs Attributable to IMZ
(1) All-in Mine Costs are defined in Appendix and Footnotes, slide 27.
(2) Goldfield: Basis July 2012 Feasibility Study. Initial capex of $133M reduced by $75M of debt financing in 2014.
(3) Inmaculada: Basis Jan 2012 Feasibility Study. Updated capex in Nov 2012. IMZ $112M share of initial capex estimate
reduced by $56M of debt financing in 2013 as part of $140M project debt financing.
(4) Pallancata: Basis Dec. 31, 2012 reserve and resource estimates.
(5) Corporate costs include dividend payments.
$60
$100
$0
$80
$40
$120
$20
$140
2012E 2013E 2014E 2015E 2016E
$60
$100
$ 0
$80
$40
$120
$20
$140
Goldfield, Nevada
74 80
102
27 29 27
42
59
107
118
Goldfield(2)
Inmaculada(3)
Pallancata(4)
Explorn + Corp costs(5)
Projects (All-in Mine Costs(1))
Debt Repayment
+ Interest
Other Costs
22
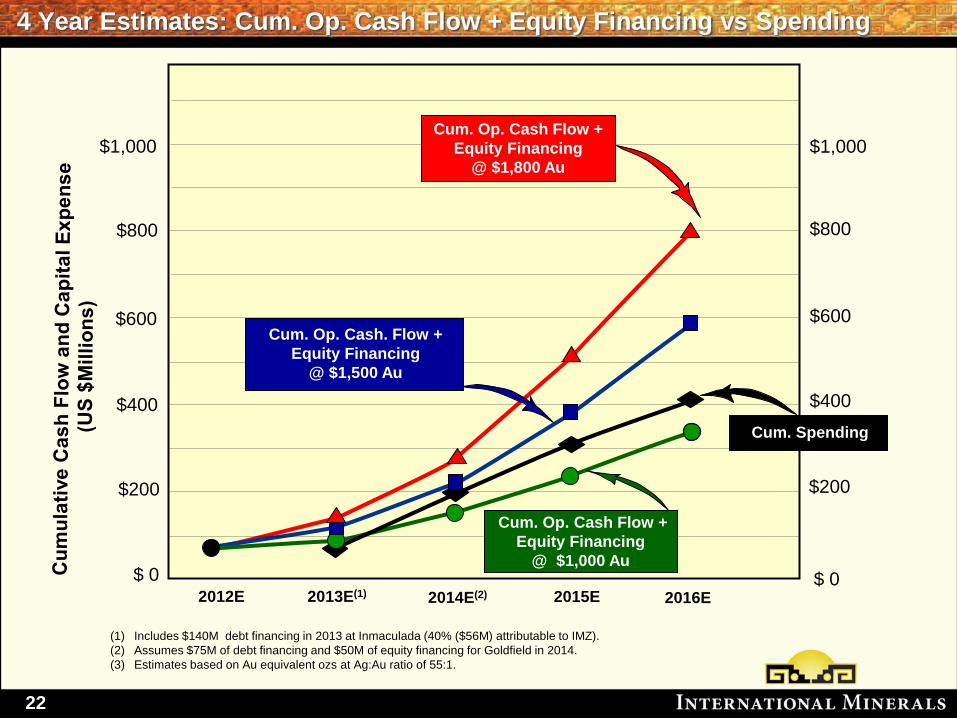
4 Year Estimates: Cum. Op. Cash Flow + Equity Financing vs Spending
$200
2012E 2013E(1) 2014E(2) 2015E
$ 0
2016E
$600
$400
$800
$1,000
Cum. Spending
Cum. Op. Cash. Flow +
Equity Financing
@ $1,500 Au
$200
$ 0
$600
$400
$800
$1,000
Cum. Op. Cash Flow +
Equity Financing
@ $1,000 Au
(1) Includes $140M debt financing in 2013 at Inmaculada (40% ($56M) attributable to IMZ).
(2) Assumes $75M of debt financing and $50M of equity financing for Goldfield in 2014.
(3) Estimates based on Au equivalent ozs at Ag:Au ratio of 55:1.
Cum. Op. Cash Flow +
Equity Financing
@ $1,800 Au
23
Kir
kla
nd
Lak
e
Ala
mo
s
B2G
old
Au
ric
o
Lak
e S
ho
re
S
an
Go
ld
Tim
min
s
Ala
ce
r
Se
ma
fo
Arg
on
au
t
IMZ
GO
LD
CO
RP
BA
RR
ICK
AG
NIC
O
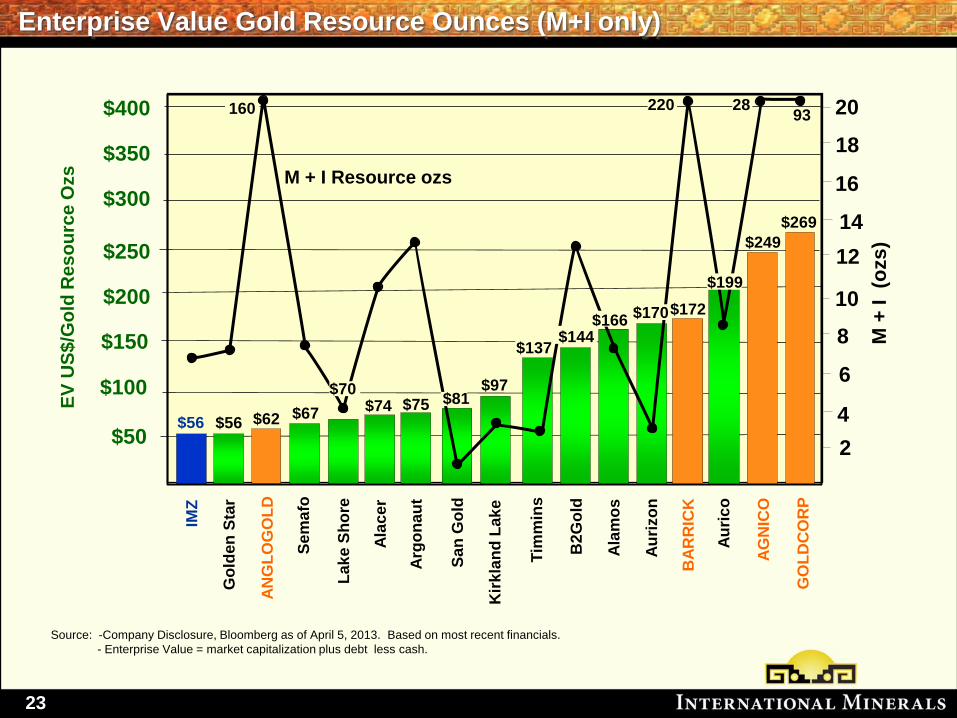
Enterprise Value Gold Resource Ounces (M+I only)
$200
$100
$50
EV
US
$/G
old
Re
so
urc
e O
zs
$250
$300
$350
$400
Source: -Company Disclosure, Bloomberg as of April 5, 2013. Based on most recent financials.
- Enterprise Value = market capitalization plus debt less cash.
16
14
12
10
8
6
M +
I (o
zs
)
18
2
20
$56 4
$150
$67
AN
GL
OG
OL
D
Go
lden
Sta
r
$75 $74
M + I Resource ozs
$56 $62
Au
rizo
n
$97
$172
$249
$269
$81 $70
$166 $144
$170
$199
160 220 28 93
$137
24
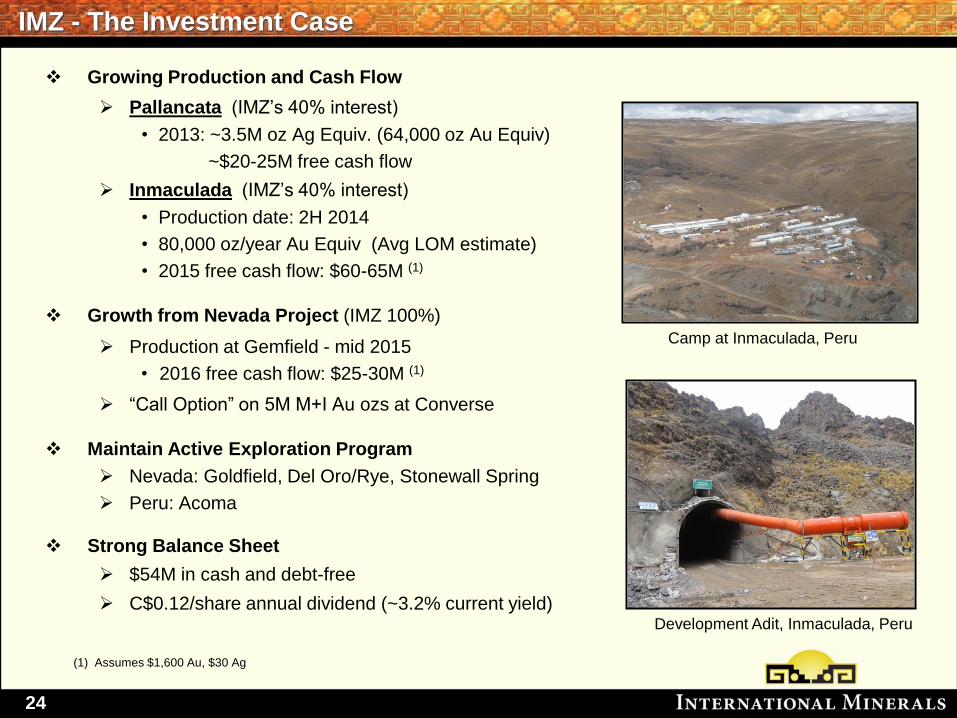
IMZ - The Investment Case
Growing Production and Cash Flow
Pallancata (IMZ’s 40% interest)
• 2013: ~3.5M oz Ag Equiv. (64,000 oz Au Equiv)
~$20-25M free cash flow
Inmaculada (IMZ’s 40% interest)
• Production date: 2H 2014
• 80,000 oz/year Au Equiv (Avg LOM estimate)
• 2015 free cash flow: $60-65M (1)
Growth from Nevada Project (IMZ 100%)
Production at Gemfield - mid 2015
• 2016 free cash flow: $25-30M (1)
“Call Option” on 5M M+I Au ozs at Converse
Maintain Active Exploration Program
Nevada: Goldfield, Del Oro/Rye, Stonewall Spring
Peru: Acoma
Strong Balance Sheet
$54M in cash and debt-free
C$0.12/share annual dividend (~3.2% current yield)
Camp at Inmaculada, Peru
Development Adit, Inmaculada, Peru
(1) Assumes $1,600 Au, $30 Ag
25
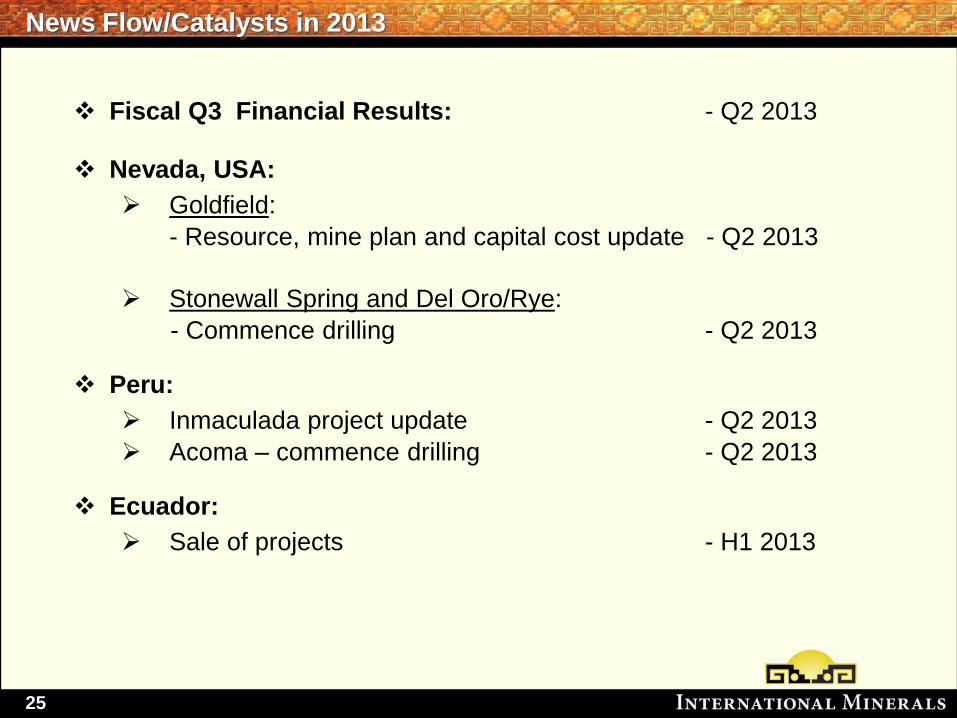
News Flow/Catalysts in 2013
Fiscal Q3 Financial Results: - Q2 2013
Nevada, USA:
Goldfield:
- Resource, mine plan and capital cost update - Q2 2013
Stonewall Spring and Del Oro/Rye:
- Commence drilling - Q2 2013
Peru:
Inmaculada project update - Q2 2013
Acoma – commence drilling - Q2 2013
Ecuador:
Sale of projects - H1 2013
26
Contact Information
Website: www.intlminerals.com
Email: [email protected]
Investor Relations
• Paul Durham
VP - Corporate Relations
Office phone: +1 (203) 883 8359
Cell Phone: +1 (203) 940 2538
Email: [email protected]
• Christine Stewart
Renmark Financial (Canada)
Toronto Office: +1 (416) 644 2020
Montreal Office: +1 (514) 939 3989
Email: [email protected]
Headquarters (U.S.A.)
• Scottsdale, Arizona: +1 (480) 483 9932
Fax: +1 (480) 483 9926
Email: [email protected]
• Oliver Holzer
Marketing Consultant (Europe)
Swiss office: +41 44 853 00 47
Mobile: +41 79 402 39 33
Email: [email protected]
27
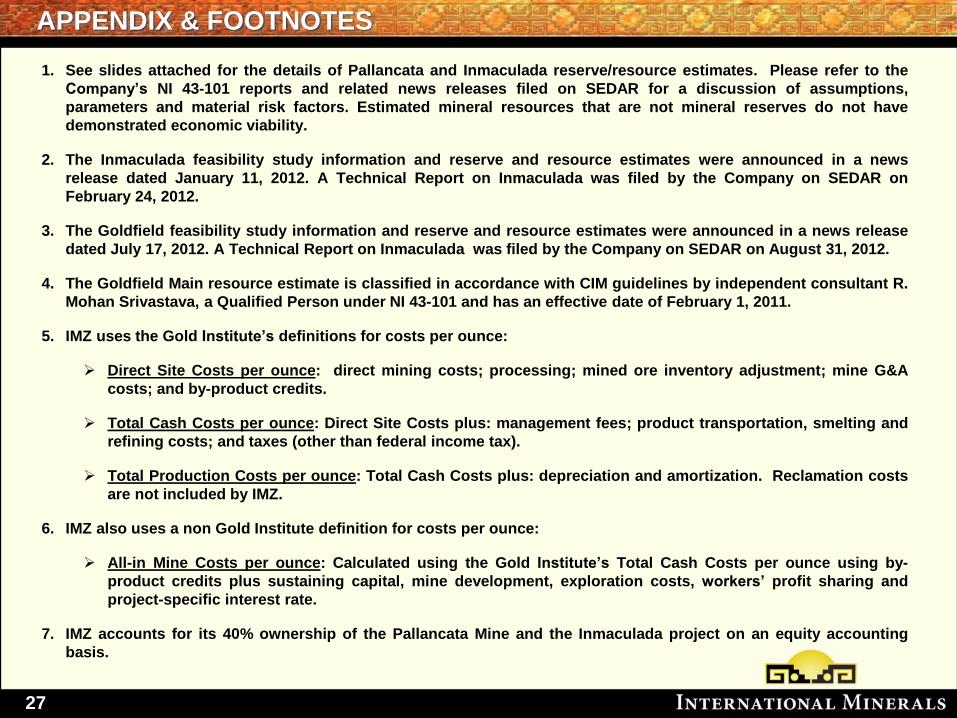
APPENDIX & FOOTNOTES
1. See slides attached for the details of Pallancata and Inmaculada reserve/resource estimates. Please refer to the
Company’s NI 43-101 reports and related news releases filed on SEDAR for a discussion of assumptions,
parameters and material risk factors. Estimated mineral resources that are not mineral reserves do not have
demonstrated economic viability.
2. The Inmaculada feasibility study information and reserve and resource estimates were announced in a news
release dated January 11, 2012. A Technical Report on Inmaculada was filed by the Company on SEDAR on
February 24, 2012.
3. The Goldfield feasibility study information and reserve and resource estimates were announced in a news release
dated July 17, 2012. A Technical Report on Inmaculada was filed by the Company on SEDAR on August 31, 2012.
4. The Goldfield Main resource estimate is classified in accordance with CIM guidelines by independent consultant R.
Mohan Srivastava, a Qualified Person under NI 43-101 and has an effective date of February 1, 2011.
5. IMZ uses the Gold Institute’s definitions for costs per ounce:
Direct Site Costs per ounce: direct mining costs; processing; mined ore inventory adjustment; mine G&A
costs; and by-product credits.
Total Cash Costs per ounce: Direct Site Costs plus: management fees; product transportation, smelting and
refining costs; and taxes (other than federal income tax).
Total Production Costs per ounce: Total Cash Costs plus: depreciation and amortization. Reclamation costs
are not included by IMZ.
6. IMZ also uses a non Gold Institute definition for costs per ounce:
All-in Mine Costs per ounce: Calculated using the Gold Institute’s Total Cash Costs per ounce using by-
product credits plus sustaining capital, mine development, exploration costs, workers’ profit sharing and
project-specific interest rate.
7. IMZ accounts for its 40% ownership of the Pallancata Mine and the Inmaculada project on an equity accounting
basis.
28
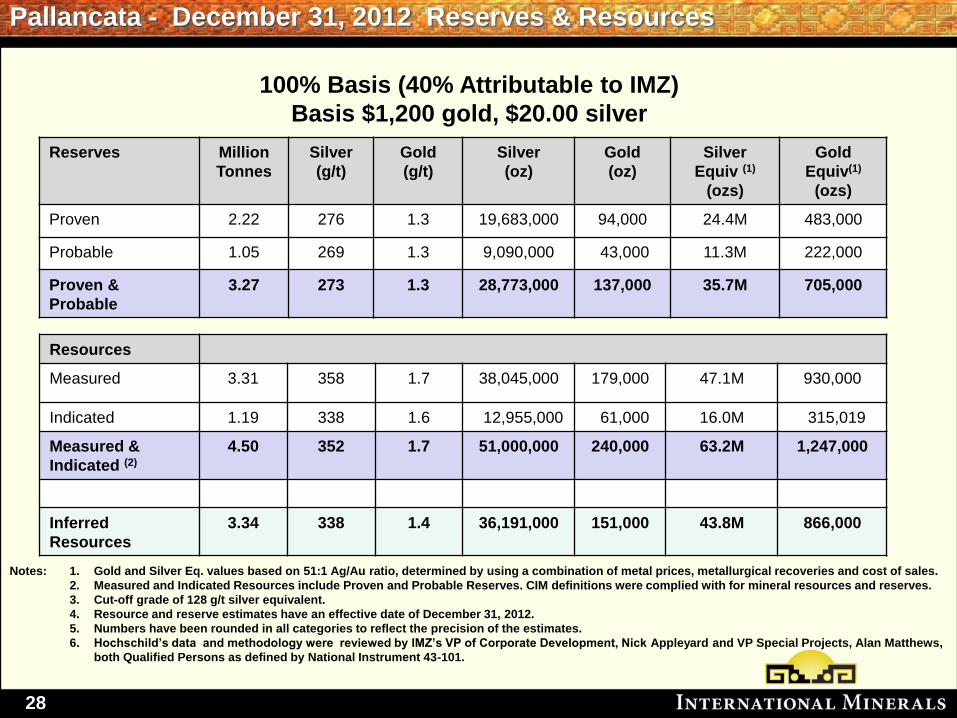
Pallancata - December 31, 2012 Reserves & Resources
Notes: 1. Gold and Silver Eq. values based on 51:1 Ag/Au ratio, determined by using a combination of metal prices, metallurgical recoveries and cost of sales.
2. Measured and Indicated Resources include Proven and Probable Reserves. CIM definitions were complied with for mineral resources and reserves.
3. Cut-off grade of 128 g/t silver equivalent.
4. Resource and reserve estimates have an effective date of December 31, 2012.
5. Numbers have been rounded in all categories to reflect the precision of the estimates.
6. Hochschild’s data and methodology were reviewed by IMZ’s VP of Corporate Development, Nick Appleyard and VP Special Projects, Alan Matthews,
both Qualified Persons as defined by National Instrument 43-101.
100% Basis (40% Attributable to IMZ)
Basis $1,200 gold, $20.00 silver
Reserves Million
Tonnes
Silver
(g/t)
Gold
(g/t)
Silver
(oz)
Gold
(oz)
Silver
Equiv (1)
(ozs)
Gold
Equiv(1)
(ozs)
Proven 2.22 276 1.3 19,683,000 94,000 24.4M 483,000
Probable 1.05 269 1.3 9,090,000 43,000 11.3M 222,000
Proven &
Probable
3.27 273 1.3 28,773,000 137,000 35.7M 705,000
Resources
Measured 3.31 358 1.7 38,045,000 179,000 47.1M 930,000
Indicated 1.19 338 1.6 12,955,000 61,000 16.0M 315,019
Measured &
Indicated (2)
4.50 352 1.7 51,000,000 240,000 63.2M 1,247,000
Inferred
Resources 3.34 338 1.4 36,191,000 151,000 43.8M 866,000
29
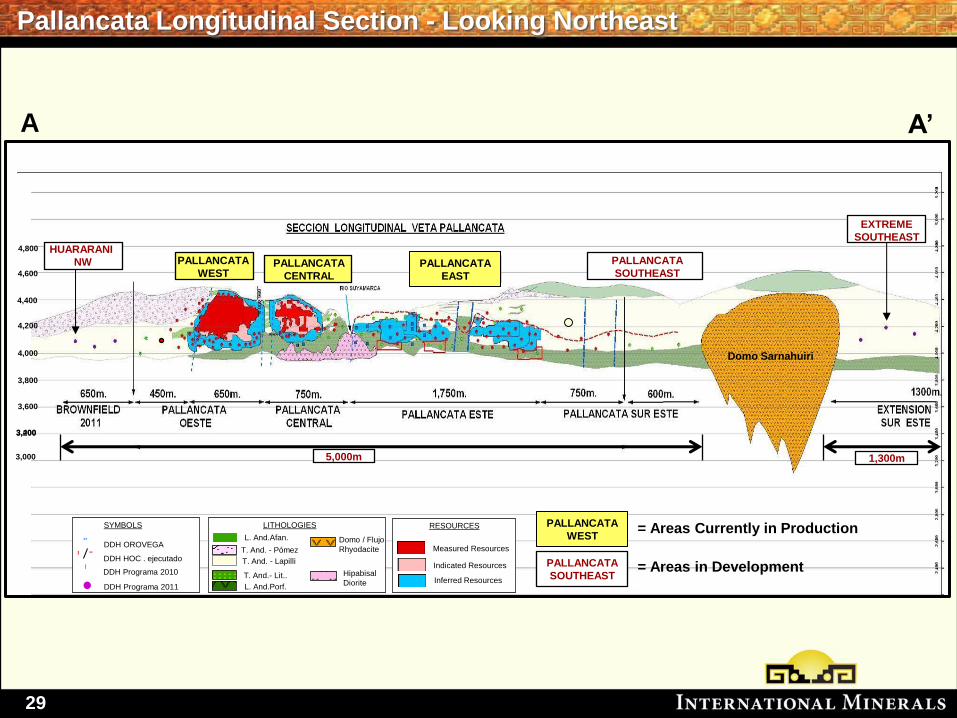
Pallancata Longitudinal Section - Looking Northeast
"
!
DDH OROVEGA
DDH HOC . ejecutado
DDH Programa 2010
DDH Programa 2011
SYMBOLS LITHOLOGIES
T. And. - Pómez
T. And. - Lapilli
L. And.Porf.
T. And.- Lit..
L. And.Afan. Domo / Flujo
Rhyodacite
Hipabisal
Diorite
! "Measured Resources
Indicated Resources
Inferred Resources
RESOURCES
EXTREMO
SUR ESTE
Domo Sarnahuiri
3,000
3,400
3,800
4,200
4,400
4,600
4,800
4,000
3,600
3,200
HUARARANI
NW PALLANCATA
SOUTHEAST PALLANCATA
CENTRAL
PALLANCATA
WEST PALLANCATA
EAST
EXTREME
SOUTHEAST
PALLANCATA
WEST = Areas Currently in Production
1,300m 5,000m
PALLANCATA
SOUTHEAST = Areas in Development
A A’
30
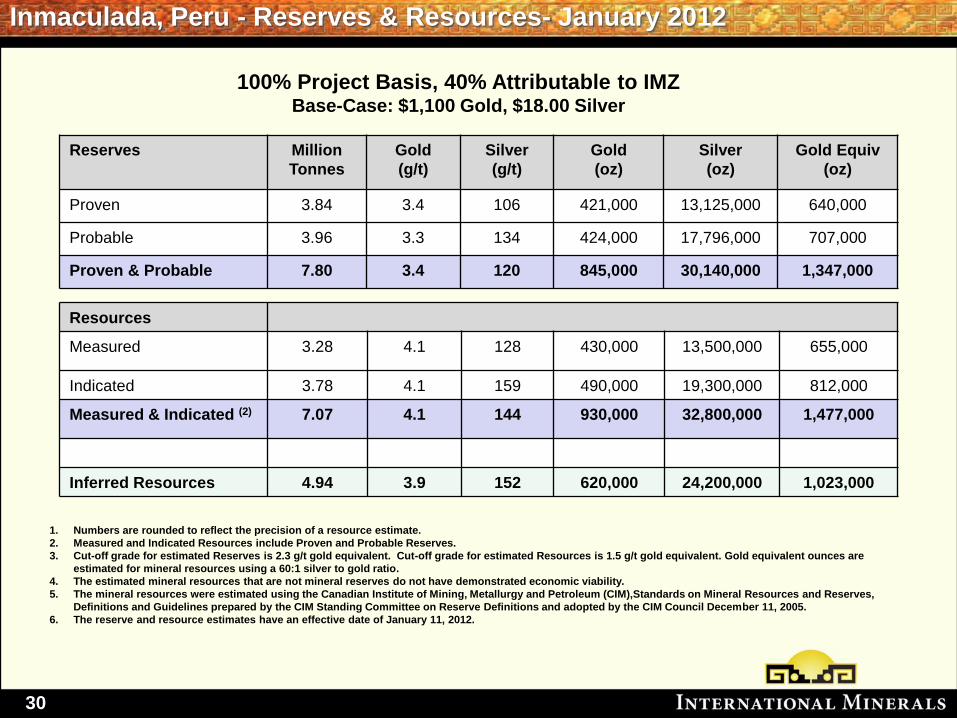
Inmaculada, Peru - Reserves & Resources- January 2012
1. Numbers are rounded to reflect the precision of a resource estimate.
2. Measured and Indicated Resources include Proven and Probable Reserves.
3. Cut-off grade for estimated Reserves is 2.3 g/t gold equivalent. Cut-off grade for estimated Resources is 1.5 g/t gold equivalent. Gold equivalent ounces are
estimated for mineral resources using a 60:1 silver to gold ratio.
4. The estimated mineral resources that are not mineral reserves do not have demonstrated economic viability.
5. The mineral resources were estimated using the Canadian Institute of Mining, Metallurgy and Petroleum (CIM),Standards on Mineral Resources and Reserves,
Definitions and Guidelines prepared by the CIM Standing Committee on Reserve Definitions and adopted by the CIM Council December 11, 2005.
6. The reserve and resource estimates have an effective date of January 11, 2012.
Reserves Million
Tonnes
Gold
(g/t)
Silver
(g/t)
Gold
(oz)
Silver
(oz)
Gold Equiv
(oz)
Proven 3.84 3.4 106 421,000 13,125,000 640,000
Probable 3.96 3.3 134 424,000 17,796,000 707,000
Proven & Probable 7.80 3.4 120 845,000 30,140,000 1,347,000
Resources
Measured 3.28 4.1 128 430,000 13,500,000 655,000
Indicated 3.78 4.1 159 490,000 19,300,000 812,000
Measured & Indicated (2) 7.07 4.1 144 930,000 32,800,000 1,477,000
Inferred Resources 4.94 3.9 152 620,000 24,200,000 1,023,000
100% Project Basis, 40% Attributable to IMZ Base-Case: $1,100 Gold, $18.00 Silver
31
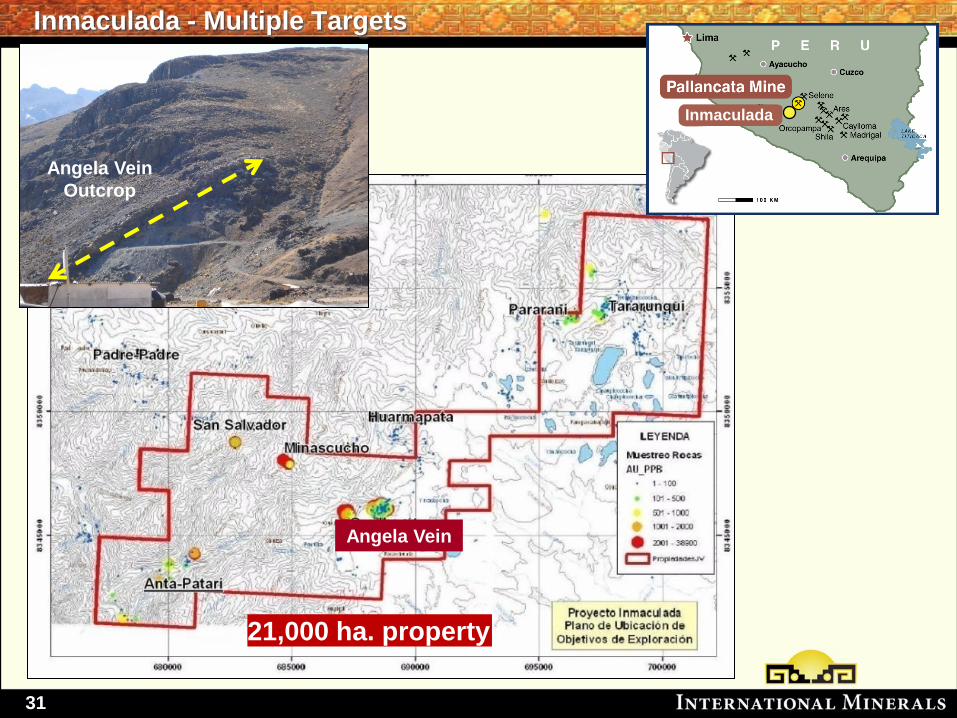
Inmaculada - Multiple Targets
21,000 ha. property
Inmaculada
Angela Vein
Angela Vein
Outcrop
32
10
10
50
50
100 10
50
4600 m
50
50
10
10
SW NE
4200 m
25
10
25
50
10
10
25
25
50
100
50
139
10
25
100
10
100
50
100
50
10
00
0
100
25
100
100
25
25
25
100
10
05
0
10
10
0
10
15
0
10
20
0
10
25
0
10
30
0
10
35
0
10
40
0
10
45
0
10
50
0
10
55
0
10
60
0
10
65
0
10
70
0
10
75
0
10
80
0
10
85
0
10
90
0
11
40
0
11
00
0
11
45
0
11
10
0
11
20
0
11
30
0
11
50
0
11
60
0
11
70
0
11
80
0
11
90
0
12
00
0
Meters
50 100 0 200
o
o
o
o
o
o
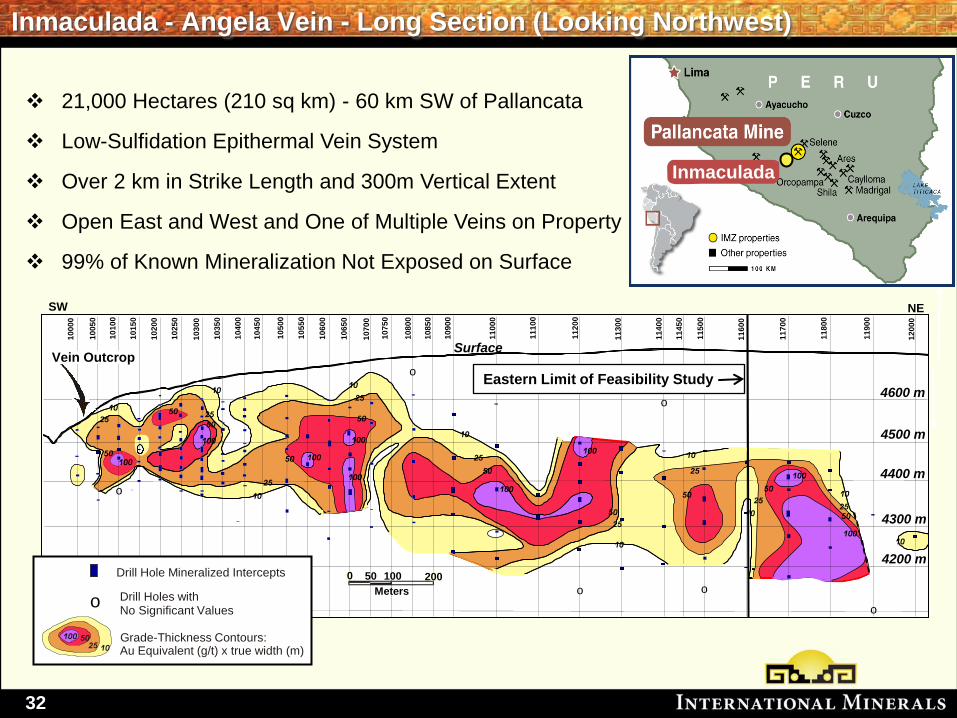
Surface
Grade-Thickness Contours: Au Equivalent (g/t) x true width (m)
Drill Holes with
No Significant Values
Drill Hole Mineralized Intercepts
25 50
10
100
o
Eastern Limit of Feasibility Study
Inmaculada - Angela Vein - Long Section (Looking Northwest)
4300 m
4400 m
4500 m
Inmaculada
Vein Outcrop
21,000 Hectares (210 sq km) - 60 km SW of Pallancata
Low-Sulfidation Epithermal Vein System
Over 2 km in Strike Length and 300m Vertical Extent
Open East and West and One of Multiple Veins on Property
99% of Known Mineralization Not Exposed on Surface
33
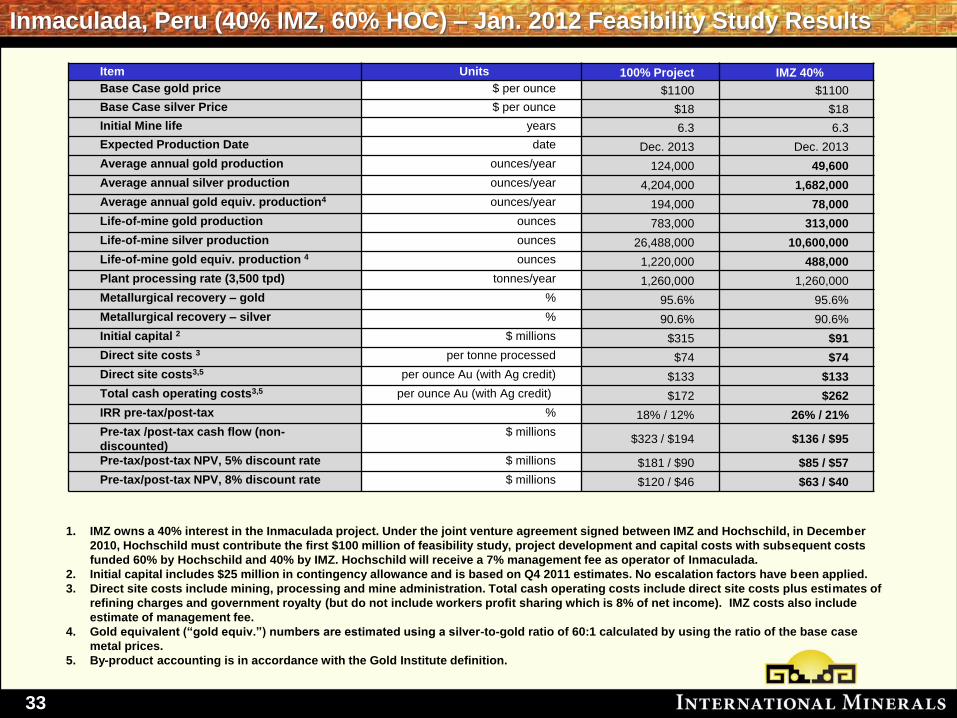
Inmaculada, Peru (40% IMZ, 60% HOC) – Jan. 2012 Feasibility Study Results
Item Units 100% Project IMZ 40%
Base Case gold price $ per ounce $1100 $1100
Base Case silver Price $ per ounce $18 $18
Initial Mine life years 6.3 6.3
Expected Production Date date Dec. 2013 Dec. 2013
Average annual gold production ounces/year 124,000 49,600
Average annual silver production ounces/year 4,204,000 1,682,000
Average annual gold equiv. production4 ounces/year 194,000 78,000
Life-of-mine gold production ounces 783,000 313,000
Life-of-mine silver production ounces 26,488,000 10,600,000
Life-of-mine gold equiv. production 4 ounces 1,220,000 488,000
Plant processing rate (3,500 tpd) tonnes/year 1,260,000 1,260,000
Metallurgical recovery – gold % 95.6% 95.6%
Metallurgical recovery – silver % 90.6% 90.6%
Initial capital 2 $ millions $315 $91
Direct site costs 3 per tonne processed $74 $74
Direct site costs3,5 per ounce Au (with Ag credit) $133 $133
Total cash operating costs3,5 per ounce Au (with Ag credit) $172 $262
IRR pre-tax/post-tax % 18% / 12% 26% / 21%
Pre-tax /post-tax cash flow (non-
discounted)
$ millions $323 / $194 $136 / $95
Pre-tax/post-tax NPV, 5% discount rate $ millions $181 / $90 $85 / $57
Pre-tax/post-tax NPV, 8% discount rate $ millions $120 / $46 $63 / $40
1. IMZ owns a 40% interest in the Inmaculada project. Under the joint venture agreement signed between IMZ and Hochschild, in December
2010, Hochschild must contribute the first $100 million of feasibility study, project development and capital costs with subsequent costs
funded 60% by Hochschild and 40% by IMZ. Hochschild will receive a 7% management fee as operator of Inmaculada.
2. Initial capital includes $25 million in contingency allowance and is based on Q4 2011 estimates. No escalation factors have been applied.
3. Direct site costs include mining, processing and mine administration. Total cash operating costs include direct site costs plus estimates of
refining charges and government royalty (but do not include workers profit sharing which is 8% of net income). IMZ costs also include
estimate of management fee.
4. Gold equivalent (“gold equiv.”) numbers are estimated using a silver-to-gold ratio of 60:1 calculated by using the ratio of the base case
metal prices.
5. By-product accounting is in accordance with the Gold Institute definition.
34
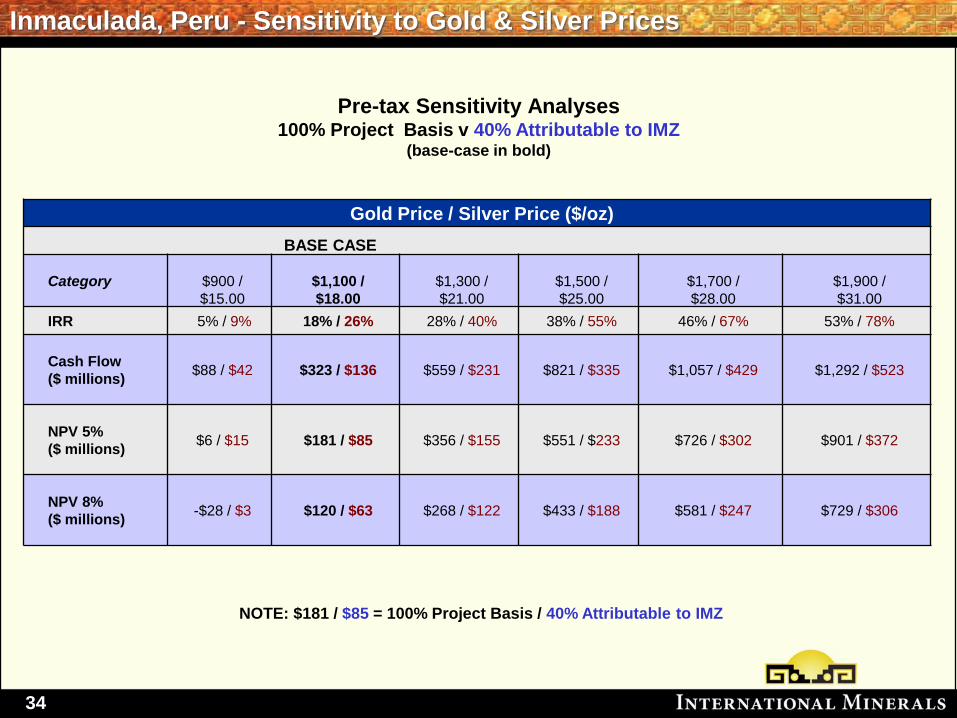
Inmaculada, Peru - Sensitivity to Gold & Silver Prices
Gold Price / Silver Price ($/oz)
BASE CASE
Category
$900 /
$15.00
$1,100 /
$18.00
$1,300 /
$21.00
$1,500 /
$25.00
$1,700 /
$28.00
$1,900 /
$31.00
IRR 5% / 9% 18% / 26% 28% / 40% 38% / 55% 46% / 67% 53% / 78%
Cash Flow
($ millions)
$88 / $42 $323 / $136 $559 / $231 $821 / $335 $1,057 / $429 $1,292 / $523
NPV 5%
($ millions)
$6 / $15 $181 / $85 $356 / $155 $551 / $233 $726 / $302 $901 / $372
NPV 8%
($ millions)
-$28 / $3 $120 / $63 $268 / $122 $433 / $188 $581 / $247 $729 / $306
Pre-tax Sensitivity Analyses 100% Project Basis v 40% Attributable to IMZ
(base-case in bold)
NOTE: $181 / $85 = 100% Project Basis / 40% Attributable to IMZ
35
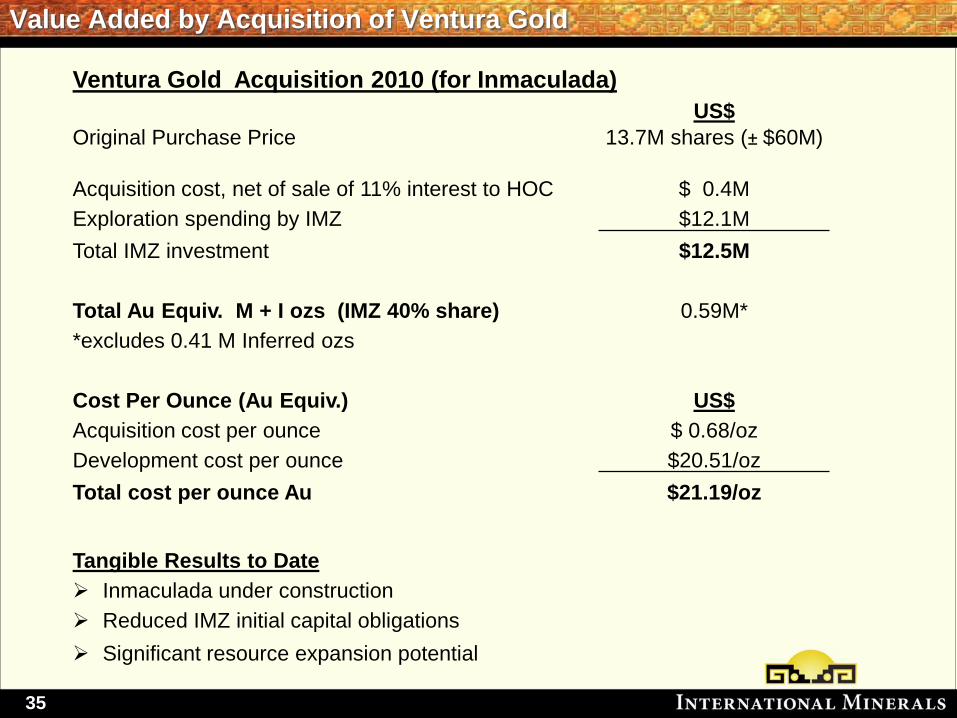
Value Added by Acquisition of Ventura Gold
Ventura Gold Acquisition 2010 (for Inmaculada)
US$
Original Purchase Price 13.7M shares (± $60M)
Acquisition cost, net of sale of 11% interest to HOC $ 0.4M
Exploration spending by IMZ $12.1M
Total IMZ investment $12.5M
Total Au Equiv. M + I ozs (IMZ 40% share) 0.59M*
*excludes 0.41 M Inferred ozs
Cost Per Ounce (Au Equiv.) US$
Acquisition cost per ounce $ 0.68/oz
Development cost per ounce $20.51/oz
Total cost per ounce Au $21.19/oz
Tangible Results to Date
Inmaculada under construction
Reduced IMZ initial capital obligations
Significant resource expansion potential
36
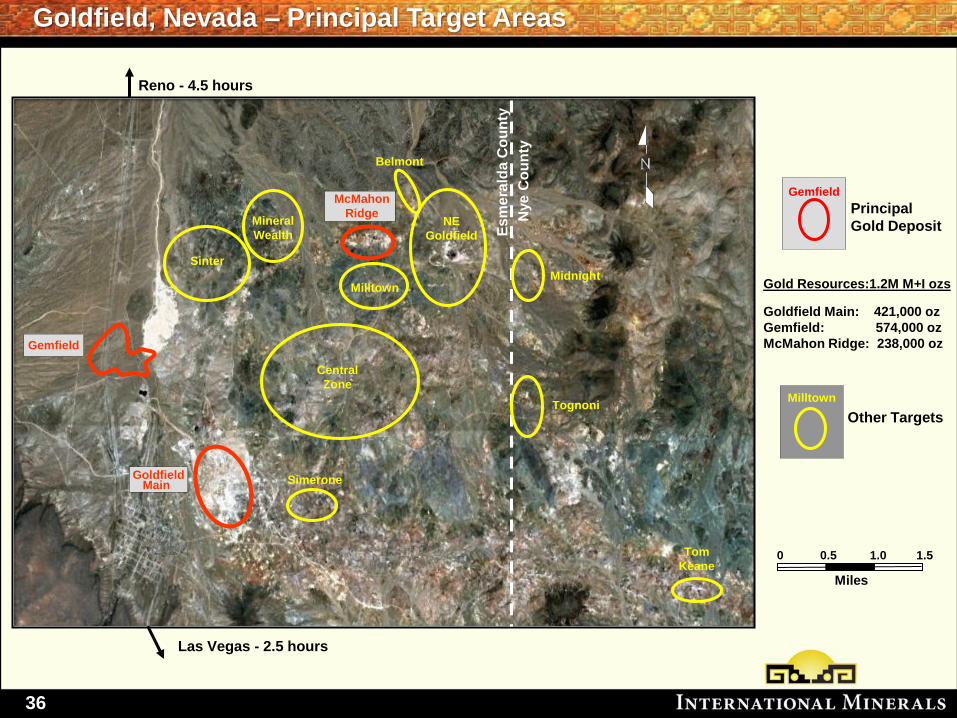
Milltown
Gemfield
Principal
Gold Deposit
Other Targets
Goldfield Main: 421,000 oz
Gemfield: 574,000 oz
McMahon Ridge: 238,000 oz
Gold Resources:1.2M M+I ozs
Goldfield, Nevada – Principal Target Areas
Main Goldfield
Reno - 4.5 hours
Las Vegas - 2.5 hours
McMahon
Ridge
Gemfield
Midnight
Belmont
NE
Goldfield
Tognoni
Tom
Keane
Central
Zone
Milltown
Mineral
Wealth
Sinter
Simerone
Es
me
rald
a C
ou
nty
Nye
Co
un
ty
Miles
0 0.5 1.0 1.5
37
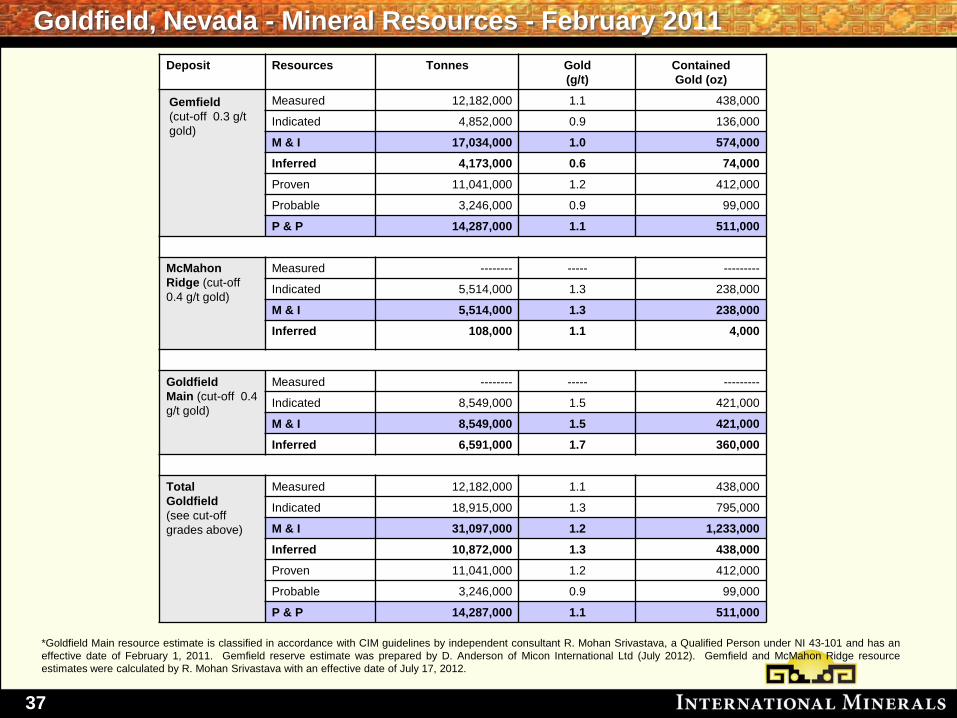
Goldfield, Nevada - Mineral Resources - February 2011
Deposit Resources Tonnes Gold
(g/t)
Contained
Gold (oz)
Gemfield
(cut-off 0.3 g/t
gold)
Measured 12,182,000 1.1 438,000
Indicated 4,852,000 0.9 136,000
M & I 17,034,000 1.0 574,000
Inferred 4,173,000 0.6 74,000
Proven 11,041,000 1.2 412,000
Probable 3,246,000 0.9 99,000
P & P 14,287,000 1.1 511,000
McMahon
Ridge (cut-off
0.4 g/t gold)
Measured -------- ----- ---------
Indicated 5,514,000 1.3 238,000
M & I 5,514,000 1.3 238,000
Inferred 108,000 1.1 4,000
Goldfield
Main (cut-off 0.4
g/t gold)
Measured -------- ----- ---------
Indicated 8,549,000 1.5 421,000
M & I 8,549,000 1.5 421,000
Inferred 6,591,000 1.7 360,000
Total
Goldfield
(see cut-off
grades above)
Measured 12,182,000 1.1 438,000
Indicated 18,915,000 1.3 795,000
M & I 31,097,000 1.2 1,233,000
Inferred 10,872,000 1.3 438,000
Proven 11,041,000 1.2 412,000
Probable 3,246,000 0.9 99,000
P & P 14,287,000 1.1 511,000
*Goldfield Main resource estimate is classified in accordance with CIM guidelines by independent consultant R. Mohan Srivastava, a Qualified Person under NI 43-101 and has an
effective date of February 1, 2011. Gemfield reserve estimate was prepared by D. Anderson of Micon International Ltd (July 2012). Gemfield and McMahon Ridge resource
estimates were calculated by R. Mohan Srivastava with an effective date of July 17, 2012.
38
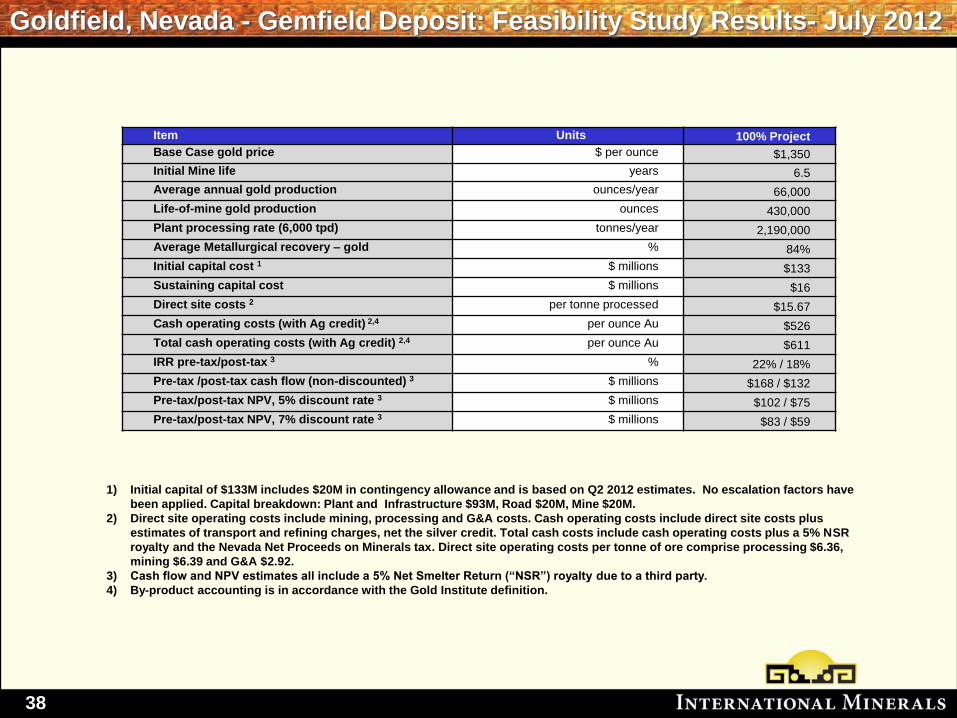
Goldfield, Nevada - Gemfield Deposit: Feasibility Study Results- July 2012
Item Units 100% Project
Base Case gold price $ per ounce $1,350
Initial Mine life years 6.5
Average annual gold production ounces/year 66,000
Life-of-mine gold production ounces 430,000
Plant processing rate (6,000 tpd) tonnes/year 2,190,000
Average Metallurgical recovery – gold % 84%
Initial capital cost 1 $ millions $133
Sustaining capital cost $ millions $16
Direct site costs 2 per tonne processed $15.67
Cash operating costs (with Ag credit) 2,4 per ounce Au $526
Total cash operating costs (with Ag credit) 2,4 per ounce Au $611
IRR pre-tax/post-tax 3 % 22% / 18%
Pre-tax /post-tax cash flow (non-discounted) 3 $ millions $168 / $132
Pre-tax/post-tax NPV, 5% discount rate 3 $ millions $102 / $75
Pre-tax/post-tax NPV, 7% discount rate 3 $ millions $83 / $59
1) Initial capital of $133M includes $20M in contingency allowance and is based on Q2 2012 estimates. No escalation factors have
been applied. Capital breakdown: Plant and Infrastructure $93M, Road $20M, Mine $20M.
2) Direct site operating costs include mining, processing and G&A costs. Cash operating costs include direct site costs plus
estimates of transport and refining charges, net the silver credit. Total cash costs include cash operating costs plus a 5% NSR
royalty and the Nevada Net Proceeds on Minerals tax. Direct site operating costs per tonne of ore comprise processing $6.36,
mining $6.39 and G&A $2.92.
3) Cash flow and NPV estimates all include a 5% Net Smelter Return (“NSR”) royalty due to a third party.
4) By-product accounting is in accordance with the Gold Institute definition.
39
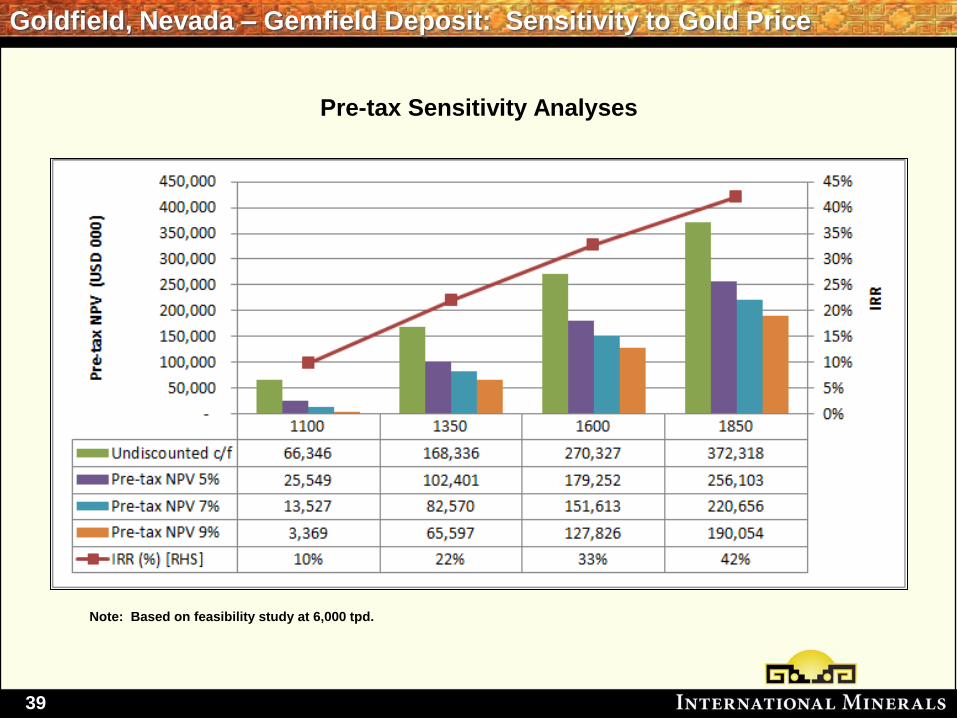
Goldfield, Nevada – Gemfield Deposit: Sensitivity to Gold Price
Pre-tax Sensitivity Analyses
Note: Based on feasibility study at 6,000 tpd.
40
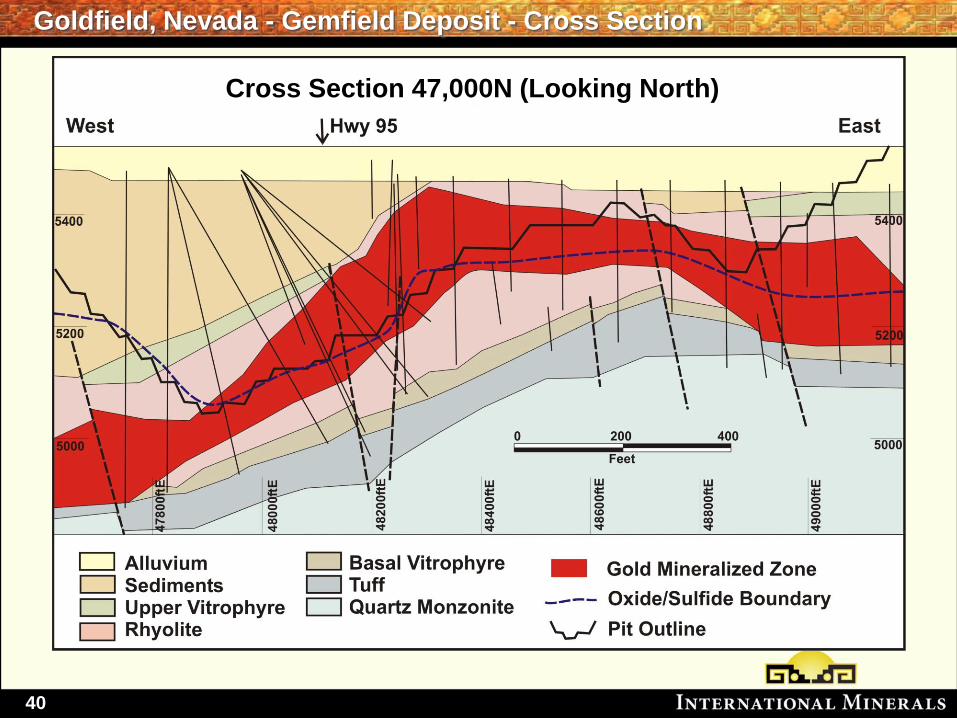
Goldfield, Nevada - Gemfield Deposit - Cross Section
Cross Section 47,000N (Looking North)
41
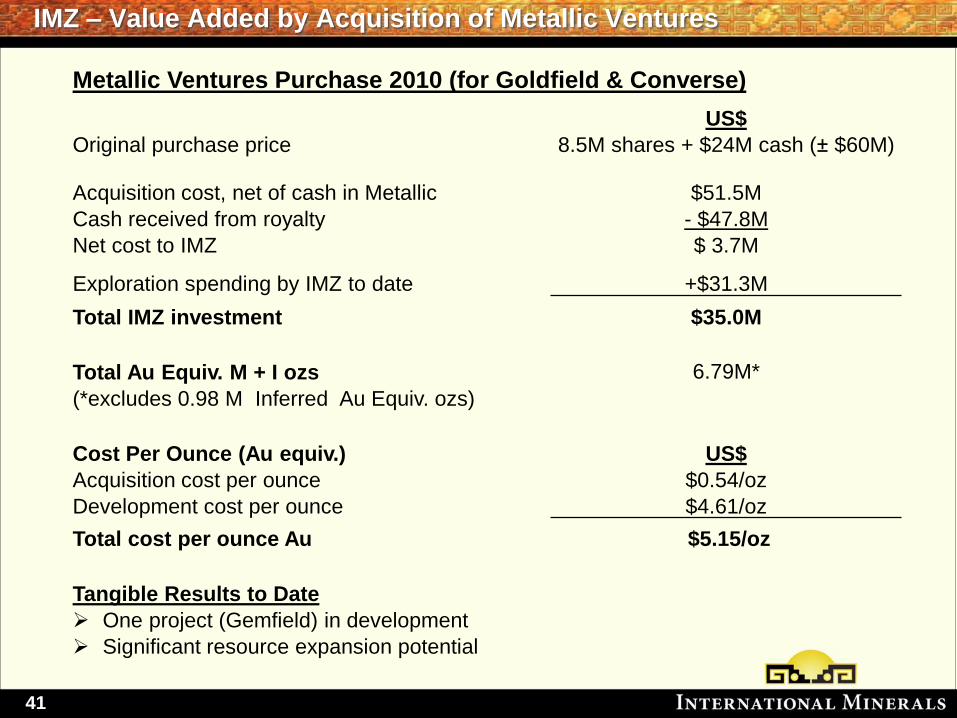
IMZ – Value Added by Acquisition of Metallic Ventures
Metallic Ventures Purchase 2010 (for Goldfield & Converse)
US$
Original purchase price 8.5M shares + $24M cash (± $60M)
Acquisition cost, net of cash in Metallic $51.5M
Cash received from royalty - $47.8M
Net cost to IMZ $ 3.7M
Exploration spending by IMZ to date +$31.3M
Total IMZ investment $35.0M
Total Au Equiv. M + I ozs 6.79M*
(*excludes 0.98 M Inferred Au Equiv. ozs)
Cost Per Ounce (Au equiv.) US$
Acquisition cost per ounce $0.54/oz
Development cost per ounce $4.61/oz
Total cost per ounce Au $5.15/oz
Tangible Results to Date
One project (Gemfield) in development
Significant resource expansion potential
42
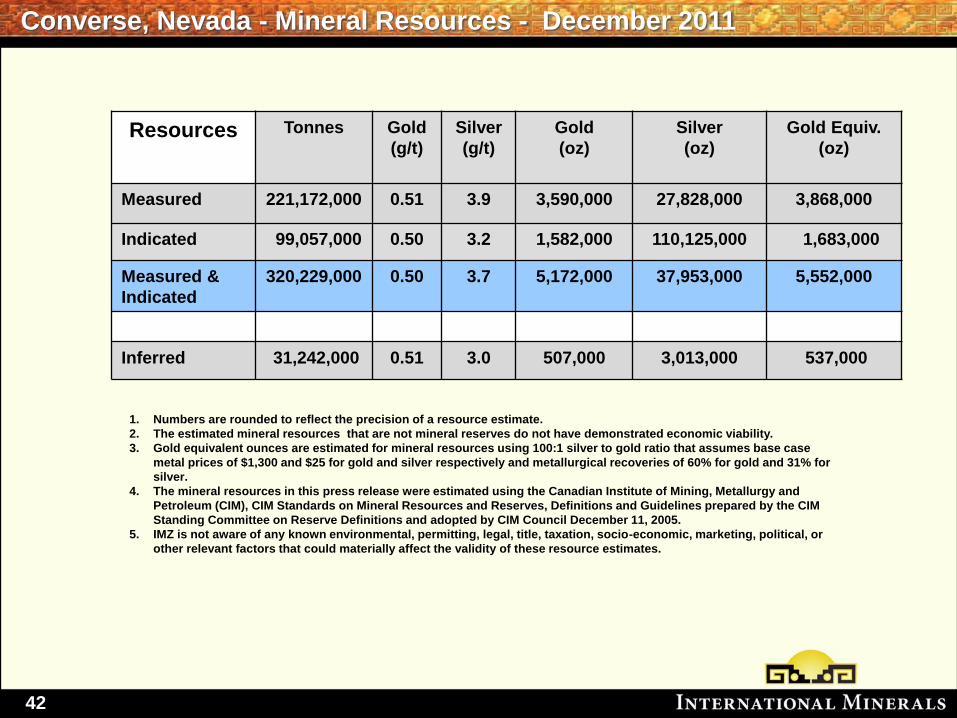
Converse, Nevada - Mineral Resources - December 2011
Resources Tonnes Gold
(g/t)
Silver
(g/t)
Gold
(oz)
Silver
(oz)
Gold Equiv.
(oz)
Measured 221,172,000 0.51 3.9 3,590,000 27,828,000 3,868,000
Indicated 99,057,000 0.50 3.2 1,582,000 110,125,000 1,683,000
Measured &
Indicated
320,229,000 0.50 3.7 5,172,000 37,953,000 5,552,000
Inferred 31,242,000 0.51 3.0 507,000 3,013,000 537,000
1. Numbers are rounded to reflect the precision of a resource estimate.
2. The estimated mineral resources that are not mineral reserves do not have demonstrated economic viability.
3. Gold equivalent ounces are estimated for mineral resources using 100:1 silver to gold ratio that assumes base case
metal prices of $1,300 and $25 for gold and silver respectively and metallurgical recoveries of 60% for gold and 31% for
silver.
4. The mineral resources in this press release were estimated using the Canadian Institute of Mining, Metallurgy and
Petroleum (CIM), CIM Standards on Mineral Resources and Reserves, Definitions and Guidelines prepared by the CIM
Standing Committee on Reserve Definitions and adopted by CIM Council December 11, 2005.
5. IMZ is not aware of any known environmental, permitting, legal, title, taxation, socio-economic, marketing, political, or
other relevant factors that could materially affect the validity of these resource estimates.
43
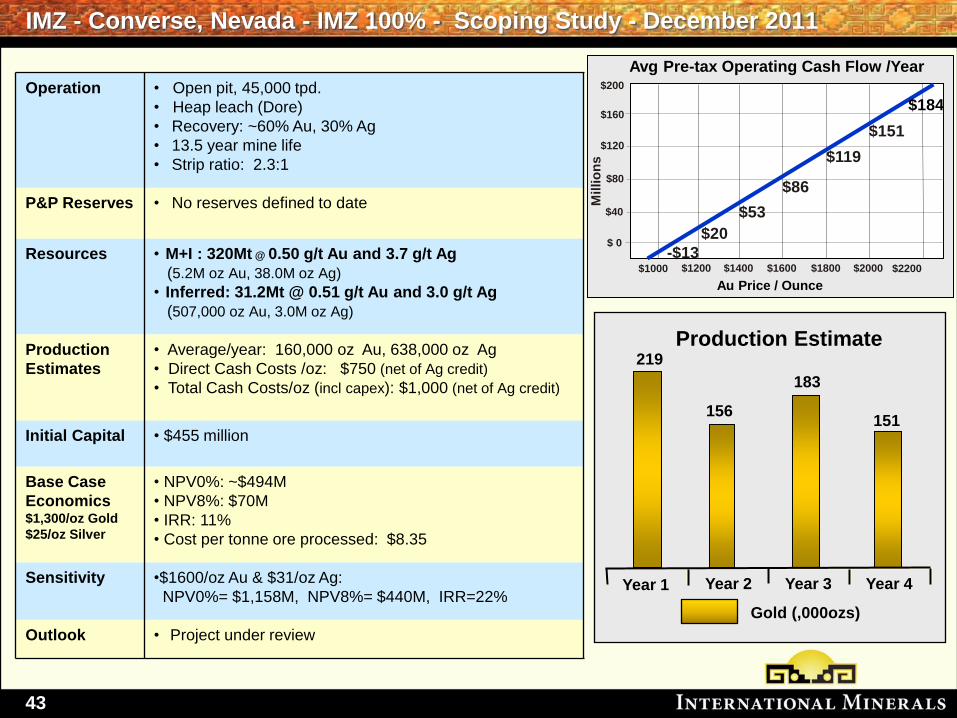
IMZ - Converse, Nevada - IMZ 100% - Scoping Study - December 2011
Operation • Open pit, 45,000 tpd.
• Heap leach (Dore)
• Recovery: ~60% Au, 30% Ag
• 13.5 year mine life
• Strip ratio: 2.3:1
P&P Reserves • No reserves defined to date
Resources • M+I : 320Mt @ 0.50 g/t Au and 3.7 g/t Ag
(5.2M oz Au, 38.0M oz Ag)
• Inferred: 31.2Mt @ 0.51 g/t Au and 3.0 g/t Ag
(507,000 oz Au, 3.0M oz Ag)
Production
Estimates
• Average/year: 160,000 oz Au, 638,000 oz Ag
• Direct Cash Costs /oz: $750 (net of Ag credit)
• Total Cash Costs/oz (incl capex): $1,000 (net of Ag credit)
Initial Capital • $455 million
Base Case
Economics $1,300/oz Gold
$25/oz Silver
• NPV0%: ~$494M
• NPV8%: $70M
• IRR: 11%
• Cost per tonne ore processed: $8.35
Sensitivity •$1600/oz Au & $31/oz Ag:
NPV0%= $1,158M, NPV8%= $440M, IRR=22%
Outlook • Project under review
Production Estimate
219
156
183
151
Avg Pre-tax Operating Cash Flow /Year
Au Price / Ounce
$1000 $1200 $1400 $1600 $1800
Year 1 Year 2 Year 3 Year 4
Gold (,000ozs)
$120
$80
$40
$ 0
Millio
ns
$160
$2000
$151
$119
-$13
$20
$53
$86
$184
$2200
$200
44
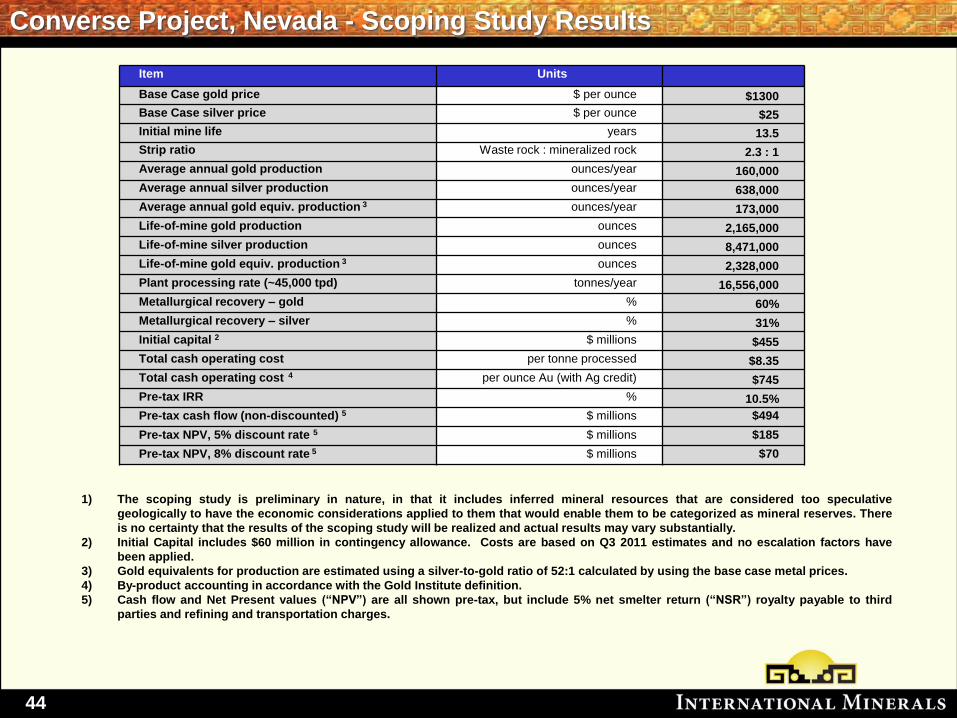
Converse Project, Nevada - Scoping Study Results
Item Units
Base Case gold price $ per ounce $1300
Base Case silver price $ per ounce $25
Initial mine life years 13.5
Strip ratio Waste rock : mineralized rock 2.3 : 1
Average annual gold production ounces/year 160,000
Average annual silver production ounces/year 638,000
Average annual gold equiv. production 3 ounces/year 173,000
Life-of-mine gold production ounces 2,165,000
Life-of-mine silver production ounces 8,471,000
Life-of-mine gold equiv. production 3 ounces 2,328,000
Plant processing rate (~45,000 tpd) tonnes/year 16,556,000
Metallurgical recovery – gold % 60%
Metallurgical recovery – silver % 31%
Initial capital 2 $ millions $455
Total cash operating cost per tonne processed $8.35
Total cash operating cost 4 per ounce Au (with Ag credit) $745
Pre-tax IRR % 10.5%
Pre-tax cash flow (non-discounted) 5 $ millions $494
Pre-tax NPV, 5% discount rate 5 $ millions $185
Pre-tax NPV, 8% discount rate 5 $ millions $70
1) The scoping study is preliminary in nature, in that it includes inferred mineral resources that are considered too speculative
geologically to have the economic considerations applied to them that would enable them to be categorized as mineral reserves. There
is no certainty that the results of the scoping study will be realized and actual results may vary substantially.
2) Initial Capital includes $60 million in contingency allowance. Costs are based on Q3 2011 estimates and no escalation factors have
been applied.
3) Gold equivalents for production are estimated using a silver-to-gold ratio of 52:1 calculated by using the base case metal prices.
4) By-product accounting in accordance with the Gold Institute definition.
5) Cash flow and Net Present values (“NPV”) are all shown pre-tax, but include 5% net smelter return (“NSR”) royalty payable to third
parties and refining and transportation charges.
45
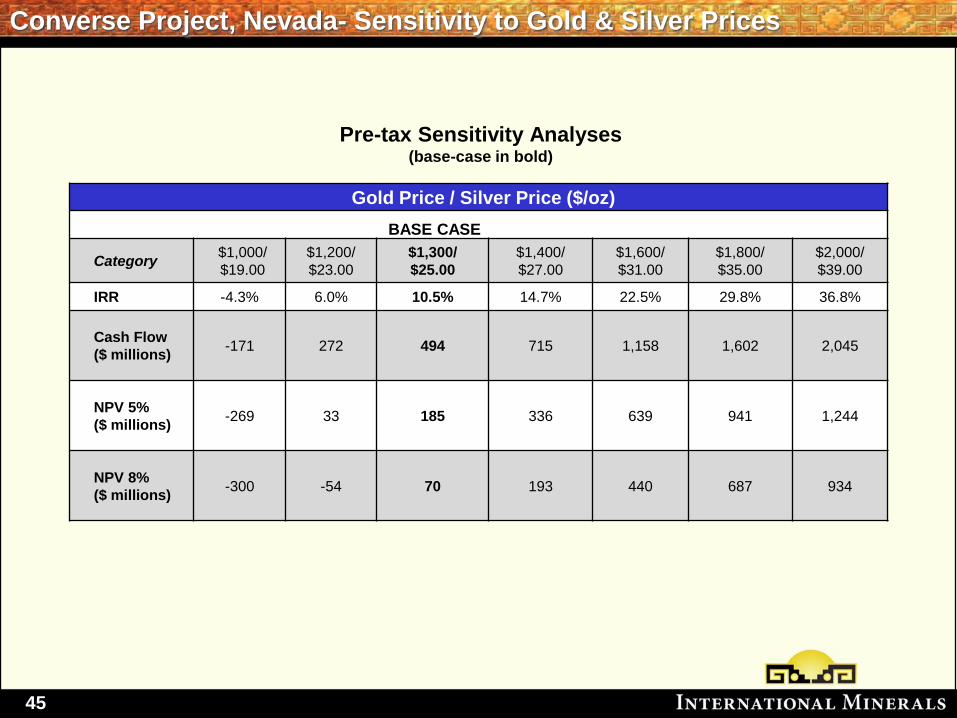
Converse Project, Nevada- Sensitivity to Gold & Silver Prices
Gold Price / Silver Price ($/oz)
BASE CASE
Category $1,000/
$19.00
$1,200/
$23.00
$1,300/
$25.00
$1,400/
$27.00
$1,600/
$31.00
$1,800/
$35.00
$2,000/
$39.00
IRR -4.3% 6.0% 10.5% 14.7% 22.5% 29.8% 36.8%
Cash Flow
($ millions)
-171 272 494 715 1,158 1,602 2,045
NPV 5%
($ millions)
-269 33 185 336 639 941 1,244
NPV 8%
($ millions)
-300 -54 70 193 440 687 934
Pre-tax Sensitivity Analyses (base-case in bold)
46
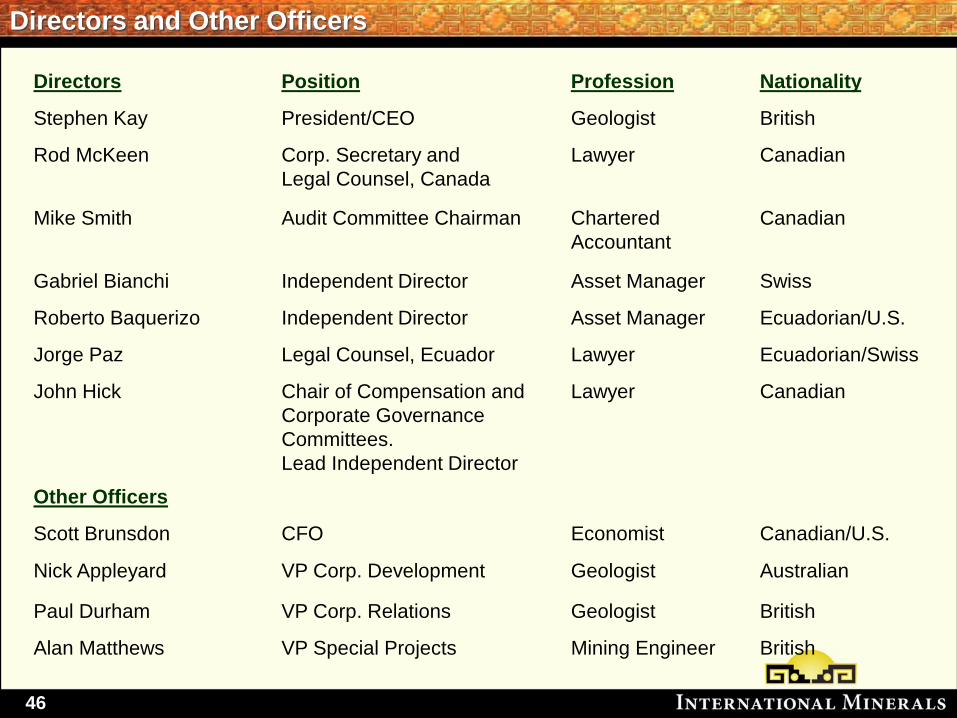
Directors and Other Officers
Directors Position Profession Nationality
Stephen Kay President/CEO Geologist British
Rod McKeen Corp. Secretary and
Legal Counsel, Canada
Lawyer Canadian
Mike Smith Audit Committee Chairman Chartered
Accountant
Canadian
Gabriel Bianchi Independent Director Asset Manager Swiss
Roberto Baquerizo Independent Director Asset Manager Ecuadorian/U.S.
Jorge Paz Legal Counsel, Ecuador Lawyer Ecuadorian/Swiss
John Hick Chair of Compensation and
Corporate Governance
Committees.
Lead Independent Director
Lawyer Canadian
Other Officers
Scott Brunsdon
Nick Appleyard
CFO
VP Corp. Development
Economist
Geologist
Canadian/U.S.
Australian
Paul Durham VP Corp. Relations Geologist British
Alan Matthews VP Special Projects Mining Engineer British


