Int. Journal of Economics and Management 10(1): 109 – 124 (2016) IJEM International Journal of Economics and Management Journal homepage: http://www.econ.upm.edu.my/ijem 109 MUI-YIN CHINª * , CIA-LING TEO b AND CHIN-HONG PUAH c,d ªEconomics and Corporate Administration Department, Faculty of Accountancy, Finance and Business, Tunku Abdul Rahman University College, Jalan Genting Kelang, Kuala Lumpur, Malaysia b Finance Department, Faculty of Accountancy, Finance and Business, Tunku Abdul Rahman University College, Jalan Genting Kelang, Kuala Lumpur, Malaysia c Faculty of Economics and Business, Universiti Malaysia Sarawak d Centre for Business, Economics and Finance Forecasting, Universiti Malaysia Sarawak, Kota Samarahan, Sarawak, Malaysia ABSTRACT International trade contributes significantly to driving Malaysia’s economic growth. As intra-industry trade (IIT) has become increasingly important due to changes in the international trade landscape, this study aims to identify the determinants of IIT and to gauge the trade pattern between Malaysia and Singapore in SITC 7 (the machinery and transport equipment manufacturing sub-sector) from 1980 through 2012 using decomposition- type threshold and Autoregressive Distributed Lag (ARDL) methods. In addition, this study will further decompose IIT into horizontal IIT (HIIT) and vertical IIT (VIIT) to examine the current pattern of IIT. The econometric results reveal that the difference in real gross domestic product (GDP) between the two countries is the key determinant of IIT in both the long run and the short run. Meanwhile, the average of foreign direct investment inflow (FDI) in both countries will stimulate IIT in the short run. Furthermore, the decomposition results confirm that the IIT between the two countries is prone to VIIT. The findings of the empirical results suggest that the policy makers of both countries should leverage the ASEAN Economic Community (AEC) and the Regional Comprehensive Economic Partnership Agreement (RCEP) to enhance their trade ties. Intra-Industry Trade Between Malaysia And Singapore In Sitc 7: An Ardl Bound Test Approach *Corresponding author: Tel: + 60341450123 Email : [email protected]
Transcript
Int. Journal of Economics and Management 10(1): 109 – 124 (2016)
IJEMInternational Journal of Economics and Management
Journal homepage: http://www.econ.upm.edu.my/ijem
109
MUI-YIN CHINª*, CIA-LING TEOb AND CHIN-HONG PUAHc,d
ªEconomics and Corporate Administration Department, Faculty of Accountancy, Finance and Business, Tunku Abdul Rahman University College,
Jalan Genting Kelang, Kuala Lumpur, MalaysiabFinance Department, Faculty of Accountancy, Finance and Business,
Tunku Abdul Rahman University College, Jalan Genting Kelang, Kuala Lumpur, Malaysia
cFaculty of Economics and Business, Universiti Malaysia SarawakdCentre for Business, Economics and Finance Forecasting,
Universiti Malaysia Sarawak, Kota Samarahan, Sarawak, Malaysia
ABSTRACT
International trade contributes significantly to driving Malaysia’s economic growth. As intra-industry trade (IIT) has become increasingly important due to changes in the international trade landscape, this study aims to identify the determinants of IIT and to gauge the trade pattern between Malaysia and Singapore in SITC 7 (the machinery and transport equipment manufacturing sub-sector) from 1980 through 2012 using decomposition-type threshold and Autoregressive Distributed Lag (ARDL) methods. In addition, this study will further decompose IIT into horizontal IIT (HIIT) and vertical IIT (VIIT) to examine the current pattern of IIT. The econometric results reveal that the difference in real gross domestic product (GDP) between the two countries is the key determinant of IIT in both the long run and the short run. Meanwhile, the average of foreign direct investment inflow (FDI) in both countries will stimulate IIT in the short run. Furthermore, the decomposition results confirm that the IIT between the two countries is prone to VIIT. The findings of the empirical results suggest that the policy makers of both countries should leverage the ASEAN Economic Community (AEC) and the Regional Comprehensive Economic Partnership Agreement (RCEP) to enhance their trade ties.
Intra-Industry Trade Between Malaysia And Singapore In Sitc 7: An Ardl Bound Test Approach
Int. Journal of Economics and Management 10(1): 109 – 124 (2016)
110
INTRODUCTION
Malaysia has engaged aggressively in trade with various countries. The trade liberalisation efforts have continued through involvement in key free trade negotiations such as the Trans-Pacific Partnership Agreement (TPPA) and the Regional Comprehensive Economic Partnership Agreement (RCEP). In addition, the market dependency ratio of Malaysia, which is measured by the share of total trade in gross domestic product (GDP), was consistently above 150% throughout the period from 2000 through 2013 (World Development Indicator, 2014). Furthermore, Malaysia was the world’s 24th and 26th leading exporter and importer, respectively, in 2013 (World Bank Indicator, 2014).Thus, it is apparent that international trade serves as the main economy driver for Malaysia.
Based on the Malaysia’s Ministry of Trade and Industry (MITI) report (2014), the trade performance of Malaysia remained resilient in 2013 with 4.6% growth in total trade compared to a year earlier. In this, total exports and total imports registered growth of 2.4% and 7.0%, respectively. Despite the increasing rate of imports, Malaysia still managed to maintain its trade surplus position for 16 consecutive years after 1998. The most significant contributor to the steady growth rate was manufactured products, where electric and electronics products emerged as the top export and import products, contributing 41.2% and 34.2% of Malaysia’s total exports and total imports, respectively, in 2014 (MITI, 2015). Meanwhile, Singapore remained the largest exporting partner of Malaysia in 2015(MITI, 2015). To fuel its trade growth in the manufacturing sectors, Malaysia highly depends on the import of capital goods from its main trading partners, including Singapore (Muhammed, 2009).
Owing to the rapid globalisation of production processes, which involved the reallocation of production activities in more than one country, the international trade pattern has changed. Intra-industry trade (IIT) has become increasing important and numerous studies have focussed on IIT(Łapińska, 2014; Botrić, 2013; Jambol and Ismail, 2013;Ma and Li, 2013; Chin, Yong, and Yew, 2013; Sawyer, Sprinkle and Tochkov, 2010; Brulhart, 2008; Athukorala and Yamashita, 2006; Soh and Zhang, 2006; Cortinhas, 2005 Thorpe and Zhang, 2005; Xing, 2007; Hu and Ma, 1999; Kimura and Ando, 2005; Azhar, Elliot, and Liu, 2008; Ito and Okubo, 2011; Turkcan and Ates, 2011; Tsiapa, 2011 and Arip, Lau, and Satoru, 2011;). Most of the above-mentioned studies focussed on the manufacturing sectors because manufactured products exhibit the characteristics of product differentiation and are involved in the globalisation of production processes (Menon, 1996). In fact, the manufacturing sectors of Malaysia have been gradually moving to IIT to buoy the country’s competitiveness in the global economy. Note that from 1980 to 2000, the IIT of manufactured products in Malaysia doubled, moving from 30% to 60% (Devadeson, 2004) while the Grubel-Lloyd (GL) index of Malaysia’s manufacturing sectors rose from 0.27 in 1990 to 0.51 in 2007 (Jambol and Ismail, 2013).
Int. Journal of Economics and Management 10(1): 109 – 124 (2016)
111
In light of the importance of IIT, there are numerous studies focusing on IIT in Malaysia. However, these studies are mainly analysing the IIT relationship within ASEAN countries (see Salim, Islam and Bloch 2015; Cortinhas, 2007; Ito and Umemoto, 2004; Hurley, 2003 and Menon, 1996) or between ASEAN countries and their main trading partners (seeChin, Yong and Yew, 2013; Jha and Saha, 2011; Sheng, Tang and Xu, 2012; Holst and Weiss, 2004), the comprehensive study on bilateral IIT between Malaysia and Singapore is lacking. As such, this study aims to contribute to current literature on Malaysia’s IIT by analysing the determinants of IIT in SITC 7 (the machinery and transport equipment manufacturing sub-sector) between Malaysia and Singapore from 1980 through 2012 using decomposition-type threshold and Autoregressive Distributed Lag (ARDL) methods. In addition, the IIT indices will be further decomposed into horizontal IIT (HIIT1) and vertical IIT (VIIT2) to gauge the current pattern of IIT between Malaysia and Singapore. SITC 7 is selected in this study because this sector encompasses most electric and electronics products. The outcome of this study will provide implications for the policy makers of Malaysia and Singapore to further enhance their trade ties. This paper is organised as follows: Section 2 presents the analysis of bilateral trade between Malaysia and Singapore; Section 3 describes the methodology adopted in this study; Section 4 discusses the empirical results and Section 5 concludes the paper.
BILATERAL TRADE BETWEEN MALAYSIA AND SINGAPORE
The economic integration between Malaysia and Singapore has been radically intensified in the post-independence era. Based on Yeung (1997), the promotion of the ‘Growth Triangle’, which consists of Malaysia, Singapore and Indonesia, has further enhanced the relationship between Malaysia and Singapore. Yeung (1997) also noted that Malaysia plays a vital role in supporting the industrial restructuring process of Singapore.
Singapore emerged as the largest exporting partner of Malaysia in 2013, contributing to the country’s RM100.4billion in total export value. In addition, Singapore also emerged as the largest trading partner of Malaysia in the context of intra-Association of Southeast Asian Nations (ASEAN) trade with a total trade value of RM180.67 billion (MITI, 2014). Figure 1 and Figure 2 show the composition of exports and imports of Malaysia’s bilateral trade with Singapore from 2000 through 2012.
Based on Figure 1, one can see that the export volume was mainly contributed by the manufacturing sector in 2000-2012, with an average of 77.5%. In addition, SITC 7 served as the most important sector in that it contributed the largest share throughout the period under study. The share of SITC 7 in total exports of Malaysia to Singapore was consistently above 40% from 2000 through 2011 before it plummeted to 30.7% in 2012. However, SITC 7 exhibited a declining trend throughout the study period. For instance, the share of SITC 7’s export value decreased from 73.14% in 2000 to 62.9% in 2004. Thereafter, it further decreased to 39.7% in 2012 from 59% in 2004. 1 Based on the Organisation for Economic Co-Operation and Development (OECD) Glossary of Statistics (2007), HIIT refers to trade in similar products with differentiated varieties. 2 Based on the OECD Glossary of Statistics (2007), VIIT refers to trade in ‘vertically differentiated’ products within similar industry distinguished by quality and price.
Int. Journal of Economics and Management 10(1): 109 – 124 (2016)
112
Figure 1 The exports composition of Malaysia’s bilateral trade with Singapore during 2000-2012
Figure 2 The imports composition of Malaysia’s bilateral trade with Singapore during 2000-2012
Sources: 1. Authors’ calculation based on data collected from COMTRADE, various years.2. SITC 0- Food and live animals, SITC1- Beverage and tobacco, SITC2- Crude materials, inedible, except fuels,
SITC3-Mineral fuels, lubricants and related materials, SITC4-Animal and vegetable oils, fats and waxes, SITC5- Chemicals and related products, n.e.s., SITC 6-Manufactured goods classified chiefly by material, SITC7-Machinery and transport equipment, SITC 8-Miscellaneous manufactured articles and SITC9-Commodities and transactions not classified elsewhere in the SITC.
3. SITC 0-4 is defined as primary goods sectors and SITC 5-8 are defined as manufacturing sectors
Source: Same as Figure 1
Int. Journal of Economics and Management 10(1): 109 – 124 (2016)
113
From Figure 2, one can see that the manufacturing sector also contributed the largest share to the imports from Singapore to Malaysia. On average, the manufacturing sector’s share was 69.8% from2000 through 2012, which was slightly lower than the export share. Nevertheless, SITC 7 remained the top contributor to the total imports of Malaysia except for 2008 and 2012. However, the share of import value for SITC 7 also exhibited a decreasing trend, which was in tandem with the trend in export value. From Figure 2, one can see that the import shares of SITC 7 products dropped from 61.3% in 2000 to 42.91% in 2007. Due to the global economic crisis, the import shares of SITC 7 reduced drastically to 29.5% in 2008. Import shares then rose to 45.5% in 2009. Since then, import shares have declined continuously to 45.8%, 41.5% and 36.5% in 2010, 2011 and 2012, respectively.
Based on both Figure 1 and Figure 2, SITC 7 plays a significant role in the burgeoning of the bilateral trade between Malaysia and Singapore. Also, the bilateral trade in SITC 7 is prone to IIT because SITC 7 is the main contributor to both export and import value. In addition, its export and import shares largely converge. However, in light of its decreasing share in both export and import values, it is desirable to identify the determinants that strengthen the bilateral trade in SITC 7 between Malaysia and Singapore so as to sustain the trade growth for both countries.
METHODOLOGY
Decomposition-type threshold method
This study adopted the decomposition-type threshold method, which was developed by Fontagne and Freudenberg (1997) to identify IIT products and to compute various types of IIT indices. The sum of trade value of the identified IIT products will serve as the dependent variable in the econometric model. Furthermore, the IIT will be further decomposed into HIIT and VIIT in the form of indices to gauge the pattern of IIT in SITC 7 between Malaysia and Singapore throughout the period of study.
Based on the decomposition-type threshold method, the extent of trade overlap in each product of SITC 7 will first be identified between Malaysia and Singapore. The formula applied to identify the extent of trade overlap in each product is as follows:
Min (Xkt,Mkt)
Max(Xktt,Mkt)
where, Xkt = The exports of product K of SITC 7 from Malaysia to Singapore, at period t. Mkt = The imports of product K of SITC 7 from Singapore to Malaysia, at period t.
Based on Equation (1), the trade of the product is considered intra-industry if the equation above holds. Otherwise, it will be classified as inter-industry. This is because the significant concurrent exports and imports are proven if the smaller value (either exports or imports) of the product is at least 10% or more of its larger value (either exports or imports).
(1)
Int. Journal of Economics and Management 10(1): 109 – 124 (2016)
114
To gauge the pattern of IIT, it will be further decomposed into HIIT and VIIT. Since VIIT involves a substantial gap between the unit values of exports and imports (Fontagne and Freudenberg, 1997; Ito and Okubo, 2011) for HIIT, the unit values of exports and imports for each IIT product in SITC 7 will be computed by dividing trade value by the trade quantity. In the following equations, a disperiosn factor of 25% is used to decompose IIT products into VIIT and HIIT :
UVx ktUVm kt
UVX ktUVM kt
where,UVXkt = Unit value of product K of SITC 7, exported from Malaysia to Singapore, at time t.UVMkt = Unit value of product K of SITC 7, imported from Singapore to Malaysia, at time t.
The intra-industry trade of the product K is considered VIIT if equation (2a) or (2b) holds and otherwise HIIT. However, information on trade quantity is unavailable for some products. Since the unit prices are vital in differentiating among types of intra-industry trade, it is impossible to determine whether intra-industry trade of such products is classified under HIIT or VIIT. Thus, these products will be classified as unidentified IIT products (Ando, 2006).
Thereafter, the aggregate of IIT value between Malaysia and Singapore in SITC 7 can be calculated for each year from 1980 through 2012. Meanwhile, the IIT, HIIT, VIIT and the unidentified IIT indices can be derived by adding the trade value of IIT, HIIT, VIIT and unidentified IIT products, respectively, and dividing them by the total trade value. The HIIT, VIIT and identified IIT indices will be calculated from 2001 onwards, which reflects the current pattern of IIT so as to draw implications for policy makers. The formula to compute aggregate IIT, HIIT, VIIT and unidentified IIT indices for each year is as follows:
(3)
whereSi refers to IIT, HIIT, VIIT or unidentified IIT index andr refers to total trade.
Autoregressive distributed lag method
The ordinary least squares (OLS)-based ARDL approach will be employed to identify the determinants of IIT between Malaysia and Singapore. ARDL modelling is appropriate in this study as it is suitable for a small sample size (Pesaran and Shin, 1999; Pesaran et al., 2001) and it can produce unbiased results for the data with a mixture of I(0) and I(1). ARDL approach is applicable regardless of whether the regressors are trend or first-difference stationary as it able
>1.25 (2a)
<1/1.25 (2b)
Int. Journal of Economics and Management 10(1): 109 – 124 (2016)
115
to avoid the problems posed by non-stationary data (Sarmidi and Salleh, 2011).In addition, a dynamic error correction model (ECM) can be derived from the ARDL method via a simple linear transformation (Banerjee et al., 1993). According to Shrestha and Chowdhury (2005), the ECM integrates the short-run dynamics with the long-run equilibrium without losing long-run information.
The unrestricted ECM model is first formulated as follows:
C = Constantβ = CoefficientIIT = IIT value between Malaysia and SingaporeDGDP = Difference in GDP between Malaysia and SingaporeAVERFDI = Average of foreign direct investment inflow in Malaysia and SingaporeP = Optimum lag lengthεt = Residual
All the variables in the model above are in real and logarithm terms. IIT serves as the dependent variable while DGDP and AVERFDI serve as the independent variables. They are selected based on past empirical studies. The model will be examined using bounds test to determine the lag structure. After selecting the optimum lag, serial correlation and stability tests using the Breusch-Godfrey lagrange Multiplier (LM) test and Cumulative sum of Recursive Residual (CUSUM) test will be performed to confirm the appropriateness of the ARDL model before moving forward to the long-run joint hypothesis by comparing the outcome with Narayan’s (2005) critical value. The long-run cointegration model for ARDL is formulated as follows:
ІІТ = С + β1DGDPt + β2AVERFDIt (5)
If long-run cointegration exists, the long-run coefficients can be estimated based on the equation (5). Thereafter, the short-run coefficient can be estimated based on the model below:
ΔІІТ = С + ∑pᵢ=1 α1iΔІІt-1 + ∑p
ᵢ=0 α21∆DGPt-1 + β3AVERFDIt-1 + ØECTt-1 + εt (6)
Expected results
Based on production fragmentation theory, the difference in GDP (DGDP) proxies differences in market size. The differences in market size imply differences in factor endowments between the two countries. Thus, DGDP is expected to be positive to complement the two countries. In addition, Singapore and Malaysia are actively involved in attracting foreign direct investment
Int. Journal of Economics and Management 10(1): 109 – 124 (2016)
116
(FDI) (Wong, Tang, and Fausten, 2009) and ranked second and third, respectively, in attracting FDI in East Asia (Sharma, Nayagam, and Chung, 2012). Therefore, FDI in both countries plays an important role in determining the IIT. The coefficient of AVERFDI is expected to be positive if the motive of FDI in both countries is efficiency seeking and the IIT is involved in processing trade (Xing, 2007; Thorbecke and Smith, 2010; Sawyer, 2010). On the other hand, if the motive for FDI is market seeking, the coefficient will be negative, which reflects a trade-off between IIT and FDI (Hurley, 2003).
Definition and source of data
The trade data for the computation of both IIT and VIIT indices are derived from Standard International Trade Classification 7, Revision 2 and Revision 3 with 4-digit code, UN COMTRADE Database. A total of 220 types of SITC 7 products are under study. Meanwhile, data for GDP and FDI were collected from the World Bank’s World Development Indicators. The said data are annual statistics from 1980 through 2012.
EMPIRICAL RESULTS
Table 1 shows the IIT indices between Malaysia and Singapore in SITC 7 from 1980 through 2012.
Table 1 confirms that the bilateral trade between Malaysia and Singapore is prone to IIT as the average IIT index between Malaysia and Singapore is 0.892 for 1980-2012. Thus, IIT contributed an average of 89.2% of the trade value between these countries during the study period. Furthermore, this study also found that the IIT between Malaysia and Singapore became more extensive in the 2000s as the average IIT index in the 1980s and 1990s was 0.877, but it rose to 0.916 in the 2000s. This result is consistent with Fukao, Ishito and Ito (2003) as they noted that IIT in Malaysia and Singapore are higher than in some developed countries, including
Int. Journal of Economics and Management 10(1): 109 – 124 (2016)
117
Korea and Japan. Since IIT plays the dominant role in the most important manufacturing sub-sector between Malaysia and Singapore, it is vital to identify the econometric determinants to strengthen the IIT between Malaysia and Singapore in SITC 7.
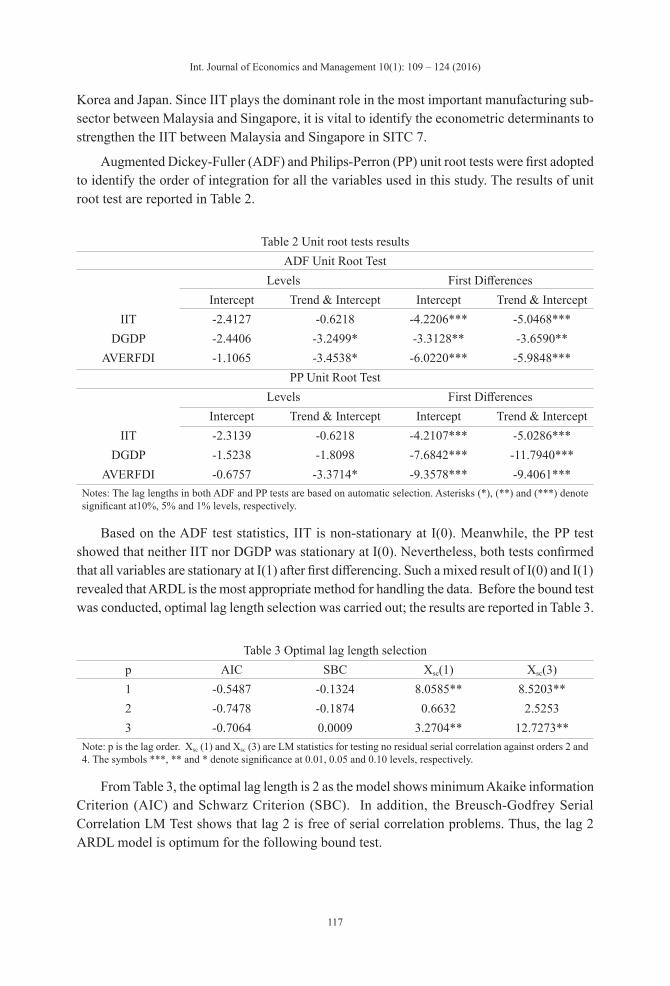
Augmented Dickey-Fuller (ADF) and Philips-Perron (PP) unit root tests were first adopted to identify the order of integration for all the variables used in this study. The results of unit root test are reported in Table 2.
Table 2 Unit root tests resultsADF Unit Root Test
Levels First DifferencesIntercept Trend & Intercept Intercept Trend & Intercept
AVERFDI -0.6757 -3.3714* -9.3578*** -9.4061***Notes: The lag lengths in both ADF and PP tests are based on automatic selection. Asterisks (*), (**) and (***) denote significant at10%, 5% and 1% levels, respectively.
Based on the ADF test statistics, IIT is non-stationary at I(0). Meanwhile, the PP test showed that neither IIT nor DGDP was stationary at I(0). Nevertheless, both tests confirmed that all variables are stationary at I(1) after first differencing. Such a mixed result of I(0) and I(1) revealed that ARDL is the most appropriate method for handling the data. Before the bound test was conducted, optimal lag length selection was carried out; the results are reported in Table 3.
Note: p is the lag order. Xsc (1) and Xsc (3) are LM statistics for testing no residual serial correlation against orders 2 and 4. The symbols ***, ** and * denote significance at 0.01, 0.05 and 0.10 levels, respectively.
From Table 3, the optimal lag length is 2 as the model shows minimum Akaike information Criterion (AIC) and Schwarz Criterion (SBC). In addition, the Breusch-Godfrey Serial Correlation LM Test shows that lag 2 is free of serial correlation problems. Thus, the lag 2 ARDL model is optimum for the following bound test.
Int. Journal of Economics and Management 10(1): 109 – 124 (2016)
118
Table 4 Bounds test for long-run cointegration analysisModel F-statistics
Model 1: riit=f(drgdp, averfdi) 6.1729**Nayaran (2005) K=2, n= 32 (refer to 30)Critical value Lower bound Upper bound
1% 5.155 6.2655% 3.538 4.428
Notes: **, and *** denote significant at 5%, and 1% levels, respectively. Critical values are obtained from Narayan (2005).
In Table 4, one can see that the F-statistic is larger than the critical upper bound value at a 5% significance level. Hence, there is a long-run cointegration relationship between real IIT value and its determinants (difference in real GDP and average of real FDI). Therefore, the general to specific approach has been used to select the optimum lag to estimate the long-run level model. Based on this method, the best model is ARDL (1, 1, and 0). To enhance the reliability of interpretation, the ARDL (1, 1, and 0) model will be subjected to serial correlation and stability tests before it is used to estimate the long-run and short-run coefficient.
Table 5 Breusch-godfrey serial correlation lm testAutocorrelation (AR) Observed R-squared
AR (1) 0.3272 (0.5722)AR(3) 0.6155 (0.6117)
Note: AR (i) for i =1 and 3, where i refers to lag. P-value is reported in parentheses.
Figure 3 The results of stability tests
The result from Table 5 and Figure 3 confirmed that the model is free of diagnostic problems and is reliable to estimate both long-run and short-run coefficients. The results for long-run coefficient are shown in Table 6.
Int. Journal of Economics and Management 10(1): 109 – 124 (2016)
119
Table 6 Estimated long run coefficient using the ARDL approach
ARDL (1,1,0) selected based on general to specific top down approach
Note: *, ** and *** denote significant at 10%, 5% and 1% respectively.
Consistent with the theoretical expectations, the results show that the difference in real GDP between Malaysia and Singapore plays a prominent role in determining the IIT in SITC 7 in the long run (see Table 6). The estimated coefficient is 0.6748, implying that a 1% increase in the difference in real GDP between the two countries will result in a 0.6748% increase in IIT. According to Turkcan (2010) and Turkcan and Ates (2011), the difference in GDP has a positive and significant impact on VIIT. Therefore, this suggests that the IIT between Malaysia and Singapore is prone to VIIT whereby the difference in GDP, which proxies the difference in factor endowment, will facilitate the growth of IIT between the two countries. Likewise, Pittiglio (2012) also noted that difference in factor endowment is one of the influential determinants of VIIT.
However, contrary to the theoretical expectations, the result shows that the average of FDI inflow in both countries is insignificant in the long-run. This result is consistent with Xing (2007) and Chin, Yong and Yew (2015), who respectively reported that FDI is insignificant in IIT between China and the United States as well as in VIIT between ASEAN 5 and China in SITC 8 (miscellaneous manufacturing sector). According to Athukorala and Yamashita (2005), multinational enterprise (MNE) subsidiaries which based in the host-country would subcontract some processing activities to local firms once the production operation in host countries well established. The authors also noted that many MNEs in electronics and related industries also relied on independent contract manufacturers for the global production networks. As such, Brown et al. (2004) cited by Athukorala and Yamashita (2005) argued that these new developments suggest that FDI inflow may not necessary play an important role in processing trade.
To estimate the short-run coefficients, the ARDL model is transformed into a short-run error correction term (ECT) dynamic model. The results of the coefficients are shown in Table 7.
Note: *, ** and *** denote significant at 10%, 5% and 1% respectively.
Int. Journal of Economics and Management 10(1): 109 – 124 (2016)
120
The coefficient of the error-correction term, ECT (-1), is negative and very significant (see Table 7). The magnitude of this coefficient implies that about 20% of any disequilibrium between the dependent and independent variables is corrected within one year. Consistent with the long-run estimation, the difference in real GDP between Malaysia and Singapore is also positive and significant in the short run. This signifies the importance of differences in factor endowment in determining the IIT in SITC 7.
Interestingly, the coefficient for average FDI inflow is positive and very significant in the short run, which is in line with the theoretical expectations. In addition, Tsiapa (2011) and Kang and Lee (2012) pointed out that FDI inflow is positively related with VIIT. Hence, the result suggests that the motive of FDI is efficiency seeking in nature and is involved in production fragmentation via VIIT. Since the estimated results for the short run are contradictory to the result of the long run, FDI is vital in the short run when the production network is newly set up. However, once the production fragmentation process has entered the maturity stage, the inflow of FDI in both countries is no longer required to stimulate the IIT.
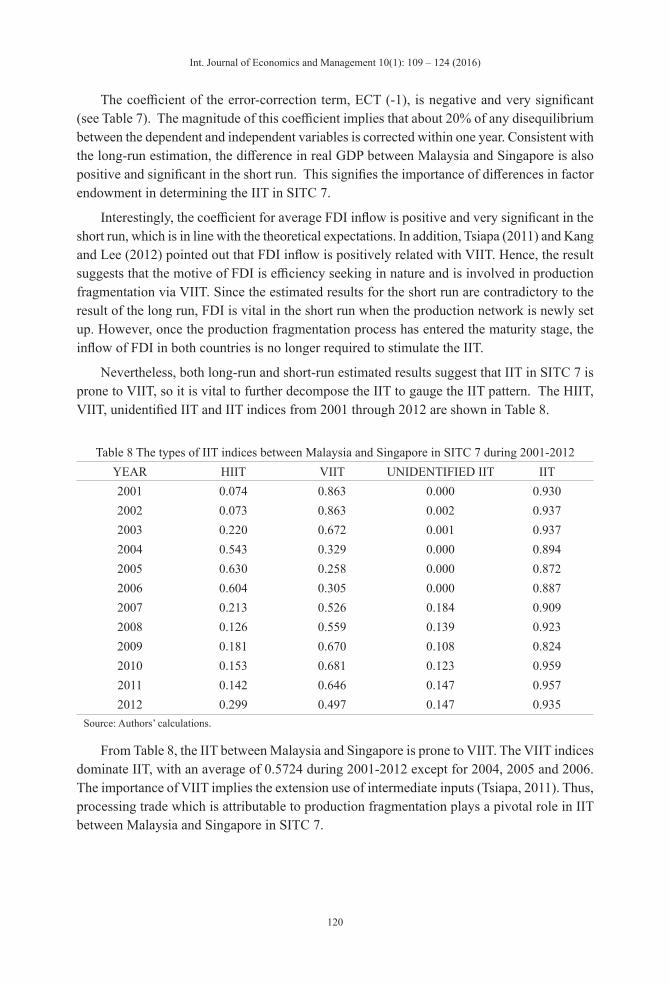
Nevertheless, both long-run and short-run estimated results suggest that IIT in SITC 7 is prone to VIIT, so it is vital to further decompose the IIT to gauge the IIT pattern. The HIIT, VIIT, unidentified IIT and IIT indices from 2001 through 2012 are shown in Table 8.
Table 8 The types of IIT indices between Malaysia and Singapore in SITC 7 during 2001-2012YEAR HIIT VIIT UNIDENTIFIED IIT IIT2001 0.074 0.863 0.000 0.9302002 0.073 0.863 0.002 0.9372003 0.220 0.672 0.001 0.9372004 0.543 0.329 0.000 0.8942005 0.630 0.258 0.000 0.8722006 0.604 0.305 0.000 0.8872007 0.213 0.526 0.184 0.9092008 0.126 0.559 0.139 0.9232009 0.181 0.670 0.108 0.8242010 0.153 0.681 0.123 0.9592011 0.142 0.646 0.147 0.9572012 0.299 0.497 0.147 0.935
Source: Authors’ calculations.
From Table 8, the IIT between Malaysia and Singapore is prone to VIIT. The VIIT indices dominate IIT, with an average of 0.5724 during 2001-2012 except for 2004, 2005 and 2006. The importance of VIIT implies the extension use of intermediate inputs (Tsiapa, 2011). Thus, processing trade which is attributable to production fragmentation plays a pivotal role in IIT between Malaysia and Singapore in SITC 7.
Int. Journal of Economics and Management 10(1): 109 – 124 (2016)
121
CONCLUSION
Owing to changes in the international trade pattern with IIT becoming increasing important, this study aims to identify both the long-run and short-run determinants of IIT between Malaysia and Singapore in SITC 7In addition, this study also further decomposes IIT into HIIT and VIIT to gauge the pattern of trade. The outcome of study is vital for policy makers as electric and electronics products contribute the largest trade value to Malaysia’s total trade (MITI, 2015). Meanwhile, Singapore remains her status as the top export partner of Malaysia in 2015 (MITI, 2015).
The empirical results suggest that the difference in real GDP, which implies the difference in factor endowment, is instrumental in determining IIT in both the long run and the short run. As such, the policy makers of both countries should further enhance their cooperation plan by identifying their respective niche areas and unique factor endowment. Since both Malaysia and Singapore are the prominent members of ASEAN, the policy makers should leverage on the establishment of ASEAN Economic Community (AEC and RCEP. AEC could further accelerate the trade ties between the two countries as AEC enhances easier movement of goods, services as well as investment and therefore offer new opportunities for regional cooperation and news ways of coordinating supply chains among members (MIDA Newsletter December 2015). Meanwhile, RCEP, which is expected to conclude in 2016 will serve as a new platform for both Malaysia and Singapore to deepen their integration into the world economy (MITI Weekly Bulletin, 2015).
Nevertheless, both Malaysia and Singapore are the only two ASEAN countries featured in the top ten of attractive destinations for foreign investors in 2015 (MIDA Newsletter September 2015). The policy makers of these countries should continue to promote FDI inflow actively as it can stimulate IIT in the short run. However, neither country can become overly dependent on the inflow of FDI as it is not significant in accelerating IIT in the long run. Therefore, the two countries are urged to gain in technology transfer to avoid any potential negative impacts from FDI in the long run.
Furthermore, the results signify that IIT in SITC 7 between Malaysia and Singapore is prone to VIIT. This suggests that the IIT between the two countries is mainly contributed by production fragmentation. Likewise, Cheewatrakoolpong, Sabhasri and Bunditwattanawongh (2013) also noted that the increase in intra-regional trade in ASEAN, particularly in parts and components trade, is mainly driven by the establishment of international production networks. Hence, Malaysia should further improve the facilities and infrastructures within its borders to reduce the services link cost As Jones (2000) and Jones and Kierzkowski (1990), cited by Athukorala and Yamashita (2006), pointed out, production fragmentation can be stimulated if the services link costs are reduced between the trading partners.
Int. Journal of Economics and Management 10(1): 109 – 124 (2016)
122
ACKNOWLEDGEMENT
Financial supports from Tunku Abdul Rahman University College (TARUC) and Centre for Business, Economics and Finance Forecasting (BEFfore) in Universiti Malaysia Sarawak (UNIMAS) via top-down research grant: 03(TD04)/1054/2013(02) are gratefully acknowledged.
REFERENCES
Athukorala, P.C. and Yamashita, N (2005, Dec) Patterns and Determinants of Production Fragmentation in World Manufacturing Trade. Paper Presented at the Conference on Globalisation and Regionalism in Australian National University and the European Central Bank, Sydney, Australia.
Abdul Azhar, Elliott, R.J.F. and Liu, J. (2008) ‘On the measurement of product quality in intra-industry trade: An empirical test for China’, China Economic Review, Vol. 19, No. 2, pp.336-344.
Ando, M. (2006) ‘Fragmentation and vertical intra-industry trade in East Asia’, North American Journal of Economics and Finance, Vol. 17, pp.257-281.
Arip, M. A., Lau S.Y. and Satoru, M. (2011) ‘An analysis of intra-industry trade between Japan, Malaysia and China’, International Journal of Economics and Institutions, Vol. 3, No. 1, pp.1-30.
Athukorala, P.C. and Yamashita, N. (2006) ‘Production fragmentation and trade integration: East Asia in a global context’, North American Journal of Economics and Finance, doi:10.1016/j.najef.2006.07.002.
Banerjee A, Dolado J, Galbraith J, and Hendry D. (1993) Co-integration, Error Correction, and the Econometric Analysis of Non-stationary Data, Oxford University Press, Oxford.
Botrić, V. (2013) ‘Determinants of intra-industry trade between Western Balkans and EU-15: Evidence from bilateral data’, International Journal of Economic Sciences and Applied Research, Vol. 6, No.2, pp. 7-23.
Cheewatrakoolpong, K., Sabhasri, C., Bunditwattanawong, N. (2013) Impact of the ASEAN Economic Community on ASEAN production networks, ADBI Working Paper Series, No. 409.
Chin, M.Y., Yong, C.C., and Yew, S.Y. (2015) ‘The determinants of vertical intra-industry trade in SITC 8: The case of ASEAN-5 and China’. The Journal of Developing Areas, Vol. 49, No.4, pp.271-283.
Chin, M.Y., Yong, C.C., and Yew, S.Y. (2013) ‘Vertical intra-industry trade between ASEAN-5 and China in SITC 8’, Labuan Bulletin of International Business and Finance, Vol. 11, pp.30-45.
Cortinhas, C. (2007) ‘Intra-industry trade and business cycles in ASEAN’, Applied Economics, Vol. 39, pp.893–902.
Fontagne, L. and Freudenberg, M. (1997) Intra-industry trade: Methodological issues reconsidered, CEPII Working Paper 97/02. Centre d’EtudesProspectivesetd’InformationsInternationales, Paris.
Fukao, K., Ishido, H. and Ito, K. (2003) Vertical intra-industry trade and foreign direct investment in East Asia, The Institute of Economic Research, Hitotsubashi University, Kunitachi, Tokyo, Discussion Paper Series A No.434.
Holst, D.R. and Weiss, J. (2004). ‘ASEAN and China: Export Rivals or Partners in Regional Growth?’, The world Economy, Vol. 27, No.8, pp.1255-1274.
Int. Journal of Economics and Management 10(1): 109 – 124 (2016)
123
Hu, X. and Ma, Y. (1999) ‘International intra-industry trade of China’, WelwirtchaftilichesArchiv, Vol. 135, pp. 82-101.
Hurley, D.T. (2003) ‘Horizontal and vertical intra-industry trade: The case of ASEAN trade in manufactures’, International Economic Journal, Vol. 17, No. 4, pp.1-14.
Ito, T. and Okubo, T. (2011) New aspects of intra-industry trade: Evidence from EU-15 countries, Discussion Paper Series RIEB, Kobe University.
Ito, K. and Umemoto, M. (2004) Intra-Industry Trade in the ASEAN Region: The Case of the Automotive Industry, Faculty of Economics, Senshu University, ICSEAD ASEAN-Auto Project No.04-8, Working Paper Series Vol. 2004-23.
Jha, A. K. and saha, S. (2011) ‘Intra-Industry Trade inAsean-5: An Overall and Country-Specific Study’, Journal of International Economics, Vol. 2, No. 2, pp. 17-24.
Kang, M. and Lee, JD. (2012) ‘Vertical intra-industry trade and product quality: the case of South Korea, 1996-2003’, Economics and Business Letters, Vol. 1, No.3, pp.37-47.
Kimura, F. and Ando, M. (2005) ‘Two-dimensional fragmentation in East Asia: Conceptual framework and empirics’, International Review of Economics and Finance, Vol. 14, pp.417-348.
Łapińska, J. (2014) ‘Determinants of intra-industry trade in agricultural and food products between Poland and EU countries’, Law and Economics Review, Vol. 5, No. 3,pp. 159–172.
Ma, Y. and Li, H. (2013) ‘Vertical specialisation and the growth of China’s exporting manufacturing industries: an empirical analysis based on the data from 1992 to 2009’. Int. J. economic Policy in Emerging Economies, Vol 6, No. 4, pp. 341-357.
Menon, J. (1996) Intra-industry trade and the ASEAN free trade area, Pacific Economic Papers, No. 251, Australia-Japan Research Centre.
MIDA Newsletter December (2015). AEC and Malaysia, Malaysian Investment Development Authority (MIDA), viewed on December 2015, http://www.mida.gov.my/env3/uploads/EnewsletterPDF/2015/December2015.pdf.
MIDA Newsletter September (2015). Malaysia announces new measures to boost economic growth, Malaysian Investment Development Authority (MIDA), viewed on September 2015,http://www.mida.gov.my/env3/uploads/EnewsletterPDF/2015/September2015.pdf.
MITI Weekly Bulletin, ASEAN Economic Community 2015: What to expect, Ministry of International Trade and Industry (MITI) Malaysia, Vol.363, 2015, pp. 2.
Mohammed B. Yusoff (2009) ‘Bilateral trade balance, exchange rates, and income: Evidence from Malaysia’, Global Economy Journal. 4, Article 7, DOI:10.2202/1524-5861.1568.
Narayan, P. K. (2005) ‘The saving and investment nexus for China: Evidence from cointegration tests’, Applied Economics, Vol. 37, pp.1979 – 1990.
Pesaran M.H. and Shin Y. (1999) ‘An autoregressive distributed lag modelling approach to cointegration analysis’, In S. Strom, A. Holly and P. Diamond (Eds.): Econometrics and Economic Theory in the 20th Century: The Ragner Frisch Centennial Symposium. Cambridge, Cambridge University Press. Available at: www.econ.cam.ac.uk/faculty/pesaran/ADL.pdf.
Pesaran, M.H., Shin Y. and Smith, R. (2001) ‘Bounds testing approaches to the analysis of level relationships’, Journal of Applied Econometrics, Vol. 16, pp.289-326.
Int. Journal of Economics and Management 10(1): 109 – 124 (2016)
124
Pittiglio, R. (2012) ‘Horizontal and vertical intraindustry trade: An empirical test of the ‘homogeneity hypothesis’, The World Economy, Vol. 35, No. 7,pp.919-945.
Salim, R., Islam, A. and Bloch, H. (2015) ‘Patterns and determinants of intra-industry trade in Southeast Asia: evidence from the automotive and electrical appliances sectors’ The Singapore Economic Review, Vol. 60, No. 4 ,pp. 150083-1-150083-19.
Sarmidi, T., and Salleh, N. H. M. (2011) ‘Dynamic inter-relationship between trade, economic growth and tourism in Malaysia’ International Journal of Economics and Management, Vol. 5, No. 1, pp.38–52.
Sawyer, W.C., Sprinkle, R.L. and Tochkov, K.(2010) ‘Patterns and determinants of intra-industry trade in Asia’, Journal of Asian Economics, Vol. 21, pp.485–493.
Shrestha, M.B. and Chowdhury, K. (June, 2005) ARDL modelling approach to testing the financial liberalisation hypothesis, Economic Working Paper Series, WP05-15, University of Wollongong.
Sharma, K., Nayagam, J. and Chung, H.H. (2012) ‘Determinants of foreign direct investment in Malaysia: New evidence from cointegration and error correction model’, The Journal of Developing Areas, Vol. 46, No. 1, pp.71-89.
Sheng, Y., Tang, H.S. and Xu, X. (2012) The Impact of ACFTA on People’s Republic of China-ASEAN Trade: Estimates Based on an Extended Gravity Model for Component Trade, ADB Working Paper Series on Regional Economic Integration, No. 99.
Soh, C.H. and Zhang, Z. (2006) ‘How intra-industry trade is related to income difference and foreign direct investment in East Asia’, Asian Economic Papers, Vol. 4, No. 3, pp.143-156.
Thorbecke, W. and Smith, G. (2010) ‘How would an appreciation of the RMB and other East Asian currencies affect China’s exports?’,Review of International Economics, Vol. 18, No. 1, pp.95-108.
Thorpe, M., and Zhang, Z. (2005) ‘Study of the measurement and determinants of intra-industry trade in East Asia’, Asian Economic Journal, Vol. 19, pp.231–247.
Tsiapa, M. (2011) ‘Trade relations and potential of the Western Balkans’, Int. J. Economic Policy in Emerging Economies, Vol. 4, No. 2, pp.140-158.
Turkcan, K. (2010) ‘Vertical intra-industry trade and product fragmentation in the auto-parts industry’, Journal of Industry, Competition and Trade, Vol. 11, No. 2, pp.149-186.
Turkcan, K. and Ates, A. (2011) ‘Vertical intra-industry trade and fragmentation: An empirical examination of the US auto-parts industry’, The World Economy, Vol. 34, pp.154-172.
Wong, K.N., Tang, T.C. and Fausten, D.K. (2009) ‘Foreign direct investment and services trade: evidence from Malaysia and Singapore’, Global Economic Review, Vol. 38, No. 30, pp.265-276.
Xing, Y. (2007) ‘Foreign direct investment and China’s bilateral intra-industry trade with Japan and the US’, Journal of Asia Economics, Vol. 18, pp.675-700.
Yeung, H.W.C. (1997) ‘Transnational economic synergy and business networks: The case of two-way investment between Malaysia and Singapore’, Regional Studies, Vol. 32, No. 8, pp.687-706.