1
IntraIntraIntraIntra----industry Trade Between Japan and East Asian Countries industry Trade Between Japan and East Asian Countries industry Trade Between Japan and East Asian Countries industry Trade Between Japan and East Asian Countries in the Agriin the Agriin the Agriin the Agri----Food Sector: Patterns and DeterminantsFood Sector: Patterns and DeterminantsFood Sector: Patterns and DeterminantsFood Sector: Patterns and Determinants
by
Kuo-I Chang�
a Graduate School of Agricultural and Life Science, The University of Tokyo,
AbstractAbstractAbstractAbstract
This paper attempts to investigate the patterns and determinants of the share
of vertical intra-industry trade (VIIT) in the agri-food sector between Japan and
East Asian countries from 1997 to 2005. Our empirical results show that the large
portion of agri-food trade between Japan and East Asian countries is still one-way
trade while intra-industry trade, particularly VIIT has not grown rapidly from 1997
to 2005. However, we find a positive relationship between factor endowment and
VIIT. Particularly, the fact that Japan imports high-quality agri-food products
more than exports reflects in the opposite direction of quality ladder story based on
Flam and Helpman type vertically differentiated trade models.
Corresponding author. (K. Chang), Graduate School of Agricultural and Life Science, The University of Tokyo,7B538R, 1-1-1 Yayoi, Bunkyo-Ku, Tokyo, 113-8657, Japan. Phone: +81 3 58418145; fax: +81 3 56975368 E-mail address: [email protected]
2
1. Introduction1. Introduction1. Introduction1. Introduction
Recent studies on intra-industry trade (IIT) have brought to light rapid
increases in vertical IIT and horizontal IIT. Despite the potential importance of
this issue and the fact that theory suggests that the determinants of vertical and
horizontal IIT differ, most of previous empirical studies on IIT have focused on total
IIT without distinguishing between vertical and horizontal IIT.
This paper examines the vertical and horizontal IIT and determinant of vertical
IIT (VIIT) in the agri-food sector 1 between Japan and 8 East Asian countries
(Indonesia, Malaysia, Philippines, Thailand, China, Singapore, Korea, and Taiwan).
The motivation for this paper stem from the recent development in foreign direct
investment (FDI) and the rapid expansion of processed food exports in many East
Asian economies. We focus on the agriculture and food sector not only because this
is an important sector within the region, but also because it is one of the most
critical sectors for the success of future trade reform and economic integration.
In recent literature the growing importance of the ASEAN Free Trade
Agreement (AFTA) and its implications on the major trading partners have
attracted a lot of attentions. It is particularly relevant when discussing future
bilateral trade agreements where trade partners expect trade adjustments to take
place within industries, rather than across industries.
1 This paper defines “agricultural goods” basically according to Agreement on Agriculture (AOA) of WTO. AOA covers HS01
to 24 less fish and fish products, plus HS 290543 (mannitol), 290544 (sorbitol), 3301 (essential oils), 3501-3505 (albuminoidal
substances, modified starches, glues), 380910 (finishing agents), 382360 (sorbitol n.e.p.), 4101-4103 (hides and skins), 4301 (raw
furskins), 5001-5003 (raw silk & silk waste), 5101-5103 (wool & animal hair), 5201-5203 (raw cotton, waste & cotton carded or
combed), 5301 (raw flax), 5302 (raw hemp). In this paper, we include fish and fish products while excluding additional products
for avoid digit-different mixing up.
3
This paper employs the bilateral VIIT indices between Japan and 8 East Asian
countries over the period 1997-2005 and analyzes the relationship between factor
endowment and VIIT in agri-food products.
The rest of this paper is organized as follows. Section 2 presents the
conceptual framework for the intra-industry trade and connects illustrative
theoretical models with the empirical method. Section 3 provides detailed analysis
of intra-industry trade for horizontally and vertically differentiated products and
examines the nature and characteristics of agri-food trade patterns with 8 East
Asian countries. Section 4 presents the results of the regression analysis. The
last section concludes.
2. 2. 2. 2. Conceptual framework for the intraConceptual framework for the intraConceptual framework for the intraConceptual framework for the intra----industry tradeindustry tradeindustry tradeindustry trade
2.1 Empirical decomposition of intra2.1 Empirical decomposition of intra2.1 Empirical decomposition of intra2.1 Empirical decomposition of intra----industry tradeindustry tradeindustry tradeindustry trade
Although the Grubel-Lloyd intra-industry trade index is popular for its ease of
computation, it has a flaw in being unable to distinguish between horizontal IIT and
vertical IIT; when in fact theory suggests that their determinants do differ. This
has been reconfirmed in a number of empirical studies in recent years. Horizontal
IIT refers to trade in similar products but different characteristics or attributes,
while vertical IIT involves trade in similar products of different qualities and
intra-firm, inter-processed trade (fragmentation). Krugman (1979) has
demonstrated that horizontal IIT is influenced by scale economies and preference
diversity, while Falvey (1981) has shown that factor endowment determines vertical
4
IIT. Moreover, Jones and Kierzkowski (1990) and Deardorff (2001a,2001b) showed
that location advantage with cost of service links determines either inter-industry
trade or vertical IIT. Thus, IIT must be decomposed into horizontally and
vertically differentiated products and analyzed separately. Confounding both may
produce contradictory results.
In order to identify vertical and horizontal IIT, we adopt a threshold-based
methodology used by major preceding studies, such as Greenway, Hine, and Milner
(1995), Fontagné, Freudenberg, and Péridy (1997), Fontagné and Freudenberg
(2002), Fukao, Ishido and Ito (2003), Kimura and Ando (2003), and Ferto (2005).
The basic idea is to give a definition of intra-industry trade which is closer both to
reality and economic theory. On a conceptual framework, we start from the
apprehension of intra-industry trade at the product level, and at the same time to
distinguish between horizontal and vertical product differentiation. To operate on
the concept of intra-industry trade in similar products, it is necessary to define what
a product is empirically, what a similar product is, and what intra-industry trade is.
The detailed composition of classification is the best guarantee for avoiding the
empirical problems of sectoral aggregation. The data we use are published by
World Trade Atlas based on HS 9-digit level and are sufficiently detailed for
products to be distinguished by their principle, technical characteristics. Products
would differ clearly by their quality inside the item of aggregation level. Here, it is
assumed that differences in prices (unit values) reflect quality differences.
Therefore, products whose unit values are close are considered as similar. Trade in
5
an item is considered to be intra-industry trade when the value of the minority trade
flow represents at least 10% of the majority flow. If trade flows of a particular
product with a partner country fulfill these criteria of similarity and overlap, we
qualify imports as well as exports as intra-industry trade in similar products. We
will decompose trade pattern into one-way trade, horizontal and vertical IIT by
detailed commodity and discuss the changing trade patterns between Japan and 8
East Asian countries in the third section.
2.2 Connection with theoretical framework2.2 Connection with theoretical framework2.2 Connection with theoretical framework2.2 Connection with theoretical framework
In the past twenty years, a number of theoretical studies have discussed for
country and industry specific influences on intra-industry trade. Table 1 presents
the connection between empirical threshold decomposition method and theoretical
framework of intra-industry trade based on nature of trade, theoretical foundation,
market structure and determinants of trade.
== Table 1 ==
Two of the most common assumptions made in theoretical models of horizontal
IIT are that trade is associated with imperfectly competitive product markets and
that the output of relevant industries consists of sufficiently differentiated products.
Both assumptions have important implications for the analysis of the gains from
trade and trade policy. Spence (1976) , Dixit and Stiglitz (1977), Krugman (1979),
6
Lancaster (1980) present a number of model of horizontal IIT based on monopolistic
competition markets. Empirical studies argued that horizontal IIT plays a
particularly large role in the trade in manufactured goods among advanced
industrial nations. Over time, industrial countries have become increasingly
similar in their levels of technology and in the availability of capital and skilled
labor. Since major trading nations have become similar in technology and
resources, there is often no clear comparative advantage within an industry, and
much of international trade therefore takes the form of intra-industry specialization
that is probably driven in large part by economies of scale and other reasons rather
than inter-industry specialization driven by comparative advantage.
Shaked and Sutton (1984) show the mechanism of vertical differentiation based
on quality under imperfect competition (natural oligopoly). They pointed out that
international trade takes the form of intra-industry specialization that driven by
economies of scale which is likely to be of practical relevance to high technology
industries where the main burden of quality improvement falls on fixed (R&D) costs,
so that unit variable costs rise only slowly with quality.
As Falvey (1981) points out in his neo Heckscher-Ohlin model, commodities of
the same statistical group but of different quality may be produced by using
different mixes of factor inputs. Moreover, developed economies may export
physical and human capital-intensive products of high-quality and import unskilled
labor-intensive products of low-quality from developing economies. Through this
mechanism, an increase in vertical IIT may have a large impact on factor demands
7
and factor prices. Vertical IIT is likely to be driven by differences in factor
endowments. Consequently, we expect vertical IIT to be more pronounced between
developing and developed economies. As being shown by Falvey and Kierzkowski
(1987), the share of vertical IIT will be correlated with the average market size of
the two countries in spite of a distinctly different pattern of specialization. Flam
and Helpman (1987) developed a model of North-South trade based on vertical
product differentiation in which the North exports high-quality and the South
exports low-quality industrial products. Faster technical progress in the Southern
industrial sector leads the North to introduce new high-quality products and the
South to abandon low-quality products. Production of Northern low-quality
products is shifted to the South. This is a sort of “quality ladder” story.
Durkin and Krygier (2000) find evidence of a positive and significant
relationship between differences in GDP per capita and the share of vertical IIT and
support the view that IIT may be positively related to differences in relative wages.
Intra-industry trade that trade economists have recently referred to as “intra-firm,
inter-processed” trade in relation to the fragmentation has been reconfirmed in a
number of studies recently. While this type of intra-industry trade is often seen
within the framework of multinational corporations, Northern firms can also make
subcontracting arrangements with Southern counterparts, thereby enabling them to
exploit economies of scale at various stages of production. Deardorff (2001b)
discusses fragmentation across different cones that is maybe useful in
understanding the pictures of vertical production chains. Fragmentation becomes
8
economical when the cost of service links (SL) connecting production blocks (PB) is
low enough. The emergence of intra-industry trade tends to be a concomitant of
enhanced fragmentation. Thus the increase of intra-industry trade among
trilateral economies may be regarded as the emergence of a new form of
interdependence among trilateral economies. It goes beyond the conventional view
of the international trade theory based on international differences in technological
level and factor prices or preference diversity.
As Helpman and Krugman (1985) pointed out, there still exist higher barriers
against intra-regional trade in East Asia than in the EU and NAFTA. These
barriers are likely to reduce IIT within East Asia. On the other hand, there is a
huge income gap among countries in East Asia. Probably this gap enhances
vertical IIT because of the differences in labor costs and other factor prices. At the
same time, this gap is likely to reduce horizontal IIT because of the differences in
industrial structure and preferences.
2.3 Relevance to agri2.3 Relevance to agri2.3 Relevance to agri2.3 Relevance to agri----food intrafood intrafood intrafood intra----industry trade between Japan and East Asiaindustry trade between Japan and East Asiaindustry trade between Japan and East Asiaindustry trade between Japan and East Asia
The developments of international trade in the whole East Asia reveal that the
large portion of trade pattern is still inter-industry trade, which presents a sharp
contrast with European trade where intra-industry trade has a substantial share.2
Fukao, Ishido, and Ito (2003) find that a major pattern is still inter-industry
trade while vertical intra-industry trade (IIT) with vertical foreign direct investment
2 See, for example, Fontagné and Freudenberg (2002)
9
(FDI) increases its importance in East Asia. Their analysis reveals that, although
still much lower than in the EU, intra-industry trade, and particularly vertical IIT,
in East Asia has grown rapidly in importance in overall intra-regional trade. This
is especially the case in the electrical machinery industry and the general and
precision machinery industry. However, while for most EU countries, the share of
IIT remained almost constant during the period from 1996 to 2000, it expanded
quickly for East Asian countries. Their empirical results imply that in the East
Asian region FDI played a significant role in the rapid increase of vertical IIT in
recent years. Moreover, they found the largest part of total IIT growth in the
region is attributable to the growth of vertical and not of horizontal IIT that have
relatively large share in the EU region.
However, there are relatively few papers that focus on the intra-industry trade
nature of agri-food trade, despite its growing importance especially toward s closer
economic integration between East Asian countries Feto (2005) reviews some of
the empirical studies on agri-food trade particularly in the latter half of the 1990s
(Chang et al., 2001; Christodolou, 1992; Ferto, 2005; Hirschberg et al., 1994; Pieri et
al., 1997; Qasmi and Fausti, 2001; Sun and Koo, 2002) relating to the sign and
significance of GDP per capita and finds empirical studies on agri-food trade are
promising, but they do not support unambiguously the prediction of the C-H-O
model.
3. 3. 3. 3. Measurement of Vertical and Horizontal IntraMeasurement of Vertical and Horizontal IntraMeasurement of Vertical and Horizontal IntraMeasurement of Vertical and Horizontal Intra----industry Tradeindustry Tradeindustry Tradeindustry Trade
10
The previous section reviews various kinds of trade models. This section
provides detailed analysis of intra-industry trade for horizontally and vertically
differentiated products and examines the nature and characteristics of agri-food
trade patterns between Japan and 8 East Asian countries.
3.1 3.1 3.1 3.1 The The The The thresholdthresholdthresholdthreshold decomposition method decomposition method decomposition method decomposition method
In the following analysis, we decompose bilateral trade flows between Japan
and 8 East Asian countries by classifying each detailed commodity category into one
of the following patterns: (a) inter-industry trade (one-way trade), (b) horizontal IIT
(HIIT), and (c) vertical IIT (VIIT).
Three steps are required to obtain the share of each type of trade for the sector
concerned, by using the threshold-based index.
First, we have to identify whether bilateral trade of commodity j is one-way
trade or intra-industry trade.
Min(Mkk'j , Mk'kj ) /Max(Mkk'j , Mk'kj ) ≤ 0.1 (3.1)
where Mkk'j : value of economy k’s imports of commodity j from economy k', Mk'kj :
value of economy k'’s imports of commodity j from economy k. Bilateral trade of
commodity j is regarded as one-way trade when equation (3.1) holds and as IIT
otherwise.
11
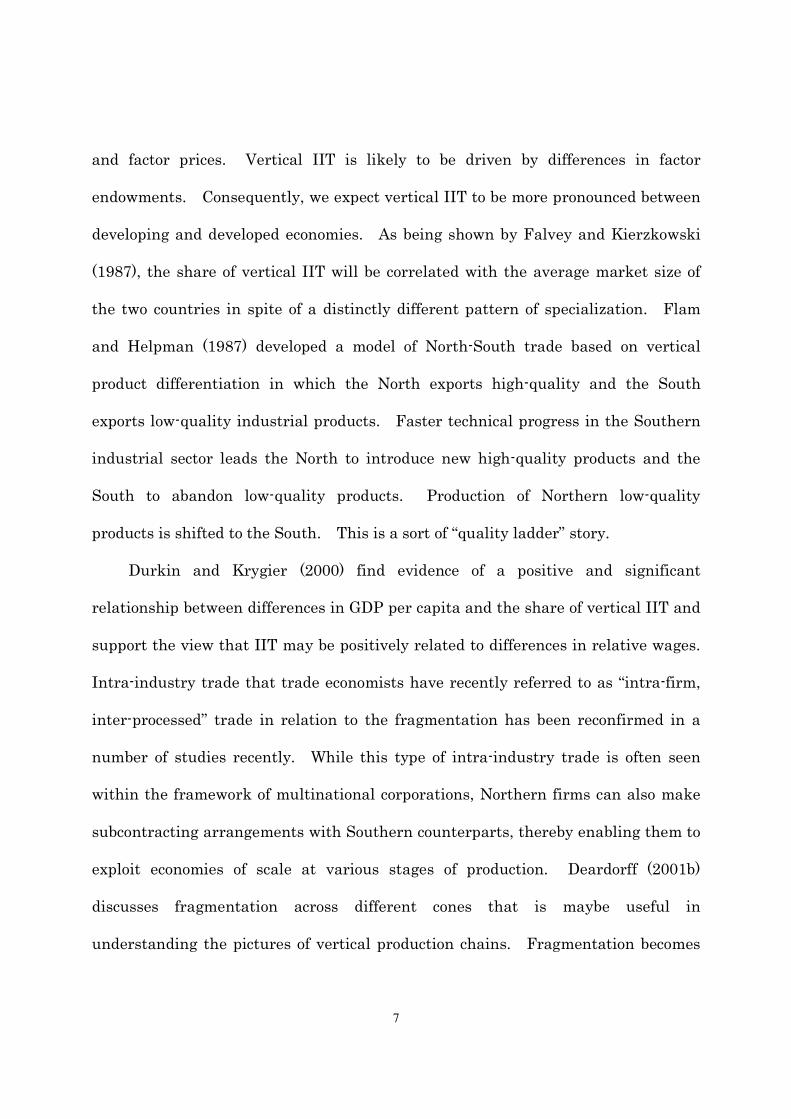
Second, we then have to distinguish whether intra-industry trade of commodity
j is horizontal IIT or vertical IIT. Intra-industry trade of commodity j is regarded as
horizontal IIT when the following equation (3.2) holds and as vertical IIT otherwise:
25.125.1
1
'
'
≤≤
kjk
jkk
P
P (3.2)
where Pkk'j: average unit value of economy k’s imports of commodity j from economy
k', Pk'kj: average unit value of economy k'’s imports of commodity j from economy k.
Finally, the share of each trade type in a broader commodity category is
calculated as:
∑ ∑ ++
j jkjkjkk
n
kjk
n
jkkMMMM )(/)( '''' (3.3)
where n denotes one of the three intra-industry trade types, i.e., “one-way trade”
(OWT) “horizontal intra-industry trade” (HIIT) and “vertical intra-industry trade”
(VIIT) .
For our analysis, we chose to identify horizontal IIT mainly by using the range
of relative export/import unit values of 1/1.25 (i.e., 0.8) to 1.25. Although most
previous studies in Europe mainly use a 15% threshold to distinguish between
horizontally and vertically differentiated products, we employ a 25% threshold as a
rather strict definition of vertical intra-industry trade.
12
For the analysis on trade patterns, we use the World Trade Atlas published by
the Global Trade Information Services, Inc. This dataset provides us with bilateral
trade data of almost all the countries including Taiwan at the HS 9-digit level. For
the calculation of the IIT, we use importing countries’ data.
Unit values of imports are obtained at the HS 9-digit level by dividing import
values by the corresponding quantities, which are also available from the World
Trade Atlas. Following Kimura and Ando (2003), bilateral export data are used
for commodities that have discordance in units of quantities of imports between two
countries when we distinguishes intra-industry trade between horizontal IIT and
vertical IIT. Some commodities with discordant units still remain even after
adjustment, but such commodities become much smaller than the case without
adjustment.3
3.3.3.3.2222 Comparison of changing trade patterns Comparison of changing trade patterns Comparison of changing trade patterns Comparison of changing trade patterns between Japan and East Asiabetween Japan and East Asiabetween Japan and East Asiabetween Japan and East Asia
Next, Table 2 and Table 3 are summarized tables of shares and values for
threshold decomposition of trade between Japan and 8 East Asian countries.
Commodities are classified into three types of trade at the HS 9-digit level and are
aggregated in each type. These tables tell us various stories of agri-food trade , but
here we would like to emphasize three points.
3 Among intra-industry trade , trade of commodities with discordant units even after the adjustment with export data is categorized into “not classified.”
13
== Table 2 , Table 3 ==
First, one-way trade is still dominant in agri-food trade between Japan and
each East Asian country. It seems natural for Japan-China trade (99.53% for
9-years average) to be relatively large one-way trade in our samples because of large
differences in development stages and income levels between them. However, large
shares of one-way trade for Japan-Taiwan (99.48% for 9-years average) and
Japan-Korea (99.15% for 9-years average) may be unexpected. On the other hand,
Japan imports from partner’s countries more than exports to them besides the case
of Japan and Singapore. This result means that most of traded agri-food even
between developed countries are homogenous.
Second, the shares of horizontal IIT are lower than those of vertical IIT despite
the fact that we find the share of horizontal IIT is larger than the share of VIIT in
the case of 9-years average for Japan-Philippine and Japan-Thailand. That is,
most of trade in differentiated agri-food is according to the difference in quality of
goods.
Third, as for the unit value of exported vertically differentiated goods, it seems
to follow quality-ladder story only in case of Japan-Singapore and Japan-Taiwan.
That is, it is considered that developed countries export high quality products and
imports low quality ones. However, it does not seem to follow in case of agri-food
trade between Japan and the other East Asian countries. The share of the
agri-good exported by the other partners with more expensive unit value is larger
14
than that by Japan. This contrast implies that quality on agri-food can be less
approximated by stages of economic development as found in Ferto (2005).
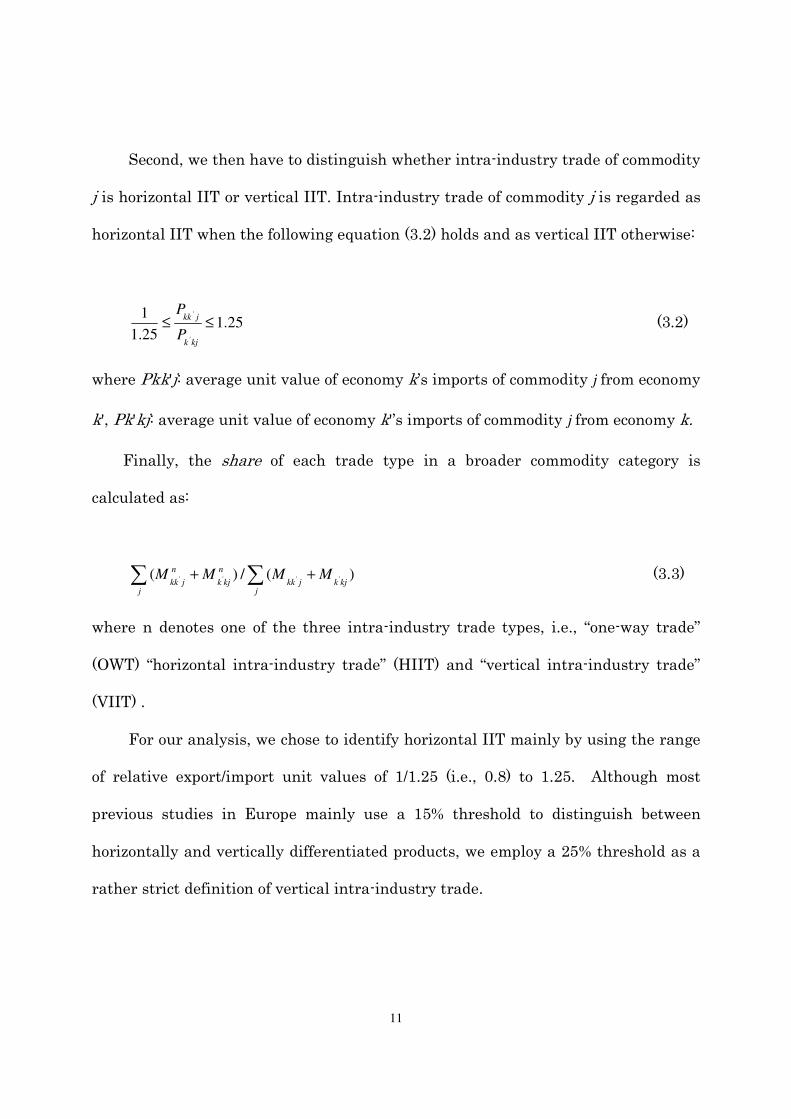
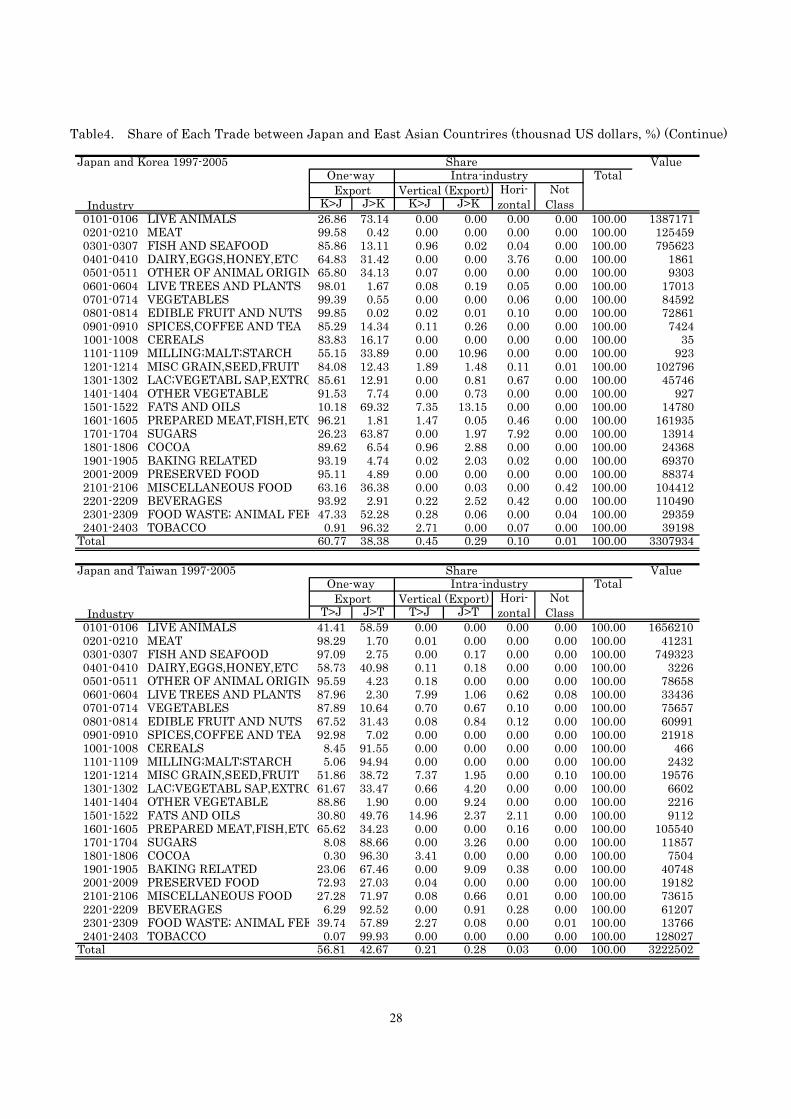
Although these aggregated numbers are useful for examining how many traded
agricultural goods in a mass are differentiated or not, the numbers mask detailed
pictures on each agricultural product. Therefore, we present the disaggregated
figures in Table 4.
== Table 4 ==
From this table, we can find statistically that many differentiated products in
some agri-food are traded between Japan and East Asian countries. In the case of
Japanese significant share of high-quality exports which are larger than partner’
share are as follows. Japan-Indonesia: Lac;Vegetable Sap, Extrac (HS1301-1302),
Fats and Oils (HS1501-1522) and Beverages (HS2201-2209). Japan-Malaysia:
Beverages (HS2201-2209) and Baking Related (HS1901-1905). Japan-Philippine:
Misc Grain, Seed, Fruit (HS1201-1214). Japan-Thailand: Misc Grain, Seed, Fruit
(HS1201-1214) and Fats and Oils (HS1501-1522). Japan-China: Cocoa
(HS1801-1806) and Fats and Oils (Hs1501-1522). Japan-Singapore: Fats and Oils
(Hs1501-1522) and Beverages (HS2201-2209). Japan-Korea: Fats and Oils
(Hs1501-1522) and Milling; Malt; Starch (HS1101-1109). Japan-Taiwan: Other
Vegetable (HS1401-1404) and Baking Related (HS1901-1905).
15
In the opposite case of Japanese significant share of high-quality imports which
are larger than partner’ share are as follows. Japan-Indonesia: Other Of Animal
Origin (HS0501-0511) and Fish and Seafood (HS0301-0307). Japan-Malaysia:
Tabacco (HS2301-2403). Japan-Philippine: Spices, Coffee and Tea (HS0901-0910).
Japan-Thailand: Cocoa (HS1801-1806). Japan-China: Fish and Seafood
(HS0301-0307) and Beverages (HS2201-2209). Japan-Singapore: Misc Grain, Seed,
Fruit (HS1201-1204). Japan-Korea: Tobacco (HS2401-2403), Prepared Meat, Fish,
Etc (HS1601-1605), and Fish and Seafood (HS0301-0307). Japan-Taiwan: Fats and
Oils (HS1501-1522) , Trees and Plants (HS0601-0604),and Misc Grain, Seed, Fruit
(HS1201-1204).
4. Determinants4. Determinants4. Determinants4. Determinants
The relationships between factor endowments and vertical IIT arising from
theory would be examined for Japanese trade with 8 East Asian countries in
agri-food products. The data set includes 8 East Asian countries and 9 years
(1997-2005). However, there are no trade data of Japan-Malaysia of 2005 for total
VIIT and Japan-Malaysia of 1997/2005, and Japan-Philippine of 1998/2000 for
higher quality of VIIT. Therefore, observations are 71 and 68 for total VIIT and
higher quality VIIT, respectively. The difference in factor endowments is usually
measured in empirical studies by bilateral in per capita GDP. Therefore, we test
the factor endowments hypothesis controlling for distance between Japan and its
trading partners. In addition, we include direct measure of factor endowment
16
corresponding to land. Following Ferto (2005), we test the equation based on Flam
and Helpman (1987) by following specification employing OLS regression:
ijtIIT = 0α +1α ln ijtDGDPC +
2α ln itGDP + 3α ln jtGDP +4α ijtDISTANCE + 5α ijtDLAND + ijtε
(4.1)
where ijtIIT denotes total or high quality vertical IIT; i is Japan , j is trading
partner, and t is time. ijtDGDPC denotes the difference in per capita GDP between
i nad j calculated from database of Asian Development Bank . itGDP and jtGDP
are the GDP in i nad j, both from database of Asian Development Bank.
ijtDISTANCE is the distance between Tokyo and the capital city of j, calculated from
CEPII database. ijtDLAND denotes the difference in arable land in one thousand
hectares between Japan and trading partners calculated from FAO database.
The expected signs for total VIIT: 1α , 3α , 5α >0 and
2α ,4α <0
The estimated results using the dependent variable for total VIIT and higher
quality VIIT are listed in Table 5, respectively.
== Table 5 ==
In the total VIIT, the positive relationship between differences in the factor
endowments and the VIIT are obtained. The estimatedcoefficients of GDPi and
GDPj have the expected signs and are significant, while the DISTANCE and
17
DLAND variables have unexpected signs but significant. On the other hand, the
results are quite similar in higher quality VIIT despite the coefficient of ln DGDPC
variable becomes negatively insignificant.
5. Concluding remark5. Concluding remark5. Concluding remark5. Concluding remarkssss
This paper attempts to investigate the patterns and determinants of the share
of vertical intra-industry trade (VIIT) in the agri-food sector between Japan and
East Asian countries from 1997 to 2005. Our empirical results show that the large
portion of agri-food trade between Japan and East Asian countries is still one-way
trade while intra-industry trade, particularly VIIT has not grown rapidly from 1997
to 2005. However, we find a positive relationship between factor endowment and
VIIT. Particularly, the fact that Japan imports high-quality agri-food products
more than exports reflects in the opposite direction of quality ladder story based on
Flam and Helpman type vertically differentiated trade models.
18
ReferencesReferencesReferencesReferences
Chang, C. C., Yang, T. C. O., Huang, D. S., 2001. Intra-Industry Trade between Taiwan and Asean-5 in the Agro-Food Sector: Patterns and Determinants. Selected Paper for the 2001 American Agricultural Economics Association Annual Meeting Chicago, USA, August 5-8, 2001.
Christodolou, M., 1992. Intra-Industry Trade in Agrofood Sectors: The Case of the EEC Market. Applied Economics 24, 875-884.
Deardorff, A. V. (2001a) “Fragmentation in Simple Trade Models.” North American Journal of Economics and Finance, 12: 121-137.
Deardorff, A. V. (2001b) "Fragmentation across Cones." In Sven W. Arndt and Henryk Kierzkowski, eds., Fragmentation: New Production Patterns in the World Economy, Oxford University Press, 2001, pp. 35-51.
Dixit, A. K., Stiglitz, J. E., 1977. Monopolistic Competition and Optimum Product Diversity. American Economic Review 67, 297-308.
Durkin, John T. and Markus Krygier. (2000) “Differences in GDP Per Capita and the Share of Intra-industry Trade: The Role of Vertically Differentiated Trade,” Review of International Economics, 8(4), pp. 760-774.
Falvey, R.E. (1981) “Commercial Policy and Intra-Industry Trade” Journal of International Economics,11, pp. 495-511.
Falvey, R. E., Kierzkowski, H., 1987. Product Quality, Intra-industry Trade and (Im)Perfect Competition. In: Kierzkowski, H. (Ed.), Protection and Competition in International Trade: Essays in Honor of W. M. Corden. Oxford: Basil Blackwell, 143-159.
Ferto, I., 2005. Vertically Differentiated Trade and Differences in Factor Endowment: The Case of Agri-Food Products between Hungary and the EU.Journal of Agricultural Economics 56, 117-134.
Flam, H., Helpman, E., 1987. Vertical Product Differentiation and North-South Trade. American Economic Review 77, 810-822.
Fukao, Kyoji and Ishido, Hikari and Ito, Keiko. (2003) “Vertical Intra-Industry Trade and Foreign Direct Investment in East Asia” journal of the Japanese and International Economics 17, 468-506.
19
Greenaway, D., Hine, R., Milner, C., 1995. Vertical and Horizontal Intra-Industry Trade: A Cross Country Analysis for the United Kingdom. Economic Journal 105, 1505-1518.
Helpman, E. and Krugman, P. R. (1985) Market Structure and Foreign Trade. Cambridge: The MIT Press.
Hirschberg, J., Sheldon, I., Dayton, J., 1994. An Analysis of Bilateral Intra-Industry Trade in the Food Processing Sector. Applied Economics 26, 159-167.
Jones, R. W. and Kierzkowski, H. (1990) “The Role of Services in Production and International Trade: A Theoretical Framework.” in Ronald W. Jones and Anne O. Krueger, eds., The Political Economy of International Trade: Essays in Honor of Robert E. Baldwin. Oxford, Basil Blackwell.
Kimura, F., Ando, M., 2003. Intra-regional Trade among China, Japan, and Korea: Intra-industry Trade of Major Industries. In: Kim, Y., Lee, C. J. (Eds.), Northeast Asian Integration: Prospects for a Northeast Asian FTA. Seoul: KIEP, 245-279.
Krugman, P.R. (1979) “Increasing Returns, Monopolistic Competition and International Trade,” Journal of International Economics, vol.9,pp.469-479.
Lancaster, K.(1980) “Intra-industry Trade under Perfect Monopolistic Competition,” Journal of International Economics,vol.10, pp.151-176.
Pieri, R., Rama, D., Venturini, L., 1997. Intra-Industry Trade in the European Food Industry. European Review of Agricultural Economics 24, 411-425.
Qasmi, B. A., Fausti, S. W., 2001. NAFTA Intra-Industry Trade in Agricultural Food Products. Agribusiness 17, 255-271.
Shaked, A and J. Sutton. (1984) “Natural Oligopolies and International Trade” in Kierzkowski, H.ed. Monopolistic Competition and International Trade, Oxford: Oxford University Press.
Spence, A. M.(1976) “Product Differentiation and Welfare,” American Economic Review, vol.66,pp.407-414.
Sun, C. and Koo, W. W., 2002. Horizontal and Vertical Intra-Industry Trade in the
U.S. Food Processing Industry. Agribusiness & Applied Economics Report No.502.
North Dakota State University.
2
0
Mark
et s
tructu
reD
eter
min
ants
of
trade
Mai
n m
od
el
In
ter-
indu
sty t
rade
Com
par
ativ
e ad
vanta
ge
Per
fect
com
pet
itio
nT
echn
olo
gic
al g
ap
Fac
tor
end
ow
men
ts
Ric
har
dia
n M
odel
Hec
ksc
her
-Ohli
n M
odel
VII
T
Per
fect
com
pet
itio
nF
acto
r pro
port
ion
Fal
vey
(1
981
)
Fal
vey
an
d K
ierz
kow
ski
(1987
)
Fla
m a
nd
Hel
pm
an (
19
87)
Durk
in a
nd
Kry
gie
r (2
00
0)
(1.2
5≤
Pkk
'j/P
k'k
j ,
Pk
k'j/
Pk'k
j≤1
/1.2
5)
Imp
erfe
ct c
om
pet
itio
n
(nat
ura
l oli
gopoly
)F
ixed
cost
s of
R&
DS
haked
and S
utt
on
(19
84)
HII
T
Dem
and f
or
bra
nd
(lo
ve
of
vari
ety a
ppro
ach
)
Spen
ce (
19
76)
Dix
it a
nd
Sti
gli
tz(1
977
)
Kru
gm
an (
19
79)
(1/1
.25≤
Pk
k'j/
Pk'k
j ≤
1.2
5)
Div
ersi
ty o
f pre
fere
nce
s
(id
eal
vari
ety a
ppro
ach
)
Neo
-Hote
llin
g M
odel
, L
ancas
ter
(198
0)
Hel
pm
an (
19
84)
��������������� �����������������������������������������������
Tra
de
pat
tern
Natu
re o
f tr
ade
Theo
reti
cal
fou
nd
atio
nM
ain m
odel
of
intr
a-in
du
stry
tra
de
One-
way t
rad
e
Min
(Mk
k'j,
Mk'k
j)/M
ax(M
kk
'j,M
k'k
j) ≤
0.1
Ver
tical
pro
ducti
on
chain
Intr
a-
firm
, in
ter-
pro
ces
sed
tra
de
(fra
gm
enta
tion)
Imp
erfe
ct c
om
pet
itio
n
wit
h f
irm
-spec
ific
ass
ets
Loca
tion a
dvan
tages
wit
h c
ost
of
serv
ice
links
Jon
es a
nd K
ierz
kow
ski
(199
0)
Dea
rdorf
f (2
00
1a,
200
1b
)
Intr
a-i
ndu
stry
trade
Ver
tica
lly d
iffe
renti
ate
d
pro
ducts
Pro
du
ct d
iffe
renti
atio
n
base
d o
n q
ual
ity
Hori
zonta
lly
dif
fere
nti
ate
d p
rod
uct
s
Pro
du
ct d
iffe
renti
atio
n
bas
ed o
n a
ttri
bute
s
Monop
oli
stic
com
pet
itio
n
21
Table 2. Shares of Oneway, Vertical and Horizontal IIT between Japan and East Asian Countries
Data Source: Authors’ calculation based on World Trade Atlas
Japan and Indonesia 1997 1998 1999 2000 2001 2002 2003 2004 2005 Average
One-way(total) 99.61 99.97 99.98 99.38 99.14 99.80 98.69 99.64 98.68 99.46export:Japan is lower 92.00 82.04 80.99 91.37 88.63 88.25 80.90 74.51 72.40 83.51export:Japan is higher 7.62 17.93 19.00 8.01 10.52 11.55 17.80 25.13 26.28 15.95
Intra-industry(total) 0.39 0.03 0.02 0.62 0.86 0.20 1.31 0.36 1.32 0.54Horizontal 0.00 0.00 0.00 0.01 0.03 0.00 0.00 0.11 0.98 0.12Vertical 0.39 0.03 0.02 0.61 0.83 0.20 1.31 0.25 0.34 0.42export:Japan is lower 0.37 0.00 0.01 0.58 0.77 0.01 0.99 0.10 0.30 0.33export:Japan is higher 0.02 0.03 0.01 0.03 0.06 0.18 0.32 0.15 0.04 0.09
Not classified 0.00 0.00 0.00 0.01 0.00 0.00 0.00 0.00 0.00 0.00Total 100.00 100.00 100.00 100.00 100.00 100.00 100.00 100.00 100.00 100.00
Japan and Malaysisa 1997 1998 1999 2000 2001 2002 2003 2004 2005 Average
One-way(total) 98.27 99.99 99.80 99.75 99.41 99.64 99.78 99.87 99.95 99.63export:Japan is lower 72.53 75.28 68.63 58.69 59.32 63.01 62.62 61.54 59.88 64.06export:Japan is higher 25.75 24.71 31.16 41.06 40.08 36.63 37.15 38.34 40.06 35.57
Intra-industry(total) 1.73 0.01 0.20 0.25 0.59 0.36 0.22 0.13 0.05 0.37Horizontal 0.00 0.00 0.00 0.00 0.00 0.00 0.06 0.00 0.05 0.02Vertical 1.73 0.01 0.20 0.25 0.59 0.36 0.16 0.13 0.00 0.35export:Japan is lower 1.73 0.01 0.19 0.16 0.56 0.30 0.00 0.00 0.00 0.29export:Japan is higher 0.00 0.00 0.01 0.09 0.03 0.06 0.16 0.13 0.00 0.05
Not classified 0.00 0.00 0.00 0.00 0.00 0.00 0.00 0.00 0.00 0.00Total 100.00 100.00 100.00 100.00 100.00 100.00 100.00 100.00 100.00 100.00
Japan and Philippine 1997 1998 1999 2000 2001 2002 2003 2004 2005 Average
One-way(total) 97.38 98.18 99.98 99.98 99.96 99.92 99.62 99.98 99.59 99.52export:Japan is lower 66.93 74.60 65.57 67.92 63.94 59.99 57.23 61.52 74.67 65.30export:Japan is higher 30.45 23.58 34.42 32.06 36.02 39.93 42.40 38.46 24.93 34.22
Intra-industry(total) 2.62 1.82 0.02 0.02 0.04 0.08 0.38 0.02 0.41 0.48Horizontal 2.39 1.81 0.00 0.02 0.00 0.00 0.34 0.00 0.39 0.43Vertical 0.22 0.00 0.01 0.00 0.04 0.08 0.03 0.02 0.02 0.04export:Japan is lower 0.09 0.00 0.00 0.00 0.03 0.08 0.03 0.00 0.00 0.02export:Japan is higher 0.14 0.00 0.01 0.00 0.01 0.01 0.01 0.02 0.02 0.02
Not classified 0.00 0.00 0.00 0.00 0.00 0.00 0.00 0.00 0.00 0.00Total 100.00 100.00 100.00 100.00 100.00 100.00 100.00 100.00 100.00 100.00
Japan and Thailand 1997 1998 1999 2000 2001 2002 2003 2004 2005 Average
One-way(total) 99.49 99.81 99.89 99.96 99.14 99.05 98.42 99.57 99.81 99.44export:Japan is lower 87.72 87.16 86.90 85.57 86.13 84.94 81.38 80.42 81.24 84.36export:Japan is higher 11.76 12.64 13.00 14.39 13.00 14.11 17.04 19.15 18.57 15.09
Intra-industry(total) 0.51 0.19 0.11 0.04 0.86 0.95 1.58 0.43 0.19 0.56Horizontal 0.00 0.11 0.00 0.00 0.72 0.01 1.37 0.39 0.01 0.31Vertical 0.51 0.08 0.11 0.04 0.14 0.94 0.21 0.04 0.18 0.25export:Japan is lower 0.23 0.02 0.07 0.03 0.13 0.93 0.15 0.01 0.16 0.19export:Japan is higher 0.28 0.07 0.04 0.01 0.01 0.01 0.05 0.03 0.02 0.06
Not classified 0.00 0.00 0.00 0.00 0.00 0.00 0.00 0.00 0.00 0.00Total 100.00 100.00 100.00 100.00 100.00 100.00 100.00 100.00 100.00 100.00
22
Table 2. Shares of Oneway, Vertical and Horizontal IIT between Japan and East Asian Countries (Continue)
Data Source: Authors’ calculation based on World Trade Atlas
Japan and China 1997 1998 1999 2000 2001 2002 2003 2004 2005 Average
One-way(total) 99.39 99.50 99.67 99.51 99.56 99.40 99.58 99.52 99.57 99.53export:Japan is lower 92.08 91.04 89.44 87.67 85.60 79.04 73.88 70.38 67.95 79.42export:Japan is higher 7.31 8.46 10.23 11.84 13.96 20.37 25.71 29.14 31.62 20.10
0.00Intra-industry(total) 0.61 0.50 0.33 0.49 0.44 0.60 0.42 0.48 0.43 0.47
Horizontal 0.02 0.02 0.02 0.10 0.07 0.15 0.04 0.07 0.07 0.06Vertical 0.59 0.48 0.29 0.40 0.37 0.45 0.37 0.41 0.37 0.41export:Japan is lower 0.36 0.37 0.26 0.30 0.29 0.25 0.26 0.24 0.21 0.27export:Japan is higher 0.23 0.11 0.03 0.09 0.08 0.20 0.11 0.17 0.16 0.14
Not classified 0.00 0.00 0.03 0.00 0.00 0.00 0.00 0.00 0.00 0.00Total 100.00 100.00 100.00 100.00 100.00 100.00 100.00 100.00 100.00 100.00
Japan and Singapore 1997 1998 1999 2000 2001 2002 2003 2004 2005 Average
One-way(total) 99.72 99.55 99.68 99.74 99.81 99.83 99.78 99.84 99.90 99.78export:Japan is lower 36.88 37.98 33.33 27.74 28.40 30.26 28.16 30.42 31.47 31.04export:Japan is higher 62.84 61.57 66.35 72.00 71.41 69.57 71.61 69.42 68.43 68.74
Intra-industry(total) 0.28 0.45 0.32 0.26 0.19 0.17 0.22 0.16 0.10 0.22Horizontal 0.24 0.29 0.08 0.06 0.05 0.05 0.02 0.06 0.03 0.08Vertical 0.03 0.16 0.24 0.20 0.15 0.12 0.20 0.10 0.07 0.14export:Japan is lower 0.00 0.00 0.00 0.01 0.03 0.00 0.00 0.00 0.02 0.01export:Japan is higher 0.03 0.16 0.24 0.20 0.11 0.12 0.20 0.10 0.05 0.13
Not classified 0.00 0.00 0.00 0.00 0.00 0.00 0.00 0.00 0.00 0.00Total 100.00 100.00 100.00 100.00 100.00 100.00 100.00 100.00 100.00 100.00
Japan and Korea 1997 1998 1999 2000 2001 2002 2003 2004 2005 Average
One-way(total) 98.69 99.40 99.63 99.38 99.05 99.41 99.41 98.85 98.73 99.15export:Japan is lower 71.88 79.87 73.69 61.85 58.28 55.75 52.91 51.44 52.55 60.77export:Japan is higher 26.81 19.53 25.94 37.53 40.77 43.66 46.50 47.42 46.18 38.38
Intra-industry(total) 1.31 0.60 0.37 0.62 0.95 0.59 0.59 1.15 1.27 0.85Horizontal 0.06 0.06 0.08 0.27 0.04 0.20 0.06 0.08 0.05 0.10Vertical 1.25 0.53 0.29 0.36 0.91 0.38 0.47 1.01 1.22 0.73export:Japan is lower 0.92 0.40 0.20 0.22 0.45 0.13 0.09 0.67 0.84 0.45export:Japan is higher 0.33 0.13 0.10 0.14 0.46 0.25 0.38 0.35 0.39 0.29
Not classified 0.00 0.00 0.00 0.00 0.00 0.01 0.05 0.05 0.00 0.01Total 100.00 100.00 100.00 100.00 100.00 100.00 100.00 100.00 100.00 100.00
Japan and Taiwan 1997 1998 1999 2000 2001 2002 2003 2004 2005 Average
One-way(total) 99.25 99.32 99.53 99.54 99.49 99.64 99.43 99.47 99.56 99.48export:Japan is lower 63.75 54.86 54.77 51.72 52.84 56.44 56.88 60.99 57.43 56.81export:Japan is higher 35.50 44.46 44.76 47.82 46.64 43.20 42.56 38.48 42.13 42.67
Intra-industry(total) 0.75 0.68 0.47 0.46 0.51 0.36 0.57 0.53 0.44 0.52Horizontal 0.06 0.00 0.08 0.08 0.00 0.01 0.02 0.02 0.03 0.03Vertical 0.69 0.67 0.39 0.37 0.51 0.35 0.55 0.51 0.40 0.49export:Japan is lower 0.36 0.28 0.19 0.17 0.22 0.13 0.19 0.22 0.20 0.21export:Japan is higher 0.34 0.40 0.20 0.20 0.30 0.22 0.36 0.29 0.21 0.28
Not classified 0.00 0.00 0.00 0.00 0.00 0.00 0.00 0.00 0.00 0.00Total 100.00 100.00 100.00 100.00 100.00 100.00 100.00 100.00 100.00 100.00
23
Table 3. Values of Oneway, Vertical and Horizontal IIT between Japan and East Asian Countries (Million US dollars)
Data Source: Authors’ calculation based on World Trade Atlas
Japan and Indonesia 1997 1998 1999 2000 2001 2002 2003 2004 2005 Average
One-way(total) 1578.19 1650.30 1493.75 1327.97 1291.72 1333.90 1244.91 1365.32 1341.91 1403.11export:Japan is lower 1457.51 1354.25 1209.94 1220.96 1154.72 1179.49 1020.43 1021.00 984.53 1178.09export:Japan is higher 120.68 296.05 283.81 107.01 137.01 154.41 224.49 344.31 357.38 225.02
Intra-industry(total) 6.12 0.45 0.28 8.31 11.16 2.68 16.48 4.94 18.01 7.60Horizontal 0.00 0.04 0.00 0.07 0.39 0.05 0.00 1.54 13.37 1.72Vertical 6.12 0.41 0.28 8.17 10.77 2.63 16.48 3.40 4.57 5.87export:Japan is lower 5.80 0.00 0.09 7.74 9.97 0.19 12.50 1.34 4.08 4.64export:Japan is higher 0.32 0.41 0.19 0.43 0.80 2.45 3.98 2.06 0.49 1.24
Not classified 0.00 0.00 0.00 0.07 0.00 0.00 0.00 0.00 0.06 0.02Total 1584.31 1650.75 1494.03 1336.28 1302.88 1336.58 1261.39 1370.26 1359.92 1410.71
Japan and Malaysisa 1997 1998 1999 2000 2001 2002 2003 2004 2005 Average
One-way(total) 1026.82 941.58 996.24 1164.79 966.49 1049.63 1132.02 1416.48 1623.71 1146.42export:Japan is lower 757.80 708.93 685.14 685.33 576.78 663.71 710.49 872.77 972.83 737.09export:Japan is higher 269.02 232.65 311.10 479.45 389.71 385.92 421.54 543.70 650.88 409.33
Intra-industry(total) 18.03 0.12 2.02 2.90 5.77 3.79 2.54 1.78 0.89 4.20Horizontal 0.00 0.00 0.02 0.00 0.00 0.04 0.73 0.00 0.89 0.19Vertical 18.03 0.12 2.01 2.90 5.77 3.75 1.81 1.78 0.00 4.02export:Japan is lower 18.03 0.09 1.87 1.87 5.48 3.14 0.01 0.00 0.00 3.39export:Japan is higher 0.00 0.03 0.14 1.03 0.29 0.61 1.81 1.78 0.00 0.63
Not classified 0.00 0.00 0.00 0.00 0.00 0.00 0.00 0.00 0.00 0.00Total 1044.85 941.69 998.26 1167.68 972.26 1053.41 1134.57 1418.26 1624.60 1150.62
Japan and Philippine 1997 1998 1999 2000 2001 2002 2003 2004 2005 Average
One-way(total) 1052.73 1010.56 1452.33 1567.88 1316.88 1570.45 1728.04 1819.08 1615.51 1459.27export:Japan is lower 723.55 767.86 952.41 1065.17 842.33 942.81 992.63 1119.40 1211.17 957.48export:Japan is higher 329.18 242.70 499.92 502.72 474.55 627.64 735.41 699.68 404.33 501.79
Intra-industry(total) 28.31 18.73 0.22 0.38 0.53 1.28 6.52 0.37 6.63 7.00Horizontal 25.88 18.68 0.03 0.32 0.04 0.00 5.92 0.00 6.30 6.35Vertical 2.43 0.05 0.19 0.06 0.49 1.28 0.60 0.37 0.32 0.64export:Japan is lower 0.96 0.05 0.00 0.06 0.40 1.20 0.44 0.00 0.00 0.35export:Japan is higher 1.48 0.00 0.19 0.00 0.09 0.08 0.16 0.37 0.32 0.30
Not classified 0.00 0.00 0.00 0.00 0.00 0.00 0.00 0.00 0.00 0.00Total 1081.04 1029.29 1452.55 1568.27 1317.41 1571.73 1734.57 1819.45 1622.13 1466.27
Japan and Thailand 1997 1998 1999 2000 2001 2002 2003 2004 2005 Average
One-way(total) 3159.62 2880.57 2929.81 3221.23 3269.26 3362.74 3596.27 3749.85 3941.76 3345.68export:Japan is lower 2785.99 2515.73 2548.60 2757.61 2840.48 2883.68 2973.46 3028.70 3208.32 2838.06export:Japan is higher 373.63 364.84 381.21 463.62 428.78 479.06 622.81 721.16 733.44 507.61
Intra-industry(total) 16.35 5.63 3.14 1.36 28.45 32.21 57.68 16.23 7.57 18.74Horizontal 0.13 3.29 0.00 0.00 23.74 0.30 50.15 14.72 0.41 10.30Vertical 16.22 2.33 3.14 1.36 4.72 31.91 7.54 1.51 7.12 8.43export:Japan is lower 7.22 0.44 2.02 1.04 4.37 31.51 5.66 0.25 6.15 6.52export:Japan is higher 9.00 1.89 1.13 0.32 0.35 0.40 1.88 1.26 0.97 1.91
Not classified 0.00 0.00 0.00 0.00 0.00 0.00 0.00 0.00 0.05 0.01Total 3175.97 2886.20 2932.95 3222.59 3297.72 3394.95 3653.95 3766.08 3949.33 3364.41
24
Table 3.Values of Oneway, Vertical and Horizontal IIT between Japan and East Asian Countries (Continue)
Data Source: Authors’ calculation based on World Trade Atlas
Japan and China 1997 1998 1999 2000 2001 2002 2003 2004 2005 Average
One-way(total) 6216.98 5725.65 6716.47 7765.13 8002.58 8469.51 9707.88 12416.93 13647.10 8740.91export:Japan is lower 5759.88 5239.06 6026.89 6841.50 6880.41 6734.24 7201.87 8781.32 9313.49 6975.41export:Japan is higher 457.10 486.59 689.58 923.63 1122.17 1735.28 2506.00 3635.61 4333.61 1765.51
Intra-industry(total) 38.34 28.96 22.33 38.45 35.37 50.93 40.75 59.90 59.18 41.58Horizontal 1.15 1.17 1.15 7.42 5.66 12.58 4.09 8.19 9.15 5.62Vertical 37.12 27.72 19.39 30.97 29.68 38.31 36.42 51.69 50.03 35.70export:Japan is lower 22.61 21.41 17.58 23.79 23.45 20.93 25.32 30.57 28.34 23.78export:Japan is higher 14.51 6.31 1.81 7.18 6.23 17.38 11.10 21.12 21.69 11.93
Not classified 0.07 0.06 1.80 0.06 0.03 0.04 0.24 0.02 0.00 0.26Total 6255.32 5754.60 6738.80 7803.58 8037.95 8520.44 9748.63 12476.83 13706.28 8782.49
Japan and Singapore 1997 1998 1999 2000 2001 2002 2003 2004 2005 Average
One-way(total) 1509.59 1328.36 1630.89 2030.57 2121.10 2321.96 2478.59 3059.83 3271.34 2194.69export:Japan is lower 558.32 506.82 545.28 564.67 603.54 703.88 699.62 932.36 1030.56 682.78export:Japan is higher 951.27 821.54 1085.62 1465.90 1517.56 1618.08 1778.98 2127.47 2240.77 1511.91
Intra-industry(total) 4.18 5.95 5.32 5.37 4.09 3.99 5.55 4.87 3.33 4.74Horizontal 3.70 3.88 1.32 1.24 1.00 1.15 0.55 1.83 1.03 1.74Vertical 0.47 2.07 4.00 4.12 3.09 2.84 5.00 3.04 2.30 2.99export:Japan is lower 0.00 0.00 0.00 0.12 0.68 0.00 0.00 0.03 0.52 0.15export:Japan is higher 0.47 2.07 4.00 4.00 2.42 2.84 5.00 3.01 1.78 2.84
Not classified 0.00 0.00 0.00 0.00 0.00 0.00 0.01 0.00 0.00 0.00Total 1513.76 1334.32 1636.21 2035.94 2125.19 2325.95 2484.15 3064.70 3274.67 2199.43
Japan and Korea 1997 1998 1999 2000 2001 2002 2003 2004 2005 Average
One-way(total) 2684.74 2501.18 3112.93 3495.74 3128.32 3099.90 3287.51 4040.79 4167.96 3279.90export:Japan is lower 1955.34 2009.66 2302.37 2175.45 1840.54 1738.46 1749.65 2102.62 2218.48 2010.28export:Japan is higher 729.40 491.51 810.56 1320.29 1287.78 1361.44 1537.86 1938.18 1949.47 1269.61
Intra-industry(total) 35.55 14.98 11.59 21.83 29.97 18.38 19.38 46.88 53.79 28.04Horizontal 1.66 1.53 2.50 9.32 1.16 6.37 2.02 3.23 2.15 3.33Vertical 33.88 13.46 9.09 12.51 28.81 11.85 15.62 41.44 51.63 24.26export:Japan is lower 25.01 10.13 6.10 7.65 14.26 4.07 2.97 27.24 35.34 14.75export:Japan is higher 8.88 3.33 2.99 4.85 14.54 7.78 12.65 14.20 16.29 9.50
Not classified 0.01 0.00 0.00 0.00 0.00 0.16 1.74 2.21 0.00 0.46Total 2720.29 2516.16 3124.52 3517.57 3158.29 3118.28 3306.89 4087.67 4221.74 3307.93
Japan and Taiwan 1997 1998 1999 2000 2001 2002 2003 2004 2005 Average
One-way(total) 3020.14 2603.68 2798.90 3207.67 2887.88 3137.87 3203.31 3778.05 4213.32 3205.65export:Japan is lower 1940.02 1438.14 1540.27 1666.67 1533.95 1777.48 1832.34 2316.52 2430.34 1830.64export:Japan is higher 1080.12 1165.54 1258.63 1541.00 1353.93 1360.40 1370.97 1461.53 1782.98 1375.01
0.00Intra-industry(total) 22.85 17.74 13.29 14.69 14.92 11.35 18.30 20.10 18.46 16.86Horizontal 1.75 0.07 2.19 2.68 0.00 0.17 0.53 0.71 1.35 1.05Vertical 21.04 17.64 11.08 11.97 14.91 11.16 17.73 19.22 17.07 15.76export:Japan is lower 10.81 7.28 5.44 5.51 6.28 4.16 6.00 8.20 8.33 6.89export:Japan is higher 10.23 10.36 5.63 6.47 8.63 7.01 11.73 11.02 8.74 8.87
Not classified 0.06 0.02 0.02 0.03 0.01 0.02 0.03 0.17 0.05 0.05Total 3042.99 2621.42 2812.19 3222.35 2902.80 3149.22 3221.61 3798.15 4231.79 3222.50
25
Table4. Share of Each Trade between Japan and East Asian Countrires (thousnad US dollars, %)
Japan and Indonesia 1997-2005 Share ValueTotal
Industry I>J J>I I>J J>I
0101-0106 LIVE ANIMALS 28.67 71.33 0.00 0.00 0.00 0.00 100.00 2585510201-0210 MEAT 98.87 1.13 0.00 0.00 0.00 0.00 100.00 28370301-0307 FISH AND SEAFOOD 98.96 0.25 0.59 0.01 0.20 0.00 100.00 7569180401-0410 DAIRY,EGGS,HONEY,ETC 87.66 12.34 0.00 0.00 0.00 0.00 100.00 3380501-0511 OTHER OF ANIMAL ORIGIN 94.96 3.86 1.19 0.00 0.00 0.00 100.00 31940601-0604 LIVE TREES AND PLANTS 99.68 0.32 0.00 0.00 0.00 0.00 100.00 22930701-0714 VEGETABLES 98.76 1.23 0.00 0.01 0.00 0.00 100.00 47780801-0814 EDIBLE FRUIT AND NUTS 74.02 25.98 0.00 0.00 0.00 0.00 100.00 10120901-0910 SPICES,COFFEE AND TEA 99.35 0.09 0.02 0.36 0.17 0.00 100.00 983341001-1008 CEREALS 7.85 92.15 0.00 0.00 0.00 0.00 100.00 233781101-1109 MILLING;MALT;STARCH 81.00 19.00 0.00 0.00 0.00 0.00 100.00 36921201-1214 MISC GRAIN,SEED,FRUIT 77.68 21.73 0.21 0.38 0.00 0.00 100.00 51731301-1302 LAC;VEGETABL SAP,EXTRCT67.01 12.99 3.11 16.89 0.00 0.00 100.00 33791401-1404 OTHER VEGETABLE 97.79 2.04 0.00 0.17 0.00 0.00 100.00 19521501-1522 FATS AND OILS 69.51 29.27 0.00 1.23 0.00 0.00 100.00 75391601-1605 PREPARED MEAT,FISH,ETC 99.63 0.37 0.00 0.00 0.00 0.00 100.00 1493271701-1704 SUGARS 90.31 9.61 0.00 0.08 0.00 0.00 100.00 65721801-1806 COCOA 99.40 0.26 0.00 0.16 0.17 0.00 100.00 75581901-1905 BAKING RELATED 69.18 30.82 0.00 0.00 0.00 0.00 100.00 71252001-2009 PRESERVED FOOD 97.28 2.72 0.00 0.00 0.00 0.00 100.00 176812101-2106 MISCELLANEOUS FOOD 60.99 38.95 0.00 0.00 0.00 0.07 100.00 124852201-2209 BEVERAGES 90.24 8.70 0.00 1.07 0.00 0.00 100.00 12057.7042301-2309 FOOD WASTE; ANIMAL FEED90.31 9.68 0.00 0.00 0.02 0.00 100.00 23390.3532401-2403 TOBACCO 99.39 0.00 0.00 0.00 0.00 0.61 100.00 1147.6635Total 83.51 15.95 0.33 0.09 0.12 0.00 100.00 1410712.5
Japan and Malaysia 1997-2005 Share ValueTotal
Industry M>J J>M M>J J>M
0101-0106 LIVE ANIMALS 45.19 54.81 0.00 0.00 0.00 0.00 100.00 7092620201-0210 MEAT 99.48 0.52 0.00 0.00 0.00 0.00 100.00 29380301-0307 FISH AND SEAFOOD 96.08 3.55 0.00 0.14 0.22 0.00 100.00 805800401-0410 DAIRY,EGGS,HONEY,ETC 74.30 25.70 0.00 0.00 0.00 0.00 100.00 2680501-0511 OTHER OF ANIMAL ORIGIN 88.28 11.72 0.00 0.00 0.00 0.00 100.00 970601-0604 LIVE TREES AND PLANTS 99.93 0.07 0.00 0.00 0.00 0.00 100.00 204050701-0714 VEGETABLES 63.91 36.09 0.00 0.00 0.00 0.00 100.00 1770801-0814 EDIBLE FRUIT AND NUTS 21.47 78.53 0.00 0.00 0.00 0.00 100.00 2120901-0910 SPICES,COFFEE AND TEA 98.78 1.19 0.00 0.00 0.03 0.00 100.00 221781001-1008 CEREALS 56.86 43.14 0.00 0.00 0.00 0.00 100.00 451101-1109 MILLING;MALT;STARCH 81.99 18.01 0.00 0.00 0.00 0.00 100.00 46661201-1214 MISC GRAIN,SEED,FRUIT 84.32 15.68 0.00 0.00 0.00 0.00 100.00 16581301-1302 LAC;VEGETABL SAP,EXTRCT 9.71 90.29 0.00 0.00 0.00 0.00 100.00 7101401-1404 OTHER VEGETABLE 94.27 5.73 0.00 0.00 0.00 0.00 100.00 5031501-1522 FATS AND OILS 98.86 0.86 0.28 0.00 0.00 0.00 100.00 2398471601-1605 PREPARED MEAT,FISH,ETC 86.11 13.84 0.00 0.05 0.00 0.00 100.00 97501701-1704 SUGARS 52.03 47.97 0.00 0.00 0.00 0.00 100.00 8971801-1806 COCOA 99.92 0.08 0.00 0.00 0.00 0.00 100.00 136721901-1905 BAKING RELATED 80.22 17.94 0.00 1.84 0.00 0.00 100.00 67652001-2009 PRESERVED FOOD 93.68 6.32 0.00 0.00 0.00 0.00 100.00 51162101-2106 MISCELLANEOUS FOOD 56.08 43.92 0.00 0.00 0.00 0.00 100.00 143142201-2209 BEVERAGES 66.18 28.21 0.00 5.61 0.00 0.00 100.00 69312301-2309 FOOD WASTE; ANIMAL FEED60.70 39.30 0.00 0.00 0.00 0.00 100.00 40882401-2403 TOBACCO 49.91 1.20 48.89 0.00 0.00 0.00 100.00 5541Total 64.06 35.57 0.29 0.05 0.02 0.00 100.00 1150621
One-way Intra-industry
Hori-
zontal
Not
ClassVertical (Export)Export
Export Vertical (Export) Hori-zontal
NotClass
26
Table4. Share of Each Trade between Japan and East Asian Countrires (thousnad US dollars, %) (Continue)
Japan and Philippine 1997-2005 Share ValueTotal
Industry P>J J>P P>J J>P
0101-0106 LIVE ANIMALS 30.70 69.30 0.00 0.00 0.00 0.00 100.00 63028210201-0210 MEAT 95.30 4.70 0.00 0.00 0.00 0.00 100.00 84080301-0307 FISH AND SEAFOOD 94.06 1.75 0.18 0.02 3.99 0.00 100.00 14114460401-0410 DAIRY,EGGS,HONEY,ETC 5.46 94.54 0.00 0.00 0.00 0.00 100.00 14830501-0511 OTHER OF ANIMAL ORIGIN 83.10 15.30 0.00 1.59 0.00 0.00 100.00 90060601-0604 LIVE TREES AND PLANTS 99.70 0.14 0.00 0.16 0.00 0.00 100.00 94800701-0714 VEGETABLES 99.85 0.15 0.00 0.00 0.00 0.00 100.00 1916180801-0814 EDIBLE FRUIT AND NUTS 99.99 0.01 0.00 0.00 0.00 0.00 100.00 42761010901-0910 SPICES,COFFEE AND TEA 6.16 89.38 4.46 0.00 0.00 0.00 100.00 14091001-1008 CEREALS 98.95 1.05 0.00 0.00 0.00 0.00 100.00 10591101-1109 MILLING;MALT;STARCH 57.93 42.07 0.00 0.00 0.00 0.00 100.00 51481201-1214 MISC GRAIN,SEED,FRUIT 61.60 33.49 0.00 4.91 0.00 0.00 100.00 323061301-1302 LAC;VEGETABL SAP,EXTRCT94.16 5.84 0.00 0.00 0.00 0.00 100.00 139131401-1404 OTHER VEGETABLE 99.05 0.95 0.00 0.00 0.00 0.00 100.00 65701501-1522 FATS AND OILS 99.16 0.66 0.00 0.18 0.00 0.00 100.00 2363391601-1605 PREPARED MEAT,FISH,ETC 94.15 5.83 0.00 0.02 0.00 0.00 100.00 1445131701-1704 SUGARS 97.66 2.34 0.00 0.00 0.00 0.00 100.00 478821801-1806 COCOA 45.32 54.68 0.00 0.00 0.00 0.00 100.00 148201901-1905 BAKING RELATED 58.91 41.09 0.00 0.00 0.00 0.00 100.00 227972001-2009 PRESERVED FOOD 99.46 0.54 0.00 0.00 0.00 0.00 100.00 2053102101-2106 MISCELLANEOUS FOOD 66.41 33.59 0.00 0.00 0.00 0.00 100.00 1044212201-2209 BEVERAGES 67.85 30.14 0.08 0.44 1.49 0.00 100.00 59504.6912301-2309 FOOD WASTE; ANIMAL FEED91.59 7.77 0.64 0.00 0.00 0.00 100.00 62428.6792401-2403 TOBACCO 0.20 0.30 0.00 0.00 0.00 0.00 100.00 0Total 65.30 34.22 0.02 0.02 0.43 0.00 100.00 13196429
Japan and Thailand 1997-2005 Share ValueTotal
Industry T>J J>T T>J J>T
0101-0106 LIVE ANIMALS 53.93 46.07 0.00 0.00 0.00 0.00 100.00 81243870201-0210 MEAT 99.98 0.02 0.00 0.00 0.00 0.00 100.00 19137550301-0307 FISH AND SEAFOOD 90.13 7.59 0.86 0.00 1.42 0.00 100.00 62892780401-0410 DAIRY,EGGS,HONEY,ETC 94.93 4.27 0.16 0.64 0.00 0.00 100.00 299290501-0511 OTHER OF ANIMAL ORIGIN 98.41 1.57 0.00 0.02 0.00 0.00 100.00 955570601-0604 LIVE TREES AND PLANTS 99.95 0.02 0.00 0.00 0.03 0.00 100.00 2967540701-0714 VEGETABLES 99.82 0.18 0.00 0.00 0.00 0.00 100.00 6070520801-0814 EDIBLE FRUIT AND NUTS 87.54 12.46 0.00 0.00 0.00 0.00 100.00 1077570901-0910 SPICES,COFFEE AND TEA 97.28 2.72 0.00 0.01 0.00 0.00 100.00 2526191001-1008 CEREALS 99.97 0.03 0.00 0.00 0.00 0.00 100.00 3680181101-1109 MILLING;MALT;STARCH 77.19 22.77 0.00 0.00 0.05 0.00 100.00 2298081201-1214 MISC GRAIN,SEED,FRUIT 75.92 18.02 0.00 6.06 0.00 0.00 100.00 1217101301-1302 LAC;VEGETABL SAP,EXTRCT94.79 4.26 0.00 0.95 0.00 0.00 100.00 810471401-1404 OTHER VEGETABLE 98.68 1.32 0.00 0.00 0.00 0.00 100.00 292431501-1522 FATS AND OILS 83.65 14.25 0.17 1.38 0.56 0.00 100.00 789821601-1605 PREPARED MEAT,FISH,ETC 99.66 0.34 0.00 0.00 0.00 0.00 100.00 58592801701-1704 SUGARS 99.35 0.65 0.00 0.00 0.00 0.00 100.00 14122421801-1806 COCOA 93.03 4.39 2.59 0.00 0.00 0.00 100.00 473581901-1905 BAKING RELATED 97.13 2.60 0.00 0.27 0.00 0.00 100.00 7478482001-2009 PRESERVED FOOD 99.54 0.46 0.00 0.00 0.00 0.00 100.00 9106012101-2106 MISCELLANEOUS FOOD 84.36 14.96 0.00 0.58 0.10 0.00 100.00 6697032201-2209 BEVERAGES 90.14 8.41 0.64 0.48 0.33 0.00 100.00 2855222301-2309 FOOD WASTE; ANIMAL FEED96.69 3.13 0.08 0.02 0.08 0.00 100.00 16933432401-2403 TOBACCO 91.09 8.91 0.00 0.00 0.00 0.00 100.00 27887Total 84.36 15.09 0.19 0.06 0.31 0.00 100.00 30279681
One-way Intra-industryExport Vertical (Export) Hori-
zontalNotClass
One-way Intra-industryExport Vertical (Export) Hori-
zontal
Not
Class
27
Table4. Share of Each Trade between Japan and East Asian Countrires (thousnad US dollars, %) (Continue)
Japan and China 1997-2005 Share ValueTotal
Industry C>J J>C C>J J>C
0101-0106 LIVE ANIMALS 22.94 77.06 0.00 0.00 0.00 0.00 100 20596440201-0210 MEAT 99.84 0.12 0.00 0.04 0.00 0.00 100 2620570301-0307 FISH AND SEAFOOD 91.68 6.17 1.75 0.14 0.25 0.00 100 12575490401-0410 DAIRY,EGGS,HONEY,ETC 98.67 1.31 0.00 0.00 0.02 0.00 100 459380501-0511 OTHER OF ANIMAL ORIGIN 99.41 0.48 0.11 0.01 0.00 0.00 100 1955820601-0604 LIVE TREES AND PLANTS 94.16 3.37 0.00 2.42 0.00 0.05 100 298950701-0714 VEGETABLES 99.95 0.04 0.00 0.00 0.01 0.00 100 10326390801-0814 EDIBLE FRUIT AND NUTS 99.88 0.11 0.01 0.00 0.00 0.00 100 1708040901-0910 SPICES,COFFEE AND TEA 99.24 0.73 0.00 0.03 0.00 0.00 100 1829571001-1008 CEREALS 99.98 0.02 0.00 0.00 0.00 0.00 100 1262771101-1109 MILLING;MALT;STARCH 70.52 29.17 0.00 0.28 0.02 0.02 100 91181201-1214 MISC GRAIN,SEED,FRUIT 96.57 2.23 0.00 1.12 0.07 0.00 100 3312331301-1302 LAC;VEGETABL SAP,EXTRCT92.07 3.27 0.02 3.95 0.69 0.00 100 287081401-1404 OTHER VEGETABLE 99.40 0.60 0.00 0.00 0.00 0.00 100 274171501-1522 FATS AND OILS 67.15 25.63 0.33 6.58 0.29 0.03 100 173381601-1605 PREPARED MEAT,FISH,ETC 99.54 0.46 0.00 0.00 0.00 0.00 100 16767321701-1704 SUGARS 78.67 20.75 0.00 0.32 0.04 0.21 100 140471801-1806 COCOA 75.01 5.39 2.94 14.12 2.54 0.00 100 94121901-1905 BAKING RELATED 94.09 5.75 0.00 0.16 0.00 0.00 100 1523222001-2009 PRESERVED FOOD 99.80 0.20 0.00 0.00 0.00 0.00 100 7391942101-2106 MISCELLANEOUS FOOD 62.19 37.20 0.00 0.31 0.17 0.14 100 1354812201-2209 BEVERAGES 92.29 3.52 1.42 1.03 1.75 0.00 100 807212301-2309 FOOD WASTE; ANIMAL FEED96.86 3.14 0.00 0.00 0.00 0.00 100 1790312401-2403 TOBACCO 97.35 0.34 0.00 2.31 0.00 0.00 100 18398Total 79.42 20.10 0.27 0.14 0.06 0.00 100 8782492
Japan and Singapore 1997-2005 Share ValueTotal
Industry S>J J>S S>J J>S
0101-0106 LIVE ANIMALS 23.11 76.89 0.00 0.00 0.00 0.00 100.00 18625730201-0210 MEAT 18.86 81.14 0.00 0.00 0.00 0.00 100.00 2580301-0307 FISH AND SEAFOOD 81.79 17.05 0.28 0.52 0.35 0.00 100.00 526790401-0410 DAIRY,EGGS,HONEY,ETC 50.82 49.18 0.00 0.00 0.00 0.00 100.00 5720501-0511 OTHER OF ANIMAL ORIGIN 26.06 73.94 0.00 0.00 0.00 0.00 100.00 540601-0604 LIVE TREES AND PLANTS 99.80 0.19 0.00 0.01 0.00 0.00 100.00 96590701-0714 VEGETABLES 0.54 99.46 0.00 0.00 0.00 0.00 100.00 7780801-0814 EDIBLE FRUIT AND NUTS 1.67 98.33 0.00 0.00 0.00 0.00 100.00 10750901-0910 SPICES,COFFEE AND TEA 60.63 37.95 0.00 1.42 0.00 0.00 100.00 39861001-1008 CEREALS 3.63 96.37 0.00 0.00 0.00 0.00 100.00 2391101-1109 MILLING;MALT;STARCH 0.14 99.86 0.00 0.00 0.00 0.00 100.00 80241201-1214 MISC GRAIN,SEED,FRUIT 21.16 78.51 0.20 0.12 0.00 0.00 100.00 15291301-1302 LAC;VEGETABL SAP,EXTRCT20.42 77.83 0.00 1.75 0.00 0.00 100.00 4551401-1404 OTHER VEGETABLE 80.04 19.96 0.00 0.00 0.00 0.00 100.00 1921501-1522 FATS AND OILS 65.52 27.28 0.00 7.19 0.01 0.00 100.00 172041601-1605 PREPARED MEAT,FISH,ETC 3.83 96.17 0.00 0.00 0.00 0.00 100.00 61831701-1704 SUGARS 9.51 90.49 0.00 0.00 0.00 0.00 100.00 32291801-1806 COCOA 95.63 2.24 0.00 0.81 1.31 0.00 100.00 735681901-1905 BAKING RELATED 90.56 8.88 0.00 0.55 0.00 0.00 100.00 805612001-2009 PRESERVED FOOD 15.98 84.02 0.00 0.00 0.00 0.00 100.00 11532101-2106 MISCELLANEOUS FOOD 74.12 25.88 0.00 0.00 0.00 0.00 100.00 519802201-2209 BEVERAGES 23.27 64.61 0.00 3.28 8.83 0.00 100.00 67122301-2309 FOOD WASTE; ANIMAL FEED35.14 64.86 0.00 0.00 0.00 0.00 100.00 21482401-2403 TOBACCO 0.00 ###### 0.00 0.00 0.00 0.00 100.00 14621Total 31.04 68.74 0.01 0.13 0.08 0.00 100.00 2199431
One-way Intra-industryExport Vertical (Export) Hori-
zontalNotClass
One-way Intra-industryExport Vertical (Export) Hori-
zontalNotClass
28
Table4. Share of Each Trade between Japan and East Asian Countrires (thousnad US dollars, %) (Continue)
Japan and Korea 1997-2005 Share ValueTotal
Industry K>J J>K K>J J>K
0101-0106 LIVE ANIMALS 26.86 73.14 0.00 0.00 0.00 0.00 100.00 13871710201-0210 MEAT 99.58 0.42 0.00 0.00 0.00 0.00 100.00 1254590301-0307 FISH AND SEAFOOD 85.86 13.11 0.96 0.02 0.04 0.00 100.00 7956230401-0410 DAIRY,EGGS,HONEY,ETC 64.83 31.42 0.00 0.00 3.76 0.00 100.00 18610501-0511 OTHER OF ANIMAL ORIGIN 65.80 34.13 0.07 0.00 0.00 0.00 100.00 93030601-0604 LIVE TREES AND PLANTS 98.01 1.67 0.08 0.19 0.05 0.00 100.00 170130701-0714 VEGETABLES 99.39 0.55 0.00 0.00 0.06 0.00 100.00 845920801-0814 EDIBLE FRUIT AND NUTS 99.85 0.02 0.02 0.01 0.10 0.00 100.00 728610901-0910 SPICES,COFFEE AND TEA 85.29 14.34 0.11 0.26 0.00 0.00 100.00 74241001-1008 CEREALS 83.83 16.17 0.00 0.00 0.00 0.00 100.00 351101-1109 MILLING;MALT;STARCH 55.15 33.89 0.00 10.96 0.00 0.00 100.00 9231201-1214 MISC GRAIN,SEED,FRUIT 84.08 12.43 1.89 1.48 0.11 0.01 100.00 1027961301-1302 LAC;VEGETABL SAP,EXTRCT85.61 12.91 0.00 0.81 0.67 0.00 100.00 457461401-1404 OTHER VEGETABLE 91.53 7.74 0.00 0.73 0.00 0.00 100.00 9271501-1522 FATS AND OILS 10.18 69.32 7.35 13.15 0.00 0.00 100.00 147801601-1605 PREPARED MEAT,FISH,ETC 96.21 1.81 1.47 0.05 0.46 0.00 100.00 1619351701-1704 SUGARS 26.23 63.87 0.00 1.97 7.92 0.00 100.00 139141801-1806 COCOA 89.62 6.54 0.96 2.88 0.00 0.00 100.00 243681901-1905 BAKING RELATED 93.19 4.74 0.02 2.03 0.02 0.00 100.00 693702001-2009 PRESERVED FOOD 95.11 4.89 0.00 0.00 0.00 0.00 100.00 883742101-2106 MISCELLANEOUS FOOD 63.16 36.38 0.00 0.03 0.00 0.42 100.00 1044122201-2209 BEVERAGES 93.92 2.91 0.22 2.52 0.42 0.00 100.00 1104902301-2309 FOOD WASTE; ANIMAL FEED47.33 52.28 0.28 0.06 0.00 0.04 100.00 293592401-2403 TOBACCO 0.91 96.32 2.71 0.00 0.07 0.00 100.00 39198Total 60.77 38.38 0.45 0.29 0.10 0.01 100.00 3307934
Japan and Taiwan 1997-2005 Share ValueTotal
Industry T>J J>T T>J J>T
0101-0106 LIVE ANIMALS 41.41 58.59 0.00 0.00 0.00 0.00 100.00 16562100201-0210 MEAT 98.29 1.70 0.01 0.00 0.00 0.00 100.00 412310301-0307 FISH AND SEAFOOD 97.09 2.75 0.00 0.17 0.00 0.00 100.00 7493230401-0410 DAIRY,EGGS,HONEY,ETC 58.73 40.98 0.11 0.18 0.00 0.00 100.00 32260501-0511 OTHER OF ANIMAL ORIGIN 95.59 4.23 0.18 0.00 0.00 0.00 100.00 786580601-0604 LIVE TREES AND PLANTS 87.96 2.30 7.99 1.06 0.62 0.08 100.00 334360701-0714 VEGETABLES 87.89 10.64 0.70 0.67 0.10 0.00 100.00 756570801-0814 EDIBLE FRUIT AND NUTS 67.52 31.43 0.08 0.84 0.12 0.00 100.00 609910901-0910 SPICES,COFFEE AND TEA 92.98 7.02 0.00 0.00 0.00 0.00 100.00 219181001-1008 CEREALS 8.45 91.55 0.00 0.00 0.00 0.00 100.00 4661101-1109 MILLING;MALT;STARCH 5.06 94.94 0.00 0.00 0.00 0.00 100.00 24321201-1214 MISC GRAIN,SEED,FRUIT 51.86 38.72 7.37 1.95 0.00 0.10 100.00 195761301-1302 LAC;VEGETABL SAP,EXTRCT61.67 33.47 0.66 4.20 0.00 0.00 100.00 66021401-1404 OTHER VEGETABLE 88.86 1.90 0.00 9.24 0.00 0.00 100.00 22161501-1522 FATS AND OILS 30.80 49.76 14.96 2.37 2.11 0.00 100.00 91121601-1605 PREPARED MEAT,FISH,ETC 65.62 34.23 0.00 0.00 0.16 0.00 100.00 1055401701-1704 SUGARS 8.08 88.66 0.00 3.26 0.00 0.00 100.00 118571801-1806 COCOA 0.30 96.30 3.41 0.00 0.00 0.00 100.00 75041901-1905 BAKING RELATED 23.06 67.46 0.00 9.09 0.38 0.00 100.00 407482001-2009 PRESERVED FOOD 72.93 27.03 0.04 0.00 0.00 0.00 100.00 191822101-2106 MISCELLANEOUS FOOD 27.28 71.97 0.08 0.66 0.01 0.00 100.00 736152201-2209 BEVERAGES 6.29 92.52 0.00 0.91 0.28 0.00 100.00 612072301-2309 FOOD WASTE; ANIMAL FEED39.74 57.89 2.27 0.08 0.00 0.01 100.00 137662401-2403 TOBACCO 0.07 99.93 0.00 0.00 0.00 0.00 100.00 128027Total 56.81 42.67 0.21 0.28 0.03 0.00 100.00 3222502
One-way Intra-industryExport Vertical (Export) Hori-
zontalNotClass
One-way Intra-industryExport Vertical (Export) Hori-
zontalNotClass
29
Table 5. Coefficient estimates of determinants of vertical IIT between Japan and East Asian countries
Notes: ***, **, and * show 1%, 5%, and 10% levels of significance, respectively. In parentheses are t statistics.
VIIT VIIThConstant 0.076 0.023
(0.93) (0.97)DGDPC 0.002* -0.0005
(1.93) (-1.63)GDPi -0.01* -0.0019
(-1.82) (-1.17)GDPj 0.004*** 0.0012***
(4.72) (4.20)DISTANCE 0.003** 0.0004
(2.64) (1.00)DLAND -0.002*** -0.0006***
(-4.01) (-3.76)R-sq 0.339 0.544Obs. 71 68
Independentvariable
Dependent variable