Asia Pac J Clin Nutr 2019;28(Suppl 1):S17-S31 S17 Original Article Intrauterine growth retardation (IUGR) as determinant and environment as modulator of infant mortality and morbidity: the Tanjungsari Cohort Study in Indonesia Bachti Alisjahbana MD, PhD 1,2 , Dwi Savitri Rivami MD, PhD 3 , Lestari Octavia MSc 4,5 , Nopi Susilawati MPH 2 , Mathilda Pangaribuan MD, MSc 5 , Anna Alisjahbana MD, PhD 5 , Aly Diana MD, PhD 6 1 Department of Internal Medicine, Faculty of Medicine, Universitas Padjadjaran, Hasan Sadikin Hospital, Bandung, Indonesia 2 Infectious Disease Research Center, Faculty of Medicine, Universitas Padjadjaran, Indonesia 3 Faculty of Medicine, Pelita Harapan University, Tangerang, Indonesia 4 Gunadarma University, Indonesia 5 Frontier for Health Foundation, Bandung, Indonesia 6 Nutrition Working Group, Faculty of Medicine, Universitas Padjadjaran, Bandung, Indonesia Background and Objectives: Intrauterine growth retardation (IUGR) is related to mortality and morbidity. However, defining IUGR by suitable field methods remains a challenge. A maternal-child Risk-Approach- Strategy (during 1988-1989) and follow-on Tanjungsari Cohort Study (TCS) (1989-1990), aimed to generate a practical classification of IUGR and explore its usage in predicting growth, mortality and morbidity of infants in the cohort. Study Design: Some 3892 singleton live-birth infants were followed. IUGR was defined by birth weight (BW) and length (BL) classified as: acute, chronic, non-IUGR or ‘probably preterm’. Growth, mortality, and survival curve were calculated to prove that the classification identified the most vulnerable infants. Fever >3 days and diarrhoea were assessed based on IUGR classification, sex, exclusive breastfeeding, and environmental factors. Results: IUGR infant weight and length did not catch-up with the non-IUGR in the first year. Infant mor- tality rate was 44.7 per 1000 where some 61% died within 90 days. Using age specific mortality by BW, 23.6% of all deaths occurred when it was <2500 g compared to 66.2% from IUGR and preterm groups. Fever and diar- rhoea rates increased over 12 months. Diarrhoea was associated with poor source-of-drinking-water and latrine. Conclusion: The IUGR classification predicted one-year growth curves and survival, besides age and sex. IUGR based on BW and BL identified a larger group of at-risk infants than did low BW. High morbidity rates were part- ly explained by poor environmental conditions. IUGR inclusive of BL has value in optimizing nutritional status in the first 1000 days of life. Key Words: birth weight, birth length, water supply, latrines, fever, diarrhoea, first-1000-days-of -life INTRODUCTION Approximately 3 million children under the age of five die each year with the highest rate in the first year of life. 1 Preterm birth complications include Intrauterine Growth Retardation (IUGR), which is reflected in low birth weight (LBW) is the most crucial factor affecting neona- tal mortality and a significant determinant of post- neonatal mortality. 2–11 IUGR and LBW are healthcare problems, numerous in developing countries, 12 hampering healthy growth and development during the first 1,000 days of a child’s life and increasing morbidity. 5,8,11,13 In addition LBW and IUGR may affect child development and intellectual potential. 14 In developing countries, the overall prevalence of LBW is 16% (range: 9-35%). 15 Globally, the number of babies born with LBW is almost 22 million, with the highest incidence in Asia. 16 While birth weight is known to be a critical determinant of infant survival, 3,4,6-10 birth- weight-specific infant mortality rate (IMR) is scarce, and, when available, usually from hospitals or national demo- graphic and health surveys. This is particularly true for developing countries, 9,11,17 such as Indonesia 18-23 LBW is a concept traditionally used by epidemiologists for public health purposes, is defined as a birth weight <2500 g, but weight ≥2500 g did not exclude intrauterine growth Corresponding Author: Dr Dwi S Rivami, Faculty of Medi- cine, Universitas Pelita Harapan, Boulv. Jend. Sudirman 1, Lip- po Karawaci, Tangerang, Indonesia. Tel +62-21-54210131; Fax +62-21-54210133 Email [email protected]Manuscript received and initial review completed 17 October 2018. Revision accepted 03 December 2018. doi: 10.6133/apjcn.201901_28(S1).0002
Transcript
Asia Pac J Clin Nutr 2019;28(Suppl 1):S17-S31 S17
Original Article Intrauterine growth retardation (IUGR) as determinant and environment as modulator of infant mortality and morbidity: the Tanjungsari Cohort Study in Indonesia Bachti Alisjahbana MD, PhD1,2, Dwi Savitri Rivami MD, PhD3, Lestari Octavia MSc4,5, Nopi Susilawati MPH2, Mathilda Pangaribuan MD, MSc5, Anna Alisjahbana MD, PhD5, Aly Diana MD, PhD6 1Department of Internal Medicine, Faculty of Medicine, Universitas Padjadjaran, Hasan Sadikin Hospital, Bandung, Indonesia 2Infectious Disease Research Center, Faculty of Medicine, Universitas Padjadjaran, Indonesia 3Faculty of Medicine, Pelita Harapan University, Tangerang, Indonesia 4Gunadarma University, Indonesia 5Frontier for Health Foundation, Bandung, Indonesia 6Nutrition Working Group, Faculty of Medicine, Universitas Padjadjaran, Bandung, Indonesia
Background and Objectives: Intrauterine growth retardation (IUGR) is related to mortality and morbidity. However, defining IUGR by suitable field methods remains a challenge. A maternal-child Risk-Approach-Strategy (during 1988-1989) and follow-on Tanjungsari Cohort Study (TCS) (1989-1990), aimed to generate a practical classification of IUGR and explore its usage in predicting growth, mortality and morbidity of infants in the cohort. Study Design: Some 3892 singleton live-birth infants were followed. IUGR was defined by birth weight (BW) and length (BL) classified as: acute, chronic, non-IUGR or ‘probably preterm’. Growth, mortality, and survival curve were calculated to prove that the classification identified the most vulnerable infants. Fever >3 days and diarrhoea were assessed based on IUGR classification, sex, exclusive breastfeeding, and environmental factors. Results: IUGR infant weight and length did not catch-up with the non-IUGR in the first year. Infant mor-tality rate was 44.7 per 1000 where some 61% died within 90 days. Using age specific mortality by BW, 23.6% of all deaths occurred when it was <2500 g compared to 66.2% from IUGR and preterm groups. Fever and diar-rhoea rates increased over 12 months. Diarrhoea was associated with poor source-of-drinking-water and latrine. Conclusion: The IUGR classification predicted one-year growth curves and survival, besides age and sex. IUGR based on BW and BL identified a larger group of at-risk infants than did low BW. High morbidity rates were part-ly explained by poor environmental conditions. IUGR inclusive of BL has value in optimizing nutritional status in the first 1000 days of life.
Key Words: birth weight, birth length, water supply, latrines, fever, diarrhoea, first-1000-days-of -life INTRODUCTION Approximately 3 million children under the age of five die each year with the highest rate in the first year of life.1 Preterm birth complications include Intrauterine Growth Retardation (IUGR), which is reflected in low birth weight (LBW) is the most crucial factor affecting neona-tal mortality and a significant determinant of post-neonatal mortality.2–11 IUGR and LBW are healthcare problems, numerous in developing countries,12 hampering healthy growth and development during the first 1,000 days of a child’s life and increasing morbidity.5,8,11,13 In addition LBW and IUGR may affect child development and intellectual potential.14
In developing countries, the overall prevalence of LBW is 16% (range: 9-35%).15 Globally, the number of babies born with LBW is almost 22 million, with the highest incidence in Asia.16 While birth weight is known
to be a critical determinant of infant survival,3,4,6-10 birth-weight-specific infant mortality rate (IMR) is scarce, and, when available, usually from hospitals or national demo-graphic and health surveys. This is particularly true for developing countries,9,11,17 such as Indonesia18-23 LBW is a concept traditionally used by epidemiologists for public health purposes, is defined as a birth weight <2500 g, but weight ≥2500 g did not exclude intrauterine growth
Corresponding Author: Dr Dwi S Rivami, Faculty of Medi-cine, Universitas Pelita Harapan, Boulv. Jend. Sudirman 1, Lip-po Karawaci, Tangerang, Indonesia. Tel +62-21-54210131; Fax +62-21-54210133 Email [email protected] Manuscript received and initial review completed 17 October 2018. Revision accepted 03 December 2018. doi: 10.6133/apjcn.201901_28(S1).0002
S18 B Alisjahbana, D Rivami, L Octavia, N Susilawati, M Pangaribuan, A Alisjahbana and A Diana
retardation (IUGR) and preterm newborn who did not have LBW.24 In spite of its limitations, LBW is more of-ten used than an IUGR classification, because IUGR determination is not easy.
Standardized clinical methods (using the Ballard score or ultrasonographic examination) for identifying IUGR newborns are recognised,25,26 but cannot be employed in many rural areas with limited resources. IUGR has become an important indicator so far as its relation with child growth and development, and its con-sequences in later life. IUGR contributes significantly to the development of non-communicable disorders such as obesity, type 2 diabetes, hypertension and heart disease in adult life.27 In line with this in utero programming of dis-ease, Chatrath et al,28 among others,29,30 demonstrated that IUGR led to the development of less potent cellular im-munity, posing children a greater risk of severe infectious disease. Thus far, research in this topic has demonstrated that IUGR contributes to decreased growth in infancy and childhood;31 distorted lipid metabolism;32 the develop-ment of type 2 diabetes mellitus,33 cardiovascular diseas-es,34 microalbuminuria;35 delayed menarche;36 and an intergenerational cycle of LBW.37,38 Besides IUGR, many external factors contribute to the morbidity and mortality of infants. Amongst others are unhygienic and unsafe environments like low access to sanitation and shortage of water availability; diarrheal disease caused by contaminated water and food.13,20,39 Unsafe water sources, low access to sanitation and short-age of water availability contribute to around 1.5 million child deaths each year, with 88% of these deaths specifi-cally due to diarrhoea caused by contaminated water and food.40,41 During the 1990s, acute respiratory tract infec-tions, mostly pneumonia, and diarrhoea were the leading causes of deaths of infant in the developing world, ac-counting for 25% and 20%–25% of total deaths, respec-tively.42,43 But besides these deleterious exposures, breast-feeding is a factor that helps prevent morbidity in early life. Breast milk is a complete and ideal food for the first 4–6 months of life.44-50 Exclusive breastfeeding promotes development of the infant’s immunity and protects the infant from gastrointestinal and respiratory tract infec-tions, probably atopic/allergic diseases and diarrhoea.45,51–
62 To understand the complex interplay between IUGR and LBW, and their potential health outcomes in both early and later life, was one objective for the Tanjungsari Cohort Study. The Tanjungsari birth cohort is unique in several aspects. It covered population-based registration of all births and deaths over a period of more than 2 years, and infants were followed longitudinally for a year and more. The collected data allowed us to define IUGR using anthropometric indicators, and explore to what extent IUGR and LBW, including exclusivity breastfeeding, predict morbidity and mortality of infants. These favourable conditions allowed for the identification of peak mortality by age. Our data on IUGR in a cohort of children living in a rural area were also collected within limited means. In limited resource settings, it becomes necessary to identify children with retarded growth solely from anthropometric indicators.
Against this background, we set out to establish the
prevalence of LBW and IUGR classified by birth weight and length and assess the effect of LBW and IUGR on infant morbidity and mortality in an infant cohort born in the Tanjungsari Subdistrict. Additionally, we have ex-plored what postnatal factors might affect the growth and health trajectories in the first year of life. The follow-on studies are reported elsewhere.39,63-68 The 1988 Tanjung Sari perinatal health initiative Perinatal and maternal mortalities in West Java became of concern in the late 1970s to Dr Anna Alisjahbana and colleagues in public health and health services, and were confirmed by their systematic provincial and national documentation.63 Since some 90% of births took place at home, the Tanjungsari district of West Java was identified as a locality where a community-based risk management strategy might reduce the maternal-child health burden (Figure 1). In 1987, traditional birth attendants (TBA) were trained with a view to their ability and effectiveness to identify risk factors for unfavourable birth outcomes in community setting. From January 1st, 1988 to December 31st, 1989, some 4694 pregnant women in Tanjungsari were followed and assigned either a trained or untrained TBA. In the first year, early neonatal and maternal mor-tality rates (32.9 per 1000 and 170 per 100,000 deliveries respectively). Although possible to improve health work-er performance, and community engagement, the ultimate benefit of this approach has probably been less in evi-dence and limited through remoteness and both the peo-ple and material resource restraints ‘downstream’ of the TBA services. Three decades later, Indonesian neonatal and maternal mortality rates are 14 per 1000 and 126 per 100,000 live births in 2015 (globally 16.2 in 2009 and 216 in 2015), respectively. They still demand improve-ment, despite more births being hospital-based and many in birthing homes known as ‘polindes’ or at the ‘pusk-esmas’ (community health centre). The original 1988 cohort of women, their children and grandchildren are now providing opportunities to exam-ine the medium to long term outcomes of risk factors for health, including those which are nutritional, such as birth weight and growth.63 These studies are increasingly avail-able from this cohort study as health and nutrition inter-mediates rather than simply as endpoints.39,63-68 MATERIALS AND METHODS Tanjungsari Cohort Study (TCS) 1988–89 In 1987, Alisjahbana et al began a population-based co-hort study in Tanjungsari, a rural subdistrict of West Java, Indonesia (Figure 1).44,71 Its policy focus was a maternal-child Risk Approach Strategy (RAS). Pregnant women who agreed to join were enrolled in the study. Infants born in the period from 1 January 1988 through 31 March 1990 were followed up. Infants were excluded when in-fants were aborted, still-birth, or twin. Trained research interviewers visited the respondents at 7, 28, and 42 days and at 3, 6, 9, and 12 months. Thereafter, as reported elsewhere, a visit was made every 6 months until age 3 years and annually until age 5 years or until they died or were lost to follow-up (out-migration).64-68 The National Research and Development Board of the Ministry of
IUGR and environment hygiene affect infant health S19
Health of Indonesia approved this study and gave ethical clearance.
Anthropometric measurements The data of birth weight (BW), birth length (BL), and head circumference were collected within 48 hours of birth (except for stillbirths) according to standardised procedures and with the use of local-made spring scales, length boards, and flexible measuring tape.69,70 LBW is defined as birth weight <2500 g while normal birth weight (NBW) is categorized for birth weight ≥2500 g.71 Length, weight, and head circumference were also meas-ured in every follow-up until age 12 months. Length and head circumference were recorded to the nearest 0.1 cm. Babies were weighed without clothes, and the recorded weight was rounded to the nearest 100 g. Interview Information on the socioeconomic and demographic con-dition of families was collected during the first visit at
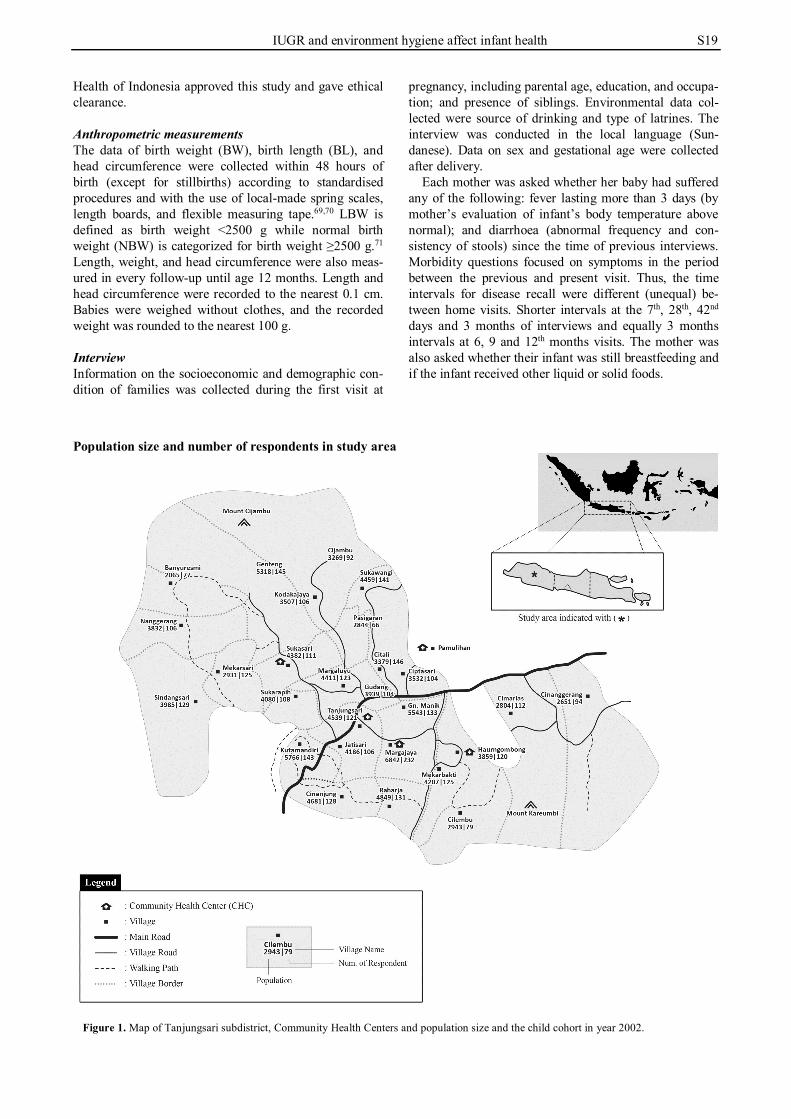
pregnancy, including parental age, education, and occupa-tion; and presence of siblings. Environmental data col-lected were source of drinking and type of latrines. The interview was conducted in the local language (Sun-danese). Data on sex and gestational age were collected after delivery. Each mother was asked whether her baby had suffered any of the following: fever lasting more than 3 days (by mother’s evaluation of infant’s body temperature above normal); and diarrhoea (abnormal frequency and con-sistency of stools) since the time of previous interviews. Morbidity questions focused on symptoms in the period between the previous and present visit. Thus, the time intervals for disease recall were different (unequal) be-tween home visits. Shorter intervals at the 7th, 28th, 42nd days and 3 months of interviews and equally 3 months intervals at 6, 9 and 12th months visits. The mother was also asked whether their infant was still breastfeeding and if the infant received other liquid or solid foods.
Population size and number of respondents in study area
Figure 1. Map of Tanjungsari subdistrict, Community Health Centers and population size and the child cohort in year 2002.
S20 B Alisjahbana, D Rivami, L Octavia, N Susilawati, M Pangaribuan, A Alisjahbana and A Diana
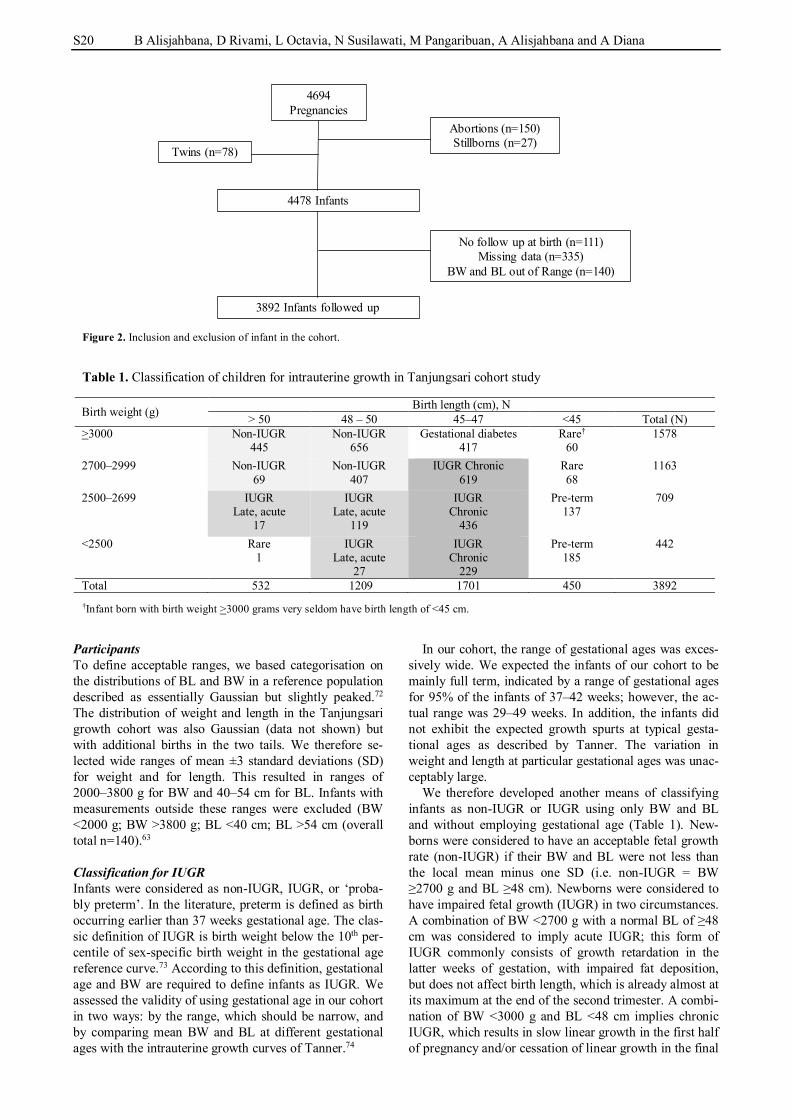
Participants To define acceptable ranges, we based categorisation on the distributions of BL and BW in a reference population described as essentially Gaussian but slightly peaked.72 The distribution of weight and length in the Tanjungsari growth cohort was also Gaussian (data not shown) but with additional births in the two tails. We therefore se-lected wide ranges of mean ±3 standard deviations (SD) for weight and for length. This resulted in ranges of 2000–3800 g for BW and 40–54 cm for BL. Infants with measurements outside these ranges were excluded (BW <2000 g; BW >3800 g; BL <40 cm; BL >54 cm (overall total n=140).63 Classification for IUGR Infants were considered as non-IUGR, IUGR, or ‘proba-bly preterm’. In the literature, preterm is defined as birth occurring earlier than 37 weeks gestational age. The clas-sic definition of IUGR is birth weight below the 10th per-centile of sex-specific birth weight in the gestational age reference curve.73 According to this definition, gestational age and BW are required to define infants as IUGR. We assessed the validity of using gestational age in our cohort in two ways: by the range, which should be narrow, and by comparing mean BW and BL at different gestational ages with the intrauterine growth curves of Tanner.74
In our cohort, the range of gestational ages was exces-sively wide. We expected the infants of our cohort to be mainly full term, indicated by a range of gestational ages for 95% of the infants of 37–42 weeks; however, the ac-tual range was 29–49 weeks. In addition, the infants did not exhibit the expected growth spurts at typical gesta-tional ages as described by Tanner. The variation in weight and length at particular gestational ages was unac-ceptably large. We therefore developed another means of classifying infants as non-IUGR or IUGR using only BW and BL and without employing gestational age (Table 1). New-borns were considered to have an acceptable fetal growth rate (non-IUGR) if their BW and BL were not less than the local mean minus one SD (i.e. non-IUGR = BW ≥2700 g and BL ≥48 cm). Newborns were considered to have impaired fetal growth (IUGR) in two circumstances. A combination of BW <2700 g with a normal BL of ≥48 cm was considered to imply acute IUGR; this form of IUGR commonly consists of growth retardation in the latter weeks of gestation, with impaired fat deposition, but does not affect birth length, which is already almost at its maximum at the end of the second trimester. A combi-nation of BW <3000 g and BL <48 cm implies chronic IUGR, which results in slow linear growth in the first half of pregnancy and/or cessation of linear growth in the final
4694Pregnancies
4478 Infants
Abortions (n=150)Stillborns (n=27)
No follow up at birth (n=111)Missing data (n=335)
BW and BL out of Range (n=140)
3892 Infants followed up
Twins (n=78)
Figure 2. Inclusion and exclusion of infant in the cohort. Table 1. Classification of children for intrauterine growth in Tanjungsari cohort study
Birth weight (g) Birth length (cm), N > 50 48 – 50 45–47 <45 Total (N)
>3000 Non-IUGR 445
Non-IUGR 656
Gestational diabetes 417
Rare† 60
1578
2700–2999 Non-IUGR 69
Non-IUGR 407
IUGR Chronic 619
Rare 68
1163
2500–2699 IUGR Late, acute
17
IUGR Late, acute
119
IUGR Chronic
436
Pre-term 137
709
<2500 Rare 1
IUGR Late, acute
27
IUGR Chronic
229
Pre-term 185
442
Total 532 1209 1701 450 3892 †Infant born with birth weight >3000 grams very seldom have birth length of <45 cm.
IUGR and environment hygiene affect infant health S21
weeks of pregnancy. The deficit in weight is proportional to that in length, because the fetus has not yet acquired body fat before 32–35 weeks of gestation and thus cannot lose this contributor to weight. Although the concept of acute and chronic IUGR may affect the consequences of IUGR in childhood and adulthood, we do not distinguish between these two types in this report and consider them both as IUGR. Newborns with BW ≤2500 g and BL <45 cm were most likely to have been born premature. The classification of non-IUGR, IUGR, and preterm infants is shown in Table 1. The numbers of infants classified as non-IUGR, IUGR, or preterm were 1577, 1447, and 322, respectively. Assessing the validity of IUGR classification by infant growth To validate that the classification identified the most vul-nerable infants, we examined growth in the first year of life. Growth was chosen because it reflects the total well-being of the child, the growth of a child is expected to continue in the growth channel determined at birth. Im-plicitly, a child with IUGR may never reach the weight and length of normal peers, but remain smaller and lighter. To detect growth retardation, weight and length were ex-pressed as z-scores, calculated using ‘WHO AnthroPlus 3.2.2’75 as the distributions for the reference population. We calculated weight-for-age z-score (WAZ) and height-for-age z-score (HAZ). Survival curves and mortality Within the first week of death, a physician visited the home to perform a verbal autopsy using a checklist of causes of death. The verbal autopsy did not differentiate between direct and indirect causes. All infants were fol-lowed from birth to 12 months or until they died or were lost to follow-up. Incomplete follow-ups (moved or not retraceable) were coded as censored in the life table anal-ysis. The lost to follow-up infants were still included in the analysis and coded as having censored follow-up times. The subjects that neither died nor were lost to fol-low-up were considered as censored after 365 days. Sur-vival times were analysed using the life table approach76 and survival curves were developed using the Kaplan–Meier method. The differences between curves were es-timated by hazard ratios (HRs).77 Age-specific infant mortality by birth weight and IUGR categories Age-specific (age at scheduled home visits) infant mortal-ity was calculated as the number deceased by age as a percentage of all deaths in specified birth weight and IUGR categories. Mortality probabilities were determined for: (1) non-IUGR; (2) late, acute IUGR; (3) chronic IUGR, and (4) preterm. Sample size constraints applied where number of deaths were only 5 of the 71 infant deaths which occurred in the late-acute IUGR group, for instance. The three most contrasting categories were re-tained: IUGR, non-IUGR, and preterm. Morbidity Morbidity at age 0, 7, 28, 42 days and 3–12 months was described as the proportion of infants having at least one
event of fever of more than 3 days or diarrhoea. The pro-portion of infants so affected was expressed were per time between interviews. The total occurrence of fever of more than 3 days or diarrhoea over the first year were cumulat-ed. Categorisation was <1 or >1 fever of more than 3 days in one year. Diarrhoea was categorized as <2 diar-rhoea or >2 events in one year. Determinants of mortality and morbidity Determinants considered for mortality and morbidity in-cluded IUGR; sex; maternal age (21-35 years regarded as ‘normal’, <20 as ‘high risk young’, and >35 regard as ‘high risk old’), pregnancy (primipara or multipara); ma-ternal education (>6 years and <6 years) and whether breast feeding was exclusive, or with any liquid or solid by infant age or interview.78 Exclusivity breastfeeding at 3 months was considered as a determinant for mortality. Environmental determinants assessed were the type of drinking water source (categorized as ‘improved’ if tap water, closed well, or electric pump from a closed well), and family latrine usage (categorized as ‘improved’ if water sealed latrine, or closed pit latrine). Statistical analysis For infant mortality, censoring for still births, Cox pro-portional hazards regression was used to estimate the HRs and their associated 95% confidence intervals by birth-weight or IUGR. Models quantified differences in surviv-al rates with and without adjustments for relevant covari-ates. The proportional hazards assumption for the birth-weight groups was tested in each model by the addition of an appropriate time-dependent covariates age at death) - a product of the system time variable T (SPSS notation) and the variable age. All covariates were categorical to permit possible non-linearity. The associations of morbidity (diarrhoea and fever more than 3 days) against all of the determinants for each time of interview as well to the total event in one year were assessed using descriptive statistics (frequency dis-tribution and chi square). Determinants that were identi-fied as statistically significant were analyzed using strati-fication method. The data set was analysed using SPSS (Statistical Package for the Social Science) version 22. RESULTS A total of 4694 pregnant women enrolled in the study giving live birth to 4478 singleton infants due to abortion (n=150), stillbirth (n=27) and 78 twins. From this group, we excluded those with no follow up visit at birth (n=111), and incomplete information on BW and BL (n=335). We also excluded outlying measurements to obtain a dataset of infant without pathological growth patterns (n=140) (Figure 2). Finally, 3892 singleton live-born infants (85.2%) were eligible for analysis. Descrip-tive values of the cohort and anthropometrical parameters at birth are summarised in Table 2. Birthweight and IUGR classification The mean BW and BL of the non-IUGR infant were less than the reference means at 3116 g and 49.1 cm, respec-tively; the WAZ was −0.40 compared with an HAZ of −0.22, indicating that foetal weight deviated to a greater
S22 B Alisjahbana, D Rivami, L Octavia, N Susilawati, M Pangaribuan, A Alisjahbana and A Diana
degree than foetal length. The WAZ of the IUGR infant was −1.53 and HAZ was −1.67. The ponderal index was comparable to that of the non-IUGR infant, but the mean head circumference of the IUGR infant was 1.2 cm smaller, indicating that brain growth was affected during the gestational period. In the non-IUGR and IUGR groups, the HAZ was dif-ferent between genders. The mean BL of the girls was closer to the reference mean than that of the boys, the difference being larger in the non-IUGR group. Growth in infancy (0–12 months) was assessed for the non-IUGR and IUGR groups separately by gender by plotting the mean WAZ and HAZ (Figures 3a & b). The Tanjungsari cohort infants were lighter and small-er than the reference population, as demonstrated by the negative Z-scores. In the first 3 months, the cohort grew faster and gained more weight compared with the refer-ence population, as illustrated by the upward trend in WAZ and HAZ in Figure 3 as well as in Table 3. After 3 months, however, growth began to falter, as shown by the deviation from the reference mean (i.e. away from Z-
score=0) for both groups. This growth faltering was pro-gressive until the age of 12 months. We compared the growth of IUGR with that non-IUGR infants (Table 3). Throughout the entire year, the mean HAZ deviated from the reference by a larger extent than did the WAZ. 0.47. The growth curves for the IUGR in-fants were consistently below those of the non-IUGR infants. Mortality in infancy by age, sex, and cause of death Among the 3892 singleton live births, 174 infant deaths were recorded, resulting in an IMR of 44.7 per 1000 live births. Almost twice as many boys as girls died (110 vs 64). However, the pattern of mortality was comparable for both sexes (Table 4a). The first week after birth ap-peared to be the most critical period (accounting for ap-proximately 15% of deaths, compared with some 7% at 8–28 days). Relatively few infants died between 29–42 days (12.6%), but there was another peak at 43–90 days (25.3%). Of all infant deaths, 61% occurred at age 0–90 days. The proportion dying fell to approximately 5% per month at age 91–270 days, and few died in late infancy
Table 2. Infant characteristics, their mother and environmental factors Total cohort
Use of improved latrine in the house* 1871 (48.1) 833 (52.8) 655 (45.3) (water sealed, closed pit)
WAZ: weight-for-age z-score; HAZ: height-for-age z-score; PI: ponderal index; HC: head circumference. Data are mean (SD) or number (%). *p<0.01, ** p< 0.05.
IUGR and environment hygiene affect infant health S23
(Table 4). Pneumonia and bronchopneumonia were the most common causes of death (51%) followed by non-infectious causes (26%), which included asphyxia in as-sociation with congenital malformation along with under-nutrition (data not shown). Mortality in infancy by birth weight& IUGR category In the neonatal period, the proportion of deaths in LBW infants and in the next birth weight class (2500–2699 g) was comparable, namely approximately 30% (Table 4a). The percentage was much lower in the birth weight clas-ses 2700–2999 g and ≥3000 g (17% and 13%, respective-ly). At ages 29–42 days ad 43–90 days, the expected gra-dient in mortality by birth weight was observed. Over-all, babies tended to die in the first 90 days: 73% of the LBW babies and 51% of those with a birth weight of >3000 g. However, due to the distribution of birth weight, the deaths in each birth weight class as a percentage of the total infant deaths were almost equally distributed among the birth weight classes. Contrary to expectation, 24% of all deaths occurred among LBW infants and 30% in birth weight class ≥3000 g. Infant mortality by age in the selected intrauterine growth categories did trend in the expected direction (Ta-
ble 4b). First-week deaths were particularly confined to preterm babies (26% vs. 14% in the other two categories, not shown in Table 4b), and there was a downward gradi-ent across preterm, IUGR, and non-IUGR categories in first-42-days deaths (More than 45% in preterm and IUGR babies vs 22% in non-IUGR babies). After 3 months of age, the mortality pattern was comparable across the three IUGR categories. With respect to the category of IUGR, the proportion that died was 1.5 to 2 times higher among the preterm babies (9%) than among the term babies (IUGR 4% and non-IUGR 4%). However, albeit uncertainty with a small sample of preterm babies, 48% of all infant deaths occurred among IUGR babies and 35% among non-IUGR babies. Survival curves and risk ratios The cumulative survival at 1 year was approximately 95%, and the probability of dying was highest in the first 3 months (Figure 4a). Disaggregated by birth weight, a distinct difference was found between the LBW and birth weight ≥3000 g groups (p<0.0001), but the difference between the intermediate birth weight and largest birth weight groups was nonsignificant (Figure 4b). As previ-ously mentioned, birth weight is a crude indicator of
Table 3. Mean WAZ and HAZ in the first year, difference between non-IUGR and IUGR Non-IUGR
WAZ: weight-for-age z-score; HAZ: height-for-age z-score. Data are mean (SD).
a. b.
Figure 3. HAZ in infancy for girls (a) and boys (b) in the non-IUGR (n=691; 886) and IUGR (n=754; 693) groups.
S24 B Alisjahbana, D Rivami, L Octavia, N Susilawati, M Pangaribuan, A Alisjahbana and A Diana
IUGR; likewise, the date of last menstruation of the mother does not usually lead to accurate measures of ges-tational age,64 as in the Tanjungsari population. The com-bination of weight and length at birth is likely the next-best indicator of IUGR in field conditions. Throughout infancy, the survival curve of non-IUGR infants was bet-ter than that of IUGR infants, whereas the preterm infants (which can also include infants with birth weights of 2500–2700 g) had the highest probability of death. Within the IUGR and preterm categories, significant differences in the survival curve were identified (p<0.001, Figure 4c). At 3 months of age, the risk of death for the LBW ba-bies was 3.1 times higher than that for the normal birth weight (≥2500 g) babies and was comparable to that of the preterm versus non-IUGR babies (2.9 times higher in preterm). The risk for IUGR babies was 1.7 times higher than that for non-IUGR babies. The same gradient was observed at 12 months (data not shown). The relative risk of dying was, however, only significant in the age period 0–90 days, for LBW versus normal birth weight infants (risk ratio [RR] 3.1; 95% CI 2.04–4.64), for IUGR versus
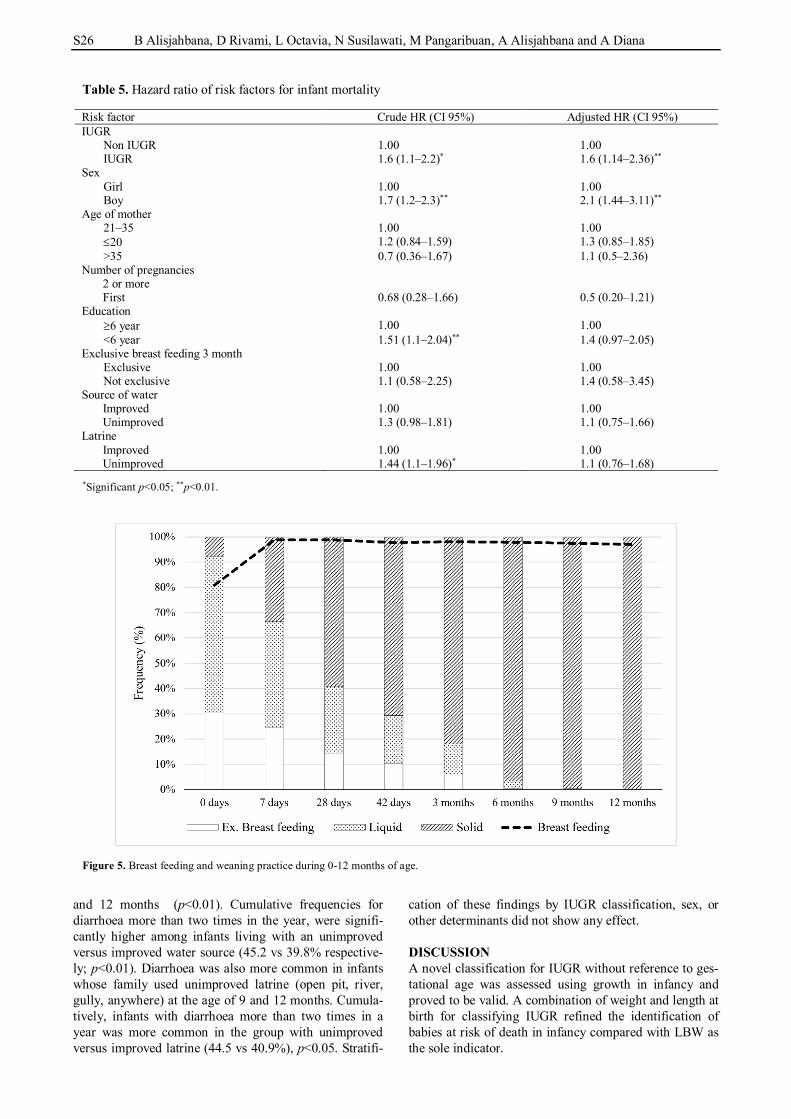
non-IUGR infants (RR 1.7; 95% CI 1.1–2.73), and for pre-term versus non-IUGR infants (RR 2.9; 95% CI 1.66–5.20). However, the risk was not significantly different between the preterm and IUGR infants (RR 1.7; 95% CI 0.99–2.85). The risk of IUGR and other determinants to infant mor-tality were calculated using hazard ratio and adjusted hazard ratio (aHR) for all of the factors in Table 5. Be-sides IUGR, which had aHR 1.6 (95% CI; 1.14-2.36) we found that sex was significantly affecting mortality with aHR 2.1 (95% CI: 1.44-3.11). Maternal education of less than 6 years and latrine usage type were significantly as-sociated with mortality in the crude HRs, but not when adjusted for sex and IUGR. Other determinants like ma-ternal age, number of pregnancies, source of water and improved latrine did not correlate with mortality (Table 5). Infant feeding Infant feeding practices are described in Figure 5. This graph shows that exclusive breastfeeding in the first sev-
Table 4a. Age specific mortality by sex
Age at death Male (n=1982) Female (n=1910) Total n % n % n %
0-28 25 22.7 39 22.4 14 21.9 29-42 14 12.7 22 12.6 8 12.5 43-90 25 22.7 44 25.3 19 29.7 91-180 19 17.3 32 18.4 13 20.3 181-270 20 18.2 27 15.5 7 10.9 271-365 7 6.4 10 5.7 3 4.7 Total 110 174 64 % died per class 5.5 4.5 3.3 % of all death 63.2 100 36.8 Table 4b. Age specific mortality by birth weight group, sexes combined
Age at death, days <2500
(N=442) 2500-2699
(N=709) 2700-2999
(N=1163) 3000
(N=1578) Total
n % n % n % n % n % 0-28 14 34.1 9 32.1 9 17.3 7 13.2 39 22.4 29-42 8 19.5 3 10.7 8 15.4 3 5.7 22 12.6 43-90 8 19.5 6 21.4 14 26.9 16 30.2 44 25.3 91-180 5 12.2 2 7.1 8 15.4 17 32.1 32 18.4 181-270 4 9.8 6 21.4 10 19.2 7 13.2 27 15.5 271-365 2 4.9 2 7.1 3 5.8 3 5.7 10 5.7 Total 41 100 28 100 52 100 53 100 174 % died per class 9.3 6.3 11.8 12 4.5 % of all deaths 23.6 16.1 29.9 30.5 100 Table 4c. Age specific mortality by intrauterine growth categories, sexes combined
Age at death, days Probably preterm
(N=322) IUGR
(N=1447) Non IUGR
(N=1577) Total
n % n % n % n % 8-28 9 18 19 26.8 9 33.3 37 25.0 29-42 4 4 14 19.7 2 14.8 20 13.5 43-90 5 38 15 21.1 19 18.5 39 26.4 91-180 3 20 9 12.7 10 11.1 22 14.9 181-270 5 16 9 12.7 8 18.5 22 14.0 271-365 1 4 5 7 2 3.7 8 5.4 Total 27 100 71 100 52 100 148 % died per class 15.5 4.9 1.7 4.4 % of all deaths 18.2 48.0 35.1 100
IUGR and environment hygiene affect infant health S25
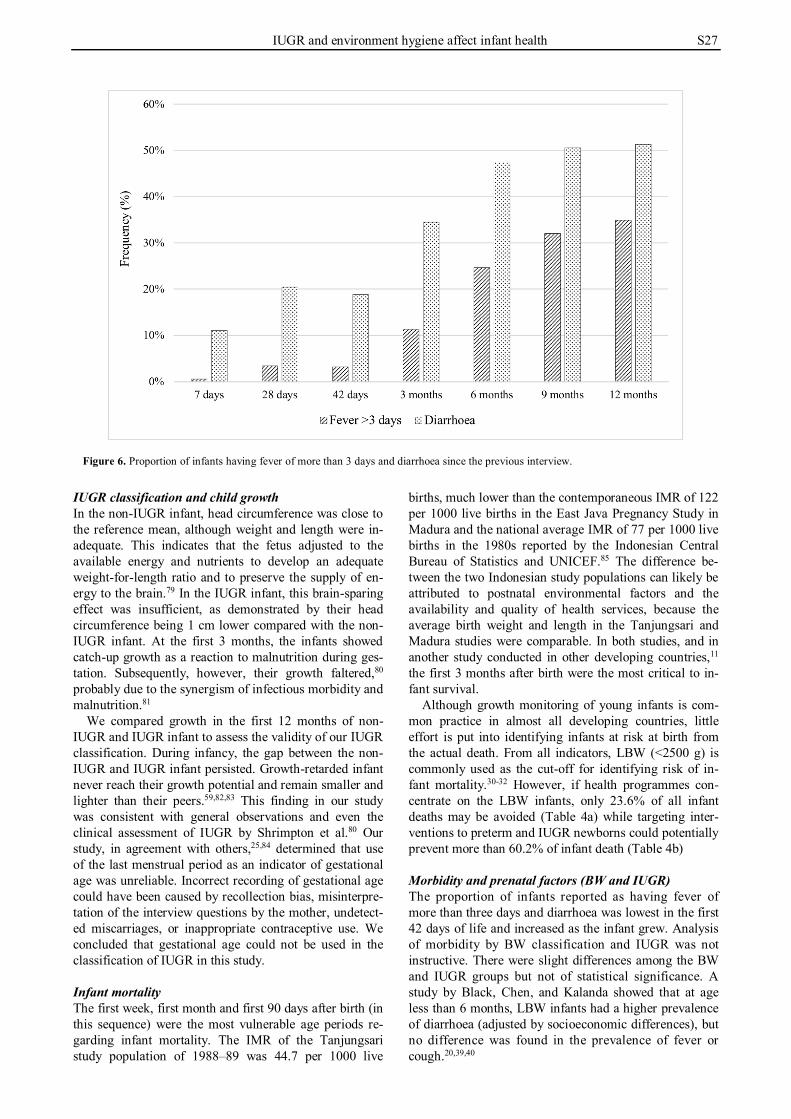
en days of life was practiced by 24.5% mothers during the first week after delivery, decreased to 6.2% in the third month, and 0.6% at 6 months of infant’s age. This graph shows that 61.4% of infants received some form of liquid other than breast feeding and 7.8% solid food right after birth. Nonexclusive breast feeding was practiced by most of the mothers, starting at 80.9% right after birth, and continued high, above 95%, of mother until the 12th month (Figure 5). Morbidity pattern Figure 6 depicts the proportion of infants with fever more than 3 days or diarrhoea in the period since the previous visit at ages 7 days–12 months. In general, older infant
(3-12 months) had higher morbidity proportion than in-fant at age 0-3 months. Determinants of morbidity The proportion of infants with morbidity symptoms in the BW and IUGR classification at any given time of inter-view were similar, except for the proportion with diar-rhoea which was higher in the IUGR group compared with the non-IUGR group. 36.8% vs 33.5% (p<0.05) at the 3 month of age.
Proportion of infant having fever of more than 3 days was not associated with any of the determinant tested. However diarrhoea was strongly associated with the use of unimproved water source at 7 days, 42 days, 3, 6, 9
Figure 4a. Kaplan–Meier survival curve of all infants in the first year of life.
Figure 4b. Kaplan–Meier survival curve of infants in the first year of life by birth weight category.
Figure 4c. Kaplan–Meier survival curve of infants in the first year of life by IUGR category.
S26 B Alisjahbana, D Rivami, L Octavia, N Susilawati, M Pangaribuan, A Alisjahbana and A Diana
and 12 months (p<0.01). Cumulative frequencies for diarrhoea more than two times in the year, were signifi-cantly higher among infants living with an unimproved versus improved water source (45.2 vs 39.8% respective-ly; p<0.01). Diarrhoea was also more common in infants whose family used unimproved latrine (open pit, river, gully, anywhere) at the age of 9 and 12 months. Cumula-tively, infants with diarrhoea more than two times in a year was more common in the group with unimproved versus improved latrine (44.5 vs 40.9%), p<0.05. Stratifi-
cation of these findings by IUGR classification, sex, or other determinants did not show any effect. DISCUSSION A novel classification for IUGR without reference to ges-tational age was assessed using growth in infancy and proved to be valid. A combination of weight and length at birth for classifying IUGR refined the identification of babies at risk of death in infancy compared with LBW as the sole indicator.
Table 5. Hazard ratio of risk factors for infant mortality Risk factor Crude HR (CI 95%) Adjusted HR (CI 95%) IUGR
Non IUGR 1.00 1.00 IUGR 1.6 (1.1–2.2)* 1.6 (1.14–2.36)**
Sex Girl 1.00 1.00 Boy 1.7 (1.2–2.3)** 2.1 (1.44–3.11)**
Age of mother 21–35 1.00 1.00 20 1.2 (0.84–1.59) 1.3 (0.85–1.85) >35 0.7 (0.36–1.67) 1.1 (0.5–2.36)
Number of pregnancies 2 or more First 0.68 (0.28–1.66) 0.5 (0.20–1.21)
Education 6 year 1.00 1.00 <6 year 1.51 (1.1–2.04)** 1.4 (0.97–2.05)
Exclusive breast feeding 3 month Exclusive 1.00 1.00 Not exclusive 1.1 (0.58–2.25) 1.4 (0.58–3.45)
Source of water Improved 1.00 1.00 Unimproved 1.3 (0.98–1.81) 1.1 (0.75–1.66)
Figure 5. Breast feeding and weaning practice during 0-12 months of age.
IUGR and environment hygiene affect infant health S27
IUGR classification and child growth In the non-IUGR infant, head circumference was close to the reference mean, although weight and length were in-adequate. This indicates that the fetus adjusted to the available energy and nutrients to develop an adequate weight-for-length ratio and to preserve the supply of en-ergy to the brain.79 In the IUGR infant, this brain-sparing effect was insufficient, as demonstrated by their head circumference being 1 cm lower compared with the non-IUGR infant. At the first 3 months, the infants showed catch-up growth as a reaction to malnutrition during ges-tation. Subsequently, however, their growth faltered,80 probably due to the synergism of infectious morbidity and malnutrition.81
We compared growth in the first 12 months of non-IUGR and IUGR infant to assess the validity of our IUGR classification. During infancy, the gap between the non-IUGR and IUGR infant persisted. Growth-retarded infant never reach their growth potential and remain smaller and lighter than their peers.59,82,83 This finding in our study was consistent with general observations and even the clinical assessment of IUGR by Shrimpton et al.80 Our study, in agreement with others,25,84 determined that use of the last menstrual period as an indicator of gestational age was unreliable. Incorrect recording of gestational age could have been caused by recollection bias, misinterpre-tation of the interview questions by the mother, undetect-ed miscarriages, or inappropriate contraceptive use. We concluded that gestational age could not be used in the classification of IUGR in this study. Infant mortality The first week, first month and first 90 days after birth (in this sequence) were the most vulnerable age periods re-garding infant mortality. The IMR of the Tanjungsari study population of 1988–89 was 44.7 per 1000 live
births, much lower than the contemporaneous IMR of 122 per 1000 live births in the East Java Pregnancy Study in Madura and the national average IMR of 77 per 1000 live births in the 1980s reported by the Indonesian Central Bureau of Statistics and UNICEF.85 The difference be-tween the two Indonesian study populations can likely be attributed to postnatal environmental factors and the availability and quality of health services, because the average birth weight and length in the Tanjungsari and Madura studies were comparable. In both studies, and in another study conducted in other developing countries,11 the first 3 months after birth were the most critical to in-fant survival.
Although growth monitoring of young infants is com-mon practice in almost all developing countries, little effort is put into identifying infants at risk at birth from the actual death. From all indicators, LBW (<2500 g) is commonly used as the cut-off for identifying risk of in-fant mortality.30-32 However, if health programmes con-centrate on the LBW infants, only 23.6% of all infant deaths may be avoided (Table 4a) while targeting inter-ventions to preterm and IUGR newborns could potentially prevent more than 60.2% of infant death (Table 4b) Morbidity and prenatal factors (BW and IUGR) The proportion of infants reported as having fever of more than three days and diarrhoea was lowest in the first 42 days of life and increased as the infant grew. Analysis of morbidity by BW classification and IUGR was not instructive. There were slight differences among the BW and IUGR groups but not of statistical significance. A study by Black, Chen, and Kalanda showed that at age less than 6 months, LBW infants had a higher prevalence of diarrhoea (adjusted by socioeconomic differences), but no difference was found in the prevalence of fever or cough.20,39,40
Figure 6. Proportion of infants having fever of more than 3 days and diarrhoea since the previous interview.
S28 B Alisjahbana, D Rivami, L Octavia, N Susilawati, M Pangaribuan, A Alisjahbana and A Diana
Morbidity and its determinants Although it is a universally accepted notion that exclu-sively breastfed infants receive more antibodies and other essential nutrients,46,86 our study did not find lower risk of morbidity in exclusively breast fed infants. Despite the known function of breast milk, Raisler, Alexander, and O’Campo claimed that minimal breastfeeding does not give significant protective effect against common infant illnesses as exclusive and regular breastfeeding.87 How-ever, in the present study, information on how frequent and how much breast milk or food was given in the par-tially breastfed group was unavailable; therefore, we could not relate the amount of feeding and type of nour-ishment to any protective effect against morbidity.
In addition, other factors, such us unhygienic and un-safe environments like limited access to sanitation, short-age of water, and diarrhoeal disease caused by contami-nated water and food5,82,88 have been well documented as major contributors to infant morbidity. Unsafe water sources, low access to sanitation and shortage of water availability contribute to around 1.5 million child deaths each year, while 88% of these deaths are specifically due to diarrhoea caused by contaminated water and food.40,41 In this study, we also discovered that diarrhoea was relat-ed to unimproved drinking water sources and the use of unimproved latrines. This finding shows the effect of en-vironmental exposures on infant morbidity, more than other early life situations, including exclusive breastfeed-ing practice. The importance of distinguishing infants by LBW or IUGR was not evident in the morbidity analysis. Strengths and limitations Different recall periods make difficulty for comparison between the present observations and other studies. Most morbidity studies use a constant and short 1-2-week recall period to minimize recall bias and to avoid misinterpreta-tion of the reference period of morbidity. One study even recommended inquiry about diarrhoea and fever event only in the previous one or two days to prevent underre-porting.89 The present report employed secondary data from the RAS Tanjungsari study conducted in 1988–1990, the objectives of which were related to safe motherhood and the role of traditional birth attendants in maternal–child healthcare.63 The information collected was not spe-cifically designed for the investigation of morbidity and breastfeeding in the birth cohort. The interview data re-flected the mother’s own perceptions of morbidity and their infant’s health between home visits rather than the number of sickness episodes recorded as recommended in the WHO guidelines.49 Similarly, feeding habits and prac-tices were inquired in general terms rather than according to WHO/UNICEF definitions of exclusive or partial breastfeeding and complementary foods.44 However, the use of health interviews or self-perceived morbidity inter-views in developing countries has been supported by a study by Rousham et al who discovered strong associa-tions between maternal reports of their infant’s illness and the biochemical profiles of the infant, even when the mothers were illiterate.90
The strengths of this study were the longitudinal nature of data collection, and the use of the same, well-trained village health workers throughout the entire study period.
The Tanjungsari cohort is one of the few cohorts, particu-larly in developing countries, for which a large amount of anthropometric data has been collected. Birth weight and length were measured under standardised conditions. It is a unique dataset for answering questions that require lon-gitudinal data—in our case, data on IUGR and its effect on child growth and health. The data collected can thus be reasonably expected to reflect the morbidity picture and general child feeding habits among the study population. These favourable conditions allowed for the identification of peak mortality by age.
Our classification of IUGR resulted in a clear differ-ence between the growth curves of non-IUGR and IUGR infant. Our data on IUGR in a cohort of infants living in a rural area were also collected within limited means. It sets an example that collecting high quality data within lim-ited means is possible. In limited resource settings, it be-comes necessary to identify infants with retarded growth solely from anthropometric indicators, but it can only be done when data are reliable and accurate. The combina-tion of weight and length at birth is likely the next-best indicator of IUGR in field conditions. IUGR classifica-tion based on a combination of BW and BL identified a larger group of infants at health risk compared with LBW. The developed IUGR classifications, therefore, are rec-ommended for application in health policy development to optimize nutritional status in the first 1000 days of life. ACKNOWLEDGEMENTS We thank the Tanjungsari Cohort Study team for collecting the data used for this study, the late Prof. Jane A. Kusin, for being the consultant of this study, Judith Sparidans for assistance in data analysis of the cohort and Kara D. Alisjahbana for develop-ing the map and refining the graphs. We also thank the District Health Officer of Sumedang District and the National Institute of Health Research and Development, Ministry of Health of Indonesia, for the permission to conduct this study in their area. AUTHOR DISCLOSURES The authors declare that they have no competing interests. The 1988 Tanjung Sari perinatal health initiative was funded by the Ford Foundation Project no. 840 417 and the Sophia Stichting, Rotterdam, the Netherlands. Additional and intensive data anal-ysis efforts were supported by NMCP project Nr.25112MIA, Japan International Cooperation Agency, and the Neys van Hoogstraten Foundation, the Netherlands.
REFERENCES 1. UN Inter-agency group for child mortality estimation.
Levels and Trends in Child Mortality. New York: UNICEF; 2017.
2. Cao H, Wang J, Li Y, Li D, Guo J, Hu Y et al. Trend analysis of mortality rates and causes of death in children under 5 years old in Beijing, China from 1992 to 2015 and forecast of mortality into the future: an entire population-based epidemiological study. BMJ Open. 2017;7:e015941.
3. Stekelenburg J, Kashumba E, Wolffers I. Factors contributing to high mortality due to pneumonia among under-fives in Kalabo District, Zambia. Trop Med Int Health. 2002;7:886-93.
4. Watkins WJ, Kotecha SJ, Kotecha S. All-cause mortality of low birthweight infants in infancy, childhood, and adolescence: population study of England and Wales. PLoS Med. 2016;13:e1002018.
5. Power C, Li L. Cohort study of birthweight, mortality, and
IUGR and environment hygiene affect infant health S29
disability. BMJ. 2000;320:840-1. 6. Starfield B, Shapiro S, McCormick M, Bross D. Mortality
and morbidity in infants with intrauterine growth retardation. J Pediatr. 1982;101:978-83.
7. McCormick MC. The Contribution of Low Birth Weight to Infant Mortality and Childhood Morbidity. N Engl J Med. 1985;312:82-90.
8. Victora CG, Barros FC, Vaughan JP, Teixeira AM. Birthweight and infant mortality: a longitudinal study of 5914 Brazilian children. Int J Epidemiol . 1987;16:239-45.
9. Araújo de França G V, Lucia Rolfe E De, Horta BL, Gigante DP, Yudkin JS, Ong KK et al. Associations of birth weight, linear growth and relative weight gain throughout life with abdominal fat depots in adulthood: the 1982 Pelotas (Brazil) birth cohort study. Int J Obes. 2016;40:14-21.
10. Read JS, Clemens JD, Klebanoff MA. Moderate low birth weight and infectious disease mortality during infancy and childhood. Am J Epidemiol. 1994;140:721-33.
11. Ashworth A. Effects of intrauterine growth retardation on mortality and morbidity in infants and young children. Eur J Clin Nutr . 1998;52(Suppl 1):S34-S41.
12. de Onis M, Blossner M, Villar J. Levels and patterns of intrauterine growth retardation in developing countries. Eur J Clin Nutr. 1998;52(Suppl 1):S5-S15.
13. Victora CG, Barros FC, Huttly SR, Teixeira AM, Vaughan JP. Early childhood mortality in a Brazilian cohort: the roles of birthweight and socioeconomic status. Int J Epidemiol. 1992;21:911-5.
14. Walker SP, Wachs TD, Meeks Gardner J, Lozoff B, Wasserman GA, Pollitt E et al. Child development: risk factors for adverse outcomes in developing countries. Lancet. 2007;369:145-57.
15. Mahumud RA, Sultana M, Sarker AR. Distribution and Determinants of Low Birth Weight in Developing Countries. J Prev Med Public Heal. 2017;50:18-28.
16. UNICEF. Low birthweight - UNICEF Data . 2018 [cited 2018/04/01]. Available from: https://data.unicef.org/topic/ nutrition/low-birthweight/#.
17. García-Basteiro AL, Quintó L, Macete E, Bardají A, González R, Nhacolo A et al. Infant mortality and morbidity associated with preterm and small-for-gestational-age births in Southern Mozambique: A retrospective cohort study. Simeoni U, editor. PLoS One. 2017;12:e0172533.
18. Anggondowati T, El-Mohandes AAE, Qomariyah SN, Kiely M, Ryon JJ, Gipson RF et al. Maternal characteristics and obstetrical complications impact neonatal outcomes in Indonesia: a prospective study. BMC Pregnancy Childbirth. 2017;17:100.
19. Adisasmita A, Smith CV, El-Mohandes AAE, Deviany PE, Ryon JJ, Kiely M et al. Maternal characteristics and Clinical diagnoses influence obstetrical outcomes in Indonesia. Matern Child Health J. 2015;19:1624-33.
20. Titaley CR, Dibley MJ, Agho K, Roberts CL, Hall J. Determinants of neonatal mortality in Indonesia. BMC Public Health. 2008;8:232.
21. Soltani H, Lipoeto NI, Fair FJ, Kilner K, Yusrawati Y. Pre-pregnancy body mass index and gestational weight gain and their effects on pregnancy and birth outcomes: a cohort study in West Sumatra, Indonesia. BMC Womens Health. 2017;17:102.
22. Abdullah A, Hort K, Butu Y, Simpson L. Risk factors associated with neonatal deaths: a matched case-control study in Indonesia. Glob Health Action. 2016;9:30445.
23. Wariki WMV, Mori R, Boo N-Y, Cheah IGS, Fujimura M, Lee J et al. Risk factors associated with outcomes of very low birthweight infants in four Asian countries. J Paediatr
restriction: antenatal and postnatal aspects. Clin Med Insights Pediatr. 2016;10:67-83. doi: 10.4137/CMPed.S400 70.ecollection.2016.
25. WHO. Physical status: the use and interpretation of anthropometry. Report of a WHO Expert Committee. Geneva; WHO; 1995.
26. Dubowitz LM, Dubowitz V, Goldberg C. Clinical assessment of gestational age in the newborn infant. J Pediatr. 1970;77:1-10.
27. Barker DJ. Mothers, babies, and health in later life. Edinburgh: Churchill Livingstone; 1998.
28. Chatrath R, Saili A, Jain M, Dutta AK. Immune status of full-term small-for-gestational age neonates in India. J Trop Pediatr. 1997;43:345-8.
29. Chandra RK. Fetal malnutrition and postnatal immunocompetence. Am J Dis Child. 1975;129:450-4.
30. Ferguson AC, Lawlor Jr. GJ, Neumann CG, Oh W, Stiehm ER. Decreased rosette-forming lymphocytes in malnutrition and intrauterine growth retardation. J Pediatr. 1974;85:717-23.
31. Markestad T, Vik T, Ahlsten G, Gebre-Medhin M, Skjaerven R, Jacobsen G et al. Small-for-gestational-age (SGA) infants born at term: growth and development during the first year of life. Acta Obs Gynecol Scand Suppl. 1997; 165:93-101.
32. Tenhola S, Martikainen A, Rahiala E, Herrgard E, Halonen P, Voutilainen R. Serum lipid concentrations and growth characteristics in 12-year-old children born small for gestational age. Pediatr Res. 2000;48:623-8.
33. Hales CN, Barker DJ, Clark PM, Cox LJ, Fall C, Osmond C et al. Fetal and infant growth and impaired glucose tolerance at age 64. BMJ. 1991;303:1019-22.
34. Barker DJ, Fall CH. Fetal and infant origins of cardiovascular disease. Arch Dis Child. 1993;68:797-9.
35. Yudkin JS, Phillips DI, Stanner S. Proteinuria and progressive renal disease: birth weight and microalbuminuria. Nephrol Dial Transpl. 1997;12(Suppl 2):10-3.
36. van Weissenbruch MM, Engelbregt MJ, Veening MA, Delemarre-van de Waal HA. Fetal nutrition and timing of puberty. Endocr Dev. 2005;8:15-33.
37. Drake AJ, Walker BR. The intergenerational effects of fetal programming: non-genomic mechanisms for the inheritance of low birth weight and cardiovascular risk. J Endocrinol. 2004;180:1-16.
38. Ramakrishnan U, Martorell R, Schroeder DG, Flores R. Role of intergenerational effects on linear growth. J Nutr. 1999;129(Suppl 2):544S-549S.
39. Alisjahbana A, Soeroto-Hamzah E, Peeters R, Meheus A. Perinatal mortality and morbidity in rural West-Java, Indonesia. Part II: The results of a longitudinal survey on pregnant women. Paediatr Indones. 1990;30:179-90.
40. Black RE, Morris SS, Bryce J. Where and why are 10 million children dying every year? Lancet. 2003;361:2226-34.
41. Thankappan KR, Nair KN. Diarrhoea morbidity among under-five children: a comparative study of two villages Kerala Research Programme on Local Level Development Centre for Development Studies Thiruvananthapuram 2 Diarrhoea Morbidity among Under-five Children: A comparative study of two villages Cover Design: Defacto Creations. [cited 2018/08/22]. Available from: http://www. cds.ac.in/krpcds/w39.pdf.
42. Pelletier DL, Frongillo EA, Schroeder DG, Habicht JP. The effects of malnutrition on child mortality in developing
S30 B Alisjahbana, D Rivami, L Octavia, N Susilawati, M Pangaribuan, A Alisjahbana and A Diana
countries. Bull World Health Organ. 1995;73:443-8. 43. Murray CJ, Lopez AD. Global mortality, disability, and the
contribution of risk factors: Global Burden of Disease Study. Lancet. 1997;349:1436-42.
44. Lamberti LM, Zakarija-Grković I, Fischer Walker CL, Theodoratou E, Nair H, Campbell H et al. Breastfeeding for reducing the risk of pneumonia morbidity and mortality in children under two: a systematic literature review and meta-analysis. BMC Public Health. 2013;13(Suppl 3):S18.
45. Khan J, Vesel L, Bahl R, Martines JC. Timing of breastfeeding initiation and exclusivity of breastfeeding during the first month of life: effects on neonatal mortality and morbidity—a systematic review and meta-analysis. Matern Child Health J. 2015;19:468-79.
46. Ballard O, Morrow AL. Human milk composition. Pediatr Clin North Am. 2013;60:49-74.
47. Strunk T, Currie A, Richmond P, Simmer K, Burgner D. Innate immunity in human newborn infants: prematurity means more than immaturity. J Matern Fetal Neonatal Med. 2011;24:25-31.
48. Jakaitis BM, Denning PW. Human Breast Milk and the Gastrointestinal Innate Immune System. Clin Perinatol. 2014;41:423-35.
49. Patel A, Badhoniya N, Khadse S, Senarath U, Agho KE, Dibley MJ et al. Infant and young child feeding indicators and determinants of poor feeding practices in India: secondary data analysis of National Family Health Survey 2005-06. Food Nutr Bull. 2010;31:314-33.
50. WHO. The optimal duration of exclusive breastfeeding, results of a WHO systematic review. Geneva: WHO; 2001.
51. Onayade AA, Abiona TC, Abayomi IO, Makanjuola ROA. The first six month growth and illness of exclusively and non-exclusively breast-fed infants in Nigeria. East Afr Med J. 2004;81:146-53.
52. Fisk CM, Crozier SR, Inskip HM, Godfrey KM, Cooper C, Roberts GC et al. Breastfeeding and reported morbidity during infancy: findings from the Southampton Women’s Survey. Matern Child Nutr. 2011;7:61-70.
53. Ladomenou F, Moschandreas J, Kafatos A, Tselentis Y, Galanakis E. Protective effect of exclusive breastfeeding against infections during infancy: a prospective study. Arch Dis Child. 2010;95:1004-8.
54. Oddy WH, Sly PD, de Klerk NH, Landau LI, Kendall GE, Holt PG, et al. Breast feeding and respiratory morbidity in infancy: a birth cohort study. Arch Dis Child. 2003;88:224-8.
55. Kattula D, Sarkar R, Sivarathinaswamy P, Velusamy V, Venugopal S, Naumova EN, et al. The first 1000 days of life: prenatal and postnatal risk factors for morbidity and growth in a birth cohort in southern India. BMJ Open. 2014; 4:e005404-e005404.
56. Sankar MJ, Sinha B, Chowdhury R, Bhandari N, Taneja S, Martines J et al. Optimal breastfeeding practices and infant and child mortality: a systematic review and meta-analysis. Acta Paediatr. 2015;104:3-13.
57. Villar J, Giuliani F, Bhutta ZA, Bertino E, Ohuma EO, Ismail LC et al. Postnatal growth standards for preterm infants: the Preterm Postnatal Follow-up Study of the INTERGROWTH-21st Project. Lancet Glob Heal. 2015;3: e681-91.
58. Santos FS, Santos FCS, Santos LH dos, Leite AM, Mello DF de. Breastfeeding and protection against diarrhea: an integrative review of literature. Einstein (Sao Paulo). 2015; 13:435-40.
59. Arifeen SE, Black RE, Caulfield LE, Antelman G, Baqui AH, Nahar Q, et al. Infant growth patterns in the slums of Dhaka in relation to birth weight, intrauterine growth
retardation, and prematurity. Am J Clin Nutr. 2000;72:1010-7.
60. Agrasada G V, Ewald U, Kylberg E, Gustafsson J. Exclusive breastfeeding of low birth weight infants for the first six months: infant morbidity and maternal and infant anthropometry. Asia Pac J Clin Nutr. 2011;20:62-8.
61. Jedrychowski W, Perera F, Jankowski J, Butscher M, Mroz E, Flak E et al. Effect of exclusive breastfeeding on the development of children’s cognitive function in the Krakow prospective birth cohort study. Eur J Pediatr. 2012;171:151-8.
62. Quigley MA, Hockley C, Carson C, Kelly Y, Renfrew MJ, Sacker A. Breastfeeding is associated with improved child cognitive development: a population-based cohort study. J Pediatr. 2012;160:25-32.
63. Alisjahbana A. The implementation of the risk approach on pregnancy outcome by traditional birth attendants. Rotterdam: Erasmus University; 1993.
64. Kardjati S, Kusin JA, De With C. Energy supplementation in the last trimester of pregnancy in East Java: I. Effect on birthweight. Br J Obs Gynaecol. 1988;95:783-94.
65. Sofiatin Y, Pusparani A, Judistiani TD, Rahmalia A, Diana A, Alisjahbana A. Maternal and environmental risk for faltered growth in the first 5 years for Tanjungsari children in West Java, Indonesia. Asia Pac J Clin Nutr. 2019; 28(Suppl 1):S32-S42. doi: 10.6133/apjcn.201901_28(S1).00 03.
66. Sasongko EPS, Ariyanto EF, Indraswari N, Rachmi CN, Alisjahbana A. Determinants of adolescent shortness in Tanjungsari, West Java, Indonesia. Asia Pac J Clin Nutr. 2019;28(Suppl 1):S43-S50. 10.6133/apjcn.201901_28(S1). 0004.
67. Nugraha GI, Ong PA, Rachmi CN, Karyadi SHKS. Optimi-sation of birth weight and growth in the first 2 years favours an adult body composition which supports more physiologi-cal resting metabolic rates and cognitive function: Tanjung-sari Cohort Study (TCS). Asia Pac J Clin Nutr. 2019; 28(Suppl 1):S51-S62. 10.6133/apjcn.201901_ 28(S1).0005.
68. Lukito W, Wibowo L, Wahlqvist ML. Maternal contributors to intergenerational nutrition, health, and well-being: revisit-ing the Tanjungsari Cohort Study for effective policy and action in Indonesia. Asia Pac J Clin Nutr. 2019:28(Suppl 1):S1-S16. doi: 10.6133/apjcn.201901_28(S1).0001.
69. de Onis M. Measuring nutritional status in relation to mortality. Bull World Health Organ. 2000;78:1271-4.
70. Aromaa A, Koponen P, Tafforeau J, Vermeire C, HIS/HES Core Group. Evaluation of Health Interview Surveys and Health Examination Surveys in the European Union. Eur J Public Health. 2003;13 Suppl 3:67-72.
71. WHO. WHO recommendation on antenatal care for a positive pregnancy outcome. Geneva: WHO; 2016.
72. Taback M. Birth weight and length of gestation with relation to prematurity. J Am Med Assoc. 1951;146:897-901.
73. Lubchenco LO, Hansman C, Boyd E. Intrauterine growth in length and head circumference as estimated from live births at gestational ages from 26 to 42 weeks. Pediatrics. 1966;37: 403-8.
74. Tanner JM. Growth before birth. Foetus into man: physical growth from conception to maturity. London: Open Books Publishing Ltd; 1978.
75. WHO Anthro (version 3.2.2, January 2011) and macros. WHO. Geneva: World Health Organization; 2017
76. Dawson-Saunders B, Trapp R. Basic and Clinical Biostatistics. Norwalk, Connecticut: Appleton-Lange; 2004.
77. Dudley WN, Wickham R, Coombs N, 2, COOMBS N, 3. An Introduction to Survival Statistics: Kaplan-Meier Analysis. J Adv Pract Oncol. 2016;7:91-100.
IUGR and environment hygiene affect infant health S31
78. WHO. Exclusive breasfeeding for optimal growth, development and health of infants. 2018. [cited 2018/10/10]; Available from: http://www.who.int/elena/titles/exclusive_ breastfeeding/en/.
79. Kramer MS, McLean FH, Olivier M, Willis DM, Usher RH. Body proportionality and head and length “sparing” in growth-retarded neonates: a critical reappraisal. Pediatrics. 1989;84:717-23.
80. Shrimpton R, Victora CG, de Onis M, Lima RC, Blossner M, Clugston G. Worldwide timing of growth faltering: implications for nutritional interventions. Pediatrics. 2001; 107:e75.
81. Waterlow JC. Introduction. Causes and mechanisms of linear growth retardation (stunting). Eur J Clin Nutr . 1994; 48(Suppl 1):S1-S4.
82. Kolsteren PW, Kusin JA, Kardjati S. Pattern of linear growth velocities of infants from birth to 12 months in Madura, Indonesia. Trop Med Int Heal. 1997;2:291-301.
83. Martorell R, Yarbrough C, Lechtig A, Delgado H, Klein RE. Genetic-environmental interactions in physical growth. Acta Paediatr Scand. 1977;66:579-84.
84. Kramer MS, McLean FH, Boyd ME, Usher RH. The validity of gestational age estimation by menstrual dating in
term, preterm, and postterm gestations. JAMA. 1988;260: 3306-8.
85. Government of Indonesia, UNICEF. Situation analysis of children and women in Indonesia. Jakarta: Government of Indonesia, UNICEF; 1988.
86. Arifeen S, Black RE, Antelman G, Baqui A, Caulfield L, Becker S. Exclusive breastfeeding reduces acute respiratory infection and diarrhea deaths among infants in Dhaka slums. Pediatrics. 2001;108:e67.
87. Raisler J, Alexander C, O’Campo P. Breast-feeding and infant illness: a dose-response relationship? Am J Public Health. 1999;89:25-30.
88. Onwuanaku CA, Okolo SN, Ige KO, Okpe SE, Toma BO. The effects of birth weight and gender on neonatal mortality in north central Nigeria. BMC Res Notes. 2011;4:562.
89. Martorell R, Habicht J-P, Yarbrough C, Lechtig A, Klein Re. Underreporting in Fortnightly Recall Morbidity Surveys. J Trop Pediatr. 1976;22:129-34.
90. Rousham EK, Northrop-Clewes CA, Lunn PG. Maternal reports of child illness and the biochemical status of the child: the use of morbidity interviews in rural Bangladesh. Br J Nutr. 1998;451-6.