196
Intrinsic bitterness of flavonoids and isoflavonoids and masking of their taste activity Wibke S.U. Roland
Intrinsic bitterness of
flavonoids and isoflavonoids and
masking of their taste activity
Wibke S.U. Roland
Thesis committee
Promotors
Prof. Dr H. Gruppen
Professor of Food Chemistry
Wageningen University
Prof. Dr G. Smit
Professor of Molecular Flavour Science
Wageningen University
Co-promotor
Dr J-P. Vincken
Assistant professor, Laboratory of Food Chemistry
Wageningen University
Other members
Prof. Dr C. de Graaf, Wageningen University
Dr J. Ley, Symrise AG, Holzminden, Germany
Prof. Dr W. Meyerhof, University of Potsdam, Germany
Prof. Dr R.F. Witkamp, Wageningen University
This research was conducted under the auspices of the Graduate School VLAG (Advanced
studies in Food Technology, Agrobiotechnology, Nutrition and Health Sciences).
Intrinsic bitterness of
flavonoids and isoflavonoids and
masking of their taste activity
Wibke S.U. Roland
Thesis
submitted in fulfillment of the requirements for the degree of doctor
at Wageningen University
by the authority of the Rector Magnificus
Prof. Dr M.J. Kropff,
in the presence of the
Thesis Committee appointed by the Academic Board
to be defended in public
on Friday 25 April 2014
at 4 p.m. in the Aula.
Wibke S.U. Roland
Intrinsic bitterness of flavonoids and isoflavonoids and masking of their taste activity
188 pages.
PhD thesis, Wageningen University, Wageningen, NL (2014)
With references, with summaries in English, Dutch and German
ISBN: 978-94-6173-853-0
ABSTRACT
The presence of flavonoids and isoflavonoids in foods and their addition as bioactives to
food products can impart unpleasant bitterness. Therefore, debittering strategies are
demanded. The aim of this research was to identify human bitter receptors (hTAS2Rs)
sensing (iso)flavonoids and to determine the intrinsic bitterness and structure-activity
relationships of soy isoflavones, tea catechins and a large set of structurally similar
(iso)flavonoids by testing for activation of hTAS2Rs in vitro. A subsequent aim was to use
the bitter receptor assay for investigation of different debittering strategies.
Out of all 25 human bitter taste receptors, hTAS2R14 and hTAS2R39, were activated
by soy isoflavones. hTAS2R14 was only activated by isoflavone aglycones, whereas
hTAS2R39 was activated by isoflavone glucosides as well. Investigation of almost 100
(iso)flavonoid aglycones for activation of hTAS2R14 and hTAS2R39 revealed that many
(iso)flavonoids activated these receptors. The structural characteristics for an (iso)flavonoid
to activate hTAS2R14 and hTAS2R39 were determined by 3D-pharmacophore models to
be composed of two (for hTAS2R14) or three (for hTAS2R39) hydrogen bond donor sites,
one hydrogen bond acceptor site, and two aromatic ring structures, of which one had to be
hydrophobic. Three 6-methoxyflavanones were identified which reduced activation of
hTAS2R39 by epicatechin gallate (ECG). These bitter receptor blockers were characterized
as reversible insurmountable antagonists. Furthermore, complexation of epigallocatechin
gallate (EGCG) with food proteins (mainly β-casein and Na-caseinates) reduced
hTAS2R39 activation. A trained sensory panel confirmed reduced bitterness perception.
The systematic investigation of (iso)flavonoid aglycones indicated that the substitution
pattern of (iso)flavonoids is of higher importance for bitter receptor activation than the
backbone structure. In case of bitter receptor antagonists, the substitution pattern as well as
backbone structure revealed to be crucial for functionality. The bitter receptor assay was
shown to be an appropriate tool not only for identification of bitter receptor agonists and
antagonists, but also for identification of reduced receptor activation by complexing agents.

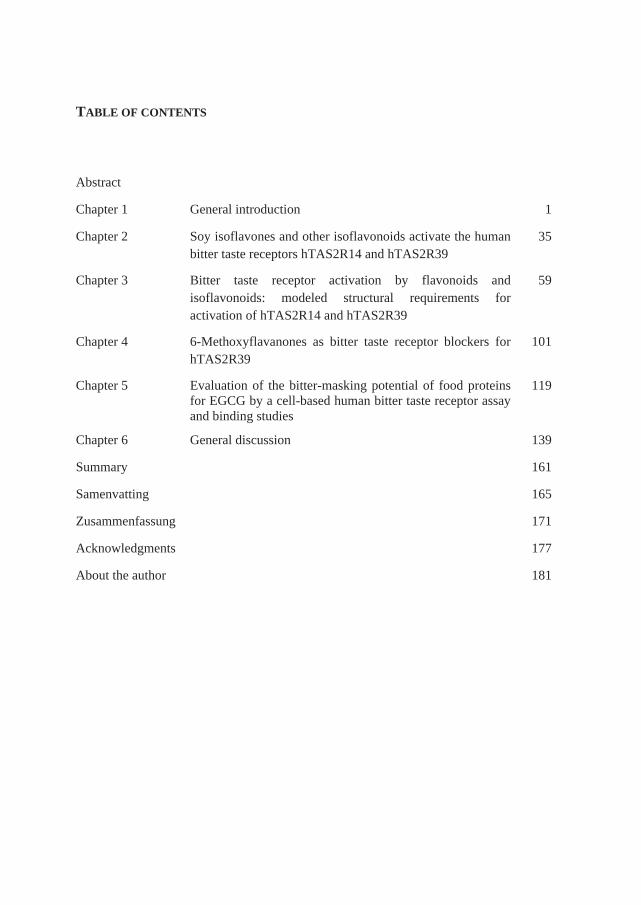
TABLE OF CONTENTS
Abstract
Chapter 1 General introduction 1
Chapter 2 Soy isoflavones and other isoflavonoids activate the human
bitter taste receptors hTAS2R14 and hTAS2R39
35
Chapter 3 Bitter taste receptor activation by flavonoids and
isoflavonoids: modeled structural requirements for
activation of hTAS2R14 and hTAS2R39
59
Chapter 4 6-Methoxyflavanones as bitter taste receptor blockers for
hTAS2R39
101
Chapter 5 Evaluation of the bitter-masking potential of food proteins
for EGCG by a cell-based human bitter taste receptor assay
and binding studies
119
Chapter 6 General discussion 139
Summary 161
Samenvatting 165
Zusammenfassung 171
Acknowledgments 177
About the author 181


Chapter 1
General introduction
1
Chapter 1
2
BITTER TASTE IN RELATION TO DIETARY COMPOUNDS
Bitter taste in food is mostly disliked by consumers. On the other hand, bitter taste in food
can be appreciated, as long as it is moderate, in products such as bitter lemon, coffee, beer,
and dark chocolate (1). Bitter tasting compounds in food are mainly derived from plants
(e.g. caffeine in coffee, naringin in grapefruit, sinigrin in cabbage, hop bitter acids in beer),
but they can also occur in products from animal origin (e.g. bitter peptides in cheese), due
to processing (e.g. the Maillard reaction products such as quinizolate or
(bis)pyrrolidinohexose reductones) and upon storage (e.g. oxidized lipids) (2-4). In this
thesis, dietary compounds are defined as compounds naturally present in food raw
materials, food products, and compounds (natural or synthetic) added to food products.
Drugs, herbal medicine, and synthetic or natural non-consumable bitter substances are
considered as non-dietary.
The biological function of bitter compounds in plants is to protect the plant against
pathogens, parasites and predators. Especially toxins (e.g. strychnine) are often bitter.
Therefore, it has been assumed that the ability to taste bitter compounds and rejection of
bitter taste has long been crucial to survival. However, a correlation between toxicity and
bitter taste thresholds has not been found (1).
Numerous natural bitter compounds have been associated with putative health effects.
Amongst them, isoflavonoids and flavonoids play a central role. Therefore, a trend in food
product development is the design of functional foods, enriched in (iso)flavonoids.
However, their incorporation in, or fortification of, foods can introduce or enhance
bitterness, and, therefore, debittering strategies are demanded. Investigation of bitter taste
and reduction of bitter taste by sensory tests is laborious and can be influenced by many
factors. A fast and objective way of investigating bitterness is the measurement of intrinsic
bitterness on bitter taste receptors by the use of a cell-based assay system. This method
constitutes an important part of this thesis.
Intrinsic bitterness is the capacity of a compound to activate a bitter taste receptor,
uncoupled from other taste qualities (e.g. sweet), senses (e.g. smell), influences (e.g.
hormone levels) and interactions (e.g. with saliva). Due to its high throughput character,
many (potentially) bitter compounds (even of non-food quality) can be examined in a bitter
receptor assay. In this way, sensory panels can be disburdened from tasting many aversive
compounds, and their services can be minimized to confirm the impact of compounds of
high interest.
General introduction
3
STRUCTURAL CLASSIFICATION OF FLAVONOIDS AND ISOFLAVONOIDS
Flavonoids are ubiquitously occurring secondary plant metabolites that play, besides their
physiological role in plants as pigment and defence compounds, a role in the human diet
(5). Isoflavonoids occur almost exclusively in the Leguminosae family (6). Flavonoids and
isoflavonoids are classified as members of phenolic compounds. The non-(iso)flavonoid
phenolics are e.g. hydroxycinnamic acids, coumarins, xanthones, stilbenes, ellagitannins,
and lignans.
(Iso)flavonoids consist of two aromatic rings, connected via a three-carbon bridge (C6-
C3-C6). In most cases, the three carbon bridge is part of a six member heterocyclic ring,
including one oxygen atom (pyran ring) (7). In Table 1, an overview of the most important
dietary (iso)flavonoid subclasses is shown, including their generic numbering pattern.
(Iso)flavonoids belong to the super family of phenyl benzopyrans (6), and their
nomenclature is based on the variation of the C-ring, and the connection between B- and C-
rings. The linkage of the B-ring to position 2 of the benzopyran describes the class of
flavonoids (2-phenyl benzopyrans), whereas a linkage to position 3 describes the class of
isoflavonoids (3-phenyl benzopyrans). The positions 2 and 3 are accentuated in the first
structure of Table 1. In literature, isoflavonoids are often referred to as flavonoids, but due
to their different substitution of the C-rings compared to flavonoids, this classification is
controversial. In this thesis, a distinction between flavonoids and isoflavonoids is, therefore,
made. Besides attachment to position 2 or 3, the B-ring can be connected to position 4, a
class of compounds referred to as neoflavonoids (4-phenyl benzopyrans). Neoflavonoids
hardly occur in the human diet. Furthermore, there are C6-C3-C6 compounds not containing
the pyran C-ring, e.g. chalcones and aurones, which are referred to as minor or
miscellaneous flavonoids.
The backbone structures are mostly substituted by –OH, -OCH3 and O-glycoside
groups, but also C-glycoside, prenylation and sulfonation are possible substitutions (5, 8).
In foods, (iso)flavonoids occur as glycosides (e.g. in many fruits, seeds, and vegetables), as
aglycones (e.g. in tea and in fermented soy products), or as oligomers (such as
proanthocyanidins, e.g. in grapes and peanuts). This thesis focusses on the aglycones and
takes two food products as examples: soybean-derived (Glycine max) products and tea
(Camellia sinensis).
1
Chapter 1
4
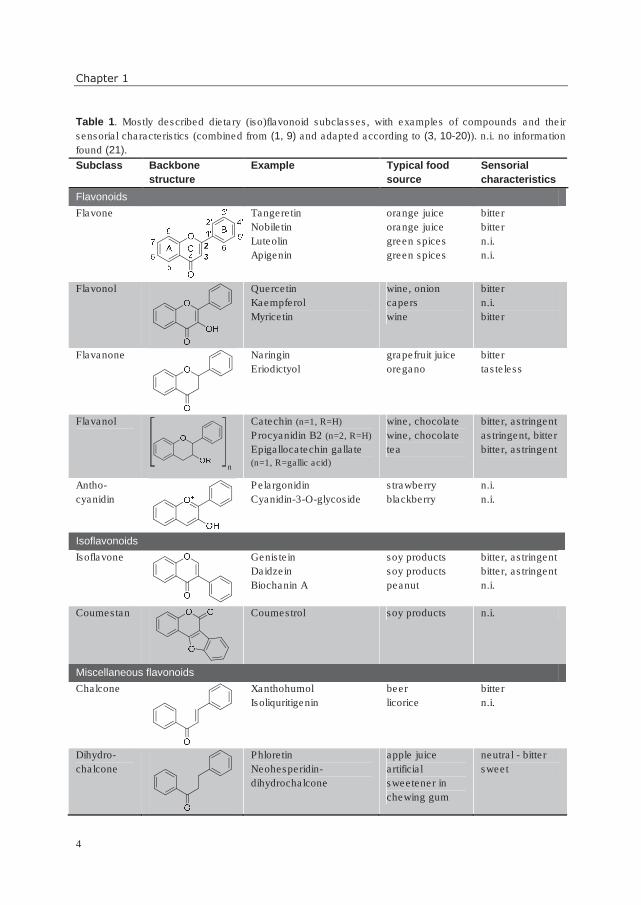
Table 1. Mostly described dietary (iso)flavonoid subclasses, with examples of compounds and their
sensorial characteristics (combined from (1, 9) and adapted according to (3, 10-20)). n.i. no information
found (21).
Subclass Backbone
structure
Example Typical food
source
Sensorial
characteristics
Flavonoids
Flavone Tangeretin
Nobiletin
Luteolin
Apigenin
orange juice
orange juice
green spices
green spices
bitter
bitter
n.i.
n.i.
Flavonol
Quercetin
Kaempferol
Myricetin
wine, onion
capers
wine
bitter
n.i.
bitter
Flavanone
Naringin
Eriodictyol
grapefruit juice
oregano
bitter
tasteless
Flavanol
Catechin (n=1, R=H) Procyanidin B2 (n=2, R=H) Epigallocatechin gallate
(n=1, R=gallic acid)
wine, chocolate
wine, chocolate
tea
bitter, astringent
astringent, bitter
bitter, astringent
Antho-
cyanidin
Pelargonidin
Cyanidin-3-O-glycoside
strawberry
blackberry
n.i.
n.i.
Isoflavonoids
Isoflavone
Genistein
Daidzein
Biochanin A
soy products
soy products
peanut
bitter, astringent
bitter, astringent
n.i.
Coumestan
Coumestrol soy products n.i.
Miscellaneous flavonoids
Chalcone
Xanthohumol
Isoliquritigenin
beer
licorice
bitter
n.i.
Dihydro-
chalcone
Phloretin
Neohesperidin-
dihydrochalcone
apple juice
artificial
sweetener in
chewing gum
neutral - bitter
sweet
n
General introduction
5
PROPERTIES OF (ISO)FLAVONOIDS
Sensorial effects
(Iso)flavonoids can produce several sensorial responses, from sweet (dihydrochalcones) to
astringent (proanthocyanidins, flavanols), and bitter (most subclasses) (9). For flavanols, it
has been found that their degree of polymerization determines their sensorial properties.
Monomeric flavanols (catechins) tend to be more bitter than astringent, whereas bitterness
decreases and astringency increases upon increasing degree of polymerization
(proanthocyanidins) (12). Sweet and bitter taste result from the activation of taste receptors
on the tongue, whereas astringency is a puckering, rough or dry sensation in the mouth
(22), caused by the interaction between phenolic compounds and proline-rich salivary
proteins. This interaction leads to precipitation of salivary proteins and a loss of lubrication
in the mouth (23). The mechanism underlying astringency is not fully understood yet.
Sensory impressions by astringency and bitterness are easily confused and require training
to be reliably distinguished. The majority of flavonoids with known sensorial properties is
reported as tasting bitter. Examples of taste properties are given in Table 1. The following
subchapters will go more into detail about taste, especially bitter taste.
Effects on color and stability
The name “flavonoids” is derived from the Latin word “flavus”, meaning yellow, due to the
fact that many flavonoids are yellow. Additionally, flavonoids can be whitish, brownish,
greenish, orange, red, purple, and blue. The latter three colors are the typical anthocyanin
colors, which are responsible for the appearance of e.g. red wine and berries.
Although of minor importance compared to taste, flavonoids can also be involved (24)
in the stability of a food product, e.g. beer and wine, by changes of color (oxidation) or
haze formation (interaction of haze-forming proteins and phenolics).
Effects on health
A large number of publications reports on potential health benefits of flavonoids and
isoflavonoids. These are e.g. prevention of some cancers, cardiovascular disease,
menopausal complaints and osteoporosis, and are ascribed to properties such as antioxidant,
anti-inflammatory, anti-carcinogenic, anti-thrombotic, and binding to the human estrogen
receptor (5, 9, 25). It should be mentioned that there are also contradictory studies on health
effects of (iso)flavonoids, and the real effect on health has often not been established yet
(26). Nevertheless, as the large majority of reports has proposed beneficial health effects of
(iso)flavonoids, a trend in food product development is the design of functional foods,
enriched in (iso)flavonoids.
1
Chapter 1
6
DIETARY OCCURRENCE OF (ISO)FLAVONOIDS
Consumption and content in food
The (iso)flavonoid consumption in several Western countries has been calculated to vary
between 20 mg / day and 220 mg / day (7, 27-30). Flavanols are often reported to be the
most consumed flavonoids. The mean dietary intake of isoflavonoids accounts for a few mg
/ day only in non-Asian countries (7, 31), whereas it can add up to 25-100 mg / day in
Asian countries (31).
Three databases list contents of (iso)flavonoids reported for various food sources: (i)
USDA database for the flavonoid content of selected foods (32), (ii) USDA database for the
isoflavonoid content of selected foods (33), and (iii) Phenol-Explorer (18-20). Flavonoid
and isoflavonoid contents in food can vary largely. A complicating factor is the common
practice to hydrolyze glycosides into aglycones before quantitative analysis (34). Therefore,
the exact contents of individual (iso)flavonoid glycosides and aglycones are often not
known.
Soy products and tea are given as examples for the dietary occurrence of
(iso)flavonoids in food products rich in aglycones.
Soy
In Western markets, soybean products have, despite their claimed health-promoting effects
(35), limited acceptance due to undesirable tastes (1). Besides astringency and beany flavor,
bitterness is regarded as one of the key off-tastes, probably evoked by the presence of
isoflavones and saponins (36). It is unknown which of the two classes has the highest
contribution to soy off-taste. Nevertheless, this thesis focusses on isoflavones. Furthermore,
several soybean-derived peptides and oxidized fatty acids can taste bitter, but as they are
usually removed during soy food production they are not considered important for bitter
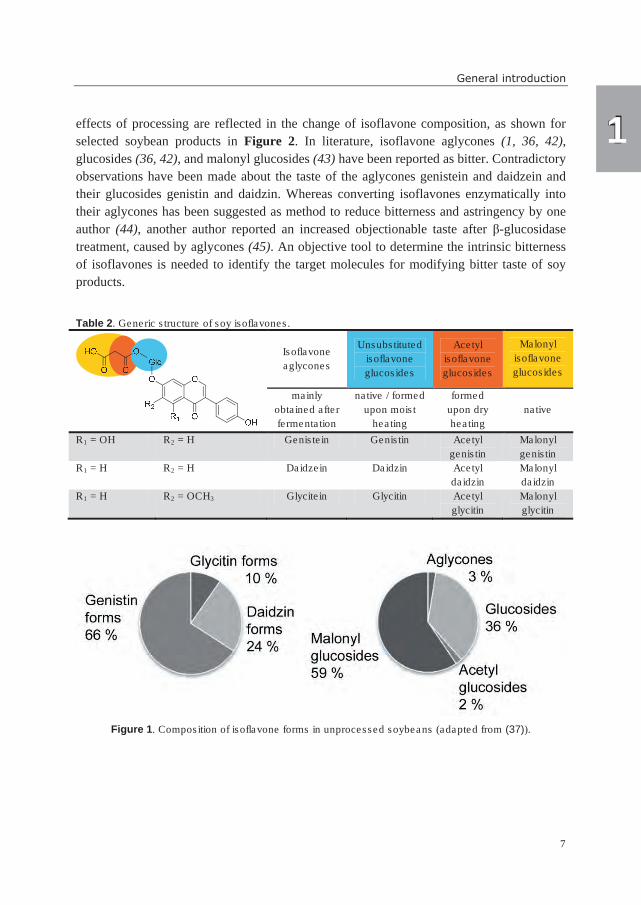
taste in soy products (1). Twelve different isoflavones (Table 2) commonly occur in
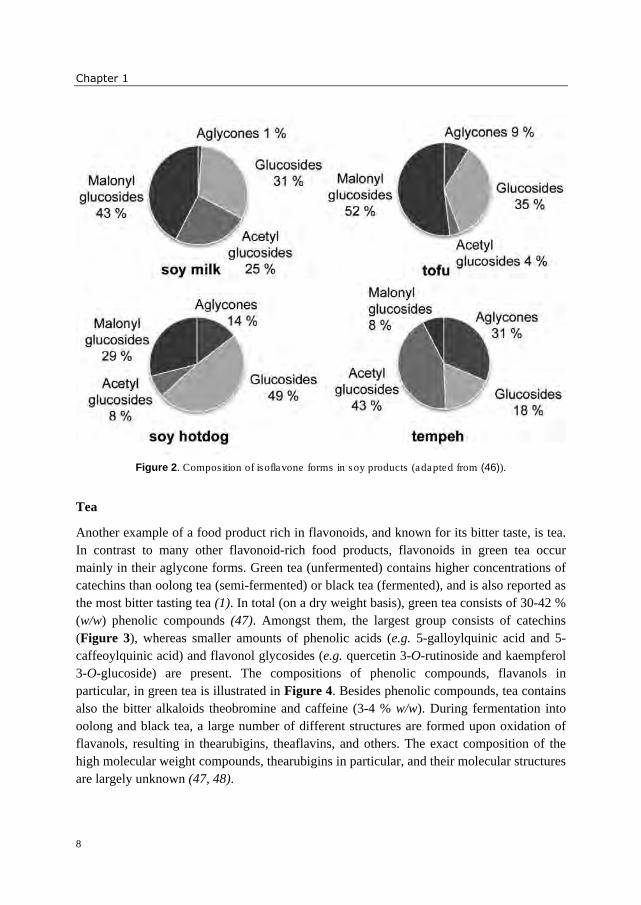
soybeans and soybean-derived products (37). The composition of isoflavone forms depends
on cultivar, growth conditions, and processing method (38-40). Examples of isoflavone
compositions in unprocessed soybeans and soy products are shown in Figures 1 and 2.
Commonly, genistein forms are most abundant in soybeans, followed by daidzein and
glycitein forms (37, 40). Malonyl glucosides and unsubstituted glucosides are the
predominant form in unprocessed soybeans, whereas acetyl glucosides and aglycones are
present in very small amounts (37) (Figure 1). Processing can lead to the conversion of
malonyl glucosides into acetyl glucosides (decarboxylation upon dry heating) and
unsubstituted glucosides (mainly due to deesterification upon moist heating) (40, 41).
During soaking of soybeans, aglycone formation is started due to action of β-glucosidases
(prior to heating). Fermentation strongly increases the amount of aglycones (41). The
General introduction
7
effects of processing are reflected in the change of isoflavone composition, as shown for
selected soybean products in Figure 2. In literature, isoflavone aglycones (1, 36, 42),
glucosides (36, 42), and malonyl glucosides (43) have been reported as bitter. Contradictory
observations have been made about the taste of the aglycones genistein and daidzein and
their glucosides genistin and daidzin. Whereas converting isoflavones enzymatically into
their aglycones has been suggested as method to reduce bitterness and astringency by one
author (44), another author reported an increased objectionable taste after β-glucosidase
treatment, caused by aglycones (45). An objective tool to determine the intrinsic bitterness
of isoflavones is needed to identify the target molecules for modifying bitter taste of soy
products.
Table 2. Generic structure of soy isoflavones.
Isoflavone
aglycones
Unsubstituted
isoflavone
glucosides
Acetyl
isoflavone
glucosides
Malonyl
isoflavone
glucosides
mainly
obtained after
fermentation
native / formed
upon moist
heating
formed
upon dry
heating
native
R1 = OH R2 = H Genistein Genistin Acetyl
genistin
Malonyl
genistin
R1 = H R2 = H Daidzein Daidzin Acetyl
daidzin
Malonyl
daidzin
R1 = H R2 = OCH3 Glycitein Glycitin Acetyl
glycitin
Malonyl
glycitin
Figure 1. Composition of isoflavone forms in unprocessed soybeans (adapted from (37)).
1
Chapter 1
8
Figure 2. Composition of isoflavone forms in soy products (adapted from (46)).
Tea
Another example of a food product rich in flavonoids, and known for its bitter taste, is tea.
In contrast to many other flavonoid-rich food products, flavonoids in green tea occur
mainly in their aglycone forms. Green tea (unfermented) contains higher concentrations of
catechins than oolong tea (semi-fermented) or black tea (fermented), and is also reported as
the most bitter tasting tea (1). In total (on a dry weight basis), green tea consists of 30-42 %
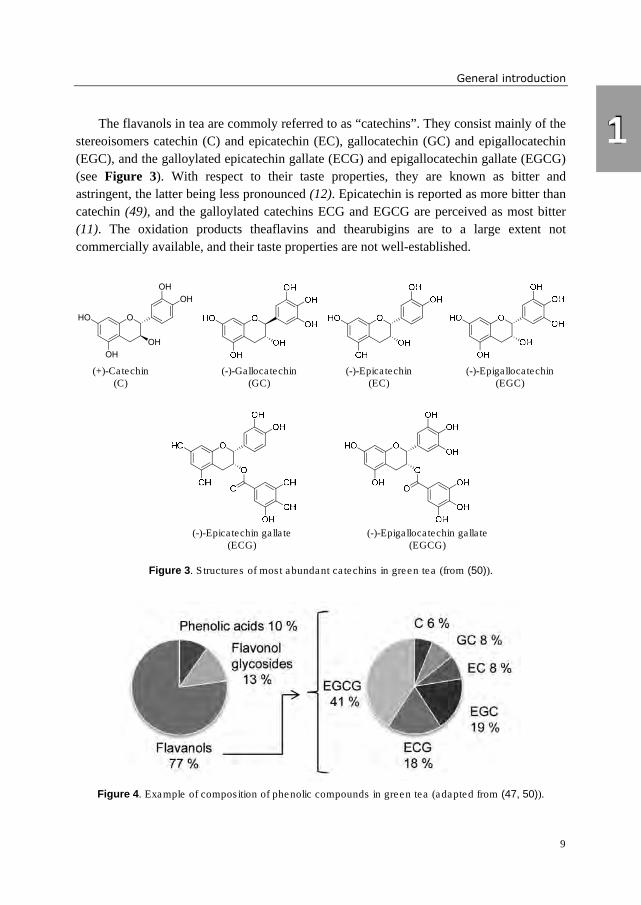
(w/w) phenolic compounds (47). Amongst them, the largest group consists of catechins
(Figure 3), whereas smaller amounts of phenolic acids (e.g. 5-galloylquinic acid and 5-
caffeoylquinic acid) and flavonol glycosides (e.g. quercetin 3-O-rutinoside and kaempferol
3-O-glucoside) are present. The compositions of phenolic compounds, flavanols in
particular, in green tea is illustrated in Figure 4. Besides phenolic compounds, tea contains
also the bitter alkaloids theobromine and caffeine (3-4 % w/w). During fermentation into
oolong and black tea, a large number of different structures are formed upon oxidation of
flavanols, resulting in thearubigins, theaflavins, and others. The exact composition of the
high molecular weight compounds, thearubigins in particular, and their molecular structures
are largely unknown (47, 48).
General introduction
9
The flavanols in tea are commoly referred to as “catechins”. They consist mainly of the
stereoisomers catechin (C) and epicatechin (EC), gallocatechin (GC) and epigallocatechin
(EGC), and the galloylated epicatechin gallate (ECG) and epigallocatechin gallate (EGCG)
(see Figure 3). With respect to their taste properties, they are known as bitter and
astringent, the latter being less pronounced (12). Epicatechin is reported as more bitter than
catechin (49), and the galloylated catechins ECG and EGCG are perceived as most bitter
(11). The oxidation products theaflavins and thearubigins are to a large extent not
commercially available, and their taste properties are not well-established.
Figure 3. Structures of most abundant catechins in green tea (from (50)).
Figure 4. Example of composition of phenolic compounds in green tea (adapted from (47, 50)).
OHO
OH
OH
OH
OH
(+)-Catechin(C)
(-)-Gallocatechin(GC)
(-)-Epicatechin(EC)
(-)-Epigallocatechin(EGC)
(-)-Epigallocatechin gallate(EGCG)
(-)-Epicatechin gallate(ECG)
1
Chapter 1
10
TASTE RECEPTORS
Taste perception
The perception of food is to a large extent determined by its taste, but actually it results
from a combination of all sensory senses: smell, taste, vision (e.g. color, appearance), touch
(e.g. texture, temperature, pain, astringency), and even sound (e.g. breaking of textures).
Interactions which may happen between senses are called “cross-modal interactions”,
finally leading to the overall sensory perception (51). In this thesis, the focus lays
exclusively on taste.
There are five basic tastes: sweet, salty, sour, bitter, and umami. Debate is still ongoing
regarding possible fat receptors. The function of taste is probably the evaluation of the
nutritional content of food (sweet: carbohydrates, salt: minerals, umami: proteins), but it
also acts as warning system against spoilage and toxicity (sour and bitter). Furthermore, it
has an important role in creating enjoyment during food consumption (52). Taste is
perceived via taste receptors activated by non-volatile compounds. These taste receptors are
located on the surface of taste receptor cells, embedded in taste buds. A taste bud can
contain taste receptor cells for all five taste qualities. Taste buds are located mainly in the
papillae on the tongue, but also in other tissues of the mouth and throat. Sweet, bitter and
umami receptors belong to the group of so-called G-protein coupled receptors (GPCRs),
also known as seven-transmembrane domain receptors, whereas salt and sour receptors are
ion channels (52).
Bitter taste receptors
In 2000, two research groups discovered bitter taste receptors in human and mouse (53-55).
They were first called T2Rs (53), TRBs (55), or TAS2Rs (56). Recently, the Gene
Nomenclature Committee of the Human Genome Organization (HUGO) adapted the human
TAS2R nomenclature (57). Human bitter taste receptor genes comprise of ~ 25 full length
members (58). Surprisingly, bitter taste receptors have not only been identified in oral
tissues, but also in e.g. the respiratory system and the gastrointestinal tract. Their functions
are not fully understood yet. Instead of contribution to taste perception, they might play a
role in digestion and metabolism (gastrointestinal tract) and act as a warning system for
inhalation of harmful substances (respiratory system) (59).
The signal transduction mechanisms of bitter receptors, belonging to the GPCR family,
have been characterized as follows. Upon activation of a bitter receptor by a bitter
compound, heterotrimeric G-proteins, consisting of Gαgustducin, Gβ3 (or Gβ1), and Gγ13,
couple to the receptor (60, 61). Subsequently, the G-proteins dissociate into Gαgustducin and
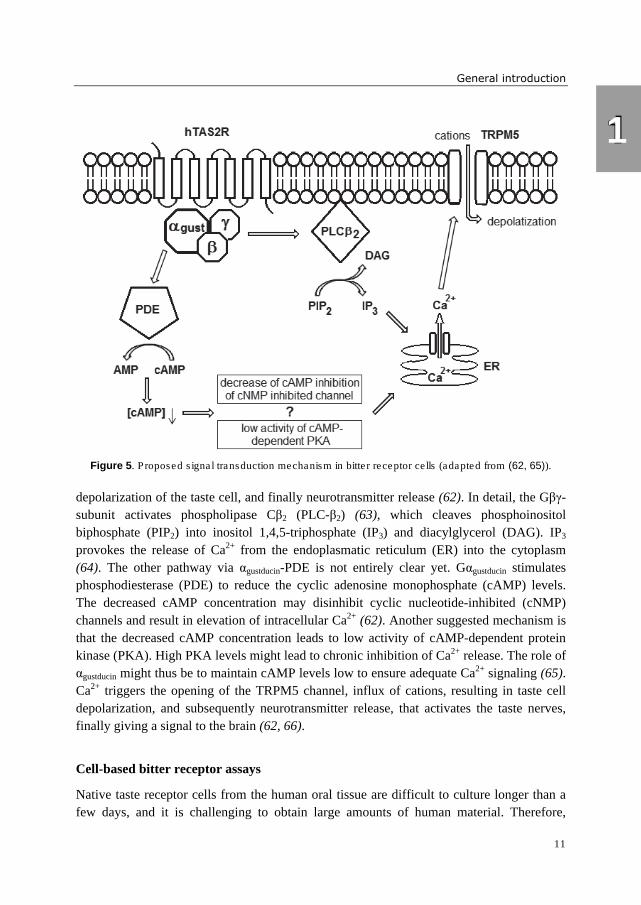
the Gβγ-subunit. Two pathways (αgustducin-PDE- pathway and βγ-PLC-β2-IP3/DAG pathway)
are described (Figure 5), which lead to the elevation of intracellular calcium levels, the
General introduction
11
Figure 5. Proposed signal transduction mechanism in bitter receptor cells (adapted from (62, 65)).
depolarization of the taste cell, and finally neurotransmitter release (62). In detail, the Gβγ-
subunit activates phospholipase Cβ2 (PLC-β2) (63), which cleaves phosphoinositol
biphosphate (PIP2) into inositol 1,4,5-triphosphate (IP3) and diacylglycerol (DAG). IP3
provokes the release of Ca2+ from the endoplasmatic reticulum (ER) into the cytoplasm
(64). The other pathway via αgustducin-PDE is not entirely clear yet. Gαgustducin stimulates
phosphodiesterase (PDE) to reduce the cyclic adenosine monophosphate (cAMP) levels.
The decreased cAMP concentration may disinhibit cyclic nucleotide-inhibited (cNMP)
channels and result in elevation of intracellular Ca2+ (62). Another suggested mechanism is
that the decreased cAMP concentration leads to low activity of cAMP-dependent protein
kinase (PKA). High PKA levels might lead to chronic inhibition of Ca2+ release. The role of
αgustducin might thus be to maintain cAMP levels low to ensure adequate Ca2+ signaling (65).
Ca2+ triggers the opening of the TRPM5 channel, influx of cations, resulting in taste cell
depolarization, and subsequently neurotransmitter release, that activates the taste nerves,
finally giving a signal to the brain (62, 66).
Cell-based bitter receptor assays
Native taste receptor cells from the human oral tissue are difficult to culture longer than a
few days, and it is challenging to obtain large amounts of human material. Therefore,
1
Chapter 1
12
heterologous expression systems in easy maintainable cells are used to study response of
bitter receptors towards bitter tastants. To this end, almost exclusively human embryonic
kidney (HEK)293 cells are used. As the native taste receptor specific G-proteins are lacking
in HEK293 cells, an easy-measurable readout system was created by co-expression of one
of the hTAS2Rs and Gα15 (54). This Gα subunit has been shown to couple to a wide range
of receptors and can activate a Ca2+ signaling pathway (54, 67). Intracellular Ca2+ release is
easily detectable by calcium-sensitive dyes in combination with fluorescence
measurements. Gα15 was used in the early hTAS2R studies (54, 56), but later on, the
sensitivity of the bitter receptor assay has been increased by the use of Gα16, containing the
last 44 amino acids of the native Gαgustducin (68). An alternative way to measure bitter
receptor activation has been reported for bitter receptors expressed in Spodoptera
frugiperda SF9 insect membranes, measuring guanosine 5’-O-(gamma-thio)-triphosphate
(GTPγS)-binding to α-gustducin (or its homolog, transducin) (54, 69). Despite the
advantage of a higher resemblance to the transduction mechanism in native cells, the latter
approach has the disadvantage of being a low throughput method. Hence the majority of
bitter receptor studies have been conducted in the HEK293 Gα16gust44 system.
For cell-based bitter receptor assays in HEK293 cells, stably expressing Gα16gust44,
transient (70) as well as stable (71) expression of the hTAS2R gene has been reported. For
this, HEK293 T cells and HEK293 T-REx Flp-In cells are used, respectively. With transient
(temporary) transfection the receptor DNA is temporarily expressed. As most of the DNA
is not integrated into the cell genome, it is degraded within a few days. Therefore, transient
transfection is merely useful for rapid analysis or when only a few experiments are
performed. On the other hand, stable cell lines, in which the receptor gene is stably
integrated into the cell genome, are more practical for frequent analyses. They have the
advantage that transfection only needs to be performed once and the expression level of the
gene is constant over time. An accompanying advantage of the Flp-In system is that the
integration side of the integrated gene is always the same, due to targeted recombination. In
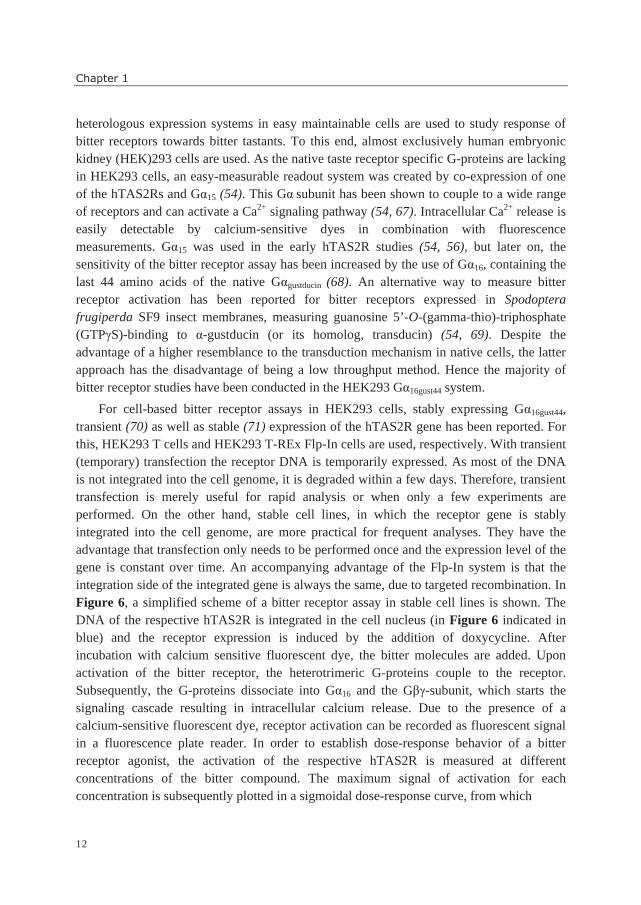
Figure 6, a simplified scheme of a bitter receptor assay in stable cell lines is shown. The
DNA of the respective hTAS2R is integrated in the cell nucleus (in Figure 6 indicated in
blue) and the receptor expression is induced by the addition of doxycycline. After
incubation with calcium sensitive fluorescent dye, the bitter molecules are added. Upon
activation of the bitter receptor, the heterotrimeric G-proteins couple to the receptor.
Subsequently, the G-proteins dissociate into Gα16 and the Gβγ-subunit, which starts the
signaling cascade resulting in intracellular calcium release. Due to the presence of a
calcium-sensitive fluorescent dye, receptor activation can be recorded as fluorescent signal
in a fluorescence plate reader. In order to establish dose-response behavior of a bitter
receptor agonist, the activation of the respective hTAS2R is measured at different
concentrations of the bitter compound. The maximum signal of activation for each
concentration is subsequently plotted in a sigmoidal dose-response curve, from which
General introduction
13
Figure 6. Simplified bitter taste receptor cell-assay, stably expressing the hTAS2R gene (partially adapted from (72)).
1
Chapter 1
14
receptor activation threshold, half maximal activation concentration (EC50) and maximal
receptor activation by the respective agonist can be obtained.
Characteristics of bitter taste receptors
Bitter receptors are the most diverse amongst the family of taste receptors. They can
recognize structurally very diverse bitter compounds (e.g. salts, peptides, lactones, phenolic
compounds, terpenes, alkaloids). Native bitter taste receptor cells can express multiple
hTAS2Rs (73), and it has been shown, that they are able to form oligomers in HEK cells
(74). However, no functional consequences seemed to result from this ability, and using
single hTAS2Rs in HEK cells in order to identify agonists seems to be appropriate.
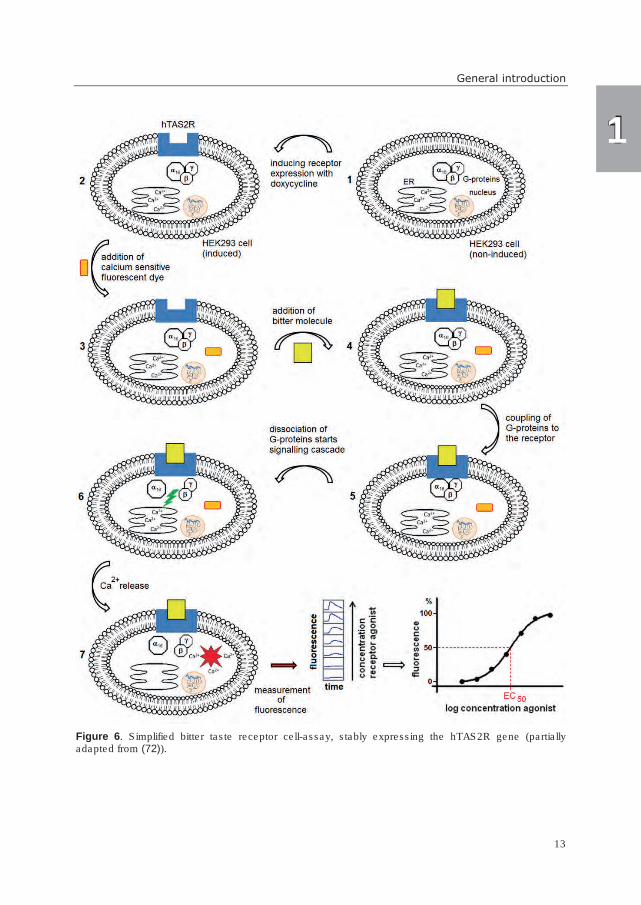
Bitter receptors are seven-transmembrane receptors, as they contain seven α-helices
passing through the cell membrane. Besides the seven transmembrane (TM) regions, they
comprise of three extracellular loops (EL) and three intracellular loops (IL). Amongst the
25 hTAS2Rs, the lengths of the loops, extracellular N-termini, and intracellular C-termini
are quite variable (75). Figure 7 shows a snake plot of a generic bitter taste receptor. Most
literature suggests the presence of a single ligand binding site. This binding pocket is most
probably located within the transmembrane-region (76-81). Predicted or experimentally
confirmed amino acid residues involved in agonist interaction are accumulated in TM III,
VI, and VII (76). However, a possible influence of EL1 and EL2 in agonist selectivity has
Figure 7. Snake plot of a generic hTAS2R. Amino acid positions involved in agonist interaction in the
receptors hTAS2R1 (81, 82), -16 (77, 83), -30 (69), -38 (79), and -46 (78) are indicated by colors (red,
predicted in four receptors, green, two hits, blue, one hit.) (adapted from (76)).
General introduction
15
been reported as well (69, 80). So far, information on amino acid residues involved in
ligand binding is limited to hTAS2R1, -16, -30, -31, -38, -43, and -46.
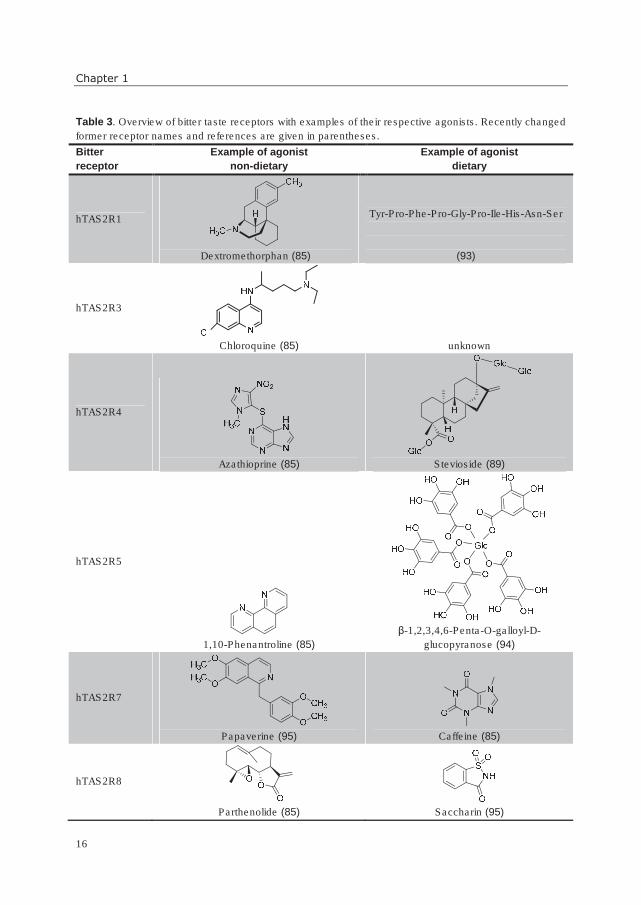
A state-of-the-art overview of hTASRs and examples of their agonists, divided into
dietary and non-dietary origin, is given in Table 3. Some bitter receptors are broadly tuned,
meaning that they are activated by several classes of compounds (hTAS2R1, -4, -10, -14,
-39, and -46), whereas others have, so far, a very limited agonist spectrum of one or two
agonists only (hTAS2R3, -13, -41, -49, and -50). Two bitter taste receptors, hTAS2R16 and
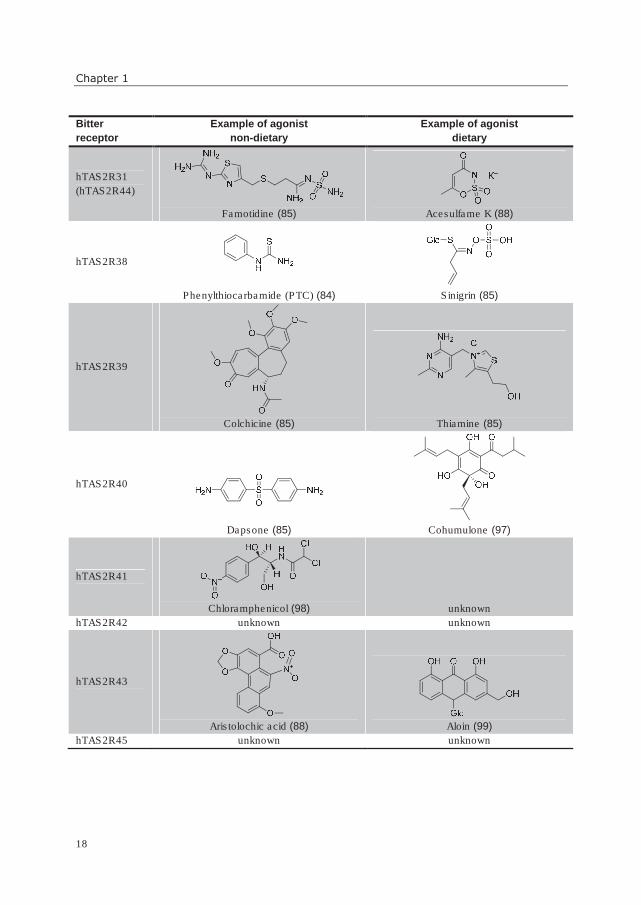
hTAS2R38, seem to respond quite specifically to almost exclusively one kind of chemical
structure (mainly β-glucopyranosides for hTAS2R16 and mainly sulfur-containing
compounds for hTAS2R38) (56, 84, 85). For some bitter receptors (hTAS2R3, -9, -13, -20,
and -41), only non-dietary agonists have been identified so far. For four hTAS2Rs, no
agonists have been identified yet. Such receptors are called “orphan receptors”. Also, not
all compounds known as bitter have been assigned to hTAS2Rs yet, but the progress in the
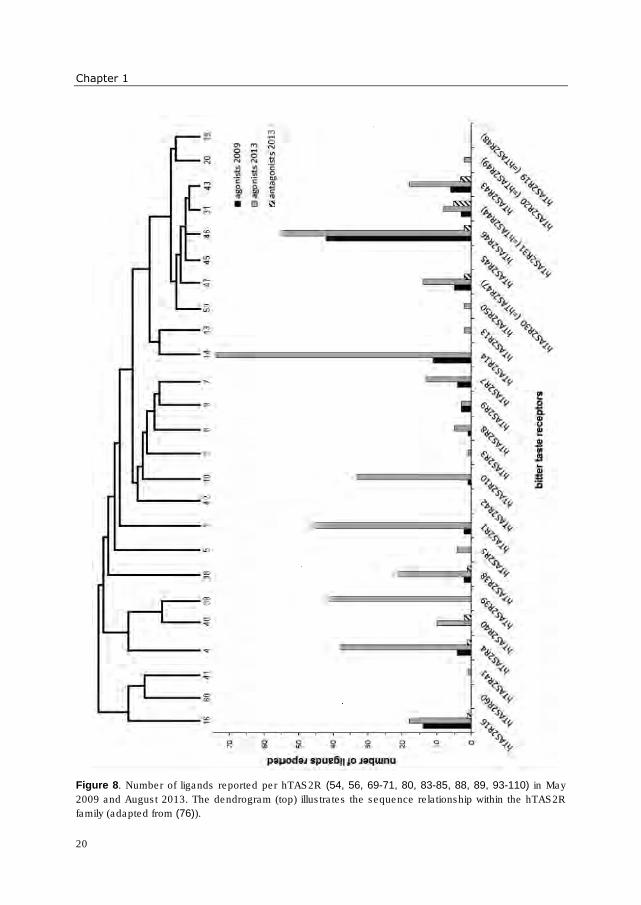
last years is enormous. In Figure 8 this progress is illustrated, showing that e.g. only half of
all human bitter receptors were deorphanized in the beginning of this Ph.D. research (May
2009), whereas at the time of writing (August 2013), only four receptors were not assigned
to bitter compounds yet. Especially the number of compounds identified as agonists has
risen enormously.
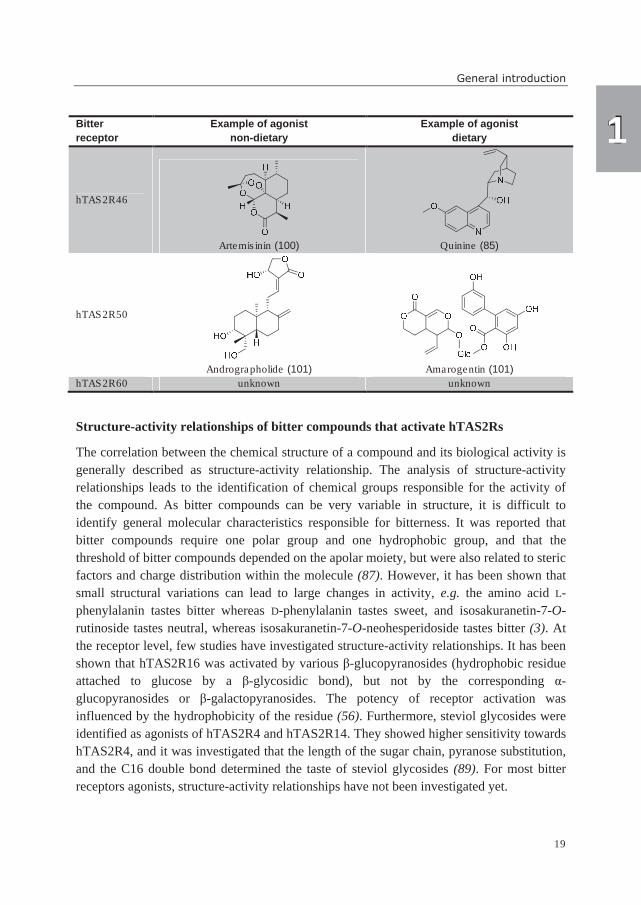
The compounds known as most intensely bitter are the synthetic compound denatonium
(86) and the natural compound amarogentin (87). Not only obviously bitter compounds are
hTAS2R agonists. The sweet compounds acesulfame K, saccharin, and steviol glycosides
exhibit bitter after taste. This observation has been explained by the identification of bitter
receptors activated by these sweeteners (88, 89).
Furthermore, in bitter receptors, a considerable number of single-nucleotide
polymorphisms (SNPs) is known. The most prominent example is hTAS2R38, in which
SNPs lead to “taster” and “non-taster” phenotypes. “Tasters” perceive 6-n-propylthiouracil
(PROP) and phenylthiocarbamide (PTC) as bitter, whereas “non-tasters” do not. Likewise,
at receptor level, the hTAS2R38-PAV (taster) variant is activated by both substances,
whereas the hTAS2R38-AVI (non-taster) variant is not (84). This example shows also that
in vitro measurements of bitter receptors expressed in HEK cells can resemble in vivo
situations. Remarkably, the ratio of “tasters” versus “non-tasters” based on hTAS2R38
polymorphisms in the human population is approximately 50 % / 50 %, though with
regional differences (90). In contrast, for some other receptors, e.g. hTAS2R14, SNP ratios
of 99 % / 1% in the human population are reported (75), and functional SNPs are unknown
(91). Besides the SNP variants, also the density of taste buds seems to play a role in
bitterness sensitivity (92).
1
Chapter 1
16
Table 3. Overview of bitter taste receptors with examples of their respective agonists. Recently changed
former receptor names and references are given in parentheses.
Bitter
receptor
Example of agonist
non-dietary
Example of agonist
dietary
hTAS2R1
Dextromethorphan (85)
Tyr-Pro-Phe-Pro-Gly-Pro-Ile-His-Asn-Ser
(93)
hTAS2R3
Chloroquine (85) unknown
hTAS2R4
Azathioprine (85)
Stevioside (89)
hTAS2R5
1,10-Phenantroline (85)
β-1,2,3,4,6-Penta-O-galloyl-D-
glucopyranose (94)
hTAS2R7
Papaverine (95)
Caffeine (85)
hTAS2R8
Parthenolide (85)
Saccharin (95)
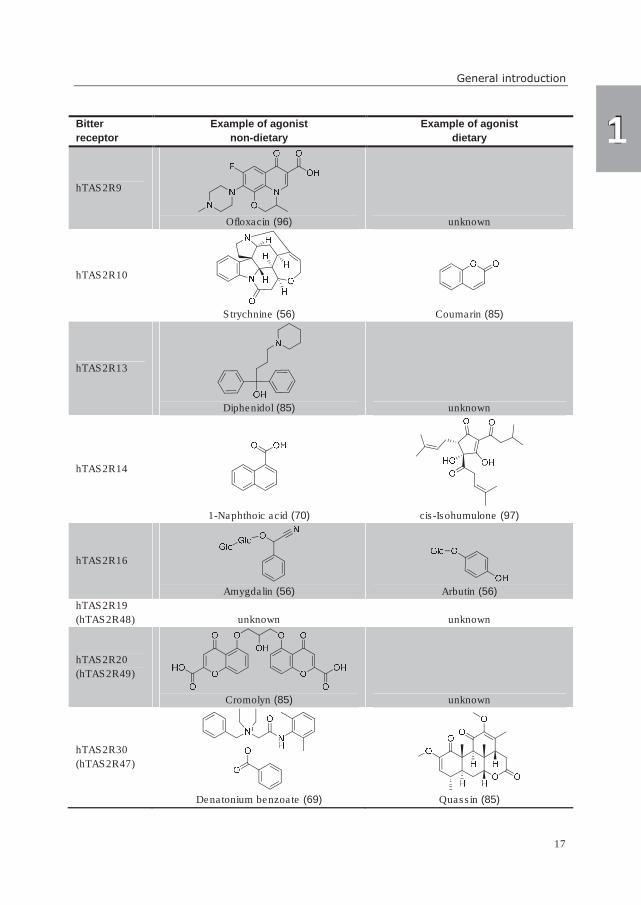
General introduction
17
Bitter
receptor
Example of agonist
non-dietary
Example of agonist
dietary
hTAS2R9
Ofloxacin (96) unknown
hTAS2R10
Strychnine (56)
Coumarin (85)
hTAS2R13
Diphenidol (85) unknown
hTAS2R14
1-Naphthoic acid (70)
cis-Isohumulone (97)
hTAS2R16
Amygdalin (56)
Arbutin (56)
hTAS2R19
(hTAS2R48) unknown unknown
hTAS2R20
(hTAS2R49)
Cromolyn (85) unknown
hTAS2R30
(hTAS2R47)
Denatonium benzoate (69)
Quassin (85)
1
Chapter 1
18
Bitter
receptor
Example of agonist
non-dietary
Example of agonist
dietary
hTAS2R31
(hTAS2R44)
Famotidine (85)
Acesulfame K (88)
hTAS2R38
Phenylthiocarbamide (PTC) (84)
Sinigrin (85)
hTAS2R39
Colchicine (85)
Thiamine (85)
hTAS2R40
Dapsone (85)
Cohumulone (97)
hTAS2R41
Chloramphenicol (98) unknown
hTAS2R42 unknown unknown
hTAS2R43
Aristolochic acid (88)
Aloin (99)
hTAS2R45 unknown unknown
General introduction
19
Bitter
receptor
Example of agonist
non-dietary
Example of agonist
dietary
hTAS2R46
Artemisinin (100)
Quinine (85)
hTAS2R50
Andrographolide (101)
Amarogentin (101)
hTAS2R60 unknown unknown
Structure-activity relationships of bitter compounds that activate hTAS2Rs
The correlation between the chemical structure of a compound and its biological activity is
generally described as structure-activity relationship. The analysis of structure-activity
relationships leads to the identification of chemical groups responsible for the activity of
the compound. As bitter compounds can be very variable in structure, it is difficult to
identify general molecular characteristics responsible for bitterness. It was reported that
bitter compounds require one polar group and one hydrophobic group, and that the
threshold of bitter compounds depended on the apolar moiety, but were also related to steric
factors and charge distribution within the molecule (87). However, it has been shown that
small structural variations can lead to large changes in activity, e.g. the amino acid L-
phenylalanin tastes bitter whereas D-phenylalanin tastes sweet, and isosakuranetin-7-O-
rutinoside tastes neutral, whereas isosakuranetin-7-O-neohesperidoside tastes bitter (3). At
the receptor level, few studies have investigated structure-activity relationships. It has been
shown that hTAS2R16 was activated by various β-glucopyranosides (hydrophobic residue
attached to glucose by a β-glycosidic bond), but not by the corresponding α-
glucopyranosides or β-galactopyranosides. The potency of receptor activation was
influenced by the hydrophobicity of the residue (56). Furthermore, steviol glycosides were
identified as agonists of hTAS2R4 and hTAS2R14. They showed higher sensitivity towards
hTAS2R4, and it was investigated that the length of the sugar chain, pyranose substitution,
and the C16 double bond determined the taste of steviol glycosides (89). For most bitter
receptors agonists, structure-activity relationships have not been investigated yet.
1
Chapter 1
20
Figure 8. Number of ligands reported per hTAS2R (54, 56, 69-71, 80, 83-85, 88, 89, 93-110) in May
2009 and August 2013. The dendrogram (top) illustrates the sequence relationship within the hTAS2R
family (adapted from (76)).
General introduction
21
REDUCTION OF BITTER TASTE
Strategies for masking or reduction of bitter taste
For the majority of bitter tasting food products, efforts have been made to either reduce the
level of bitter tasting compounds or to mask the bitter taste. In vegetables, for example,
selective breeding has been applied for a long time, leading to e.g. Brussels sprouts
varieties, which have low bitterness (1). Besides traditionally bitter food products, there are
also products in which bitterness is a newly introduced problem. These are either functional
foods, fortified with health promoting, but bitter, ingredients, or they are low-sugar / low-
fat / low-salt products, developed due to health concerns in the context of overweight,
diabetes, and cardiovascular disease. The reduced amount of sugar, fat, and / or salt can
lead to the perception of previously masked, undesired taste properties (sour, bitter,
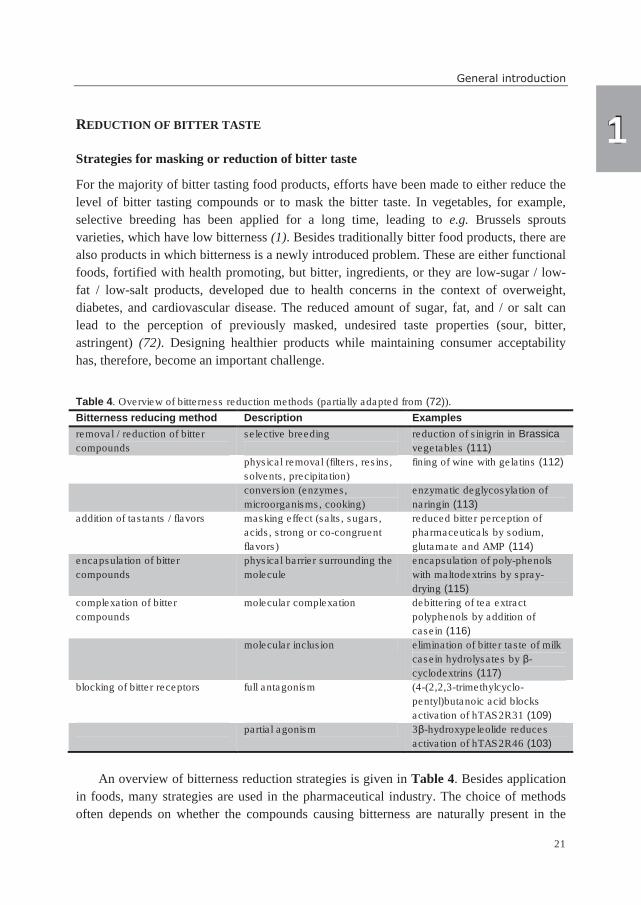
astringent) (72). Designing healthier products while maintaining consumer acceptability
has, therefore, become an important challenge.
Table 4. Overview of bitterness reduction methods (partially adapted from (72)).
Bitterness reducing method Description Examples
removal / reduction of bitter
compounds
selective breeding
reduction of sinigrin in Brassica
vegetables (111)
physical removal (filters, resins,
solvents, precipitation)
fining of wine with gelatins (112)
conversion (enzymes,
microorganisms, cooking)
enzymatic deglycosylation of
naringin (113)
addition of tastants / flavors masking effect (salts, sugars,
acids, strong or co-congruent
flavors)
reduced bitter perception of
pharmaceuticals by sodium,
glutamate and AMP (114)
encapsulation of bitter
compounds
physical barrier surrounding the
molecule
encapsulation of poly-phenols
with maltodextrins by spray-
drying (115)
complexation of bitter
compounds
molecular complexation debittering of tea extract
polyphenols by addition of
casein (116)
molecular inclusion elimination of bitter taste of milk
casein hydrolysates by β-
cyclodextrins (117)
blocking of bitter receptors full antagonism (4-(2,2,3-trimethylcyclo-
pentyl)butanoic acid blocks
activation of hTAS2R31 (109)
partial agonism 3β-hydroxypeleolide reduces
activation of hTAS2R46 (103)
An overview of bitterness reduction strategies is given in Table 4. Besides application
in foods, many strategies are used in the pharmaceutical industry. The choice of methods
often depends on whether the compounds causing bitterness are naturally present in the
1
Chapter 1
22
food product or are added. The taste of health promoting ingredients should be masked,
because removal would also remove their potential health benefits. Methods such as
encapsulation of compounds by spray drying are not applicable when the bitter compounds
are already present in the food raw material. Often, a combination of methods has to be
used to eliminate bitter taste.
Complexation of bitter compounds
A molecular complex is formed by loose association involving two or more molecules. The
bonding between the components of a complex is of a reversible nature and weaker than a
covalent bond (118).
One form of complexation applied in pharmaceutical and food industry is molecular
inclusion by cyclodextrins (117). It is used in order to reduce unpleasant tastes or smells, or
to enhance the water solubility of hydrophobic compounds. Cyclodextrins represent a
family of cyclic oligosaccharides, consisting of glucose units bound through α-(1,4)
linkages. α-, β-, and γ-cyclodextrins are composed of 6, 7, and 8 units, respectively (119).
They form a cylinder-shaped structure (host), comprising of a hydrophilic outer surface and
a hydrophobic cavity. This cavity can include a (hydrophobic) guest molecule, mostly by a
host:guest ratio of 1:1, providing that the guest molecule fits geometrically into the cavity
(117). In food applications, cyclodextrins are most often used as β-form. They have been
shown to mask bitter taste of various dietary compounds, e.g. protein hydrolysates,
vitamins and phenolic compounds (117, 119).
Another form of complexation makes use of the interactions between proteins and
phenolic compounds. Complex formation between proteins and phenolic compounds is
mainly driven by hydrophobic interactions and hydrogen bonding. Hydrophobic
interactions occur primarily between apolar amino acid residues (mainly proline) and the
aromatic rings of phenolic compounds. Hydrogen bonds are formed between the amine or
carbonyl groups of amino acid residues and the hydroxyl groups of phenolic compounds
(120). The formation and stability of a protein-phenolic complex is largely determined by
the accessibility of proline residues as well as the structural properties of phenolic
compounds. Proteins having open structures favor binding to phenolics, in contrast to
proteins having globular structures. With respect to phenolic compounds, conformation,
flexibility, galloylation and degree of polymerization have been shown to be important
drivers of protein-phenolic interactions (121).
Reduction of bitter taste by receptor blockers
One of the newest approaches to reduce bitter taste is the use of so-called bitter receptor
blockers. These are antagonists of the bitter taste receptor, which inhibit receptor activation
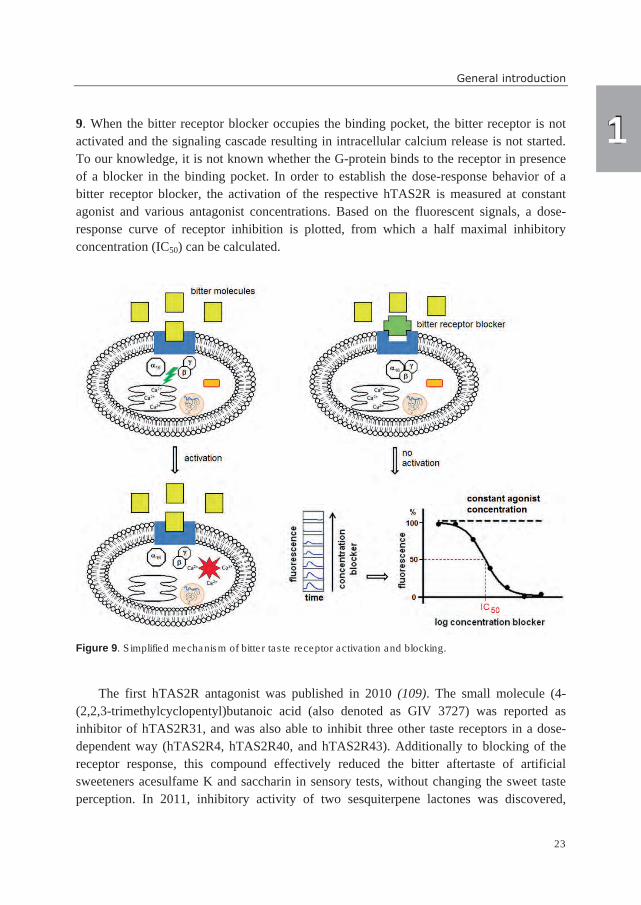
by the bitter compound. A simplified mechanism of receptor blocking is shown in Figure
General introduction
23
9. When the bitter receptor blocker occupies the binding pocket, the bitter receptor is not
activated and the signaling cascade resulting in intracellular calcium release is not started.
To our knowledge, it is not known whether the G-protein binds to the receptor in presence
of a blocker in the binding pocket. In order to establish the dose-response behavior of a
bitter receptor blocker, the activation of the respective hTAS2R is measured at constant
agonist and various antagonist concentrations. Based on the fluorescent signals, a dose-
response curve of receptor inhibition is plotted, from which a half maximal inhibitory
concentration (IC50) can be calculated.
Figure 9. Simplified mechanism of bitter taste receptor activation and blocking.
The first hTAS2R antagonist was published in 2010 (109). The small molecule (4-
(2,2,3-trimethylcyclopentyl)butanoic acid (also denoted as GIV 3727) was reported as
inhibitor of hTAS2R31, and was also able to inhibit three other taste receptors in a dose-
dependent way (hTAS2R4, hTAS2R40, and hTAS2R43). Additionally to blocking of the
receptor response, this compound effectively reduced the bitter aftertaste of artificial
sweeteners acesulfame K and saccharin in sensory tests, without changing the sweet taste
perception. In 2011, inhibitory activity of two sesquiterpene lactones was discovered,
1
Chapter 1
24
namely of 3β-hydroxydihydrocostunolide (3HDC) for hTAS2R30, hTAS2R40, and
hTAS2R46, and of 3β-hydroxypelenolide (3HP) for hTAS2R30, hTAS2R31, hTAS2R43,
and hTAS2R46 (103). The latter compound was shown to activate hTAS2R46 weakly, thus
the reduction of receptor activation was caused by partial agonism. Although a partial
agonist activates the receptor as well, it competes with the full agonist for receptor binding
and its action results in a much lower receptor activation compared to the full agonist.
Furthermore, it was shown (103) that a compound can act as agonist towards one taste
receptor, but as antagonist towards another taste receptor, as the two compounds 3HDC and
3HP, besides their inhibitory properties, showed agonistic properties towards other bitter
receptors.
At present, few compounds have been published to act as antagonists on bitter taste
receptors. This is shown in the ligand overview in Figure 8. It should be noted that only
dose-dependent receptor inhibition has been included in the figure, as dose-independent
inhibition (e.g. reported by (122)) might have been caused by mechanisms other than
receptor antagonism.
Mechanisms of receptor antagonism
There are two basic molecular mechanisms of receptor antagonism. When the antagonist
blocks the access of the agonist to the receptor through steric hindrance, this is referred to
as orthosteric antagonism. When the antagonist binds to another binding site on the receptor
than the agonist, a change of affinity of the receptor to the agonist is induced through a
change in conformation of the receptor. This is referred to as allosteric antagonism (123). In
experimental pharmacology, cell lines expressing the receptor of interest are pre-incubated
with the antagonist and then challenged with increasing agonist concentrations (124). In the
orthosteric mechanism, agonist and antagonist compete for the same binding site, and the
relative affinity and concentrations of agonist and antagonist determine which molecule
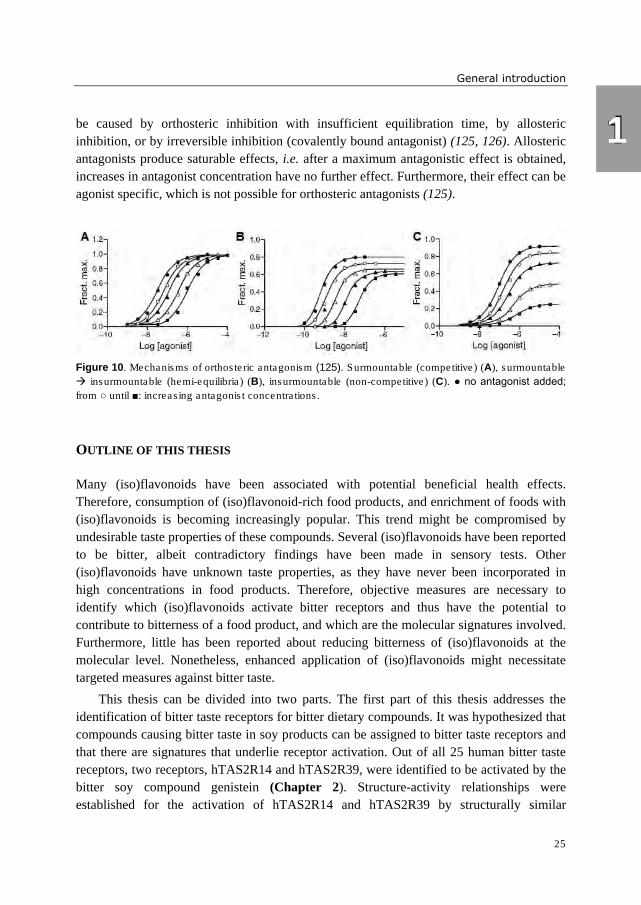
occupies the binding site. Figure 10 illustrates that it depends on the kinetics of the system
whether this results in surmountable antagonism (dextral displacement of the dose-response
curve without depression of maximal amplitude) (A), in an intermediate state between
surmountable and insurmoutable antagonism (dextral displacement and moderate
depression of the maximal response) (B), or in insurmountable antagonism (depression of
maximal amplitude) (C). The first case is observed when agonist and antagonist are in
equilibrium with each other, meaning that there is sufficient time for the antagonist to
dissociate from the receptors, and the agonist to bind to unbound receptors (125). The
second case is called “hemi-equilibrium”, whereby agonist, antagonist and receptors have
partially come to equilibrium with each other (123). The last phenomenon is observed when
the dissociation rate of the antagonist from the receptors is slower than a competing process
with the agonist (126). It should be noted that more than one molecular mechanism can
produce the same pattern of dose-response curves, e.g. insurmountable antagonism (C) can
General introduction
25
be caused by orthosteric inhibition with insufficient equilibration time, by allosteric
inhibition, or by irreversible inhibition (covalently bound antagonist) (125, 126). Allosteric
antagonists produce saturable effects, i.e. after a maximum antagonistic effect is obtained,
increases in antagonist concentration have no further effect. Furthermore, their effect can be
agonist specific, which is not possible for orthosteric antagonists (125).
Figure 10. Mechanisms of orthosteric antagonism (125). Surmountable (competitive) (A), surmountable
� insurmountable (hemi-equilibria) (B), insurmountable (non-competitive) (C). ● no antagonist added;
from ○ until ■: increasing antagonist concentrations.
OUTLINE OF THIS THESIS
Many (iso)flavonoids have been associated with potential beneficial health effects.
Therefore, consumption of (iso)flavonoid-rich food products, and enrichment of foods with
(iso)flavonoids is becoming increasingly popular. This trend might be compromised by
undesirable taste properties of these compounds. Several (iso)flavonoids have been reported
to be bitter, albeit contradictory findings have been made in sensory tests. Other
(iso)flavonoids have unknown taste properties, as they have never been incorporated in
high concentrations in food products. Therefore, objective measures are necessary to
identify which (iso)flavonoids activate bitter receptors and thus have the potential to
contribute to bitterness of a food product, and which are the molecular signatures involved.
Furthermore, little has been reported about reducing bitterness of (iso)flavonoids at the
molecular level. Nonetheless, enhanced application of (iso)flavonoids might necessitate
targeted measures against bitter taste.
This thesis can be divided into two parts. The first part of this thesis addresses the
identification of bitter taste receptors for bitter dietary compounds. It was hypothesized that
compounds causing bitter taste in soy products can be assigned to bitter taste receptors and
that there are signatures that underlie receptor activation. Out of all 25 human bitter taste
receptors, two receptors, hTAS2R14 and hTAS2R39, were identified to be activated by the
bitter soy compound genistein (Chapter 2). Structure-activity relationships were
established for the activation of hTAS2R14 and hTAS2R39 by structurally similar
1
Chapter 1
26
isoflavonoids. Moreover, a substitution pattern of isoflavonoids most favorable for
activation of these two bitter receptors was determined. Next, it was hypothesized that bitter
flavonoids hold a molecular signature involved in bitter receptor activation, which enables
prediction of intrinsic bitterness. Therefore, in Chapter 3, a large group of structurally
similar flavonoids was measured on the same two receptors. The aim was to investigate
chemical characteristics for (iso)flavonoids to activate hTAS2R14 and hTAS2R39. This
investigation was underpinned by 2D-fingerprint and 3D-pharmacophore modeling, and led
to the identification of the molecular features necessary for (iso)flavonoids to activate
hTAS2R14 and hTAS2R39, and the differences therein.
The second part of this thesis addresses debittering strategies. Based on known bitter
masking effects of flavanones in sensory studies, it was assumed that flavanones have the
ability to block (iso)flavonoid bitter receptors on the molecular level. Chapter 4 describes
the identification and characterization of flavanones as antagonists for hTAS2R39. Their
ability to reduce hTAS2R39 activation by ECG, their pharmacological properties, as well
as their ability to block hTAS2R14 were investigated. In Chapter 5 it was hypothesized
that bitter taste reduction for dietary flavonoids by complexation with food proteins can be
predicted by use of in vitro assays. The potential of β-casein, β-lactoglobulin and different
gelatins to reduce hTAS2R39 activation by complexation of bitter tea EGCG was evaluated
in in vitro binding studies, and transferred to the in vivo situation, in which a trained
sensory panel determined bitterness. Finally, Chapter 6 discusses the findings presented in
this thesis, addresses prospects and limitations of the bitter receptor cell assay, presents
additional results on testing (iso)flavonoids for possible antagonistic properties, and
compares taste evaluation by sensory tests, receptor assays and modeling. Furthermore it
evaluates strategies for bitter taste reduction, and applies the findings to soy products and
tea.
REFERENCES
1. Drewnowski, A.; Gomez-Carneros, C. Bitter taste, phytonutrients, and the consumer: A review.
American Journal of Clinical Nutrition 2000, 72 (6), 1424-1435.
2. Baltes, W. Lebensmittelchemie; 5 ed.; Springer: Berlin, Germany, 2000.
3. Belitz, H.-D.; Grosch, W.; Schieberle, P. Lehrbuch der Lebensmittelchemie; 5 ed.; Springer:
Berlin, Germany, 2001.
4. Frank, O.; Ottinger, H.; Hofmann, T. Characterization of an intense bitter-tasting 1H,4H-
quinolizinium-7-olate by application of the taste dilution analysis, a novel bioassay for the
screening and identification of taste-active compounds in foods. Journal of Agricultural and
Food Chemistry 2001, 49 (1), 231-238.
5. Ververidis, F.; Trantas, E.; Douglas, C.; Vollmer, G.; Kretzschmar, G.; Panopoulos, N.
Biotechnology of flavonoids and other phenylpropanoid-derived natural products. Part I:
Chemical diversity, impacts on plant biology and human health. Biotechnology Journal 2007,
2 (10), 1214-1234.
General introduction
27
6. Simons, R. Prenylated isoflavonoids from soya and licorice. Analysis, induction and in vitro
estrogenicity. Ph.D. thesis. Wageningen University, Wageningen, The Netherlands, 2011.
7. Beecher, G. R. Overview of dietary flavonoids: Nomenclature, occurrence and intake. Journal of
Nutrition 2003, 133 (10), 3248S-3254S.
8. Kuijpers, T. F. M. Inhibition of tyrosinase-mediated enzymatic browning by sulfite and natural
alternatives. Ph.D. thesis. Wageningen University, Wageningen, The Netherlands, 2013.
9. Soto-Vaca, A.; Gutierrez, A.; Losso, J. N.; Xu, Z.; Finley, J. W. Evolution of phenolic compounds
from color and flavor problems to health benefits. Journal of Agricultural and Food
Chemistry 2012, 60 (27), 6658-6677.
10. Ley, J. P.; Dessoy, M.; Paetz, S.; Blings, M.; Hoffmann-Lücke, P.; Reichelt, K. V.; Krammer, G.
E.; Pienkny, S.; Brandt, W.; Wessjohann, L. Identification of enterodiol as a masker for
caffeine bitterness by using a pharmacophore model based on structural analogues of
homoeriodictyol. Journal of Agricultural and Food Chemistry 2012, 60 (25), 6303-6311.
11. Narukawa, M.; Kimata, H.; Noga, C.; Watanabe, T. Taste characterisation of green tea catechins.
International Journal of Food Science and Technology 2010, 45 (8), 1579-1585.
12. Peleg, H.; Gacon, K.; Schlich, P.; Noble, A. C. Bitterness and astringency of flavan-3-ol
monomers, dimers and trimers. Journal of the Science of Food and Agriculture 1999, 79 (8),
1123-1128.
13. Sáenz-Navajas, M. P.; Ferreira, V.; Dizy, M.; Fernández-Zurbano, P. Characterization of taste-
active fractions in red wine combining HPLC fractionation, sensory analysis and ultra
performance liquid chromatography coupled with mass spectrometry detection. Analytica
Chimica Acta 2010, 673 (2), 151-159.
14. Intelmann, D.; Haseleu, G.; Hofmann, T. LC-MS/MS quantitation of hop-derived bitter
compounds in beer using the ECHO technique. Journal of Agricultural and Food Chemistry
2009, 57 (4), 1172-1182.
15. Hufnagel, J. C.; Hofmann, T. Orosensory-directed identification of astringent mouthfeel and
bitter-tasting compounds in red wine. Journal of Agricultural and Food Chemistry 2008, 56
(4), 1376-1386.
16. Thompson, L. U.; Boucher, B. A.; Liu, Z.; Cotterchio, M.; Kreiger, N. Phytoestrogen content of
foods consumed in Canada, including isoflavones, lignans, and coumestan. Nutrition and
Cancer 2006, 54 (2), 184-201.
17. Chen, X. J.; Zhao, J.; Meng, Q.; Li, S. P.; Wang, Y. T. Simultaneous determination of five
flavonoids in licorice using pressurized liquid extraction and capillary electrochromatography
coupled with peak suppression diode array detection. Journal of Chromatography A 2009,
1216 (43), 7329-7335.
18. Rothwell, J. A.; Urpi-Sarda, M.; Boto-Ordoñez, M.; Knox, C.; Llorach, R.; Eisner, R.; Cruz, J.;
Neveu, V.; Wishart, D.; Manach, C.; Andres-Lacueva, C.; Scalbert, A. Phenol-Explorer 2.0:
A major update of the Phenol-Explorer database integrating data on polyphenol metabolism
and pharmacokinetics in humans and experimental animals. Database : The Journal of
Biological Databases and Curation 2012, doi: 10.1093/database/bas031.
19. Rothwell, J. A.; Pérez-Jiménez, J.; Neveu, V.; Medina-Ramon, A.; M'Hiri, N.; Garcia Lobato, P.;
Manach, C.; Knox, K.; Eisner, R.; Wishart, D.; Scalbert, A. Phenol-Explorer 3.0: A major
update of the Phenol-Explorer database to incorporate data on the effects of food processing
on polyphenol content. submitted 2013.
20. Phenol Explorer 3.0. http://www phenol-explorer.eu/ (last accessed 3 Aug 2013) 2013.
21. Chongqing Trust Long Co., L. Citrus ingredients. http://www.neohesperidin-
dc.com/pages/neohesperidin-ihydrochalcone. htm (last accessed 1-9-2013) 2013.
22. Lesschaeve, I.; Noble, A. C. Polyphenols: factors influencing their sensory properties and their
effects on food and beverage preferences. The American Journal of Clinical Nutrition 2005,
81 (1 Suppl), 330S-335S.
1
Chapter 1
28
23. Gibbins, H. L.; Carpenter, G. H. Alternative Mechanisms of Astringency - What is the Role of
Saliva? Journal of Texture Studies 2013, in press.
24. Callemien, D.; Collin, S. Structure, organoleptic properties, quantification methods, and stability
of phenolic compounds in beer - A review. Food Reviews International 2010, 26 (1), 1-84.
25. Setchell, K. D. R.; Cassidy, A. Dietary isoflavones: Biological effects and relevance to human
health. Journal of Nutrition 1999, 129 (3), 758S-767S.
26. Manach, C.; Mazur, A.; Scalbert, A. Polyphenols and prevention of cardiovascular diseases.
Current Opinion in Lipidology 2005, 16 (1), 77-84.
27. Ock, K. C.; Sang, J. C.; Song, W. O. Estimated dietary flavonoid intake and major food sources of
U.S. adults. Journal of Nutrition 2007, 137 (5), 1244-1252.
28. Mullie, P.; Clarys, P.; Deriemaeker, P.; Hebbelinck, M. Estimation of daily human intake of food
flavonoids. International Journal of Food Sciences and Nutrition 2008, 59 (4), 291-298.
29. Beking, K.; Vieira, A. An assessment of dietary flavonoid intake in the UK and Ireland.
International Journal of Food Sciences and Nutrition 2011, 62 (1), 17-19.
30. Maras, J. E.; Talegawkar, S. A.; Qiao, N.; Lyle, B.; Ferrucci, L.; Tucker, K. L. Flavonoid intakes
in the Baltimore Longitudinal Study of Aging. Journal of Food Composition and Analysis
2011, 24 (8), 1103-1109.
31. Coward, L.; Barnes, N. C.; Setchell, K. D. R.; Barnes, S. Genistein, daidzein, and their beta-
glycoside conjugates - Antitumor isoflavones in soybean foods from American and Asian
diets. Journal of Agricultural and Food Chemistry 1993, 41 (11), 1961-1967.
32. U.S.departement of agriculture USDA database for the flavonoid content of selected foods 3.0.
http://www.ars.usda.gov/SP2UserFiles/Place/12354500/Data/Flav/Flav3-1.pdf, (last
accessed 3 Aug 2013) 2013.
33. U.S. Department of Agriculture USDA database for the isoflavonoid content of selected foods
2.0. http://www.ars.usda. gov/SP2UserFiles/Place/12354500/Data/isoflav/Isoflav _R2.pdf
(last accessed 3 Aug 2013) 2007.
34. Crozier, A.; Jensen, E.; Lean, M. E. J.; McDonald, M. S. Quantitative analysis of flavonoids by
reversed-phase high-performance liquid chromatography. Journal of Chromatography A
1997, 761 (1-2), 315-321.
35. Mc Cue, P.; Shetty, K. Health benefits of soy isoflavonoids and strategies for enhancement: A
review. Critical Reviews in Food Science and Nutrition 2004, 44 (5), 361-367.
36. Okubo, K.; Iijima, M.; Kobayashi, Y.; Yoshokoshi, M.; Uchida, T.; Kudou, S. Components
responsible for the undesirable taste of soybean seeds. Bioscience, Biotechnology, and
Biochemistry 1992, 56 (1), 99-103.
37. Wang, H. J.; Murphy, P. A. Isoflavone content in commercial soybean foods. Journal of
Agricultural and Food Chemistry 1994, 42 (8), 1666-1673.
38. Wang, H. J.; Murphy, P. A. Isoflavone composition of American and Japanese soybeans in Iowa:
Effects of variety, crop year, and location. Journal of Agricultural and Food Chemistry 1994,
42 (8), 1674-1677.
39. Tsai, H. S.; Huang, L. J.; Lai, Y. H.; Chang, J. C.; Lee, R. S.; Chiou, R. Y. Y. Solvent effects on
extraction and HPLC analysis of soybean isoflavones and variations of isoflavone
compositions as affected by crop season. Journal of Agricultural and Food Chemistry 2007,
55 (19), 7712-7715.
40. Coward, L.; Smith, M.; Kirk, M.; Barnes, S. Chemical modification of isoflavones in soyfoods
during cooking and processing. American Journal of Clinical Nutrition 1998, 68 (6 SUPPL.),
1486S-1491S.
41. Murphy, P. A.; Barua, K.; Hauck, C. C. Solvent extraction selection in the determination of
isoflavones in soy foods. Journal of Chromatography B: Analytical Technologies in the
Biomedical and Life Sciences 2002, 777 (1-2), 129-138.
General introduction
29
42. Kudou, S.; Fleury, Y.; Welti, D.; Magnolato, D.; Kitamura, K.; Okubo, K. Malonyl isoflavone
glycosides in soybean seeds (Glycine max MERRILL). Agricultural and Biological Chemistry
1991, 55 (9), 2227-2233.
43. Aldin, E.; Reitmeier, C. A.; Murphy, P. Bitterness of soy extracts containing isoflavones and
saponins. Journal of Food Science 2006, 71 (3), S211-S215.
44. Matsuda, S.; Norimoto, F.; Matsumoto, Y.; Ohba, R.; Teramoto, Y.; Ohta, N.; Ueda, S.
Solubilization of a novel isoflavone glycoside-hydrolyzing β-glucosidase from Lactobacillus
casei subsp. rhamnosus. Journal of Fermentation and Bioengineering 1994, 77 (4), 439-441.
45. Matsuura, M.; Obata, A.; Fukushima, D. Objectionable flavor of soy milk developed during the
soaking of soybeans and its control. Journal of Food Science 1989, 54 (3), 602-605.
46. Song, T.; Barua, K.; Buseman, G.; Murphy, P. A. Soy isoflavone analysis: Quality control and a
new internal standard. American Journal of Clinical Nutrition 1998, 68 (6 SUPPL.), 1474S-
1479S.
47. Graham, H. N. Green tea composition, consumption, and polyphenol chemistry. Preventive
Medicine 1992, 21 (3), 334-350.
48. Drynan, J. W.; Clifford, M. N.; Obuchowicz, J.; Kuhnert, N. The chemistry of low molecular
weight black tea polyphenols. Natural Product Reports 2010, 27 (3), 417-462.
49. Kallithraka, S.; Bakker, J.; Clifford, M. N. Evaluation of bitterness and astringency of (+)-
catechin and (-)-epicatechin in red wine and in model solution. Journal of Sensory Studies
1997, 12 (1), 25-37.
50. Del Rio, D.; Stewart, A. J.; Mullen, W.; Burns, J.; Lean, M. E. J.; Brighenti, F.; Crozier, A.
HPLC-MSn analysis of phenolic compounds and purine alkaloids in green and black tea.
Journal of Agricultural and Food Chemistry 2004, 52 (10), 2807-2815.
51. Bult, J. H. F.; de Wijk, R. A.; Hummel, T. Investigations on multimodal sensory integration:
Texture, taste, and ortho- and retronasal olfactory stimuli in concert. Neuroscience Letters
2007, 411 (1), 6-10.
52. Chandrashekar, J.; Hoon, M. A.; Ryba, N. J. P.; Zuker, C. S. The receptors and cells for
mammalian taste. Nature 2006, 444 (7117), 288-294.
53. Adler, E.; Hoon, M. A.; Mueller, K. L.; Chandrashekar, J.; Ryba, N. J. P.; Zuker, C. S. A novel
family of mammalian taste receptors. Cell 2000, 100 (6), 693-702.
54. Chandrashekar, J.; Mueller, K. L.; Hoon, M. A.; Adler, E.; Feng, L.; Guo, W.; Zuker, C. S.; Ryba,
N. J. P. T2Rs function as bitter taste receptors. Cell 2000, 100 (6), 703-711.
55. Matsunami, H.; Montmayeur, J. P.; Buck, L. B. A family of candidate taste receptors in human
and mouse. Nature 2000, 404 (6778), 601-604.
56. Bufe, B.; Hofmann, T.; Krautwurst, D.; Raguse, J. D.; Meyerhof, W. The human TAS2R16
receptor mediates bitter taste in response to beta-glucopyranosides. Nature genetics 2002, 32
(3), 397-401.
57. Gene Nomenclature Committee of the Human Genome Organization (HUGO) HGNC.
http://www.genenames.org (last accessed 3 Aug 2013).
58. Shi, P.; Zhang, J. Extraordinary diversity of chemosensory receptor gene repertoires among
vertebrates. In Results and Problems in Cell Differentiation, 47 ed.; Springer, Berlin,
Germany, 2009; pp 1-23.
59. Behrens, M.; Meyerhof, W. Gustatory and extragustatory functions of mammalian taste receptors.
Physiology and Behavior 2011, 105 (1), 4-13.
60. McLaughlin, S. K.; McKinnon, P. J.; Margolskee, R. F. Gustducin is a taste-cell-specific G
protein closely related to the transducins. Nature 1992, 357 (6379), 563-569.
61. Huang, L.; Shanker, Y. G.; Dubauskaite, J.; Zheng, J. Z.; Yan, W.; Rosenzweig, S.; Spielman, A.
I.; Max, M.; Margolskee, R. F. Gγ13 colocalizes with gustducin in taste receptor cells and
mediates IP3 responses to bitter denatonium. Nature Neuroscience 1999, 2 (12), 1055-1062.
62. Margolskee, R. F. Molecular mechanisms of bitter and sweet taste transduction. Journal of
Biological Chemistry 2002, 277 (1), 1-4.
1
Chapter 1
30
63. Rössler, P.; Kroner, C.; Freitag, J.; Noè, J.; Breer, H. Identification of a phospholipase C β
subtype in rat taste cells. European Journal of Cell Biology 1998, 77 (3), 253-261.
64. Bernhardt, S. J.; Naim, M.; Zehavi, U.; Lindemann, B. Changes in IP3 and cytosolic Ca2+ in
response to sugars and non-sugar sweeteners in transduction of sweet taste in the rat. Journal
of Physiology 1996, 490 (2), 325-336.
65. Clapp, T. R.; Trubey, K. R.; Vandenbeuch, A.; Stone, L. M.; Margolskee, R. F.; Chaudhari, N.;
Kinnamon, S. C. Tonic activity of Gα-gustducin regulates taste cell responsivity. FEBS
Letters 2008, 582 (27), 3783-3787.
66. Kinnamon, S. C. Taste receptor signalling - from tongues to lungs. Acta Physiologica 2012, 204
(2), 158-168.
67. Krautwurst, D.; Yau, K. W.; Reed, R. R. Identification of ligands for olfactory receptors by
functional expression of a receptor library. Cell 1998, 95 (7), 917-926.
68. Ueda, T.; Ugawa, S.; Yamamura, H.; Imaizumi, Y.; Shimada, S. Functional interaction between
T2R taste receptors and G-protein α subunits expressed in taste receptor cells. Journal of
Neuroscience 2003, 23 (19), 7376-7380.
69. Pronin, A. N.; Tang, H.; Connor, J.; Keung, W. Identification of ligands for two human bitter T2R
receptors. Chemical Senses 2004, 29 (7), 583-593.
70. Behrens, M.; Brockhoff, A.; Kuhn, C.; Bufe, B.; Winnig, M.; Meyerhof, W. The human taste
receptor hTAS2R14 responds to a variety of different bitter compounds. Biochemical and
Biophysical Research Communications 2004, 319 (2), 479-485.
71. Le Neve, B.; Foltz, M.; Daniel, H.; Gouka, R. The steroid glycoside H.g.-12 from Hoodia
gordonii activates the human bitter receptor TAS2R14 and induces CCK release from HuTu-
80 cells. American Journal of Physiology-Gastrointestinal and Liver Physiology 2010, 299
(6), G1368-G1375.
72. Ley, J. P. Masking taste by molecules. Chemosensory Perception 2008, 1 (1), 58-77.
73. Behrens, M.; Foerster, S.; Staehler, F.; Raguse, J. D.; Meyerhof, W. Gustatory expression pattern
of the human TAS2R bitter receptor gene family reveals a heterogenous population of bitter
responsive taste receptor cells. Journal of Neuroscience 2007, 27 (46), 12630-12640.
74. Kuhn, C.; Bufe, B.; Batram, C.; Meyerhof, W. Oligomerization of TAS2R bitter taste receptors.
Chemical Senses 2010, 35 (5), 395-406.
75. Kazius, J.; Wurdinger, K.; Van Iterson, M.; Kok, J.; Bäck, T.; Ijzerman, A. P. GPCR NaVa
database: Natural variants in human G protein-coupled receptors. Human Mutation 2008, 29
(1), 39-44.
76. Behrens, M.; Meyerhof, W. Bitter taste receptor research comes of age: From characterization to
modulation of TAS2Rs. Seminars in Cell and Developmental Biology 2013, 24 (3), 215-221.
77. Sakurai, T.; Misaka, T.; Ishiguro, M.; Masuda, K.; Sugawara, T.; Ito, K.; Kobayashi, T.; Matsuo,
S.; Ishimaru, Y.; Asakura, T.; Abe, K. Characterization of the beta-D-glucopyranoside
binding site of the human bitter taste receptor hTAS2R16. Journal of Biological Chemistry
2010, 285 (36), 28373-28378.
78. Brockhoff, A.; Behrens, M.; Niv, M. Y.; Meyerhof, W. Structural requirements of bitter taste
receptor activation. Proceedings of the National Academy of Sciences of the United States of
America 2010, 107 (24), 11110-11115.
79. Biarnés, X.; Marchiori, A.; Giorgetti, A.; Lanzara, C.; Gasparini, P.; Carloni, P.; Born, S.;
Brockhoff, A.; Behrens, M.; Meyerhof, W. Insights into the binding of phenyltiocarbamide
(PTC) agonist to its target human TAS2R38 bitter receptor. PLoS ONE 2010, 5 (8), e12394.
80. Upadhyaya, J.; Pydi, S. P.; Singh, N.; Aluko, R. E.; Chelikani, P. Bitter taste receptor T2R1 is
activated by dipeptides and tripeptides. Biochemical and Biophysical Research
Communications 2010, 398 (2), 331-335.
81. Singh, N.; Pydi, S. P.; Upadhyaya, J.; Chelikani, P. Structural basis of activation of bitter taste
receptor T2R1 and comparison with class A G-protein-coupled receptors (GPCRs). Journal of
Biological Chemistry 2011, 286 (41), 36032-36041.
General introduction
31
82. Dai, W.; You, Z.; Zhou, H.; Zhang, J.; Hu, Y. Structure-function relationships of the human bitter
taste receptor hTAS2R1: Insights from molecular modeling studies. Journal of Receptors and
Signal Transduction 2011, 31 (3), 229-240.
83. Sakurai, T.; Misaka, T.; Ueno, Y.; Ishiguro, M.; Matsuo, S.; Ishimaru, Y.; Asakura, T.; Abe, K.
The human bitter taste receptor, hTAS2R16, discriminates slight differences in the
configuration of disaccharides. Biochemical and Biophysical Research Communications
2010, 402 (4), 595-601.
84. Bufe, B.; Breslin, P. A. S.; Kuhn, C.; Reed, D. R.; Tharp, C. D.; Slack, J. P.; Kim, U. K.; Drayna,
D.; Meyerhof, W. The molecular basis of individual differences in phenylthiocarbamide and
propylthiouracil bitterness perception. Current Biology 2005, 15 (4), 322-327.
85. Meyerhof, W.; Batram, C.; Kuhn, C.; Brockhoff, A.; Chudoba, E.; Bufe, B.; Appendino, G.;
Behrens, M. The molecular receptive ranges of human TAS2R bitter taste receptors. Chemical
Senses 2010, 35 (2), 157-170.
86. Saroli, A. Structure-activity relationship of a bitter compound: Denatonium chloride.
Naturwissenschaften 1984, 71 (8), 428-429.
87. Belitz, H.-D.; Wieser, H. Bitter compounds: Occurrence and structure-activity relationships. Food
Reviews International 1985, 1 (2), 271-354.
88. Kuhn, C.; Bufe, B.; Winnig, M.; Hofmann, T.; Frank, O.; Behrens, M.; Lewtschenko, T.; Slack, J.
P.; Ward, C. D.; Meyerhof, W. Bitter taste receptors for saccharin and acesulfame K. Journal
of Neuroscience 2004, 24 (45), 10260-10265.
89. Hellfritsch, C.; Brockhoff, A.; Stähler, F.; Meyerhof, W.; Hofmann, T. Human psychometric and
taste receptor responses to steviol glycosides. Journal of Agricultural and Food Chemistry
2012, 60 (27), 6782-6793.
90. Kim, U. K.; Jorgenson, E.; Coon, H.; Leppert, M.; Risch, N.; Drayna, D. Positional cloning of the
human quantitative trait locus underlying taste sensitivity to phenylthiocarbamide. Science
2003, 299 (5610), 1221-1225.
91. Allen, A. L.; McGeary, J. E.; Hayes, J. E. Rebaudioside A and rebaudioside D bitterness do not
covary with acesulfame-K bitterness or polymorphisms in TAS2R9 and TAS2R31.
Chemosensory Perception 2013, in press.
92. Miller, I. J.; Reedy, J. Variations in human taste bud density and taste intensity perception.
Physiology and Behavior 1990, 47 (6), 1213-1219.
93. Kohl, S.; Behrens, M.; Dunkel, A.; Hofmann, T.; Meyerhof, W. Amino acids and peptides
activate at least five members of the human bitter taste receptor family. Journal of
Agricultural and Food Chemistry 2013, 61 (1), 53-60.
94. Soares, S.; Kohl, S.; Thalmann, S.; Mateus, N.; Meyerhof, W.; De Freitas, V. Different phenolic
compounds activate distinct human bitter taste receptors. Journal of Agricultural and Food
Chemistry 2013, 61 (7), 1525-1533.
95. Sainz, E.; Cavenagh, M. M.; Gutierrez, J.; Battey, J. F.; Northup, J. K.; Sullivan, S. L. Functional
characterization of human bitter taste receptors. Biochemical Journal 2007, 403 (3), 537-543.
96. Dotson, C. D.; Zhang, L.; Xu, H.; Shin, Y. K.; Vigues, S.; Ott, S. H.; Elson, A. E. T.; Choi, H. J.;
Shaw, H.; Egan, J. M.; Mitchell, B. D.; Li, X.; Steinle, N. I.; Munger, S. D. Bitter taste
receptors influence glucose homeostasis. PLoS ONE 2008, 3 (12), e3974.
97. Intelmann, D.; Batram, C.; Kuhn, C.; Haseleu, G.; Meyerhof, W.; Hofmann, T. Three TAS2R
bitter taste receptors mediate the psychophysical responses to bitter compounds of hops
(Humulus lupulus L.) and beer. Chemosensory Perception 2009, 2 (3), 118-132.
98. Thalmann, S.; Behrens, M.; Meyerhof, W. Major haplotypes of the human bitter taste receptor
TAS2R41 encode functional receptors for chloramphenicol. Biochemical and Biophysical
Research Communications 2013, 435 (2), 267-273.
99. Pronin, A. N.; Xu, H.; Tang, H.; Zhang, L.; Li, Q.; Li, X. Specific alleles of bitter receptor genes
influence human sensitivity to the bitterness of aloin and saccharin. Current Biology 2007, 17
(16), 1403-1408.
1
Chapter 1
32
100. Brockhoff, A.; Behrens, M.; Massarotti, A.; Appending, G.; Meyerhof, W. Broad tuning of the
human bitter taste receptor hTAS2R46 to various sesquiterpene lactones, clerodane and
labdane diterpenoids, strychnine, and denatonium. Journal of Agricultural and Food
Chemistry 2007, 55 (15), 6236-6243.
101. Behrens, M.; Brockhoff, A.; Batram, C.; Kuhn, C.; Appendino, G.; Meyerhof, W. The human
bitter taste receptor hTAS2R50 is activated by the two natural bitter terpenoids
andrographolide and amarogentin. Journal of Agricultural and Food Chemistry 2009, 57 (21),
9860-9866.
102. Maehashi, K.; Matano, M.; Wang, H.; Vo, L. A.; Yamamoto, Y.; Huang, L. Bitter peptides
activate hTAS2Rs, the human bitter receptors. Biochemical and Biophysical Research
Communications 2008, 365 (4), 851-855.
103. Brockhoff, A.; Behrens, M.; Roudnitzky, N.; Appendino, G.; Avonto, C.; Meyerhof, W.
Receptor agonism and antagonism of dietary bitter compounds. Journal of Neuroscience
2011, 31 (41), 14775-14872.
104. Roland, W. S. U.; Vincken, J. P.; Gouka, R. J.; van Buren, L.; Gruppen, H.; Smit, G. Soy
isoflavones and other isoflavonoids activate the human bitter taste receptors hTAS2R14 and
hTAS2R39. Journal of Agricultural and Food Chemistry 2011, 59 (21), 11764-11771.
105. Narukawa, M.; Noga, C.; Ueno, Y.; Sato, T.; Misaka, T.; Watanabe, T. Evaluation of the
bitterness of green tea catechins by a cell-based assay with the human bitter taste receptor
hTAS2R39. Biochemical and Biophysical Research Communications 2011, 405 (4), 620-625.
106. Ueno, Y.; Sakurai, T.; Okada, S.; Abe, K.; Misaka, T. Human bitter taste receptors hTAS2R8
and hTAS2R39 with differential functions to recognize bitter peptides. Bioscience,
Biotechnology and Biochemistry 2011, 75 (6), 1188-1190.
107. Soranzo, N.; Bufe, B.; Sabeti, P. C.; Wilson, J. F.; Weale, M. E.; Marguerie, R.; Meyerhof, W.;
Goldstein, D. B. Positive selection on a high-sensitivity allele of the human bitter-taste
receptor TAS2R16. Current Biology 2005, 15 (14), 1257-1265.
108. Greene, T. A.; Alarcon, S.; Thomas, A.; Berdougo, E.; Doranz, B. J.; Breslin, P. A. S.; Rucker, J.
B. Probenecid inhibits the human bitter taste receptor TAS2R16 and suppresses bitter
perception of salicin. PLoS ONE 2011, 6 (5), e20123.
109. Slack, J. P.; Brockhoff, A.; Batram, C.; Menzel, S.; Sonnabend, C.; Born, S.; Galindo, M. M.;
Kohl, S.; Thalmann, S.; Ostopovici-Halip, L.; Simons, C. T.; Ungureanu, I.; Duineveld, K.;
Bologa, C. G.; Behrens, M.; Furrer, S.; Oprea, T. I.; Meyerhof, W. Modulation of bitter taste
perception by a small molecule hTAS2R antagonist. Current Biology 2010, 20 (12), 1104-
1109.
110. Fletcher, J. N.; Kinghorn, A. D.; Slack, J. P.; McCluskey, T. S.; Odley, A.; Jia, Z. In vitro
evaluation of flavonoids from Eriodictyon californicum for antagonist activity against the
bitterness receptor hTAS2R31. Journal of Agricultural and Food Chemistry 2011, 59 (24),
13117-13121.
111. Mithen, R. F.; Lewis, B. G.; Heaney, R. K.; Fenwick, G. R. Glucosinolates of wild and
cultivated Brassica species. Phytochemistry 1987, 26 (7), 1969-1973.
112. Ricardo-da-Silva, J. M.; Cheynier, V.; Souquet, J. M.; Moutounet, M.; Cabanis, J. C.; Bourzeix,
M. Interaction of grape seed procyanidins with various proteins in relation to wine fining.
Journal of the Science of Food and Agriculture 1991, 57 (1), 111-125.
113. Puri, M.; Marwaha, S. S.; Kothari, R. M. Studies on the applicability of alginate-entrapped
naringinase for the debittering of kinnow juice. Enzyme and Microbial Technology 1996, 18
(4), 281-285.
114. Keast, R. S. J.; Breslin, P. A. S. Modifying the bitterness of selected oral pharmaceuticals with
cation and anion series of salts. Pharmaceutical Research 2002, 19 (7), 1019-1026.
115. Robert, P.; Gorena, T.; Romero, N.; Sepulveda, E.; Chavez, J.; Saenz, C. Encapsulation of
polyphenols and anthocyanins from pomegranate (Punica granatum) by spray drying.
International Journal of Food Science and Technology 2010, 45 (7), 1386-1394.
General introduction
33
116. Sun-Waterhouse, D.; Wadhwa, S. S. Industry-relevant approaches for minimising the bitterness
of bioactive compounds in functional foods: A review. Food and Bioprocess Technology
2013, 6 (3), 607-627.
117. Szejtli, J.; Szente, L. Elimination of bitter, disgusting tastes of drugs and foods by cyclodextrins.
European Journal of Pharmaceutics and Biopharmaceutics 2005, 61 (3), 115-125.
118. McNaught, A. D.; Wilkinson, A. IUPAC. Compendium of Chemical Terminology. The "Gold
Book".; 2 ed.; Blackwell Scientific Publications: Oxford, UK, 1997.
119. Munin, A.; Edwards-Lévy, F. Encapsulation of natural polyphenolic compounds: A review.
Pharmaceutics 2011, 3 (4), 793-829.
120. De Freitas, V.; Mateus, N. Protein/Polyphenol interactions: Past and present contributions.
Mechanisms of astringency perception. Current Organic Chemistry 2012, 16 (6), 724-746.
121. Bohin, M. C. Food proteins as potential carriers for phenolics. Ph.D. thesis. Wageningen
University, Wageningen, The Netherlands, 2013.
122. Sakurai, T.; Misaka, T.; Nagai, T.; Ishimaru, Y.; Matsuo, S.; Asakura, T.; Abe, K. pH-dependent
inhibition of the human bitter taste receptor hTAS2R16 by a variety of substances. Journal of
Agricultural and Food Chemistry 2009, 57 (6), 2508-2514.
123. Kenakin, T. A Pharmacology Primer. Theory, Applications and Methods.; 2 ed.; Academic
Press: New York, NY, USA 2006.
124. Vauquelin, G.; Szczuka, A. Kinetic versus allosteric mechanisms to explain insurmountable
antagonism and delayed ligand dissociation. Neurochemistry International 2007, 51 (5), 254-
260.
125. Kenakin, T.; Jenkinson, S.; Watson, C. Determining the potency and molecular mechanism of
action of insurmountable antagonists. Journal of Pharmacology and Experimental
Therapeutics 2006, 319 (2), 710-723.
126. Swinney, D. C. Biochemical mechanisms of drug action: What does it take for success? Nature
Reviews Drug Discovery 2004, 3 (9), 801-808.
1

Chapter 1
34
Chapter 2
Soy isoflavones and other isoflavonoids
activate the human bitter taste receptors
hTAS2R14 and hTAS2R39
Based on: Wibke S.U. Roland, Jean-Paul Vincken, Robin J. Gouka, Leo van Buren, Harry
Gruppen, Gerrit Smit. Soy isoflavones and other isoflavonoids activate the human bitter
taste receptors hTAS2R14 and hTAS2R39. Journal of Agricultural and Food Chemistry
2011 59 (21), 11764-11771.
2
Chapter 2
36
ABSTRACT
The aim of this study was to identify the bitter receptor(s) that recognize the bitter taste of
the soy isoflavone genistein. Screening of all 25 human bitter receptors revealed genistein
as agonist of hTAS2R14 and hTAS2R39. Genistein displayed threshold values of 4 and 8
µM on hTAS2R14 and hTAS2R39, and EC50 values of 29 and 49 µM, respectively. In
addition, the behavior of structurally similar isoflavonoids was investigated. Although the
two receptors are not closely related, the results for hTAS2R14 and hTAS2R39 were
similar towards most isoflavonoid aglycones. By trend, threshold values were slightly lower
on hTAS2R14. Glucosylation of isoflavones seemed to inhibit activation of hTAS2R14,
whereas four of five glucosylated isoflavones were agonists of hTAS2R39, namely glycitin,
genistin, acetyl genistin, and malonyl genistin. A total of three hydroxyl substitutions of the
A- and B-rings of the isoflavonoids seemed to be more favorable for receptor activation
than fewer hydroxyl groups. The concentration of the trihydroxylated genistein in several
soy foods exceeds the determined bitter receptor threshold values, whereas those of other
soy isoflavones are around or below their respective threshold value. Despite its low
concentration, genistein might be one of the main contributors to the bitterness of soy
products. Furthermore, the bioactive isoflavonoids equol and coumestrol activated both
receptors, indicating that their sensory impact should be considered when used as food
ingredients.
Soy isoflavones activate hTAS2R14 and -39
37
INTRODUCTION
Soybeans (Glycine max L. Merrill) are consumed by Asian populations on a regular basis.
Growing evidence of positive health effects of soy compounds (1) and the need for
alternatives to dairy products, due to food-related allergies and intolerances, increase the
interest for soybean products in North-America and Europe. An important group of health-
beneficial compounds from soybean are isoflavones, of which genistein is the predominant
representative (2). Soybeans contain mainly 12 isoflavones, the aglycones genistein,
daidzein, and glycitein, and their respective malonyl glucosides, acetyl glucosides, and
unsubstituted glucosides (3). The quantities of isoflavones in soybeans depend on cultivar
and year of cultivation (4). Commonly, the malonyl glucosides and unsubstituted
glucosides dominate in soybeans, whereas acetyl glucosides and aglycones are present in
very small amounts (3). Processing can lead to the conversion of malonyl glucosides into
acetyl glucosides (decarboxylation due to dry heating) and unsubstituted glucosides (mainly
due to moist heating) (5, 6). Fermentation strongly increases the amount of aglycones due
to action of β-glucosidases (5). In the whole bean, genistein forms are most abundant,
followed by daidzein and glycitein forms (6). Unfortunately, soybean isoflavones have
undesirable sensory properties, e.g. bitterness and astringency. Interestingly, the outcomes
of sensory studies are not consistent and the undesirable sensory properties are not ascribed
to the same isoflavones (7-11). The aglycone genistein is frequently reported as being bitter
(8-11).
Bitter taste is perceived by bitter taste receptors, referred to as T2Rs or TAS2Rs, which
belong to the family of G-protein coupled receptors (12). For almost all 25 human bitter
receptors (hTAS2Rs) agonists have been identified (13). The remaining orphan receptors
are hTAS2R411, -42, -45, -482, and -60. Despite of the occurrence of many bitter
compounds in food, research has mainly been focused on toxic compounds, and only a few
studies have been carried out on dietary compounds (13-19). Bitter taste receptor activation
by isoflavonoids has not been studied yet. The umbrella term “isoflavonoids” incorporates,
amongst others, isoflavones, isoflavans, and coumestans.
The objective of the present study was to identify the bitter receptors activated by the
soy isoflavone genistein. Our second objective was to map the structural requirements for
receptor activation, using a variety of structurally similar isoflavonoids.
1 hTAS2R41 has been deorphanized in 2013, see Chapter 1 2 The name of hTAS2R48 has been changed into hTAS2R19, see Chapter 1
2
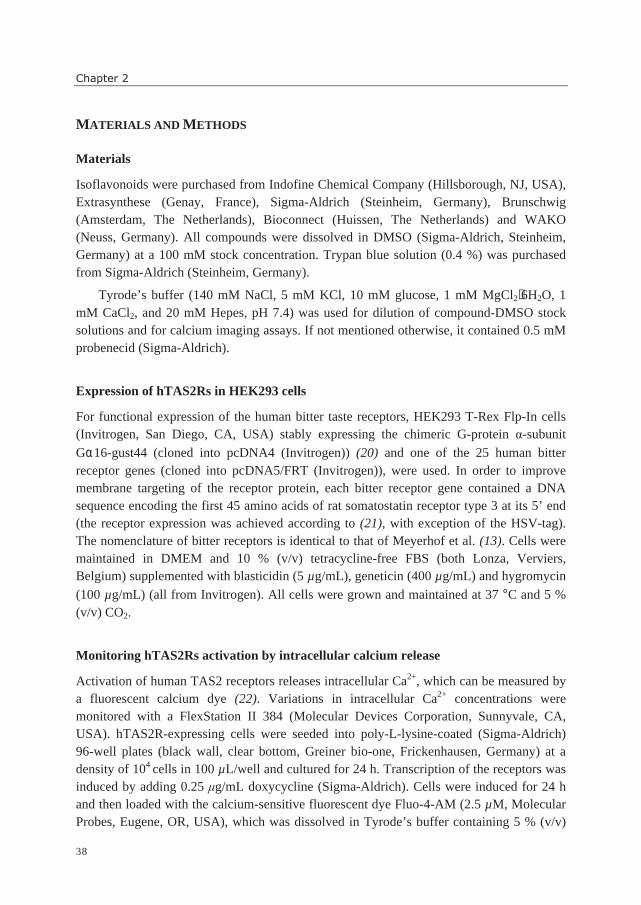
Chapter 2
38
MATERIALS AND METHODS
Materials
Isoflavonoids were purchased from Indofine Chemical Company (Hillsborough, NJ, USA),
Extrasynthese (Genay, France), Sigma-Aldrich (Steinheim, Germany), Brunschwig
(Amsterdam, The Netherlands), Bioconnect (Huissen, The Netherlands) and WAKO
(Neuss, Germany). All compounds were dissolved in DMSO (Sigma-Aldrich, Steinheim,
Germany) at a 100 mM stock concentration. Trypan blue solution (0.4 %) was purchased
from Sigma-Aldrich (Steinheim, Germany).
Tyrode’s buffer (140 mM NaCl, 5 mM KCl, 10 mM glucose, 1 mM MgCl2⋅6H2O, 1
mM CaCl2, and 20 mM Hepes, pH 7.4) was used for dilution of compound-DMSO stock
solutions and for calcium imaging assays. If not mentioned otherwise, it contained 0.5 mM
probenecid (Sigma-Aldrich).
Expression of hTAS2Rs in HEK293 cells
For functional expression of the human bitter taste receptors, HEK293 T-Rex Flp-In cells
(Invitrogen, San Diego, CA, USA) stably expressing the chimeric G-protein α-subunit
Gα16-gust44 (cloned into pcDNA4 (Invitrogen)) (20) and one of the 25 human bitter
receptor genes (cloned into pcDNA5/FRT (Invitrogen)), were used. In order to improve
membrane targeting of the receptor protein, each bitter receptor gene contained a DNA
sequence encoding the first 45 amino acids of rat somatostatin receptor type 3 at its 5’ end
(the receptor expression was achieved according to (21), with exception of the HSV-tag).
The nomenclature of bitter receptors is identical to that of Meyerhof et al. (13). Cells were
maintained in DMEM and 10 % (v/v) tetracycline-free FBS (both Lonza, Verviers,
Belgium) supplemented with blasticidin (5 µg/mL), geneticin (400 µg/mL) and hygromycin
(100 µg/mL) (all from Invitrogen). All cells were grown and maintained at 37 °C and 5 %
(v/v) CO2.
Monitoring hTAS2Rs activation by intracellular calcium release
Activation of human TAS2 receptors releases intracellular Ca2+, which can be measured by
a fluorescent calcium dye (22). Variations in intracellular Ca2+ concentrations were
monitored with a FlexStation II 384 (Molecular Devices Corporation, Sunnyvale, CA,
USA). hTAS2R-expressing cells were seeded into poly-L-lysine-coated (Sigma-Aldrich)
96-well plates (black wall, clear bottom, Greiner bio-one, Frickenhausen, Germany) at a
density of 104 cells in 100 µL/well and cultured for 24 h. Transcription of the receptors was
induced by adding 0.25 µg/mL doxycycline (Sigma-Aldrich). Cells were induced for 24 h
and then loaded with the calcium-sensitive fluorescent dye Fluo-4-AM (2.5 µM, Molecular
Probes, Eugene, OR, USA), which was dissolved in Tyrode’s buffer containing 5 % (v/v)
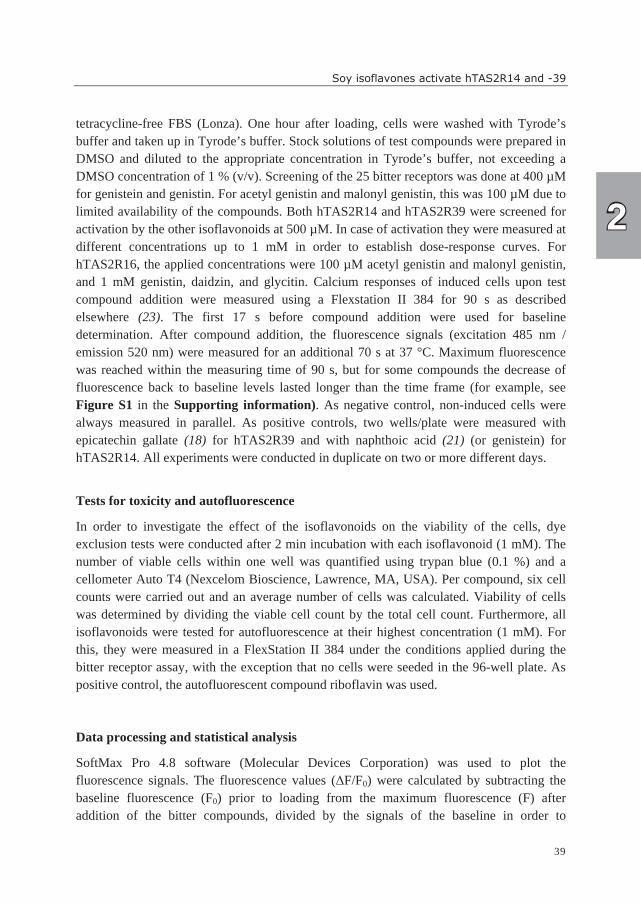
Soy isoflavones activate hTAS2R14 and -39
39
tetracycline-free FBS (Lonza). One hour after loading, cells were washed with Tyrode’s
buffer and taken up in Tyrode’s buffer. Stock solutions of test compounds were prepared in
DMSO and diluted to the appropriate concentration in Tyrode’s buffer, not exceeding a
DMSO concentration of 1 % (v/v). Screening of the 25 bitter receptors was done at 400 µM
for genistein and genistin. For acetyl genistin and malonyl genistin, this was 100 µM due to
limited availability of the compounds. Both hTAS2R14 and hTAS2R39 were screened for
activation by the other isoflavonoids at 500 µM. In case of activation they were measured at
different concentrations up to 1 mM in order to establish dose-response curves. For
hTAS2R16, the applied concentrations were 100 µM acetyl genistin and malonyl genistin,
and 1 mM genistin, daidzin, and glycitin. Calcium responses of induced cells upon test
compound addition were measured using a Flexstation II 384 for 90 s as described
elsewhere (23). The first 17 s before compound addition were used for baseline
determination. After compound addition, the fluorescence signals (excitation 485 nm /
emission 520 nm) were measured for an additional 70 s at 37 °C. Maximum fluorescence
was reached within the measuring time of 90 s, but for some compounds the decrease of
fluorescence back to baseline levels lasted longer than the time frame (for example, see
Figure S1 in the Supporting information). As negative control, non-induced cells were
always measured in parallel. As positive controls, two wells/plate were measured with
epicatechin gallate (18) for hTAS2R39 and with naphthoic acid (21) (or genistein) for
hTAS2R14. All experiments were conducted in duplicate on two or more different days.
Tests for toxicity and autofluorescence
In order to investigate the effect of the isoflavonoids on the viability of the cells, dye
exclusion tests were conducted after 2 min incubation with each isoflavonoid (1 mM). The
number of viable cells within one well was quantified using trypan blue (0.1 %) and a
cellometer Auto T4 (Nexcelom Bioscience, Lawrence, MA, USA). Per compound, six cell
counts were carried out and an average number of cells was calculated. Viability of cells
was determined by dividing the viable cell count by the total cell count. Furthermore, all
isoflavonoids were tested for autofluorescence at their highest concentration (1 mM). For
this, they were measured in a FlexStation II 384 under the conditions applied during the
bitter receptor assay, with the exception that no cells were seeded in the 96-well plate. As
positive control, the autofluorescent compound riboflavin was used.
Data processing and statistical analysis
SoftMax Pro 4.8 software (Molecular Devices Corporation) was used to plot the
fluorescence signals. The fluorescence values (∆F/F0) were calculated by subtracting the
baseline fluorescence (F0) prior to loading from the maximum fluorescence (F) after
addition of the bitter compounds, divided by the signals of the baseline in order to
2
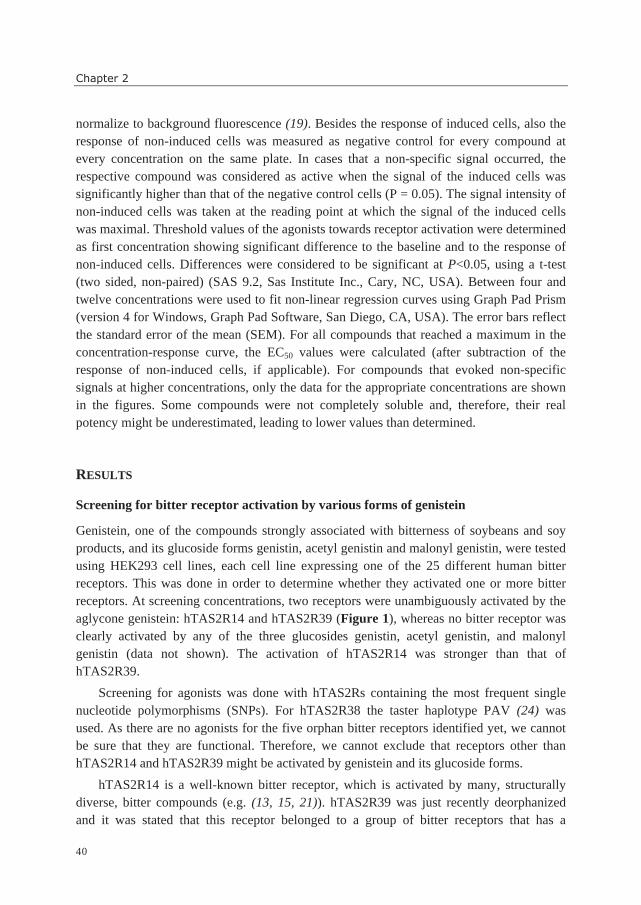
Chapter 2
40
normalize to background fluorescence (19). Besides the response of induced cells, also the
response of non-induced cells was measured as negative control for every compound at
every concentration on the same plate. In cases that a non-specific signal occurred, the
respective compound was considered as active when the signal of the induced cells was
significantly higher than that of the negative control cells (P = 0.05). The signal intensity of
non-induced cells was taken at the reading point at which the signal of the induced cells
was maximal. Threshold values of the agonists towards receptor activation were determined
as first concentration showing significant difference to the baseline and to the response of
non-induced cells. Differences were considered to be significant at P<0.05, using a t-test
(two sided, non-paired) (SAS 9.2, Sas Institute Inc., Cary, NC, USA). Between four and
twelve concentrations were used to fit non-linear regression curves using Graph Pad Prism
(version 4 for Windows, Graph Pad Software, San Diego, CA, USA). The error bars reflect
the standard error of the mean (SEM). For all compounds that reached a maximum in the
concentration-response curve, the EC50 values were calculated (after subtraction of the
response of non-induced cells, if applicable). For compounds that evoked non-specific
signals at higher concentrations, only the data for the appropriate concentrations are shown
in the figures. Some compounds were not completely soluble and, therefore, their real
potency might be underestimated, leading to lower values than determined.
RESULTS
Screening for bitter receptor activation by various forms of genistein
Genistein, one of the compounds strongly associated with bitterness of soybeans and soy
products, and its glucoside forms genistin, acetyl genistin and malonyl genistin, were tested
using HEK293 cell lines, each cell line expressing one of the 25 different human bitter
receptors. This was done in order to determine whether they activated one or more bitter
receptors. At screening concentrations, two receptors were unambiguously activated by the
aglycone genistein: hTAS2R14 and hTAS2R39 (Figure 1), whereas no bitter receptor was
clearly activated by any of the three glucosides genistin, acetyl genistin, and malonyl
genistin (data not shown). The activation of hTAS2R14 was stronger than that of
hTAS2R39.
Screening for agonists was done with hTAS2Rs containing the most frequent single
nucleotide polymorphisms (SNPs). For hTAS2R38 the taster haplotype PAV (24) was
used. As there are no agonists for the five orphan bitter receptors identified yet, we cannot
be sure that they are functional. Therefore, we cannot exclude that receptors other than
hTAS2R14 and hTAS2R39 might be activated by genistein and its glucoside forms.
hTAS2R14 is a well-known bitter receptor, which is activated by many, structurally
diverse, bitter compounds (e.g. (13, 15, 21)). hTAS2R39 was just recently deorphanized
and it was stated that this receptor belonged to a group of bitter receptors that has a
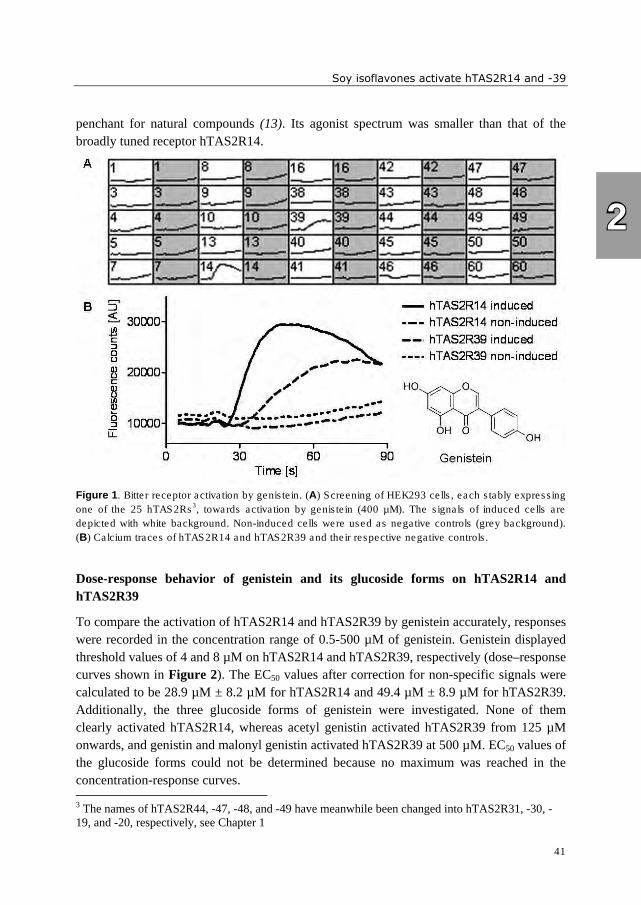
Soy isoflavones activate hTAS2R14 and -39
41
penchant for natural compounds (13). Its agonist spectrum was smaller than that of the
broadly tuned receptor hTAS2R14.
Figure 1. Bitter receptor activation by genistein. (A) Screening of HEK293 cells, each stably expressing
one of the 25 hTAS2Rs3, towards activation by genistein (400 µM). The signals of induced cells are
depicted with white background. Non-induced cells were used as negative controls (grey background).
(B) Calcium traces of hTAS2R14 and hTAS2R39 and their respective negative controls.
Dose-response behavior of genistein and its glucoside forms on hTAS2R14 and
hTAS2R39
To compare the activation of hTAS2R14 and hTAS2R39 by genistein accurately, responses
were recorded in the concentration range of 0.5-500 µM of genistein. Genistein displayed
threshold values of 4 and 8 µM on hTAS2R14 and hTAS2R39, respectively (dose–response
curves shown in Figure 2). The EC50 values after correction for non-specific signals were
calculated to be 28.9 µM ± 8.2 µM for hTAS2R14 and 49.4 µM ± 8.9 µM for hTAS2R39.
Additionally, the three glucoside forms of genistein were investigated. None of them
clearly activated hTAS2R14, whereas acetyl genistin activated hTAS2R39 from 125 µM
onwards, and genistin and malonyl genistin activated hTAS2R39 at 500 µM. EC50 values of
the glucoside forms could not be determined because no maximum was reached in the
concentration-response curves. 3 The names of hTAS2R44, -47, -48, and -49 have meanwhile been changed into hTAS2R31, -30, -
19, and -20, respectively, see Chapter 1
2
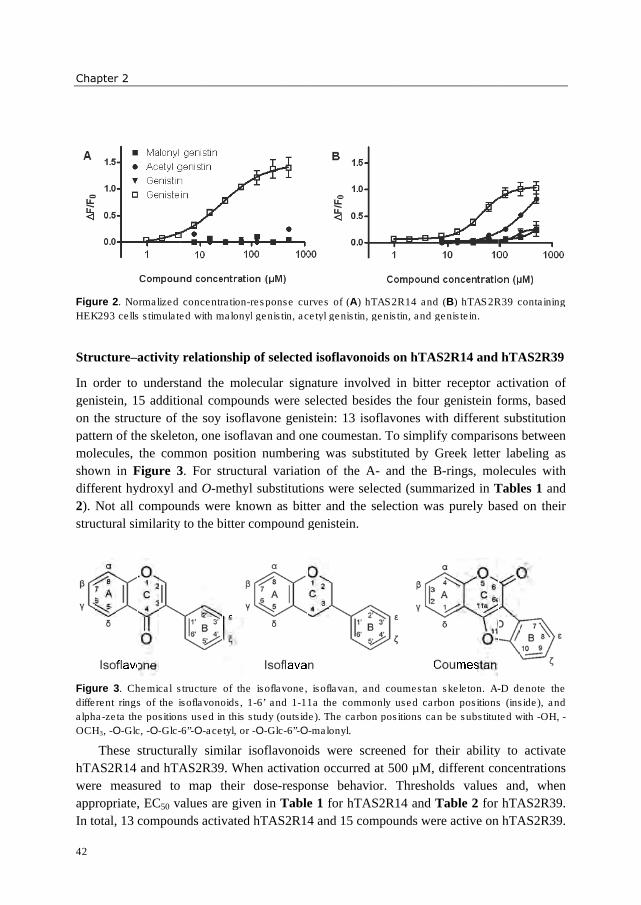
Chapter 2
42
Figure 2
HEK
Structure
In order
genistein, 15 additional compounds were selected besides the four genistein forms, based
on the structure of the soy isoflavone genistein: 13 isoflavones with different substi
pattern of the skeleton, one isoflavan and one coumestan. To simplify comparisons between
molecules, the common position numbering was substituted by Greek letter labeling as
shown in
different hydroxyl and
2). Not all compounds were known as bitter and the selection was purely based on their
structural similarity to the bitter compound genistein.
Figure 3
different rings of the isoflavonoids, 1
alpha
OCH
hTAS2R14 and hTAS2R39. When activation occurred at 500 µM, different concentrations
were measured to map their dose
appropriate, EC
In total, 13 compounds activated hTAS2R14 and 15 compounds were active on hTAS2R39.
Chapter 2
Figure 2
HEK293 cells stimulated with malonyl
Structure
In order
genistein, 15 additional compounds were selected besides the four genistein forms, based
on the structure of the soy isoflavone genistein: 13 isoflavones with different substi
pattern of the skeleton, one isoflavan and one coumestan. To simplify comparisons between
molecules, the common position numbering was substituted by Greek letter labeling as
shown in
different hydroxyl and
). Not all compounds were known as bitter and the selection was purely based on their
structural similarity to the bitter compound genistein.
Figure 3
different rings of the isoflavonoids, 1
alpha-zeta the positions used in this study (outside). The carbon
OCH3, -O
These structurally similar isoflavonoids
hTAS2R14 and hTAS2R39. When activation occurred at 500 µM, different concentrations
were measured to map their dose
appropriate, EC
In total, 13 compounds activated hTAS2R14 and 15 compounds were active on hTAS2R39.
Chapter 2
Figure 2. Normalized
293 cells stimulated with malonyl
Structure–activity relationship of selected isoflavonoids on hTAS2R14 and hTAS2R39
In order to understand the molecular signature involved in bitter receptor activation of
genistein, 15 additional compounds were selected besides the four genistein forms, based
on the structure of the soy isoflavone genistein: 13 isoflavones with different substi
pattern of the skeleton, one isoflavan and one coumestan. To simplify comparisons between
molecules, the common position numbering was substituted by Greek letter labeling as
shown in Figure 3
different hydroxyl and
). Not all compounds were known as bitter and the selection was purely based on their
structural similarity to the bitter compound genistein.
Figure 3. Chemical structure of the isoflavone, isoflavan, and coumestan skeleton. A
different rings of the isoflavonoids, 1
zeta the positions used in this study (outside). The carbon
O-Glc,
These structurally similar isoflavonoids
hTAS2R14 and hTAS2R39. When activation occurred at 500 µM, different concentrations
were measured to map their dose
appropriate, EC
In total, 13 compounds activated hTAS2R14 and 15 compounds were active on hTAS2R39.
Normalized
293 cells stimulated with malonyl
activity relationship of selected isoflavonoids on hTAS2R14 and hTAS2R39
to understand the molecular signature involved in bitter receptor activation of
genistein, 15 additional compounds were selected besides the four genistein forms, based
on the structure of the soy isoflavone genistein: 13 isoflavones with different substi
pattern of the skeleton, one isoflavan and one coumestan. To simplify comparisons between
molecules, the common position numbering was substituted by Greek letter labeling as
Figure 3
different hydroxyl and
). Not all compounds were known as bitter and the selection was purely based on their
structural similarity to the bitter compound genistein.
Chemical structure of the isoflavone, isoflavan, and coumestan skeleton. A
different rings of the isoflavonoids, 1
zeta the positions used in this study (outside). The carbon
Glc, -O-
These structurally similar isoflavonoids
hTAS2R14 and hTAS2R39. When activation occurred at 500 µM, different concentrations
were measured to map their dose
appropriate, EC
In total, 13 compounds activated hTAS2R14 and 15 compounds were active on hTAS2R39.
Normalized
293 cells stimulated with malonyl
activity relationship of selected isoflavonoids on hTAS2R14 and hTAS2R39
to understand the molecular signature involved in bitter receptor activation of
genistein, 15 additional compounds were selected besides the four genistein forms, based
on the structure of the soy isoflavone genistein: 13 isoflavones with different substi
pattern of the skeleton, one isoflavan and one coumestan. To simplify comparisons between
molecules, the common position numbering was substituted by Greek letter labeling as
Figure 3
different hydroxyl and
). Not all compounds were known as bitter and the selection was purely based on their
structural similarity to the bitter compound genistein.
Chemical structure of the isoflavone, isoflavan, and coumestan skeleton. A
different rings of the isoflavonoids, 1
zeta the positions used in this study (outside). The carbon
-Glc-
These structurally similar isoflavonoids
hTAS2R14 and hTAS2R39. When activation occurred at 500 µM, different concentrations
were measured to map their dose
appropriate, EC50 values are given in
In total, 13 compounds activated hTAS2R14 and 15 compounds were active on hTAS2R39.
concentration
293 cells stimulated with malonyl
activity relationship of selected isoflavonoids on hTAS2R14 and hTAS2R39
to understand the molecular signature involved in bitter receptor activation of
genistein, 15 additional compounds were selected besides the four genistein forms, based
on the structure of the soy isoflavone genistein: 13 isoflavones with different substi
pattern of the skeleton, one isoflavan and one coumestan. To simplify comparisons between
molecules, the common position numbering was substituted by Greek letter labeling as
Figure 3. For structural variation of the A
different hydroxyl and
). Not all compounds were known as bitter and the selection was purely based on their
structural similarity to the bitter compound genistein.
Chemical structure of the isoflavone, isoflavan, and coumestan skeleton. A
different rings of the isoflavonoids, 1
zeta the positions used in this study (outside). The carbon
-6”-O
These structurally similar isoflavonoids
hTAS2R14 and hTAS2R39. When activation occurred at 500 µM, different concentrations
were measured to map their dose
values are given in
In total, 13 compounds activated hTAS2R14 and 15 compounds were active on hTAS2R39.
concentration
293 cells stimulated with malonyl
activity relationship of selected isoflavonoids on hTAS2R14 and hTAS2R39
to understand the molecular signature involved in bitter receptor activation of
genistein, 15 additional compounds were selected besides the four genistein forms, based
on the structure of the soy isoflavone genistein: 13 isoflavones with different substi
pattern of the skeleton, one isoflavan and one coumestan. To simplify comparisons between
molecules, the common position numbering was substituted by Greek letter labeling as
. For structural variation of the A
different hydroxyl and O-methyl substitutions were selected (summarized in
). Not all compounds were known as bitter and the selection was purely based on their
structural similarity to the bitter compound genistein.
Chemical structure of the isoflavone, isoflavan, and coumestan skeleton. A
different rings of the isoflavonoids, 1
zeta the positions used in this study (outside). The carbon
O-acetyl, or
These structurally similar isoflavonoids
hTAS2R14 and hTAS2R39. When activation occurred at 500 µM, different concentrations
were measured to map their dose
values are given in
In total, 13 compounds activated hTAS2R14 and 15 compounds were active on hTAS2R39.
concentration
293 cells stimulated with malonyl
activity relationship of selected isoflavonoids on hTAS2R14 and hTAS2R39
to understand the molecular signature involved in bitter receptor activation of
genistein, 15 additional compounds were selected besides the four genistein forms, based
on the structure of the soy isoflavone genistein: 13 isoflavones with different substi
pattern of the skeleton, one isoflavan and one coumestan. To simplify comparisons between
molecules, the common position numbering was substituted by Greek letter labeling as
. For structural variation of the A
methyl substitutions were selected (summarized in
). Not all compounds were known as bitter and the selection was purely based on their
structural similarity to the bitter compound genistein.
Chemical structure of the isoflavone, isoflavan, and coumestan skeleton. A
different rings of the isoflavonoids, 1
zeta the positions used in this study (outside). The carbon
acetyl, or
These structurally similar isoflavonoids
hTAS2R14 and hTAS2R39. When activation occurred at 500 µM, different concentrations
were measured to map their dose
values are given in
In total, 13 compounds activated hTAS2R14 and 15 compounds were active on hTAS2R39.
concentration-response curves of (
293 cells stimulated with malonyl genistin, acetyl
activity relationship of selected isoflavonoids on hTAS2R14 and hTAS2R39
to understand the molecular signature involved in bitter receptor activation of
genistein, 15 additional compounds were selected besides the four genistein forms, based
on the structure of the soy isoflavone genistein: 13 isoflavones with different substi
pattern of the skeleton, one isoflavan and one coumestan. To simplify comparisons between
molecules, the common position numbering was substituted by Greek letter labeling as
. For structural variation of the A
methyl substitutions were selected (summarized in
). Not all compounds were known as bitter and the selection was purely based on their
structural similarity to the bitter compound genistein.
Chemical structure of the isoflavone, isoflavan, and coumestan skeleton. A
different rings of the isoflavonoids, 1-6’ and 1
zeta the positions used in this study (outside). The carbon
acetyl, or -O-
These structurally similar isoflavonoids
hTAS2R14 and hTAS2R39. When activation occurred at 500 µM, different concentrations
were measured to map their dose
values are given in
In total, 13 compounds activated hTAS2R14 and 15 compounds were active on hTAS2R39.
response curves of (
genistin, acetyl
activity relationship of selected isoflavonoids on hTAS2R14 and hTAS2R39
to understand the molecular signature involved in bitter receptor activation of
genistein, 15 additional compounds were selected besides the four genistein forms, based
on the structure of the soy isoflavone genistein: 13 isoflavones with different substi
pattern of the skeleton, one isoflavan and one coumestan. To simplify comparisons between
molecules, the common position numbering was substituted by Greek letter labeling as
. For structural variation of the A
methyl substitutions were selected (summarized in
). Not all compounds were known as bitter and the selection was purely based on their
structural similarity to the bitter compound genistein.
Chemical structure of the isoflavone, isoflavan, and coumestan skeleton. A
6’ and 1
zeta the positions used in this study (outside). The carbon
-Glc-
These structurally similar isoflavonoids
hTAS2R14 and hTAS2R39. When activation occurred at 500 µM, different concentrations
were measured to map their dose-response behavior. Thresholds values and, when
values are given in Table 1
In total, 13 compounds activated hTAS2R14 and 15 compounds were active on hTAS2R39.
response curves of (
genistin, acetyl
activity relationship of selected isoflavonoids on hTAS2R14 and hTAS2R39
to understand the molecular signature involved in bitter receptor activation of
genistein, 15 additional compounds were selected besides the four genistein forms, based
on the structure of the soy isoflavone genistein: 13 isoflavones with different substi
pattern of the skeleton, one isoflavan and one coumestan. To simplify comparisons between
molecules, the common position numbering was substituted by Greek letter labeling as
. For structural variation of the A
methyl substitutions were selected (summarized in
). Not all compounds were known as bitter and the selection was purely based on their
structural similarity to the bitter compound genistein.
Chemical structure of the isoflavone, isoflavan, and coumestan skeleton. A
6’ and 1-11a the commonly used carbon positions (inside), and
zeta the positions used in this study (outside). The carbon
-6”-O
These structurally similar isoflavonoids
hTAS2R14 and hTAS2R39. When activation occurred at 500 µM, different concentrations
response behavior. Thresholds values and, when
Table 1
In total, 13 compounds activated hTAS2R14 and 15 compounds were active on hTAS2R39.
response curves of (
genistin, acetyl
activity relationship of selected isoflavonoids on hTAS2R14 and hTAS2R39
to understand the molecular signature involved in bitter receptor activation of
genistein, 15 additional compounds were selected besides the four genistein forms, based
on the structure of the soy isoflavone genistein: 13 isoflavones with different substi
pattern of the skeleton, one isoflavan and one coumestan. To simplify comparisons between
molecules, the common position numbering was substituted by Greek letter labeling as
. For structural variation of the A
methyl substitutions were selected (summarized in
). Not all compounds were known as bitter and the selection was purely based on their
structural similarity to the bitter compound genistein.
Chemical structure of the isoflavone, isoflavan, and coumestan skeleton. A
11a the commonly used carbon positions (inside), and
zeta the positions used in this study (outside). The carbon
O-malonyl.
These structurally similar isoflavonoids were screened for their ability to activate
hTAS2R14 and hTAS2R39. When activation occurred at 500 µM, different concentrations
response behavior. Thresholds values and, when
Table 1 fo
In total, 13 compounds activated hTAS2R14 and 15 compounds were active on hTAS2R39.
response curves of (A
genistin, genistin, and genistein.
activity relationship of selected isoflavonoids on hTAS2R14 and hTAS2R39
to understand the molecular signature involved in bitter receptor activation of
genistein, 15 additional compounds were selected besides the four genistein forms, based
on the structure of the soy isoflavone genistein: 13 isoflavones with different substi
pattern of the skeleton, one isoflavan and one coumestan. To simplify comparisons between
molecules, the common position numbering was substituted by Greek letter labeling as
. For structural variation of the A
methyl substitutions were selected (summarized in
). Not all compounds were known as bitter and the selection was purely based on their
structural similarity to the bitter compound genistein.
Chemical structure of the isoflavone, isoflavan, and coumestan skeleton. A
11a the commonly used carbon positions (inside), and
zeta the positions used in this study (outside). The carbon
malonyl.
were screened for their ability to activate
hTAS2R14 and hTAS2R39. When activation occurred at 500 µM, different concentrations
response behavior. Thresholds values and, when
for hTAS2R14 and
In total, 13 compounds activated hTAS2R14 and 15 compounds were active on hTAS2R39.
A) hTAS2R14 and (
genistin, genistin, and genistein.
activity relationship of selected isoflavonoids on hTAS2R14 and hTAS2R39
to understand the molecular signature involved in bitter receptor activation of
genistein, 15 additional compounds were selected besides the four genistein forms, based
on the structure of the soy isoflavone genistein: 13 isoflavones with different substi
pattern of the skeleton, one isoflavan and one coumestan. To simplify comparisons between
molecules, the common position numbering was substituted by Greek letter labeling as
. For structural variation of the A
methyl substitutions were selected (summarized in
). Not all compounds were known as bitter and the selection was purely based on their
structural similarity to the bitter compound genistein.
Chemical structure of the isoflavone, isoflavan, and coumestan skeleton. A
11a the commonly used carbon positions (inside), and
zeta the positions used in this study (outside). The carbon
malonyl.
were screened for their ability to activate
hTAS2R14 and hTAS2R39. When activation occurred at 500 µM, different concentrations
response behavior. Thresholds values and, when
r hTAS2R14 and
In total, 13 compounds activated hTAS2R14 and 15 compounds were active on hTAS2R39.
) hTAS2R14 and (
genistin, genistin, and genistein.
activity relationship of selected isoflavonoids on hTAS2R14 and hTAS2R39
to understand the molecular signature involved in bitter receptor activation of
genistein, 15 additional compounds were selected besides the four genistein forms, based
on the structure of the soy isoflavone genistein: 13 isoflavones with different substi
pattern of the skeleton, one isoflavan and one coumestan. To simplify comparisons between
molecules, the common position numbering was substituted by Greek letter labeling as
. For structural variation of the A- and the B
methyl substitutions were selected (summarized in
). Not all compounds were known as bitter and the selection was purely based on their
Chemical structure of the isoflavone, isoflavan, and coumestan skeleton. A
11a the commonly used carbon positions (inside), and
zeta the positions used in this study (outside). The carbon positions can be substituted with
were screened for their ability to activate
hTAS2R14 and hTAS2R39. When activation occurred at 500 µM, different concentrations
response behavior. Thresholds values and, when
r hTAS2R14 and
In total, 13 compounds activated hTAS2R14 and 15 compounds were active on hTAS2R39.
) hTAS2R14 and (
genistin, genistin, and genistein.
activity relationship of selected isoflavonoids on hTAS2R14 and hTAS2R39
to understand the molecular signature involved in bitter receptor activation of
genistein, 15 additional compounds were selected besides the four genistein forms, based
on the structure of the soy isoflavone genistein: 13 isoflavones with different substi
pattern of the skeleton, one isoflavan and one coumestan. To simplify comparisons between
molecules, the common position numbering was substituted by Greek letter labeling as
and the B
methyl substitutions were selected (summarized in
). Not all compounds were known as bitter and the selection was purely based on their
Chemical structure of the isoflavone, isoflavan, and coumestan skeleton. A
11a the commonly used carbon positions (inside), and
positions can be substituted with
were screened for their ability to activate
hTAS2R14 and hTAS2R39. When activation occurred at 500 µM, different concentrations
response behavior. Thresholds values and, when
r hTAS2R14 and
In total, 13 compounds activated hTAS2R14 and 15 compounds were active on hTAS2R39.
) hTAS2R14 and (B) hTAS2R39 containing
genistin, genistin, and genistein.
activity relationship of selected isoflavonoids on hTAS2R14 and hTAS2R39
to understand the molecular signature involved in bitter receptor activation of
genistein, 15 additional compounds were selected besides the four genistein forms, based
on the structure of the soy isoflavone genistein: 13 isoflavones with different substi
pattern of the skeleton, one isoflavan and one coumestan. To simplify comparisons between
molecules, the common position numbering was substituted by Greek letter labeling as
and the B-rings, mol
methyl substitutions were selected (summarized in
). Not all compounds were known as bitter and the selection was purely based on their
Chemical structure of the isoflavone, isoflavan, and coumestan skeleton. A
11a the commonly used carbon positions (inside), and
positions can be substituted with
were screened for their ability to activate
hTAS2R14 and hTAS2R39. When activation occurred at 500 µM, different concentrations
response behavior. Thresholds values and, when
Table 2
In total, 13 compounds activated hTAS2R14 and 15 compounds were active on hTAS2R39.
) hTAS2R39 containing
genistin, genistin, and genistein.
activity relationship of selected isoflavonoids on hTAS2R14 and hTAS2R39
to understand the molecular signature involved in bitter receptor activation of
genistein, 15 additional compounds were selected besides the four genistein forms, based
on the structure of the soy isoflavone genistein: 13 isoflavones with different substi
pattern of the skeleton, one isoflavan and one coumestan. To simplify comparisons between
molecules, the common position numbering was substituted by Greek letter labeling as
rings, mol
methyl substitutions were selected (summarized in Tables 1
). Not all compounds were known as bitter and the selection was purely based on their
Chemical structure of the isoflavone, isoflavan, and coumestan skeleton. A-
11a the commonly used carbon positions (inside), and
positions can be substituted with
were screened for their ability to activate
hTAS2R14 and hTAS2R39. When activation occurred at 500 µM, different concentrations
response behavior. Thresholds values and, when
Table 2 for hTAS2R39.
In total, 13 compounds activated hTAS2R14 and 15 compounds were active on hTAS2R39.
) hTAS2R39 containing
activity relationship of selected isoflavonoids on hTAS2R14 and hTAS2R39
to understand the molecular signature involved in bitter receptor activation of
genistein, 15 additional compounds were selected besides the four genistein forms, based
on the structure of the soy isoflavone genistein: 13 isoflavones with different substi
pattern of the skeleton, one isoflavan and one coumestan. To simplify comparisons between
molecules, the common position numbering was substituted by Greek letter labeling as
rings, molecules with
Tables 1
). Not all compounds were known as bitter and the selection was purely based on their
-D denote the
11a the commonly used carbon positions (inside), and
positions can be substituted with
were screened for their ability to activate
hTAS2R14 and hTAS2R39. When activation occurred at 500 µM, different concentrations
response behavior. Thresholds values and, when
for hTAS2R39.
In total, 13 compounds activated hTAS2R14 and 15 compounds were active on hTAS2R39.
) hTAS2R39 containing
activity relationship of selected isoflavonoids on hTAS2R14 and hTAS2R39
to understand the molecular signature involved in bitter receptor activation of
genistein, 15 additional compounds were selected besides the four genistein forms, based
on the structure of the soy isoflavone genistein: 13 isoflavones with different substitution
pattern of the skeleton, one isoflavan and one coumestan. To simplify comparisons between
molecules, the common position numbering was substituted by Greek letter labeling as
ecules with
Tables 1
). Not all compounds were known as bitter and the selection was purely based on their
D denote the
11a the commonly used carbon positions (inside), and
positions can be substituted with -OH,
were screened for their ability to activate
hTAS2R14 and hTAS2R39. When activation occurred at 500 µM, different concentrations
response behavior. Thresholds values and, when
for hTAS2R39.
In total, 13 compounds activated hTAS2R14 and 15 compounds were active on hTAS2R39.
) hTAS2R39 containing
activity relationship of selected isoflavonoids on hTAS2R14 and hTAS2R39
to understand the molecular signature involved in bitter receptor activation of
genistein, 15 additional compounds were selected besides the four genistein forms, based
tution
pattern of the skeleton, one isoflavan and one coumestan. To simplify comparisons between
molecules, the common position numbering was substituted by Greek letter labeling as
ecules with
Tables 1 and
). Not all compounds were known as bitter and the selection was purely based on their
D denote the
11a the commonly used carbon positions (inside), and
OH,
were screened for their ability to activate
hTAS2R14 and hTAS2R39. When activation occurred at 500 µM, different concentrations
response behavior. Thresholds values and, when
for hTAS2R39.
In total, 13 compounds activated hTAS2R14 and 15 compounds were active on hTAS2R39.
) hTAS2R39 containing
activity relationship of selected isoflavonoids on hTAS2R14 and hTAS2R39
to understand the molecular signature involved in bitter receptor activation of
genistein, 15 additional compounds were selected besides the four genistein forms, based
tution
pattern of the skeleton, one isoflavan and one coumestan. To simplify comparisons between
molecules, the common position numbering was substituted by Greek letter labeling as
ecules with
and
). Not all compounds were known as bitter and the selection was purely based on their
D denote the
11a the commonly used carbon positions (inside), and
OH, -
were screened for their ability to activate
hTAS2R14 and hTAS2R39. When activation occurred at 500 µM, different concentrations
response behavior. Thresholds values and, when
for hTAS2R39.
In total, 13 compounds activated hTAS2R14 and 15 compounds were active on hTAS2R39.
Soy isoflavones activate hTAS2R14 and -39
43
Based on the threshold values for each of the two receptors, the compounds were classified
into four groups, I ≤32 µM (low), 32 µM < II ≤ 125 µM (medium), and 125 µM < III ≤ 500
µM (high), and IV no activation up to 500 µM (not active, (n.a.)). hTAS2R14 was activated
by four compounds at low threshold, by two compounds at medium threshold, and seven
compounds had a high threshold. Six compounds were considered inactive on hTAS2R14.
For hTAS2R39, less compounds belonged to the low (2x) and the medium threshold group
(2x), but more compounds belonged to the high threshold group (11x). Four compounds
were inactive on hTAS2R39. In a number of cases it was not possible to determine whether
a compound activated the receptor or not, due to non-specific signals in the negative
controls, which were not significantly lower than those in the induced cells. Those
compounds were considered as not active. Dye exclusion tests were conducted in order to
investigate whether the applied isoflavonoid concentrations influenced the viability of the
cells. Even at highest concentration (1 mM), no toxic effect on the cells was observed (see
Supporting information, Figure S2). Furthermore, all compounds were tested for
autofluorescence. None of the isoflavonoids in this study showed fluorescent behaviour
under the conditions used in the assay.
Effect of glucosylation
Aglycones showed similar effects on hTAS2R14 and hTAS2R39, whereas glucosides
showed different effects. Thirteen out of the fourteen aglycones activated hTAS2R14, while
there were eleven for hTAS2R39. Most of them activated hTAS2R14 at lower
concentrations than hTAS2R39. By contrast, glucosylated isoflavones did not show any
activity on hTAS2R14. Although thresholds were generally high, hTAS2R39 could be
activated by four out of five isoflavone glucosides, viz. glycitin, genistin, acetylgenistin,
and malonyl genistin (Figure 2). This finding suggested that glucosylation inhibited
activation of hTAS2R14.
As β-glucopyranosides are reported to activate hTAS2R16 (27), the five glucosides
daidzin, glycitin, genistin, acetyl genistin, and malonyl genistin were additionally tested on
hTAS2R16. None of them activated this receptor. A very recent publication reported the
inhibition of hTAS2R16 by probenecide (28), a compound commonly used in G-protein
coupled receptor assays to prevent the efflux of calcium-sensitive dyes from the cells (29).
Therefore, experiments on hTAS2R16 were repeated without probenecide in the buffer.
Also without probenecide, no activation of hTAS2R16 by soy isoflavone glucosides
occurred.
2
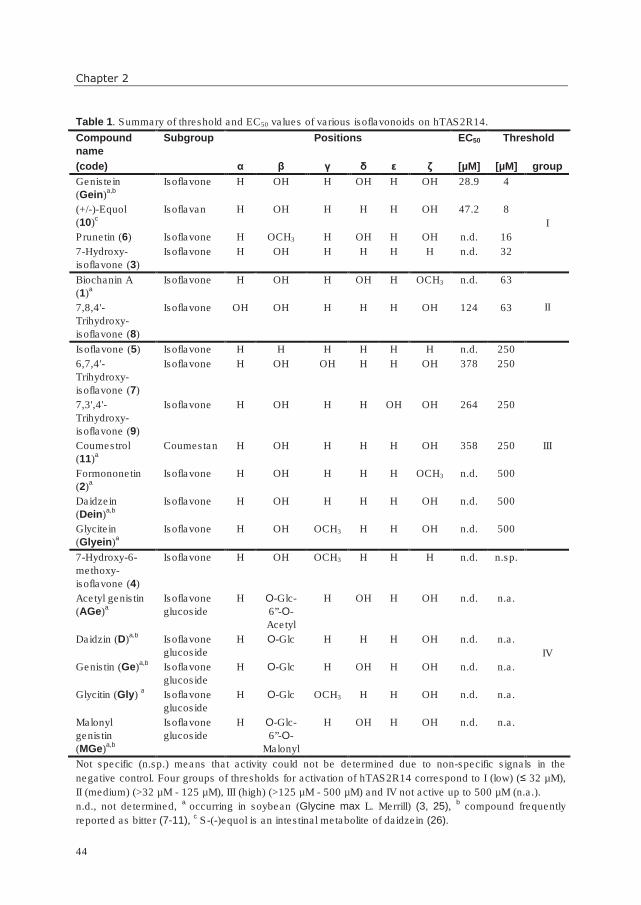
Chapter 2
44
Table 1. Summary of threshold and EC50 values of various isoflavonoids on hTAS2R14.
Compound
name
Subgroup Positions EC50 Threshold
(code) α β γ δ ε ζ [µM] [µM] group
Genistein
(Gein)a,b
Isoflavone H OH H OH H OH 28.9 4
I
(+/-)-Equol
(10)c
Isoflavan H OH H H H OH 47.2 8
Prunetin (6) Isoflavone H OCH3 H OH H OH n.d. 16
7-Hydroxy-
isoflavone (3)
Isoflavone H OH H H H H n.d. 32
Biochanin A
(1)a
Isoflavone H OH H OH H OCH3 n.d. 63
II 7,8,4'-
Trihydroxy-
isoflavone (8)
Isoflavone OH OH H H H OH 124 63
Isoflavone (5) Isoflavone H H H H H H n.d. 250
III
6,7,4'-
Trihydroxy-
isoflavone (7)
Isoflavone H OH OH H H OH 378 250
7,3',4'-
Trihydroxy-
isoflavone (9)
Isoflavone H OH H H OH OH 264 250
Coumestrol
(11)a
Coumestan H OH H H H OH 358 250
Formononetin
(2)a
Isoflavone H OH H H H OCH3 n.d. 500
Daidzein
(Dein)a,b
Isoflavone H OH H H H OH n.d. 500
Glycitein
(Glyein)a
Isoflavone H OH OCH3 H H OH n.d. 500
7-Hydroxy-6-
methoxy-
isoflavone (4)
Isoflavone H OH OCH3 H H H n.d. n.sp.
IV
Acetyl genistin
(AGe)a
Isoflavone
glucoside
H O-Glc-
6”-O-
Acetyl
H OH H OH n.d. n.a.
Daidzin (D)a,b
Isoflavone
glucoside
H O-Glc H H H OH n.d. n.a.
Genistin (Ge)a,b
Isoflavone
glucoside
H O-Glc H OH H OH n.d. n.a.
Glycitin (Gly) a Isoflavone
glucoside
H O-Glc OCH3 H H OH n.d. n.a.
Malonyl
genistin
(MGe)a,b
Isoflavone
glucoside
H O-Glc-
6”-O-
Malonyl
H OH H OH n.d. n.a.
Not specific (n.sp.) means that activity could not be determined due to non-specific signals in the
negative control. Four groups of thresholds for activation of hTAS2R14 correspond to I (low) (≤ 32 µM),
II (medium) (>32 µM - 125 µM), III (high) (>125 µM - 500 µM) and IV not active up to 500 µM (n.a.).
n.d., not determined, a
occurring in soybean (Glycine max L. Merrill) (3, 25), b compound frequently
reported as bitter (7-11), c S-(-)equol is an intestinal metabolite of daidzein (26).
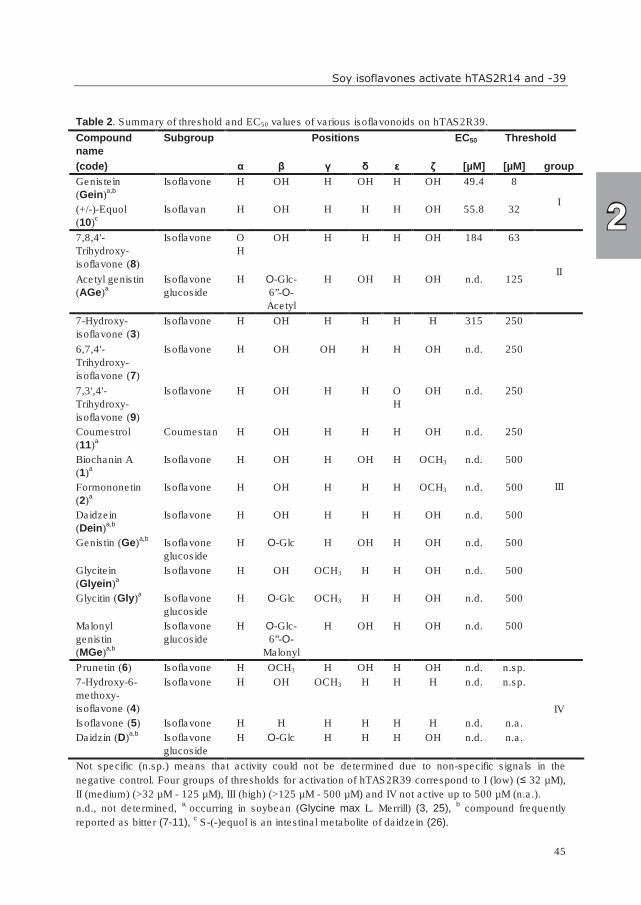
Soy isoflavones activate hTAS2R14 and -39
45
Table 2. Summary of threshold and EC50 values of various isoflavonoids on hTAS2R39.
Compound
name
Subgroup Positions EC50 Threshold
(code) α β γ δ ε ζ [µM] [µM] group
Genistein
(Gein)a,b
Isoflavone H OH H OH H OH 49.4 8
I (+/-)-Equol
(10)c
Isoflavan H OH H H H OH 55.8 32
7,8,4'-
Trihydroxy-
isoflavone (8)
Isoflavone O
H
OH H H H OH 184 63
II Acetyl genistin
(AGe)a
Isoflavone
glucoside
H O-Glc-
6”-O-
Acetyl
H OH H OH n.d. 125
7-Hydroxy-
isoflavone (3)
Isoflavone H OH H H H H 315 250
III
6,7,4'-
Trihydroxy-
isoflavone (7)
Isoflavone H OH OH H H OH n.d. 250
7,3',4'-
Trihydroxy-
isoflavone (9)
Isoflavone H OH H H O
H
OH n.d. 250
Coumestrol
(11)a
Coumestan H OH H H H OH n.d. 250
Biochanin A
(1)a
Isoflavone H OH H OH H OCH3 n.d. 500
Formononetin
(2)a
Isoflavone H OH H H H OCH3 n.d. 500
Daidzein
(Dein)a,b
Isoflavone H OH H H H OH n.d. 500
Genistin (Ge)a,b
Isoflavone
glucoside
H O-Glc H OH H OH n.d. 500
Glycitein
(Glyein)a
Isoflavone H OH OCH3 H H OH n.d. 500
Glycitin (Gly)a Isoflavone
glucoside
H O-Glc OCH3 H H OH n.d. 500
Malonyl
genistin
(MGe)a,b
Isoflavone
glucoside
H O-Glc-
6”-O-
Malonyl
H OH H OH n.d. 500
Prunetin (6) Isoflavone H OCH3 H OH H OH n.d. n.sp.
IV
7-Hydroxy-6-
methoxy-
isoflavone (4)
Isoflavone H OH OCH3 H H H n.d. n.sp.
Isoflavone (5) Isoflavone H H H H H H n.d. n.a.
Daidzin (D)a,b
Isoflavone
glucoside
H O-Glc H H H OH n.d. n.a.
Not specific (n.sp.) means that activity could not be determined due to non-specific signals in the
negative control. Four groups of thresholds for activation of hTAS2R39 correspond to I (low) (≤ 32 µM),
II (medium) (>32 µM - 125 µM), III (high) (>125 µM - 500 µM) and IV not active up to 500 µM (n.a.).
n.d., not determined, a
occurring in soybean (Glycine max L. Merrill) (3, 25), b compound frequently
reported as bitter (7-11), c S-(-)equol is an intestinal metabolite of daidzein (26).
2
Chapter 2
46
Influence of C-ring configuration
To investigate the influence of the C-ring of isoflavonoids on bitter receptor activation, the
isoflavone daidzein (Dein), the isoflavan equol (10) and the coumestan coumestrol (11)
were compared. They all have two hydroxyl groups (on positions β and ζ) in common,
whereas the C-ring is different (position labeling illustrated on skeletons in Figure 3). All
three compounds were able to activate hTAS2R14 and hTAS2R39, which is illustrated in
Figure 4A for hTAS2R14 (equol >> daidzein, coumestrol). The results suggested that bitter
receptor activation is not hindered by variation in C-ring structure, although potency and
efficacy might be affected. Although only three compounds were compared, our data might
suggest that planarity of the C-ring is less favorable for binding to the bitter receptors.
Figure 4. Concentration-response curves of hTAS2R14 for (A) the isoflavone daidzein (Dein), the
isoflavan equol (10), and the coumestan coumestrol (11), and (B) the three isoflavones 6,7,4'-
trihydroxyisoflavone (7), 7,8,4'-trihydroxyisoflavone (8), and 7,3',4'-trihydroxyisoflavone (9).
Substitutions of A- and B-rings
In Figure 4B, the activation of hTAS2R14 by three isoflavones is compared. These three
isoflavones (7,8,9) are all substituted by three hydroxyl groups. (7) and (8) have two
hydroxyl groups on the A-ring and one hydroxyl group on the B-ring, whereas (9) has vice
versa. They all activated the bitter receptor, but with differences in potency and efficacy.
The exact location of hydroxylation is of importance, as for example two hydroxyl groups
on positions α and β (compound 8) led to higher efficacy and potency than two hydroxyl
groups on positions β and γ (compound 7). Also the number of substitutions matters; in
most cases, three substitutions were more favorable for activation than two, which can be
seen (Table 1) when comparing (Glyein) to (4), (1) to (2), or (Gein) to (Dein). For the
activation of hTAS2R39, substitution of the A-ring is important, as the unsubstituted
compound (5) was inactive. Absence of substitutions had less influence on hTAS2R14
activation. For both receptors, an O-methyl group instead of a hydroxyl group negatively
influenced receptor activation (with the exception of prunetin (6) on hTAS2R14).
Hydroxylation of β and ζ and one additional position seemed to be most favorable for
Soy isoflavones activate hTAS2R14 and -39
47
receptor activation, as all compounds containing these features were able to activate
hTAS2R14 and hTAS2R39.
DISCUSSION
Common agonists on hTAS2R14 and hTAS2R39
The identity between amino acid sequences of hTAS2R14 and hTAS2R39 is only 25 %
(30). Despite this, they are both activated by a largely overlapping group of isoflavonoids.
We found 11 isoflavonoids that were able to activate both bitter receptors (compounds
Gein, Dein, Glyein, 1, 2, 3, 7, 8, 9, 10, 11). Until now, only four compounds were
described that stimulated both hTAS2R14 and hTAS2R39, which are azathioprine,
chlorpheniramine, diphenidol and quinine (13) (see Supporting information). These four
compounds and the newly identified isoflavonoid-agonists do not share structural
characteristics regarding to charge, hydrophobicity, or the ability to act as proton donor or
acceptor. In Figure 5A, the threshold values of the agonists on hTAS2R14 are displayed
against the threshold values on hTAS2R39. It was remarkable that the compounds with low
threshold at one receptor also demonstrated low threshold at the other receptor. The dashed
line in the figure depicts the correlation. A similar trend was observed for EC50 values on
hTAS2R14 and hTAS2R39, as illustrated in Figure 5B. Aglycones showed similar effects
on both receptors, but the agonists were by trend less active on hTAS2R39 than on
hTAS2R14.
The question remains, which of the two bitter receptors is more important for
recognition of isoflavones. In situ hybridization experiments indicated that the expression
frequencies of hTAS2R14 and hTA2R39 in taste receptor cells of human circumvallate
papillae were similar (31). They were reported to be 5.4 % for hTAS2R14 and 4.2 %
hTA2R39. It might be concluded from our results that hTAS2R14 is slightly more
important for the recognition of isoflavone aglycones, as the determined bitterness
threshold values were lower for hTAS2R14 than for hTAS2R39. In contrast, hTAS2R39
was activated by isoflavone glucosides, and, therefore, might be seen as more important
bitter receptor for the recognition of soy isoflavone glucosides, as glucosides are more
abundant in most soy products. For fermented soy products, which are richer in aglycones,
hTAS2R14 gains importance.
2
Chapter 2
48
Figure 5
dashed line in (
New dietary agonists of receptor hTAS2R39
So far, 17 agonists had been described for hTAS2R39
information
isoflavonoids. The other 13 agonists belong to different chemical classes, and they are
struct
consumed in our diet as tea catechins, vitamin B1 and quinine in bitter tonic. In our study,
15 new ligands of hTAS2R39 were identified, viz.
MGe
conclusion, it can be expected that hTAS2R39 plays a key role in the detection of dietary
compounds.
of the pyranose activated the human bitter receptor hTAS2R16. The
glycosidic bond and the steric position of the hydroxyl group a
crucial for activation of hTAS2R16, whereas the hydrophobicity of the C1 substituent was
reported to be important but not essential for activation of hTAS2R16. As the glucosylated
soy isoflavones in this study also belong to the c
that they might also be agonists of hTAS2R16
find activation of hTAS2R16 by isoflavone glucosides. It cannot be excluded that higher
concentrations would lead to activat
most soy products. More likely, the aglycone part of the isoflavone glucosides did not
match the size and hydrophobicity requirements of hTAS2R16.
isoflavone glucosides
Chapter 2
Figure 5
dashed line in (
New dietary agonists of receptor hTAS2R39
So far, 17 agonists had been described for hTAS2R39
information
isoflavonoids. The other 13 agonists belong to different chemical classes, and they are
structurally very different form isoflavonoids. Six of the 17 known agonists are regularly
consumed in our diet as tea catechins, vitamin B1 and quinine in bitter tonic. In our study,
15 new ligands of hTAS2R39 were identified, viz.
MGe, 1
conclusion, it can be expected that hTAS2R39 plays a key role in the detection of dietary
compounds.
It was reported
of the pyranose activated the human bitter receptor hTAS2R16. The
glycosidic bond and the steric position of the hydroxyl group a
crucial for activation of hTAS2R16, whereas the hydrophobicity of the C1 substituent was
reported to be important but not essential for activation of hTAS2R16. As the glucosylated
soy isoflavones in this study also belong to the c
that they might also be agonists of hTAS2R16
find activation of hTAS2R16 by isoflavone glucosides. It cannot be excluded that higher
concentrations would lead to activat
most soy products. More likely, the aglycone part of the isoflavone glucosides did not
match the size and hydrophobicity requirements of hTAS2R16.
isoflavone glucosides
Chapter 2
Figure 5. Correlation of (
dashed line in (
New dietary agonists of receptor hTAS2R39
So far, 17 agonists had been described for hTAS2R39
information
isoflavonoids. The other 13 agonists belong to different chemical classes, and they are
urally very different form isoflavonoids. Six of the 17 known agonists are regularly
consumed in our diet as tea catechins, vitamin B1 and quinine in bitter tonic. In our study,
15 new ligands of hTAS2R39 were identified, viz.
1, 2,
conclusion, it can be expected that hTAS2R39 plays a key role in the detection of dietary
compounds.
It was reported
of the pyranose activated the human bitter receptor hTAS2R16. The
glycosidic bond and the steric position of the hydroxyl group a
crucial for activation of hTAS2R16, whereas the hydrophobicity of the C1 substituent was
reported to be important but not essential for activation of hTAS2R16. As the glucosylated
soy isoflavones in this study also belong to the c
that they might also be agonists of hTAS2R16
find activation of hTAS2R16 by isoflavone glucosides. It cannot be excluded that higher
concentrations would lead to activat
most soy products. More likely, the aglycone part of the isoflavone glucosides did not
match the size and hydrophobicity requirements of hTAS2R16.
isoflavone glucosides
. Correlation of (
dashed line in (A) represents the linear regression line (R²=0.75).
New dietary agonists of receptor hTAS2R39
So far, 17 agonists had been described for hTAS2R39
information). Of these agonists, four are flavonoids and therewith structurally similar to
isoflavonoids. The other 13 agonists belong to different chemical classes, and they are
urally very different form isoflavonoids. Six of the 17 known agonists are regularly
consumed in our diet as tea catechins, vitamin B1 and quinine in bitter tonic. In our study,
15 new ligands of hTAS2R39 were identified, viz.
, 3,
conclusion, it can be expected that hTAS2R39 plays a key role in the detection of dietary
compounds.
It was reported
of the pyranose activated the human bitter receptor hTAS2R16. The
glycosidic bond and the steric position of the hydroxyl group a
crucial for activation of hTAS2R16, whereas the hydrophobicity of the C1 substituent was
reported to be important but not essential for activation of hTAS2R16. As the glucosylated
soy isoflavones in this study also belong to the c
that they might also be agonists of hTAS2R16
find activation of hTAS2R16 by isoflavone glucosides. It cannot be excluded that higher
concentrations would lead to activat
most soy products. More likely, the aglycone part of the isoflavone glucosides did not
match the size and hydrophobicity requirements of hTAS2R16.
isoflavone glucosides
. Correlation of (
) represents the linear regression line (R²=0.75).
New dietary agonists of receptor hTAS2R39
So far, 17 agonists had been described for hTAS2R39
). Of these agonists, four are flavonoids and therewith structurally similar to
isoflavonoids. The other 13 agonists belong to different chemical classes, and they are
urally very different form isoflavonoids. Six of the 17 known agonists are regularly
consumed in our diet as tea catechins, vitamin B1 and quinine in bitter tonic. In our study,
15 new ligands of hTAS2R39 were identified, viz.
, 7, 8
conclusion, it can be expected that hTAS2R39 plays a key role in the detection of dietary
It was reported
of the pyranose activated the human bitter receptor hTAS2R16. The
glycosidic bond and the steric position of the hydroxyl group a
crucial for activation of hTAS2R16, whereas the hydrophobicity of the C1 substituent was
reported to be important but not essential for activation of hTAS2R16. As the glucosylated
soy isoflavones in this study also belong to the c
that they might also be agonists of hTAS2R16
find activation of hTAS2R16 by isoflavone glucosides. It cannot be excluded that higher
concentrations would lead to activat
most soy products. More likely, the aglycone part of the isoflavone glucosides did not
match the size and hydrophobicity requirements of hTAS2R16.
isoflavone glucosides
. Correlation of (A
) represents the linear regression line (R²=0.75).
New dietary agonists of receptor hTAS2R39
So far, 17 agonists had been described for hTAS2R39
). Of these agonists, four are flavonoids and therewith structurally similar to
isoflavonoids. The other 13 agonists belong to different chemical classes, and they are
urally very different form isoflavonoids. Six of the 17 known agonists are regularly
consumed in our diet as tea catechins, vitamin B1 and quinine in bitter tonic. In our study,
15 new ligands of hTAS2R39 were identified, viz.
8, 9,
conclusion, it can be expected that hTAS2R39 plays a key role in the detection of dietary
It was reported (27)
of the pyranose activated the human bitter receptor hTAS2R16. The
glycosidic bond and the steric position of the hydroxyl group a
crucial for activation of hTAS2R16, whereas the hydrophobicity of the C1 substituent was
reported to be important but not essential for activation of hTAS2R16. As the glucosylated
soy isoflavones in this study also belong to the c
that they might also be agonists of hTAS2R16
find activation of hTAS2R16 by isoflavone glucosides. It cannot be excluded that higher
concentrations would lead to activat
most soy products. More likely, the aglycone part of the isoflavone glucosides did not
match the size and hydrophobicity requirements of hTAS2R16.
isoflavone glucosides as agonists of hTAS2R39 instead
A) threshold values and (
) represents the linear regression line (R²=0.75).
New dietary agonists of receptor hTAS2R39
So far, 17 agonists had been described for hTAS2R39
). Of these agonists, four are flavonoids and therewith structurally similar to
isoflavonoids. The other 13 agonists belong to different chemical classes, and they are
urally very different form isoflavonoids. Six of the 17 known agonists are regularly
consumed in our diet as tea catechins, vitamin B1 and quinine in bitter tonic. In our study,
15 new ligands of hTAS2R39 were identified, viz.
, 10, and
conclusion, it can be expected that hTAS2R39 plays a key role in the detection of dietary
(27), that
of the pyranose activated the human bitter receptor hTAS2R16. The
glycosidic bond and the steric position of the hydroxyl group a
crucial for activation of hTAS2R16, whereas the hydrophobicity of the C1 substituent was
reported to be important but not essential for activation of hTAS2R16. As the glucosylated
soy isoflavones in this study also belong to the c
that they might also be agonists of hTAS2R16
find activation of hTAS2R16 by isoflavone glucosides. It cannot be excluded that higher
concentrations would lead to activat
most soy products. More likely, the aglycone part of the isoflavone glucosides did not
match the size and hydrophobicity requirements of hTAS2R16.
as agonists of hTAS2R39 instead
) threshold values and (
) represents the linear regression line (R²=0.75).
New dietary agonists of receptor hTAS2R39
So far, 17 agonists had been described for hTAS2R39
). Of these agonists, four are flavonoids and therewith structurally similar to
isoflavonoids. The other 13 agonists belong to different chemical classes, and they are
urally very different form isoflavonoids. Six of the 17 known agonists are regularly
consumed in our diet as tea catechins, vitamin B1 and quinine in bitter tonic. In our study,
15 new ligands of hTAS2R39 were identified, viz.
, and
conclusion, it can be expected that hTAS2R39 plays a key role in the detection of dietary
, that β-
of the pyranose activated the human bitter receptor hTAS2R16. The
glycosidic bond and the steric position of the hydroxyl group a
crucial for activation of hTAS2R16, whereas the hydrophobicity of the C1 substituent was
reported to be important but not essential for activation of hTAS2R16. As the glucosylated
soy isoflavones in this study also belong to the c
that they might also be agonists of hTAS2R16
find activation of hTAS2R16 by isoflavone glucosides. It cannot be excluded that higher
concentrations would lead to activat
most soy products. More likely, the aglycone part of the isoflavone glucosides did not
match the size and hydrophobicity requirements of hTAS2R16.
as agonists of hTAS2R39 instead
) threshold values and (
) represents the linear regression line (R²=0.75).
New dietary agonists of receptor hTAS2R39
So far, 17 agonists had been described for hTAS2R39
). Of these agonists, four are flavonoids and therewith structurally similar to
isoflavonoids. The other 13 agonists belong to different chemical classes, and they are
urally very different form isoflavonoids. Six of the 17 known agonists are regularly
consumed in our diet as tea catechins, vitamin B1 and quinine in bitter tonic. In our study,
15 new ligands of hTAS2R39 were identified, viz.
, and 11
conclusion, it can be expected that hTAS2R39 plays a key role in the detection of dietary
-glucopyranosides with a hydrophobic group attached to C1
of the pyranose activated the human bitter receptor hTAS2R16. The
glycosidic bond and the steric position of the hydroxyl group a
crucial for activation of hTAS2R16, whereas the hydrophobicity of the C1 substituent was
reported to be important but not essential for activation of hTAS2R16. As the glucosylated
soy isoflavones in this study also belong to the c
that they might also be agonists of hTAS2R16
find activation of hTAS2R16 by isoflavone glucosides. It cannot be excluded that higher
concentrations would lead to activat
most soy products. More likely, the aglycone part of the isoflavone glucosides did not
match the size and hydrophobicity requirements of hTAS2R16.
as agonists of hTAS2R39 instead
) threshold values and (
) represents the linear regression line (R²=0.75).
New dietary agonists of receptor hTAS2R39
So far, 17 agonists had been described for hTAS2R39
). Of these agonists, four are flavonoids and therewith structurally similar to
isoflavonoids. The other 13 agonists belong to different chemical classes, and they are
urally very different form isoflavonoids. Six of the 17 known agonists are regularly
consumed in our diet as tea catechins, vitamin B1 and quinine in bitter tonic. In our study,
15 new ligands of hTAS2R39 were identified, viz.
11. Most of the new agonists are dietary compounds. In
conclusion, it can be expected that hTAS2R39 plays a key role in the detection of dietary
glucopyranosides with a hydrophobic group attached to C1
of the pyranose activated the human bitter receptor hTAS2R16. The
glycosidic bond and the steric position of the hydroxyl group a
crucial for activation of hTAS2R16, whereas the hydrophobicity of the C1 substituent was
reported to be important but not essential for activation of hTAS2R16. As the glucosylated
soy isoflavones in this study also belong to the c
that they might also be agonists of hTAS2R16
find activation of hTAS2R16 by isoflavone glucosides. It cannot be excluded that higher
concentrations would lead to activation, but such high concentrations are not expected in
most soy products. More likely, the aglycone part of the isoflavone glucosides did not
match the size and hydrophobicity requirements of hTAS2R16.
as agonists of hTAS2R39 instead
) threshold values and (
) represents the linear regression line (R²=0.75).
New dietary agonists of receptor hTAS2R39
So far, 17 agonists had been described for hTAS2R39
). Of these agonists, four are flavonoids and therewith structurally similar to
isoflavonoids. The other 13 agonists belong to different chemical classes, and they are
urally very different form isoflavonoids. Six of the 17 known agonists are regularly
consumed in our diet as tea catechins, vitamin B1 and quinine in bitter tonic. In our study,
15 new ligands of hTAS2R39 were identified, viz.
. Most of the new agonists are dietary compounds. In
conclusion, it can be expected that hTAS2R39 plays a key role in the detection of dietary
glucopyranosides with a hydrophobic group attached to C1
of the pyranose activated the human bitter receptor hTAS2R16. The
glycosidic bond and the steric position of the hydroxyl group a
crucial for activation of hTAS2R16, whereas the hydrophobicity of the C1 substituent was
reported to be important but not essential for activation of hTAS2R16. As the glucosylated
soy isoflavones in this study also belong to the c
that they might also be agonists of hTAS2R16
find activation of hTAS2R16 by isoflavone glucosides. It cannot be excluded that higher
ion, but such high concentrations are not expected in
most soy products. More likely, the aglycone part of the isoflavone glucosides did not
match the size and hydrophobicity requirements of hTAS2R16.
as agonists of hTAS2R39 instead
) threshold values and (B
) represents the linear regression line (R²=0.75).
New dietary agonists of receptor hTAS2R39
So far, 17 agonists had been described for hTAS2R39
). Of these agonists, four are flavonoids and therewith structurally similar to
isoflavonoids. The other 13 agonists belong to different chemical classes, and they are
urally very different form isoflavonoids. Six of the 17 known agonists are regularly
consumed in our diet as tea catechins, vitamin B1 and quinine in bitter tonic. In our study,
15 new ligands of hTAS2R39 were identified, viz.
. Most of the new agonists are dietary compounds. In
conclusion, it can be expected that hTAS2R39 plays a key role in the detection of dietary
glucopyranosides with a hydrophobic group attached to C1
of the pyranose activated the human bitter receptor hTAS2R16. The
glycosidic bond and the steric position of the hydroxyl group a
crucial for activation of hTAS2R16, whereas the hydrophobicity of the C1 substituent was
reported to be important but not essential for activation of hTAS2R16. As the glucosylated
soy isoflavones in this study also belong to the c
that they might also be agonists of hTAS2R16. Under the conditions used by us, we did not
find activation of hTAS2R16 by isoflavone glucosides. It cannot be excluded that higher
ion, but such high concentrations are not expected in
most soy products. More likely, the aglycone part of the isoflavone glucosides did not
match the size and hydrophobicity requirements of hTAS2R16.
as agonists of hTAS2R39 instead
B) EC
) represents the linear regression line (R²=0.75).
So far, 17 agonists had been described for hTAS2R39
). Of these agonists, four are flavonoids and therewith structurally similar to
isoflavonoids. The other 13 agonists belong to different chemical classes, and they are
urally very different form isoflavonoids. Six of the 17 known agonists are regularly
consumed in our diet as tea catechins, vitamin B1 and quinine in bitter tonic. In our study,
15 new ligands of hTAS2R39 were identified, viz.
. Most of the new agonists are dietary compounds. In
conclusion, it can be expected that hTAS2R39 plays a key role in the detection of dietary
glucopyranosides with a hydrophobic group attached to C1
of the pyranose activated the human bitter receptor hTAS2R16. The
glycosidic bond and the steric position of the hydroxyl group a
crucial for activation of hTAS2R16, whereas the hydrophobicity of the C1 substituent was
reported to be important but not essential for activation of hTAS2R16. As the glucosylated
soy isoflavones in this study also belong to the class of
. Under the conditions used by us, we did not
find activation of hTAS2R16 by isoflavone glucosides. It cannot be excluded that higher
ion, but such high concentrations are not expected in
most soy products. More likely, the aglycone part of the isoflavone glucosides did not
match the size and hydrophobicity requirements of hTAS2R16.
as agonists of hTAS2R39 instead
) EC50 values of hTAS2R14 and hTAS2R39. The
) represents the linear regression line (R²=0.75).
So far, 17 agonists had been described for hTAS2R39
). Of these agonists, four are flavonoids and therewith structurally similar to
isoflavonoids. The other 13 agonists belong to different chemical classes, and they are
urally very different form isoflavonoids. Six of the 17 known agonists are regularly
consumed in our diet as tea catechins, vitamin B1 and quinine in bitter tonic. In our study,
15 new ligands of hTAS2R39 were identified, viz. Gein
. Most of the new agonists are dietary compounds. In
conclusion, it can be expected that hTAS2R39 plays a key role in the detection of dietary
glucopyranosides with a hydrophobic group attached to C1
of the pyranose activated the human bitter receptor hTAS2R16. The
glycosidic bond and the steric position of the hydroxyl group a
crucial for activation of hTAS2R16, whereas the hydrophobicity of the C1 substituent was
reported to be important but not essential for activation of hTAS2R16. As the glucosylated
lass of β
. Under the conditions used by us, we did not
find activation of hTAS2R16 by isoflavone glucosides. It cannot be excluded that higher
ion, but such high concentrations are not expected in
most soy products. More likely, the aglycone part of the isoflavone glucosides did not
match the size and hydrophobicity requirements of hTAS2R16.
as agonists of hTAS2R39 instead
values of hTAS2R14 and hTAS2R39. The
) represents the linear regression line (R²=0.75).
So far, 17 agonists had been described for hTAS2R39
). Of these agonists, four are flavonoids and therewith structurally similar to
isoflavonoids. The other 13 agonists belong to different chemical classes, and they are
urally very different form isoflavonoids. Six of the 17 known agonists are regularly
consumed in our diet as tea catechins, vitamin B1 and quinine in bitter tonic. In our study,
Gein,
. Most of the new agonists are dietary compounds. In
conclusion, it can be expected that hTAS2R39 plays a key role in the detection of dietary
glucopyranosides with a hydrophobic group attached to C1
of the pyranose activated the human bitter receptor hTAS2R16. The
glycosidic bond and the steric position of the hydroxyl group a
crucial for activation of hTAS2R16, whereas the hydrophobicity of the C1 substituent was
reported to be important but not essential for activation of hTAS2R16. As the glucosylated
lass of β-glucopyranosides, we speculated
. Under the conditions used by us, we did not
find activation of hTAS2R16 by isoflavone glucosides. It cannot be excluded that higher
ion, but such high concentrations are not expected in
most soy products. More likely, the aglycone part of the isoflavone glucosides did not
match the size and hydrophobicity requirements of hTAS2R16.
as agonists of hTAS2R39 instead.
values of hTAS2R14 and hTAS2R39. The
So far, 17 agonists had been described for hTAS2R39 (13, 18, 32)
). Of these agonists, four are flavonoids and therewith structurally similar to
isoflavonoids. The other 13 agonists belong to different chemical classes, and they are
urally very different form isoflavonoids. Six of the 17 known agonists are regularly
consumed in our diet as tea catechins, vitamin B1 and quinine in bitter tonic. In our study,
, Dein
. Most of the new agonists are dietary compounds. In
conclusion, it can be expected that hTAS2R39 plays a key role in the detection of dietary
glucopyranosides with a hydrophobic group attached to C1
of the pyranose activated the human bitter receptor hTAS2R16. The
glycosidic bond and the steric position of the hydroxyl group a
crucial for activation of hTAS2R16, whereas the hydrophobicity of the C1 substituent was
reported to be important but not essential for activation of hTAS2R16. As the glucosylated
glucopyranosides, we speculated
. Under the conditions used by us, we did not
find activation of hTAS2R16 by isoflavone glucosides. It cannot be excluded that higher
ion, but such high concentrations are not expected in
most soy products. More likely, the aglycone part of the isoflavone glucosides did not
match the size and hydrophobicity requirements of hTAS2R16.
values of hTAS2R14 and hTAS2R39. The
(13, 18, 32)
). Of these agonists, four are flavonoids and therewith structurally similar to
isoflavonoids. The other 13 agonists belong to different chemical classes, and they are
urally very different form isoflavonoids. Six of the 17 known agonists are regularly
consumed in our diet as tea catechins, vitamin B1 and quinine in bitter tonic. In our study,
Dein,
. Most of the new agonists are dietary compounds. In
conclusion, it can be expected that hTAS2R39 plays a key role in the detection of dietary
glucopyranosides with a hydrophobic group attached to C1
of the pyranose activated the human bitter receptor hTAS2R16. The
glycosidic bond and the steric position of the hydroxyl group at C4 of the pyranose were
crucial for activation of hTAS2R16, whereas the hydrophobicity of the C1 substituent was
reported to be important but not essential for activation of hTAS2R16. As the glucosylated
glucopyranosides, we speculated
. Under the conditions used by us, we did not
find activation of hTAS2R16 by isoflavone glucosides. It cannot be excluded that higher
ion, but such high concentrations are not expected in
most soy products. More likely, the aglycone part of the isoflavone glucosides did not
match the size and hydrophobicity requirements of hTAS2R16. It was surprising to identify
values of hTAS2R14 and hTAS2R39. The
(13, 18, 32)
). Of these agonists, four are flavonoids and therewith structurally similar to
isoflavonoids. The other 13 agonists belong to different chemical classes, and they are
urally very different form isoflavonoids. Six of the 17 known agonists are regularly
consumed in our diet as tea catechins, vitamin B1 and quinine in bitter tonic. In our study,
, Glyein
. Most of the new agonists are dietary compounds. In
conclusion, it can be expected that hTAS2R39 plays a key role in the detection of dietary
glucopyranosides with a hydrophobic group attached to C1
of the pyranose activated the human bitter receptor hTAS2R16. The β-
t C4 of the pyranose were
crucial for activation of hTAS2R16, whereas the hydrophobicity of the C1 substituent was
reported to be important but not essential for activation of hTAS2R16. As the glucosylated
glucopyranosides, we speculated
. Under the conditions used by us, we did not
find activation of hTAS2R16 by isoflavone glucosides. It cannot be excluded that higher
ion, but such high concentrations are not expected in
most soy products. More likely, the aglycone part of the isoflavone glucosides did not
It was surprising to identify
values of hTAS2R14 and hTAS2R39. The
(13, 18, 32) (see
). Of these agonists, four are flavonoids and therewith structurally similar to
isoflavonoids. The other 13 agonists belong to different chemical classes, and they are
urally very different form isoflavonoids. Six of the 17 known agonists are regularly
consumed in our diet as tea catechins, vitamin B1 and quinine in bitter tonic. In our study,
Glyein,
. Most of the new agonists are dietary compounds. In
conclusion, it can be expected that hTAS2R39 plays a key role in the detection of dietary
glucopyranosides with a hydrophobic group attached to C1
-configuration of the
t C4 of the pyranose were
crucial for activation of hTAS2R16, whereas the hydrophobicity of the C1 substituent was
reported to be important but not essential for activation of hTAS2R16. As the glucosylated
glucopyranosides, we speculated
. Under the conditions used by us, we did not
find activation of hTAS2R16 by isoflavone glucosides. It cannot be excluded that higher
ion, but such high concentrations are not expected in
most soy products. More likely, the aglycone part of the isoflavone glucosides did not
It was surprising to identify
values of hTAS2R14 and hTAS2R39. The
(see
). Of these agonists, four are flavonoids and therewith structurally similar to
isoflavonoids. The other 13 agonists belong to different chemical classes, and they are
urally very different form isoflavonoids. Six of the 17 known agonists are regularly
consumed in our diet as tea catechins, vitamin B1 and quinine in bitter tonic. In our study,
, Ge,
. Most of the new agonists are dietary compounds. In
conclusion, it can be expected that hTAS2R39 plays a key role in the detection of dietary
glucopyranosides with a hydrophobic group attached to C1
configuration of the
t C4 of the pyranose were
crucial for activation of hTAS2R16, whereas the hydrophobicity of the C1 substituent was
reported to be important but not essential for activation of hTAS2R16. As the glucosylated
glucopyranosides, we speculated
. Under the conditions used by us, we did not
find activation of hTAS2R16 by isoflavone glucosides. It cannot be excluded that higher
ion, but such high concentrations are not expected in
most soy products. More likely, the aglycone part of the isoflavone glucosides did not
It was surprising to identify
values of hTAS2R14 and hTAS2R39. The
(see Supporting
). Of these agonists, four are flavonoids and therewith structurally similar to
isoflavonoids. The other 13 agonists belong to different chemical classes, and they are
urally very different form isoflavonoids. Six of the 17 known agonists are regularly
consumed in our diet as tea catechins, vitamin B1 and quinine in bitter tonic. In our study,
, Gly
. Most of the new agonists are dietary compounds. In
conclusion, it can be expected that hTAS2R39 plays a key role in the detection of dietary
glucopyranosides with a hydrophobic group attached to C1
configuration of the
t C4 of the pyranose were
crucial for activation of hTAS2R16, whereas the hydrophobicity of the C1 substituent was
reported to be important but not essential for activation of hTAS2R16. As the glucosylated
glucopyranosides, we speculated
. Under the conditions used by us, we did not
find activation of hTAS2R16 by isoflavone glucosides. It cannot be excluded that higher
ion, but such high concentrations are not expected in
most soy products. More likely, the aglycone part of the isoflavone glucosides did not
It was surprising to identify
values of hTAS2R14 and hTAS2R39. The
Supporting
). Of these agonists, four are flavonoids and therewith structurally similar to
isoflavonoids. The other 13 agonists belong to different chemical classes, and they are
urally very different form isoflavonoids. Six of the 17 known agonists are regularly
consumed in our diet as tea catechins, vitamin B1 and quinine in bitter tonic. In our study,
Gly, AGe
. Most of the new agonists are dietary compounds. In
conclusion, it can be expected that hTAS2R39 plays a key role in the detection of dietary
glucopyranosides with a hydrophobic group attached to C1
configuration of the
t C4 of the pyranose were
crucial for activation of hTAS2R16, whereas the hydrophobicity of the C1 substituent was
reported to be important but not essential for activation of hTAS2R16. As the glucosylated
glucopyranosides, we speculated
. Under the conditions used by us, we did not
find activation of hTAS2R16 by isoflavone glucosides. It cannot be excluded that higher
ion, but such high concentrations are not expected in
most soy products. More likely, the aglycone part of the isoflavone glucosides did not
It was surprising to identify
values of hTAS2R14 and hTAS2R39. The
Supporting
). Of these agonists, four are flavonoids and therewith structurally similar to
isoflavonoids. The other 13 agonists belong to different chemical classes, and they are
urally very different form isoflavonoids. Six of the 17 known agonists are regularly
consumed in our diet as tea catechins, vitamin B1 and quinine in bitter tonic. In our study,
AGe
. Most of the new agonists are dietary compounds. In
conclusion, it can be expected that hTAS2R39 plays a key role in the detection of dietary
glucopyranosides with a hydrophobic group attached to C1
configuration of the
t C4 of the pyranose were
crucial for activation of hTAS2R16, whereas the hydrophobicity of the C1 substituent was
reported to be important but not essential for activation of hTAS2R16. As the glucosylated
glucopyranosides, we speculated
. Under the conditions used by us, we did not
find activation of hTAS2R16 by isoflavone glucosides. It cannot be excluded that higher
ion, but such high concentrations are not expected in
most soy products. More likely, the aglycone part of the isoflavone glucosides did not
It was surprising to identify
values of hTAS2R14 and hTAS2R39. The
Supporting
). Of these agonists, four are flavonoids and therewith structurally similar to
isoflavonoids. The other 13 agonists belong to different chemical classes, and they are
urally very different form isoflavonoids. Six of the 17 known agonists are regularly
consumed in our diet as tea catechins, vitamin B1 and quinine in bitter tonic. In our study,
AGe,
. Most of the new agonists are dietary compounds. In
conclusion, it can be expected that hTAS2R39 plays a key role in the detection of dietary
glucopyranosides with a hydrophobic group attached to C1
configuration of the
t C4 of the pyranose were
crucial for activation of hTAS2R16, whereas the hydrophobicity of the C1 substituent was
reported to be important but not essential for activation of hTAS2R16. As the glucosylated
glucopyranosides, we speculated
. Under the conditions used by us, we did not
find activation of hTAS2R16 by isoflavone glucosides. It cannot be excluded that higher
ion, but such high concentrations are not expected in
most soy products. More likely, the aglycone part of the isoflavone glucosides did not
It was surprising to identify
Soy isoflavones activate hTAS2R14 and -39
49
Relevance for sensory perception
Okubo et al. (9) described the threshold values for bitterness and astringency together to be
in nM to µM range (10-6 M to 10-7 M for genistein, 5x 10⁻⁷ M to 5x 10⁻⁸ M for daidzein).
Kudou et al. (10) determined threshold values for undesirable taste and determined 10-5 M
for genistein and 10-6 M for daidzein, and 10-5 M for the three glucoside forms of genistin.
Another study (8) investigated daidzein and genistein regarding bitterness alone, but
applied them in starch solutions. Reported bitter threshold values (4x 10⁻³ M for genistein,
2.9x 10⁻³ M for daidzein) are in the mM range, whereas the bitter receptor threshold values
determined in our study are in µM range. This observation is in line with the investigations
of Intelmann et al. (15) comparing results of taste receptor assays with those of human
psychophysical experiments. From that study, it was concluded that the difference between
receptor threshold values (low) and sensory threshold values (higher) was caused by
interaction of bitter compounds with the oral mucosa. It is remarkable that the results from
sensory studies on soy isoflavones differ so much. This might have been caused by genetic
variation of sensory panelists. Different SNPs in hTAS2R genes might lead to differences
in the perception of soy products. In our study, screening for agonists was done with
hTAS2Rs which contained the most frequently occurring SNPs, and the taster haplotype
PAV of hTAS2R38. The receptors hTAS2R14 and hTAS2R39, identified for soy
isoflavones in our study, contained the SNPs which occur with a frequency of 99 % (GPCR
Natural Variance database http://nava.liacs.nl (33)). Therefore we assume that the various
outcomes of the sensory studies described above were more likely caused by different
experimental setups and the fact that subjects can perform differently, than by genetic
variation. Besides interaction of bitter tastants with oral mucosa, also changes in salivary
flow and composition (34), adaptational states and hormone levels can cause variable taste
responses (35). With the bitter receptor activation assay, we have now measured the
intrinsic bitterness of a number of (dietary) isoflavonoids, in which the actual taste
characteristic is uncoupled from the other influences mentioned above. Confirmation of the
bitterness of newly identified bitter receptor agonists in a sensory study remains to be
established.
The concentrations of isoflavones in soy foods can be variable. For example, the
concentration of genistein reported by Prabhakaran (36) varied between 0.4 and 14.3 µg/g
in soy milk and 2.4 and 60.4 µg/g in tofu. This is approximately 2 to 225 µM, which is
exceeding the bitterness threshold values determined. Despite its low concentrations in
relation to other soy isoflavonoids, the presence of genistein can have a significant impact
on the bitter taste of soy food. During processing, malonyl forms decrease drastically in
concentration, whereas the amount of the other three forms increases (37-39). Malonyl
forms might therefore be less important for the perception of the final products. Acetyl
forms are generated during dry heating, so they occur in a subset of soy products, only.
Their concentration in common soy products ranges from 0 to 110 µg/g (soy milk (40) and
2
Chapter 2
50
fried tofu (41), respectively), which is approximately 0 to 250 µM. Therewith, depending
on the soy product, it is below or just above the determined threshold values on hTAS2R39
and will probably not lead to strong bitter perception. The concentration of genistin in soy
products is between 23 µg/g (soy milk (40)) and 562 µg/g (tofu, (41)), which is
approximately 50 µM to 1.3 mM, so it can be above the threshold values determined for
hTAS2R39. In soy products, the bitter taste of isoflavones might be masked by other
constituents present in the product.
Irrespective the amounts of isoflavones in different soy products, most of the
investigated isoflavonoids belonged to the high threshold group III. From a nutritional
perspective, this is probably advantageous, as strong bitterness would prevent consumption
of soy products which can provide multiple health benefits. Today’s attempts to make
healthier food include the incorporation of more bioactive isoflavonoids as ingredients. For
example equol, which is originally an intestinal metabolite formed from daidzein, and now
considered as neutraceutical, is more estrogenic than its precursor (26). Also coumestrol,
which is formed from daidzein by combined malting by a food-grade fungus, is more
estrogenic than its precursor (42). The results of our study show that equol and coumestrol
are intrinsically more bitter than most of the common soybean isoflavones, indicating that
their sensory impact should be considered when formulating food products enriched in
these compounds.
ACKNOWLDGEMENTS
We thank Dr. Michiel Gribnau (Unilever Vlaardingen, the Netherlands) for statistical
analysis and Dr. Erwin Tareilus (Unilever Vlaardingen, the Netherlands) for critical reading
of the manuscript. This work was financially supported by the Food & Nutrition Delta of
the Ministry of Economic Affairs, the Netherlands (FND 08019).
REFERENCES
1. Mc Cue, P.; Shetty, K. Health benefits of soy isoflavonoids and strategies for enhancement: A
review. Critical Reviews in Food Science and Nutrition 2004, 44 (5), 361-367.
2. Mc Cue, P. P.; Shetty, K. Phenolic antioxidant mobilization during yogurt production from soymilk
using Kefir cultures. Process Biochemistry 2005, 40 (5), 1791-1797.
3. Wang, H. J.; Murphy, P. A. Isoflavone content in commercial soybean foods. Journal of
Agricultural and Food Chemistry 1994, 42 (8), 1666-1673.
4. Tsai, H. S.; Huang, L. J.; Lai, Y. H.; Chang, J. C.; Lee, R. S.; Chiou, R. Y. Y. Solvent effects on
extraction and HPLC analysis of soybean isoflavones and variations of isoflavone
compositions as affected by crop season. Journal of Agricultural and Food Chemistry 2007,
55 (19), 7712-7715.
Soy isoflavones activate hTAS2R14 and -39
51
5. Murphy, P. A.; Barua, K.; Hauck, C. C. Solvent extraction selection in the determination of
isoflavones in soy foods. Journal of Chromatography B: Analytical Technologies in the
Biomedical and Life Sciences 2002, 777 (1-2), 129-138.
6. Coward, L.; Smith, M.; Kirk, M.; Barnes, S. Chemical modification of isoflavones in soyfoods
during cooking and processing. American Journal of Clinical Nutrition 1998, 68 (6 SUPPL.),
1486S-1491S.
7. Aldin, E.; Reitmeier, C. A.; Murphy, P. Bitterness of soy extracts containing isoflavones and
saponins. Journal of Food Science 2006, 71 (3), S211-S215.
8. Robinson, K. M.; Klein, B. P.; Lee, S. Y. Utilizing the R-index measure for threshold testing in
model soy isoflavone solutions. Journal of Food Science 2004, 69 (1), S1-S4.
9. Okubo, K.; Iijima, M.; Kobayashi, Y.; Yoshokoshi, M.; Uchida, T.; Kudou, S. Components
responsible for the undesirable taste of soybean seeds. Bioscience, Biotechnology, and
Biochemistry 1992, 56 (1), 99-103.
10. Kudou, S.; Fleury, Y.; Welti, D.; Magnolato, D.; Kitamura, K.; Okubo, K. Malonyl isoflavone
glycosides in soybean seeds (Glycine max MERRILL). Agricultural and Biological Chemistry
1991, 55 (9), 2227-2233.
11. Drewnowski, A.; Gomez-Carneros, C. Bitter taste, phytonutrients, and the consumer: A review.
American Journal of Clinical Nutrition 2000, 72 (6), 1424-1435.
12. Adler, E.; Hoon, M. A.; Mueller, K. L.; Chandrashekar, J.; Ryba, N. J. P.; Zuker, C. S. A novel
family of mammalian taste receptors. Cell 2000, 100 (6), 693-702.
13. Meyerhof, W.; Batram, C.; Kuhn, C.; Brockhoff, A.; Chudoba, E.; Bufe, B.; Appendino, G.;
Behrens, M. The molecular receptive ranges of human TAS2R bitter taste receptors. Chemical
Senses 2010, 35 (2), 157-170.
14. Hayes, J. E.; Wallace, M. R.; Knopik, V. S.; Herbstman, D. M.; Bartoshuk, L. M.; Duffy, V. B.
Allelic variation in TAS2R bitter receptor genes associates with variation in sensations from
and ingestive behaviors toward common bitter beverages in adults. Chemical Senses 2011, 36
(3), 311-319.
15. Intelmann, D.; Batram, C.; Kuhn, C.; Haseleu, G.; Meyerhof, W.; Hofmann, T. Three TAS2R
bitter taste receptors mediate the psychophysical responses to bitter compounds of hops
(Humulus lupulus L.) and beer. Chemosensory Perception 2009, 2 (3), 118-132.
16. Brockhoff, A.; Behrens, M.; Massarotti, A.; Appending, G.; Meyerhof, W. Broad tuning of the
human bitter taste receptor hTAS2R46 to various sesquiterpene lactones, clerodane and
labdane diterpenoids, strychnine, and denatonium. Journal of Agricultural and Food
Chemistry 2007, 55 (15), 6236-6243.
17. Sandell, M. A.; Breslin, P. A. S. Variability in a taste-receptor gene determines whether we taste
toxins in food. Current Biology 2006, 16 (18), R792-R794.
18. Narukawa, M.; Noga, C.; Ueno, Y.; Sato, T.; Misaka, T.; Watanabe, T. Evaluation of the
bitterness of green tea catechins by a cell-based assay with the human bitter taste receptor
hTAS2R39. Biochemical and Biophysical Research Communications 2011, 405 (4), 620-625.
19. Kuhn, C.; Bufe, B.; Winnig, M.; Hofmann, T.; Frank, O.; Behrens, M.; Lewtschenko, T.; Slack, J.
P.; Ward, C. D.; Meyerhof, W. Bitter taste receptors for saccharin and acesulfame K. Journal
of Neuroscience 2004, 24 (45), 10260-10265.
20. Ueda, T.; Ugawa, S.; Yamamura, H.; Imaizumi, Y.; Shimada, S. Functional interaction between
T2R taste receptors and G-protein a subunits expressed in taste receptor cells. Journal of
Neuroscience 2003, 23 (19), 7376-7380.
2
Chapter 2
52
21. Behrens, M.; Brockhoff, A.; Kuhn, C.; Bufe, B.; Winnig, M.; Meyerhof, W. The human taste
receptor hTAS2R14 responds to a variety of different bitter compounds. Biochemical and
Biophysical Research Communications 2004, 319 (2), 479-485.
22. Chandrashekar, J.; Mueller, K. L.; Hoon, M. A.; Adler, E.; Feng, L.; Guo, W.; Zuker, C. S.; Ryba,
N. J. P. T2Rs function as bitter taste receptors. Cell 2000, 100 (6), 703-711.
23. Le Neve, B.; Foltz, M.; Daniel, H.; Gouka, R. The steroid glycoside H.g.-12 from Hoodia
gordonii activates the human bitter receptor TAS2R14 and induces CCK release from HuTu-
80 cells. American Journal of Physiology-Gastrointestinal and Liver Physiology 2010, 299
(6), G1368-G1375.
24. Kim, U. K.; Jorgenson, E.; Coon, H.; Leppert, M.; Risch, N.; Drayna, D. Positional cloning of the
human quantitative trait locus underlying taste sensitivity to phenylthiocarbamide. Science
2003, 299 (5610), 1221-1225.
25. Mazur, W. M.; Duke, J. A.; Wähälä, K.; Rasku, S.; Adlercreutz, H. Isoflavonoids and Lignans in
Legumes: Nutritional and Health Aspects in Humans. The Journal of Nutritional
Biochemistry 1998, 9 (4), 193-200.
26. Setchell, K. D. R.; Zhao, X.; Shoaf, S. E.; Ragland, K. The pharmacokinetics of S-(-)equol
administered as SE5-OH tablets to healthy postmenopausal women. Journal of Nutrition
2009, 139 (11), 2037-2043.
27. Bufe, B.; Hofmann, T.; Krautwurst, D.; Raguse, J. D.; Meyerhof, W. The human TAS2R16
receptor mediates bitter taste in response to beta-glucopyranosides. Nature Genetics 2002, 32
(3), 397-401.
28. Greene, T. A.; Alarcon, S.; Thomas, A.; Berdougo, E.; Doranz, B. J.; Breslin, P. A. S.; Rucker, J.
B. Probenecid inhibits the human bitter taste receptor TAS2R16 and suppresses bitter
perception of salicin. PLoS ONE 2011, 6 (5), e20123.
29. Merritt, J. E.; McCarthy, S. A.; Davies, M. P. A.; Moores, K. E. Use of fluo-3 to measure
cytosolic Ca2+ in platelets and neutrophils. Loading cells with the dye, calibration of traces,
measurements in the presence of plasma, and buffering of cytosolic Ca2+. Biochemical
Journal 1990, 269 (2), 513-519.
30. Bufe, B. Identifizierung und Charakterisierung von Bitterrezeptoren. Ph.D. thesis. University of
Potsdam, Potsdam, Germany, 2003.
31. Behrens, M.; Foerster, S.; Staehler, F.; Raguse, J. D.; Meyerhof, W. Gustatory expression pattern
of the human TAS2R bitter receptor gene family reveals a heterogenous population of bitter
responsive taste receptor cells. Journal of Neuroscience 2007, 27 (46), 12630-12640.
32. Ueno, Y.; Sakurai, T.; Okada, S.; Abe, K.; Misaka, T. Human bitter taste receptors hTAS2R8 and
hTAS2R39 with differential functions to recognize bitter peptides. Bioscience, Biotechnology
and Biochemistry 2011, 75 (6), 1188-1190.
33. Kazius, J.; Wurdinger, K.; Van Iterson, M.; Kok, J.; Bäck, T.; Ijzerman, A. P. GPCR NaVa
database: Natural variants in human G protein-coupled receptors. Human Mutation 2008, 29
(1), 39-44.
34. Peleg, H.; Gacon, K.; Schlich, P.; Noble, A. C. Bitterness and astringency of flavan-3-ol
monomers, dimers and trimers. Journal of the Science of Food and Agriculture 1999, 79 (8),
1123-1128.
35. Breslin, P. A. S. Human gustation and flavour. Flavour and Fragrance Journal 2001, 16 (6), 439-
456.
Soy isoflavones activate hTAS2R14 and -39
53
36. Prabhakaran, M. P. Isoflavone levels and the effect of processing on the content of isoflavones
during the preparation of soymilk and tofu. Ph.D. thesis. Department of Chemistry, National
University of Singapore, Singapore, 2005.
37. Coward, L.; Barnes, N. C.; Setchell, K. D. R.; Barnes, S. Genistein, daidzein, and their beta-
glycoside conjugates - Antitumor isoflavones in soybean foods from American and Asian
diets. Journal of Agricultural and Food Chemistry 1993, 41 (11), 1961-1967.
38. Wang, H. J.; Murphy, P. A. Mass balance study of isoflavones during soybean processing.
Journal of Agricultural and Food Chemistry 1996, 44 (8), 2377-2383.
39. Chien, J. T.; Hsieh, H. C.; Kao, T. H.; Chen, B. H. Kinetic model for studying the conversion and
degradation of isoflavones during heating. Food Chemistry 2005, 91 (3), 425-434.
40. Murphy, P. A.; Song, T.; Buseman, G.; Barua, K.; Beecher, G. R.; Trainer, D.; Holden, J.
Isoflavones in retail and institutional soy foods. Journal of Agricultural and Food Chemistry
1999, 47 (7), 2697-2704.
41. Song, T.; Barua, K.; Buseman, G.; Murphy, P. A. Soy isoflavone analysis: Quality control and a
new internal standard. American Journal of Clinical Nutrition 1998, 68 (6 SUPPL.), 1474S-
1479S.
42. Simons, R.; Vincken, J. P.; Roidos, N.; Bovee, T. F. H.; van Iersel, M.; Verbruggen, M. A.;
Gruppen, H. Increasing soy isoflavonoid content and diversity by simultaneous malting and
challenging by a fungus to modulate estrogenicity. Journal of Agricultural and Food
Chemistry 2011, 59 (12), 6748-6758.
2
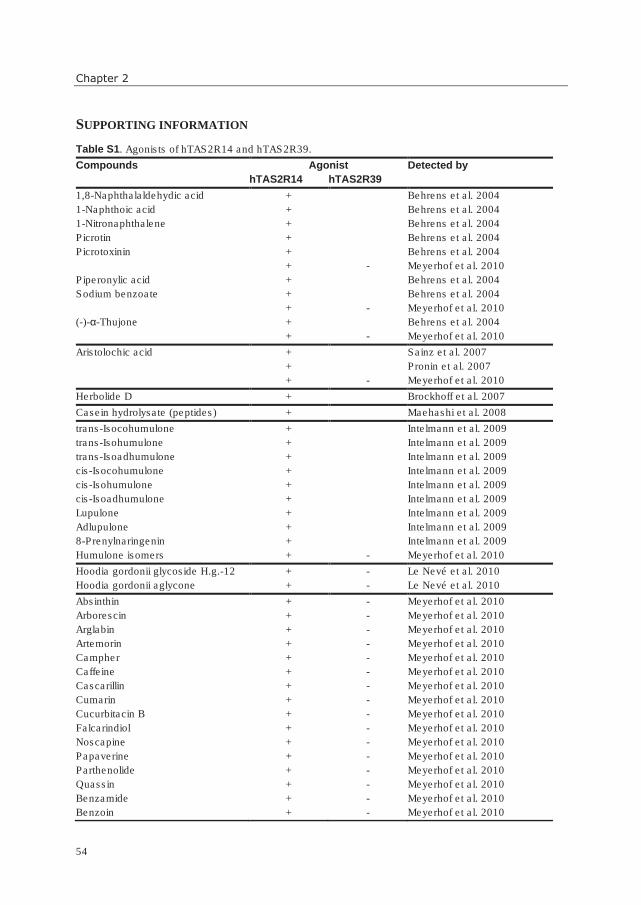
Chapter 2
54
SUPPORTING INFORMATION
Table S1. Agonists of hTAS2R14 and hTAS2R39.
Compounds Agonist Detected by
hTAS2R14 hTAS2R39
1,8-Naphthalaldehydic acid + Behrens et al. 2004
1-Naphthoic acid + Behrens et al. 2004
1-Nitronaphthalene + Behrens et al. 2004
Picrotin + Behrens et al. 2004
Picrotoxinin +
+
-
Behrens et al. 2004
Meyerhof et al. 2010
Piperonylic acid + Behrens et al. 2004
Sodium benzoate +
+
-
Behrens et al. 2004
Meyerhof et al. 2010
(-)-α-Thujone +
+
-
Behrens et al. 2004
Meyerhof et al. 2010
Aristolochic acid +
+
+
-
Sainz et al. 2007
Pronin et al. 2007
Meyerhof et al. 2010
Herbolide D + Brockhoff et al. 2007
Casein hydrolysate (peptides) + Maehashi et al. 2008
trans-Isocohumulone + Intelmann et al. 2009
trans-Isohumulone + Intelmann et al. 2009
trans-Isoadhumulone + Intelmann et al. 2009
cis-Isocohumulone + Intelmann et al. 2009
cis-Isohumulone + Intelmann et al. 2009
cis-Isoadhumulone + Intelmann et al. 2009
Lupulone + Intelmann et al. 2009
Adlupulone + Intelmann et al. 2009
8-Prenylnaringenin + Intelmann et al. 2009
Humulone isomers + - Meyerhof et al. 2010
Hoodia gordonii glycoside H.g.-12 + - Le Nevé et al. 2010
Hoodia gordonii aglycone + - Le Nevé et al. 2010
Absinthin + - Meyerhof et al. 2010
Arborescin + - Meyerhof et al. 2010
Arglabin + - Meyerhof et al. 2010
Artemorin + - Meyerhof et al. 2010
Campher + - Meyerhof et al. 2010
Caffeine + - Meyerhof et al. 2010
Cascarillin + - Meyerhof et al. 2010
Cumarin + - Meyerhof et al. 2010
Cucurbitacin B + - Meyerhof et al. 2010
Falcarindiol + - Meyerhof et al. 2010
Noscapine + - Meyerhof et al. 2010
Papaverine + - Meyerhof et al. 2010
Parthenolide + - Meyerhof et al. 2010
Quassin + - Meyerhof et al. 2010
Benzamide + - Meyerhof et al. 2010
Benzoin + - Meyerhof et al. 2010
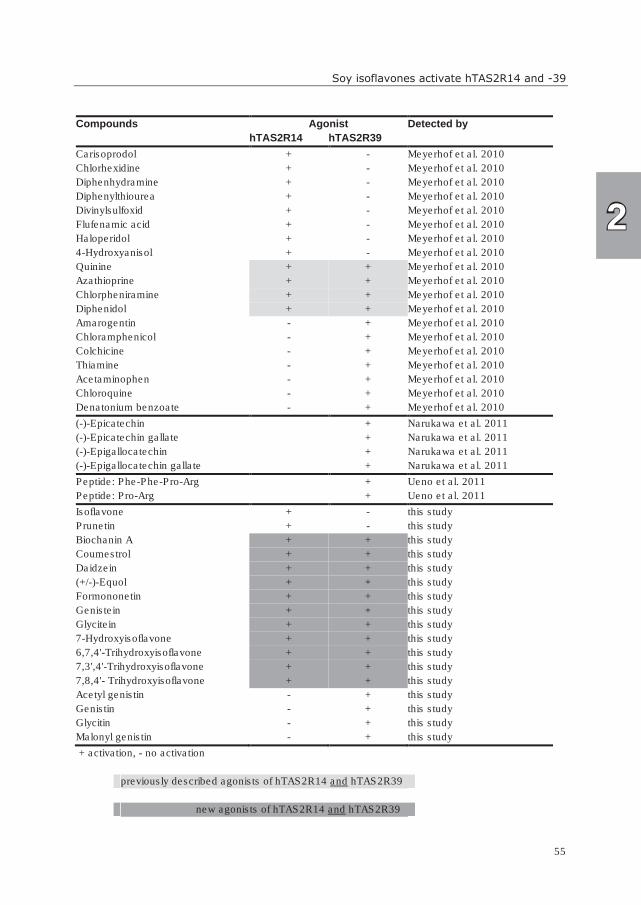
Soy isoflavones activate hTAS2R14 and -39
55
Compounds Agonist Detected by
hTAS2R14 hTAS2R39
Carisoprodol + - Meyerhof et al. 2010
Chlorhexidine + - Meyerhof et al. 2010
Diphenhydramine + - Meyerhof et al. 2010
Diphenylthiourea + - Meyerhof et al. 2010
Divinylsulfoxid + - Meyerhof et al. 2010
Flufenamic acid + - Meyerhof et al. 2010
Haloperidol + - Meyerhof et al. 2010
4-Hydroxyanisol + - Meyerhof et al. 2010
Quinine + + Meyerhof et al. 2010
Azathioprine + + Meyerhof et al. 2010
Chlorpheniramine + + Meyerhof et al. 2010
Diphenidol + + Meyerhof et al. 2010
Amarogentin - + Meyerhof et al. 2010
Chloramphenicol - + Meyerhof et al. 2010
Colchicine - + Meyerhof et al. 2010
Thiamine - + Meyerhof et al. 2010
Acetaminophen - + Meyerhof et al. 2010
Chloroquine - + Meyerhof et al. 2010
Denatonium benzoate - + Meyerhof et al. 2010
(-)-Epicatechin + Narukawa et al. 2011
(-)-Epicatechin gallate + Narukawa et al. 2011
(-)-Epigallocatechin + Narukawa et al. 2011
(-)-Epigallocatechin gallate + Narukawa et al. 2011
Peptide: Phe-Phe-Pro-Arg + Ueno et al. 2011
Peptide: Pro-Arg + Ueno et al. 2011
Isoflavone + - this study
Prunetin + - this study
Biochanin A + + this study
Coumestrol + + this study
Daidzein + + this study
(+/-)-Equol + + this study
Formononetin + + this study
Genistein + + this study
Glycitein + + this study
7-Hydroxyisoflavone + + this study
6,7,4'-Trihydroxyisoflavone + + this study
7,3',4'-Trihydroxyisoflavone + + this study
7,8,4'- Trihydroxyisoflavone + + this study
Acetyl genistin - + this study
Genistin - + this study
Glycitin - + this study
Malonyl genistin - + this study
+ activation, - no activation
previously described agonists of hTAS2R14 and hTAS2R39
new agonists of hTAS2R14 and hTAS2R39
2
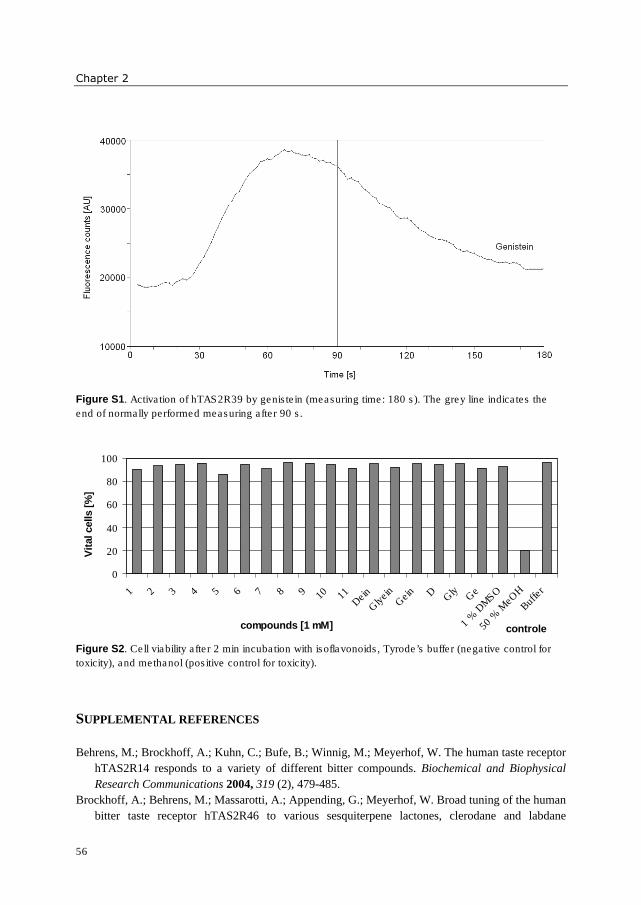
Chapter 2
56
Figure S1. Activation of hTAS2R39 by genistein (measuring time: 180 s). The grey line indicates the
end of normally performed measuring after 90 s.
Figure S2. Cell viability after 2 min incubation with isoflavonoids, Tyrode’s buffer (negative control for
toxicity), and methanol (positive control for toxicity).
SUPPLEMENTAL REFERENCES
Behrens, M.; Brockhoff, A.; Kuhn, C.; Bufe, B.; Winnig, M.; Meyerhof, W. The human taste receptor
hTAS2R14 responds to a variety of different bitter compounds. Biochemical and Biophysical
Research Communications 2004, 319 (2), 479-485.
Brockhoff, A.; Behrens, M.; Massarotti, A.; Appending, G.; Meyerhof, W. Broad tuning of the human
bitter taste receptor hTAS2R46 to various sesquiterpene lactones, clerodane and labdane
compounds [1 mM]
0
20
40
60
80
100
1 2 3 4 5 6 7 8 9 10 11Dein
Glyein
Gein D G
lyG
e
1 %
DM
SO
50 %
MeO
H
Buffe
r
controle
Vit
al cells [
%]

Soy isoflavones activate hTAS2R14 and -39
57
diterpenoids, strychnine, and denatonium. Journal of Agricultural and Food Chemistry 2007, 55
(15), 6236-6243.
Intelmann, D.; Batram, C.; Kuhn, C.; Haseleu, G.; Meyerhof, W.; Hofmann, T. Three TAS2R bitter
taste receptors mediate the psychophysical responses to bitter compounds of hops (Humulus
lupulus L.) and beer. Chemosensory Perception 2009, 2 (3), 118-132.
Le Nevé, B.; Foltz, M.; Daniel, H.; Gouka, R. The steroid glycoside H.g.-12 from Hoodia gordonii
activates the human bitter receptor TAS2R14 and induces CCK release from HuTu-80 cells.
American Journal of Physiology-Gastrointestinal and Liver Physiology 2010, 299 (6), G1368-
G1375.
Maehashi, K.; Matano, M.; Wang, H.; Vo, L. A.; Yamamoto, Y.; Huang, L. Bitter peptides activate
hTAS2Rs, the human bitter receptors. Biochemical and Biophysical Research Communications
2008, 365 (4), 851-855.
Meyerhof, W.; Batram, C.; Kuhn, C.; Brockhoff, A.; Chudoba, E.; Bufe, B.; Appendino, G.; Behrens,
M. The molecular receptive ranges of human TAS2R bitter taste receptors. Chemical Senses
2010, 35 (2), 157-170.
Narukawa, M.; Noga, C.; Ueno, Y.; Sato, T.; Misaka, T.; Watanabe, T. Evaluation of the bitterness of
green tea catechins by a cell-based assay with the human bitter taste receptor hTAS2R39.
Biochemical and Biophysical Research Communications 2011, 405 (4), 620-625.
Pronin, A. N.; Xu, H.; Tang, H.; Zhang, L.; Li, Q.; Li, X. Specific alleles of bitter receptor genes
influence human sensitivity to the bitterness of aloin and saccharin. Current Biology 2007, 17
(16), 1403-1408.
Sainz, E.; Cavenagh, M. M.; Gutierrez, J.; Battey, J. F.; Northup, J. K.; Sullivan, S. L. Functional
characterization of human bitter taste receptors. Biochemical Journal 2007, 403 (3), 537-543.
Ueno, Y.; Sakurai, T.; Okada, S.; Abe, K.; Misaka, T. Human bitter taste receptors hTAS2R8 and
hTAS2R39 with differential functions to recognize bitter peptides. Bioscience, Biotechnology and
Biochemistry 2011, 75 (6), 1188-1190.
2

Chapter 2
58
Chapter 3
Bitter taste receptor activation by
flavonoids and isoflavonoids:
Modeled structural requirements for
activation of hTAS2R14 and hTAS2R39
Based on: Wibke S.U. Roland, Leo van Buren, Harry Gruppen, Marianne Driesse, Robin J.
Gouka, Gerrit Smit, Jean-Paul Vincken. Bitter taste receptor activation by flavonoids and
isoflavonoids: Modeled structural requirements for activation of hTAS2R14 and
hTAS2R39. Journal of Agricultural and Food Chemistry 2013 61 (44), 10454-10466.
3
Chapter 3
60
ABSTRACT
Many flavonoids and isoflavonoids have undesirable bitter taste, which hampers their use
as food bioactives. The aim of this study was to investigate the effect of a large set of
structurally similar (iso)flavonoids on the activation of bitter receptors hTAS2R14 and
hTAS2R39, and to predict their structural requirements to activate these receptors. In total,
68 compounds activated hTAS2R14 and 70 compounds activated hTAS2R39, amongst
which 58 ligands were overlapping. Their activation threshold values varied over a range of
three log units between 0.12 and 500 µM. Ligand-based 2D-fingerprint and 3D-
pharmacophore models were created to detect structure activity relationships. The 2D-
models demonstrated excellent predictive power in identifying bitter (iso)flavonoids and
discrimination from inactive ones. The structural characteristics for an (iso)flavonoid to
activate hTAS2R14 (or hTAS2R39), were determined by 3D-pharmacophore models to be
composed of two (or three) hydrogen bond donor sites, one hydrogen bond acceptor site,
and two aromatic ring structures, of which one had to be hydrophobic. The additional
hydrogen bond donor feature for hTAS2R39 ligands indicated the possible presence of
another complementary acceptor site in the binding pocket, compared to hTAS2R14.
Hydrophobic interaction of the aromatic feature with the binding site might be of higher
importance in hTAS2R14 than in hTAS2R39. Together, this might explain why OH-rich
compounds showed different behavior on the two bitter receptors. The combination of in
vitro data and different in silico methods created a good insight in activation of hTAS2R14
and hTAS2R39 by (iso)flavonoids and provided a powerful tool in prediction of their
potential bitterness. By understanding the “bitter motif”, introduction of bitter taste in
functional foods enriched in (iso)flavonoid bioactives might be avoided.
Structural requirements of (iso)flavonoids for hTAS2R activation
61
INTRODUCTION
Phenolic compounds, such as flavonoids and isoflavonoids, are in the focus of health
research. Isoflavonoids are mainly occurring in legumes, such as soybeans, and have been
associated with prevention of some cancers, cardiovascular disease, menopausal complaints
and osteoporosis (1). Flavonoids occur in many different plants and are widely present in
our diet. Amongst others, they might play a role in the reduced incidence of cancer and
cardiovascular diseases (2, 3). Unfortunately, many (iso)flavonoids have a negative impact
on sensory perception as they can taste bitter (4). The bitter taste of soybean isoflavones has
been described in several sensory studies (5, 6). Recently, we showed that several soybean
isoflavones activated the human bitter taste receptors hTAS2R14 and hTAS2R39 and
partially elucidated the isoflavonoid substitution pattern favorable for activation of both
receptors (7).
Bitter taste receptor hTAS2R14 is known to be activated by a large number of
compounds originating from different chemical classes (7-13). For hTAS2R39 on the other
hand, a rather moderate number of agonists has been reported (7, 9, 14-17) and this receptor
seemed to be less broadly tuned than hTAS2R14 (9). Recently, hTAS2R39 has been
reported to be activated by tea catechins (14), which belong to the group of flavonoids.
There are also numerous flavonoids, which do not traditionally occur in our diet, and
for which the taste is often not known. It is hypothesized that the bitter taste characteristics
can be predicted, once the molecular signatures of (iso)flavonoids for activation of
hTAS2R14 and hTAS2R39 are known. Originating in pharmaceutical science, the concept
of molecular modeling gains importance in food science (18), and might be employed in
facilitating such predictions. A 2D-fingerprint model is based on a binary representation of
a molecule in which each bit indicates the presence or absence of a molecular fragment
(19). A 3D-pharmacophore model operates with a set of features together with their relative
spatial orientation, which relates to a set of chemical features in a molecule. These features
are recognized by amino acid residues in the receptor binding site with complementary
functions, ultimately explaining that molecule’s biological activity (20, 21). Recently, Ley
et al. (22) described a pharmacophore model, which on docking in a hTAS2R10 structural
model allowed identification of a masking agent for the bitter taste of caffeine.
Furthermore, ligand-based pharmacophore modeling has been applied to understand
structure-activity relationships of odors (23), and to explain interactions between flavor
compounds and β-lactoglobulin (24).
The objective of the present study was to study the behavior of flavonoids towards
activation of hTAS2R14 and hTAS2R39. Their activation would indicate that the
compounds tested have a bitter taste. To this end, a large subset of flavonoids, or flavonoid
analogues, was tested, and the threshold and EC50 values of the active compounds were
determined. A second objective was to investigate the chemical space of flavonoids, and
isoflavonoids, in relation to the activation of bitter receptors hTAS2R14 and hTAS2R39.
3
Chapter 3
62
By linking the receptor activation with the compound’s molecular structure, 2D-fingerprint
models and ligand-based 3D-pharmacophore models for each of the two bitter receptors
were established. These models map the structural requirements for ligands with an
isoflavonoid, flavonoid, or similar structure for these two receptors. Altogether, they
distinguish active from inactive (iso)flavonoids and enable predicting bitterness of similar
compounds with unknown taste properties.
MATERIALS AND METHODS
Receptor assays
Materials
Compounds tested were purchased from Indofine Chemical Company (Hillsborough, NJ,
USA), Extrasynthese (Genay, France), Sigma-Aldrich (Steinheim, Germany), Brunschwig
(Amsterdam, The Netherlands), Bioconnect (Huissen, The Netherlands), or WAKO (Neuss,
Germany). The majority of compounds were ≥99% (18 compounds), ≥98% (44
compounds) or ≥97% (15 compounds) pure. Compounds 38 and 71 were ≥96% pure, 22,
39, 43, 45, 50, 51, 59, 70, 78, and 94 were ≥95% pure, 33, 54, 56, 74, 79, 80, and 88 were
≥90% pure, and 37 was ≥85% pure. Each compound was dissolved in DMSO (Sigma-
Aldrich, Steinheim, Germany) to a 100 mM stock concentration. Trypan blue solution (0.4
% w/v) was purchased from Sigma-Aldrich (Steinheim, Germany).
Tyrode’s buffer (140 mM NaCl, 5 mM KCl, 10 mM glucose, 1 mM MgCl2, 1 mM
CaCl2, and 20 mM Hepes, pH 7.4) with 0.5 mM probenecid (Sigma-Aldrich) was used for
dilution of compound-DMSO stock solutions and for calcium imaging assays. All
compounds were tested for autofluorescence and toxic effects on the cells used at a
concentration of 1 mM as described before (7), without observing abnormalities.
In vitro assessment of hTAS2R14 and hTAS2R39 activation by intracellular calcium
release
Activation of bitter taste receptors expressed in HEK293 cells leads to release of
intracellular Ca2+ (25). This was measured using the fluorescent calcium dye Fluo-4-AM
(2.5 µM, Molecular Probes, Eugene, OR, USA) in a FlexStation II 384 or FlexStation III
(Molecular Devices Corporation, Sunnyvale, CA, USA) for 90 s (excitation 485 nm /
emission 520 nm). The expression of hTAS2R14 and hTAS2R39 in HEK293 cells, the
maintenance of the cells, and the measuring procedure were performed as reported earlier
(7).
In total, a set of 97 compounds are described in this study, of which 19 isoflavonoids
were reported in our earlier publication (7), and 78 other compounds were tested
Structural requirements of (iso)flavonoids for hTAS2R activation
63
additionally. Stock solutions of test compounds were prepared in DMSO and diluted to the
appropriate concentration in Tyrode’s buffer, not exceeding a DMSO concentration of 1 %
(v/v). Screening of hTAS2R14 and hTAS2R39 for activation was performed at 500 µM
concentrations of test compounds. In case of activation, test compounds were measured at
concentration ranges up to 1 mM in order to establish dose-response curves. Non-induced
cells, not expressing the bitter receptors, were always measured in parallel to verify
specificity of receptor activation. As positive controls for receptor activation, in each plate
duplicate measurements with epicatechin gallate (14) for hTAS2R39 or with naphthoic acid
(8) (or genistein) for hTAS2R14 were performed. All experiments were conducted in
duplicate on two or more different days. Some compounds were not completely soluble at
high concentrations and, therefore, their real potency might be underestimated.
Calcium assay data processing and statistical analysis
Data processing and statistical analysis were done as reported previously (7). SoftMax Pro
5.4 software (Molecular Devices Corporation) was used to plot the fluorescence signals.
The fluorescence value (∆F/F0), representing receptor activity, was calculated by
subtracting the baseline fluorescence (F0) prior to loading from the maximum fluorescence
(F) after addition of the bitter compounds, divided by the signal of the baseline in order to
normalize background fluorescence (26). Besides the response of induced cells, also the
response of non-induced cells (not expressing the bitter receptor) was measured as negative
control for every compound at every concentration on the same plate. In cases that a non-
specific signal occurred, the respective compound was considered as active when the signal
of the induced cells was significantly higher than that of the negative control cells (P =
0.05). The signal intensity of non-induced cells was taken at the reading point at which the
signal of the induced cells was maximal. Threshold values of the agonists towards receptor
activation were determined as first concentration showing significant difference to the
baseline and to the response of non-induced cells. Differences were considered to be
significant at P<0.05, using a t-test (two sided, non-paired) (SAS 9.2, Sas Institute Inc.,
Cary, NC, USA). Dose-response curves were established as non-linear regression curves
using Graph Pad Prism (version 4 for Windows, Graph Pad Software, San Diego, CA,
USA). The error bars reflect the standard error of the mean (SEM). EC50 values were
calculated for compounds that reached a maximum in the dose-response curve (after
subtraction of the response of non-induced cells, if applicable). For compounds that evoked
high non-specific signals at higher concentrations, only the data for the appropriate
concentrations were shown in the figures.
3
Chapter 3
64
Modeling
2D-fingerprint modeling
2D-modeling was performed using Pipeline Pilot v8.0, (Accelrys, San Diego, CA, USA).
The chemical structures of the 97 compounds tested were derived from the SMILES
(simplified molecular-input line-entry system) notations (supplementary material S1).
Results at the screening concentration of 500 µM were used. Compounds showing
ambiguous results (22 compounds for hTAS2R14; 21 compounds for hTAS2R39) were
excluded. This resulted in 75 and 76 compounds suitable for modeling of receptor
activation of hTAS2R14 and hTAS2R39, respectively. The majority of these compounds
was used for model building (training set), containing both active and inactive compounds,
whereas ~10 % of the structurally most diverse compounds were excluded from model
building for validation purposes (test set).
The optimal fingerprint model was obtained by building numerous models based on
different fingerprint types. This optimization was done with the training set, using the
Bayesian interference method and leave-one-out settings (19, 27). Three-fold cross-
validations were performed to evaluate the models, in which ranking of the best models was
primarily based on the Receiver Operating Characteristic (ROC) scores (see
supplementary material S2-S4). The highest ranking models were further validated by the
test sets, resulting in the final model selection. ECFP-10 and ECFP-8 fingerprint models
were selected for hTAS2R14 and hTAS2R39, respectively. Their ROC scores were close to
1, which indicated excellent accuracy. Extended-Connectivity Fingerprints (ECFP) use
charge and hybridization of the atom (extended (E)) and connectivity (C) and return a list of
fragments present in the molecule (19), of which in this case the maximum diameter of a
fragment was 10 and 8 bond lengths, respectively.
For identification of key molecular features for bitter receptor activation, 20 “good”
(“G”) and 20 “bad” (“B”) fingerprint fragments were calculated for each model. Each of
them has a Bayesian score. If this score is positive, the likelihood that the fragment is a
member of the active subset increases, and vice versa. A selection of four illustrative
fragments is shown in the results section; the full list is specified in the supplementary
material (S5-S9).
3D-pharmacophore modeling
3D-pharmacophore modeling was performed using Discovery Studio v3.1 (Accelrys). In
contrast to 2D-fingerprint modeling, a training set for 3D-pharmacophore modeling is
based on only a few highly active compounds. The selection for pharmacophore training
ligands on bitter receptor activation was based on activation thresholds, as EC50 values
were not available for all (iso)flavonoids. Compounds were categorized by their threshold
values into highly active (threshold ≤32 µM), moderately active (threshold > 32 – 500 µM)
Structural requirements of (iso)flavonoids for hTAS2R activation
65
and inactive compounds (not active up to 500 µM) (Table 2). 24 compounds for
hTAS2R14 and 20 compounds for hTAS2R39 showed ambiguous results or high non-
specific signals and were excluded from modeling. Besides low threshold, the training
ligands had to be diverse in backbone structure and substitution pattern. Seven highly active
compounds were chosen as training ligands for each receptor (Table 1). One of the training
ligands selected for building the hTAS2R39 pharmacophore was an anthocyanidin and
required special attention. Due to the pH dependence of the anthocyanidin structure
(shifting equilibria between flavylium cation structure, quinoid tautomers, hemiketal, and
chalcone) (28, 29), multiple forms were included for modeling.
Training compounds were subjected to internal strain energy minimization and
conformational analysis (maximum number of conformers = 200; generation type: best
quality; energy range = 10 kcal / mol above the calculated global minimum). Using the
hiphop and hiphop refine algorithms of Discovery Studio, the chemical features optimized
for exploring the spatial pharmacophore map of this group of compounds were “hydrogen
bond acceptor”, “hydrogen bond donor”, “hydrophobic aromatic”, “hydrophobic aliphatic”,
and “ring aromatic”. The “hydrophobic aromatic” feature describes an aromatic ring which
is hydrophobic, the spatial orientation of which is irrelevant. The “ring aromatic” feature
describes an aromatic ring which can be hydrophobic or hydrophilic, depending on its
substitutions. Furthermore, the plane of this aromatic ring has a fixed orientation towards
the receptor binding site. The pharmacophore models were trained with qualitative data and
thus the features are not weighed and the relevance of each feature was considered as equal.
The quality of mapping is described by fit values. A feature that maps exactly on the
respective atom has a fit value of 1, and a feature that does not map has a fit value of 0. The
fit values and relative energies of all compounds are summarized in the supplementary
material S1. Mapping is done by rotation and translation of the molecule to optimize the
superimposition of the molecule on the features, meanwhile additionally the torsion angles
are altered whereby the maximal relative energy should not exceed 10 kcal / mol, compared
to its optimal energetic state of 0 kcal / mol.
The pharmacophore protocol created 10 hypotheses for each run. These hypotheses
were analyzed to find the optimal model. Hypotheses were scored based on the confusion
matrix table, ROC plots, rank score, direct hit/partial hit and maximal fit value (additional
information given in supplementary material S10-S14). The optimization involved
variation of features and/or locations to optimize sensitivity and specificity of the structure
based activity prediction.
Pharmacophore building for ligands of hTAS2R14 resulted in a 5-feature
pharmacophore, whereas for ligands of hTAS2R39, it resulted in a 6-feature
pharmacophore. In the case of the model built for hTAS2R14, a ligand had to map all five
features in order to be predicted as active, whereas in the case of the model built for
hTAS2R39, ligands were allowed to map five out of six features, without disqualifying
3
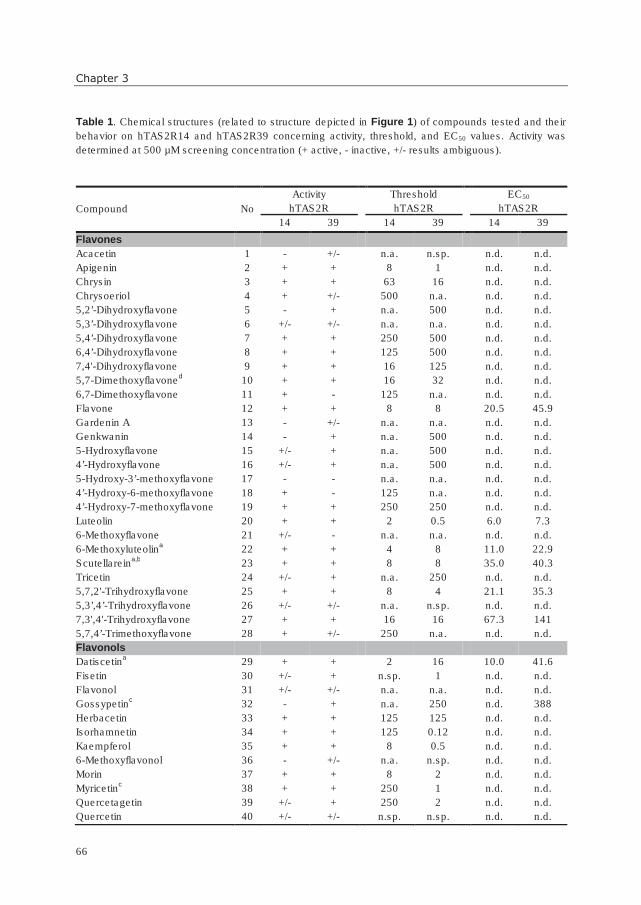
Chapter 3
66
Table 1. Chemical structures (related to structure depicted in Figure 1) of compounds tested and their
behavior on hTAS2R14 and hTAS2R39 concerning activity, threshold, and EC50 values. Activity was
determined at 500 µM screening concentration (+ active, - inactive, +/- results ambiguous).
Compound No
Activity
hTAS2R
Threshold
hTAS2R
EC50
hTAS2R
14 39 14 39 14 39
Flavones
Acacetin 1 - +/- n.a. n.sp. n.d. n.d.
Apigenin 2 + + 8 1 n.d. n.d.
Chrysin 3 + + 63 16 n.d. n.d.
Chrysoeriol 4 + +/- 500 n.a. n.d. n.d.
5,2’-Dihydroxyflavone 5 - + n.a. 500 n.d. n.d.
5,3’-Dihydroxyflavone 6 +/- +/- n.a. n.a. n.d. n.d.
5,4’-Dihydroxyflavone 7 + + 250 500 n.d. n.d.
6,4’-Dihydroxyflavone 8 + + 125 500 n.d. n.d.
7,4'-Dihydroxyflavone 9 + + 16 125 n.d. n.d.
5,7-Dimethoxyflavoned 10 + + 16 32 n.d. n.d.
6,7-Dimethoxyflavone 11 + - 125 n.a. n.d. n.d.
Flavone 12 + + 8 8 20.5 45.9
Gardenin A 13 - +/- n.a. n.a. n.d. n.d.
Genkwanin 14 - + n.a. 500 n.d. n.d.
5-Hydroxyflavone 15 +/- + n.a. 500 n.d. n.d.
4’-Hydroxyflavone 16 +/- + n.a. 500 n.d. n.d.
5-Hydroxy-3’-methoxyflavone 17 - - n.a. n.a. n.d. n.d.
4’-Hydroxy-6-methoxyflavone 18 + - 125 n.a. n.d. n.d.
4’-Hydroxy-7-methoxyflavone 19 + + 250 250 n.d. n.d.
Luteolin 20 + + 2 0.5 6.0 7.3
6-Methoxyflavone 21 +/- - n.a. n.a. n.d. n.d.
6-Methoxyluteolina 22 + + 4 8 11.0 22.9
Scutellareina,b
23 + + 8 8 35.0 40.3
Tricetin 24 +/- + n.a. 250 n.d. n.d.
5,7,2'-Trihydroxyflavone 25 + + 8 4 21.1 35.3
5,3’,4’-Trihydroxyflavone 26 +/- +/- n.a. n.sp. n.d. n.d.
7,3',4'-Trihydroxyflavone 27 + + 16 16 67.3 141
5,7,4’-Trimethoxyflavone 28 + +/- 250 n.a. n.d. n.d.
Flavonols
Datiscetina 29 + + 2 16 10.0 41.6
Fisetin 30 +/- + n.sp. 1 n.d. n.d.
Flavonol 31 +/- +/- n.a. n.a. n.d. n.d.
Gossypetinc 32 - + n.a. 250 n.d. 388
Herbacetin 33 + + 125 125 n.d. n.d.
Isorhamnetin 34 + + 125 0.12 n.d. n.d.
Kaempferol 35 + + 8 0.5 n.d. n.d.
6-Methoxyflavonol 36 - +/- n.a. n.sp. n.d. n.d.
Morin 37 + + 8 2 n.d. n.d.
Myricetinc 38 + + 250 1 n.d. n.d.
Quercetagetin 39 +/- + 250 2 n.d. n.d.
Quercetin 40 +/- +/- n.sp. n.sp. n.d. n.d.
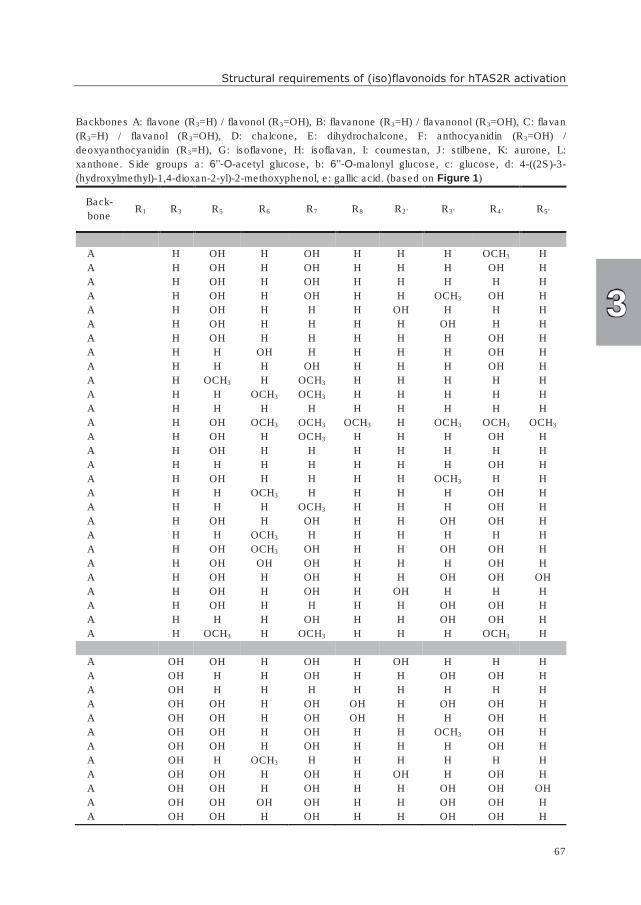
Structural requirements of (iso)flavonoids for hTAS2R activation
67
Backbones A: flavone (R3=H) / flavonol (R3=OH), B: flavanone (R3=H) / flavanonol (R3=OH), C: flavan
(R3=H) / flavanol (R3=OH), D: chalcone, E: dihydrochalcone, F: anthocyanidin (R3=OH) /
deoxyanthocyanidin (R3=H), G: isoflavone, H: isoflavan, I: coumestan, J: stilbene, K: aurone, L:
xanthone. Side groups a: 6’’-O-acetyl glucose, b: 6’’-O-malonyl glucose, c: glucose, d: 4-((2S)-3-
(hydroxylmethyl)-1,4-dioxan-2-yl)-2-methoxyphenol, e: gallic acid. (based on Figure 1)
Back-
bone R1 R3 R5 R6 R7 R8 R2’ R3’ R4’ R5’
A H OH H OH H H H OCH3 H
A H OH H OH H H H OH H
A H OH H OH H H H H H
A H OH H OH H H OCH3 OH H
A H OH H H H OH H H H
A H OH H H H H OH H H
A H OH H H H H H OH H
A H H OH H H H H OH H
A H H H OH H H H OH H
A H OCH3 H OCH3 H H H H H
A H H OCH3 OCH3 H H H H H
A H H H H H H H H H
A H OH OCH3 OCH3 OCH3 H OCH3 OCH3 OCH3
A H OH H OCH3 H H H OH H
A H OH H H H H H H H
A H H H H H H H OH H
A H OH H H H H OCH3 H H
A H H OCH3 H H H H OH H
A H H H OCH3 H H H OH H
A H OH H OH H H OH OH H
A H H OCH3 H H H H H H
A H OH OCH3 OH H H OH OH H
A H OH OH OH H H H OH H
A H OH H OH H H OH OH OH
A H OH H OH H OH H H H
A H OH H H H H OH OH H
A H H H OH H H OH OH H
A H OCH3 H OCH3 H H H OCH3 H
A OH OH H OH H OH H H H
A OH H H OH H H OH OH H
A OH H H H H H H H H
A OH OH H OH OH H OH OH H
A OH OH H OH OH H H OH H
A OH OH H OH H H OCH3 OH H
A OH OH H OH H H H OH H
A OH H OCH3 H H H H H H
A OH OH H OH H OH H OH H
A OH OH H OH H H OH OH OH
A OH OH OH OH H H OH OH H
A OH OH H OH H H OH OH H
3
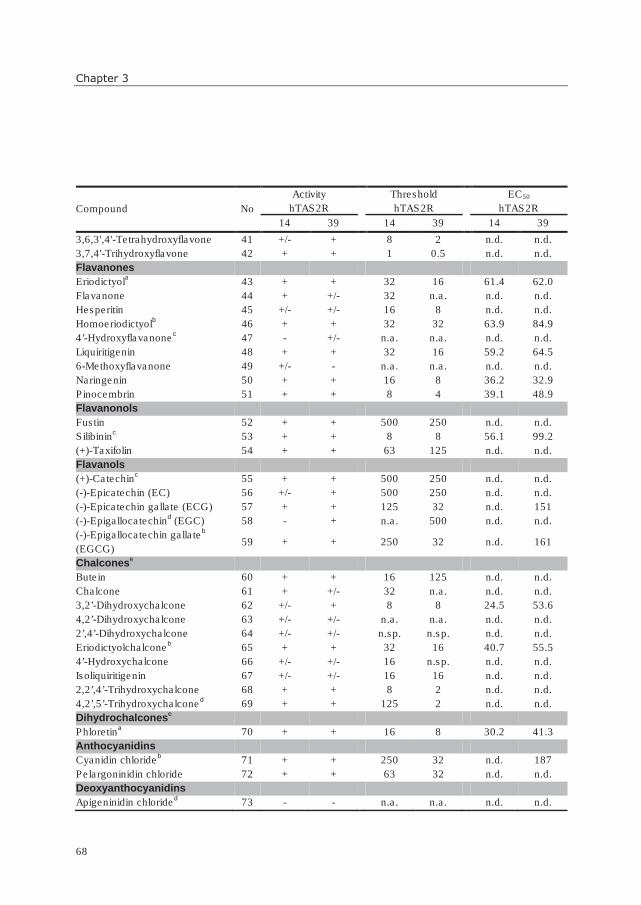
Chapter 3
68
Compound No
Activity
hTAS2R
Threshold
hTAS2R
EC50
hTAS2R
14 39 14 39 14 39
3,6,3',4'-Tetrahydroxyflavone 41 +/- + 8 2 n.d. n.d.
3,7,4'-Trihydroxyflavone 42 + + 1 0.5 n.d. n.d.
Flavanones
Eriodictyola 43 + + 32 16 61.4 62.0
Flavanone 44 + +/- 32 n.a. n.d. n.d.
Hesperitin 45 +/- +/- 16 8 n.d. n.d.
Homoeriodictyolb 46 + + 32 32 63.9 84.9
4’-Hydroxyflavanonec 47 - +/- n.a. n.a. n.d. n.d.
Liquiritigenin 48 + + 32 16 59.2 64.5
6-Methoxyflavanone 49 +/- - n.a. n.a. n.d. n.d.
Naringenin 50 + + 16 8 36.2 32.9
Pinocembrin 51 + + 8 4 39.1 48.9
Flavanonols
Fustin 52 + + 500 250 n.d. n.d.
Silibininc 53 + + 8 8 56.1 99.2
(+)-Taxifolin 54 + + 63 125 n.d. n.d.
Flavanols
(+)-Catechinc 55 + + 500 250 n.d. n.d.
(-)-Epicatechin (EC) 56 +/- + 500 250 n.d. n.d.
(-)-Epicatechin gallate (ECG) 57 + + 125 32 n.d. 151
(-)-Epigallocatechind (EGC) 58 - + n.a. 500 n.d. n.d.
(-)-Epigallocatechin gallateb
(EGCG) 59 + +
250 32
n.d. 161
Chalconese
Butein 60 + + 16 125 n.d. n.d.
Chalcone 61 + +/- 32 n.a. n.d. n.d.
3,2’-Dihydroxychalcone 62 +/- + 8 8 24.5 53.6
4,2’-Dihydroxychalcone 63 +/- +/- n.a. n.a. n.d. n.d.
2’,4’-Dihydroxychalcone 64 +/- +/- n.sp. n.sp. n.d. n.d.
Eriodictyolchalconeb 65 + + 32 16 40.7 55.5
4’-Hydroxychalcone 66 +/- +/- 16 n.sp. n.d. n.d.
Isoliquiritigenin 67 +/- +/- 16 16 n.d. n.d.
2,2’,4’-Trihydroxychalcone 68 + + 8 2 n.d. n.d.
4,2’,5’-Trihydroxychalconed 69 + + 125 2 n.d. n.d.
Dihydrochalconese
Phloretina 70 + + 16 8 30.2 41.3
Anthocyanidins
Cyanidin chlorideb 71 + + 250 32 n.d. 187
Pelargoninidin chloride 72 + + 63 32 n.d. n.d.
Deoxyanthocyanidins
Apigeninidin chlorided 73 - - n.a. n.a. n.d. n.d.
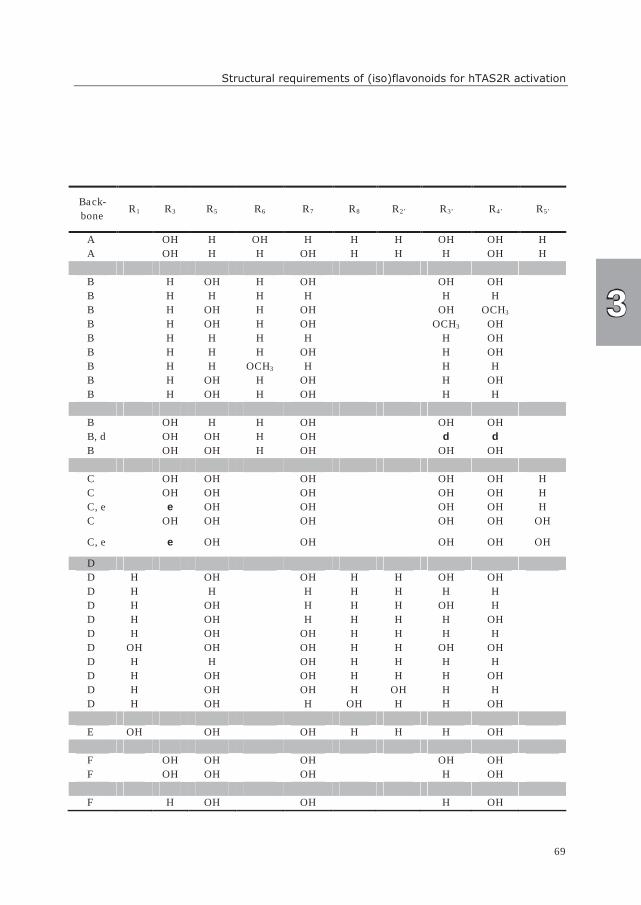
Structural requirements of (iso)flavonoids for hTAS2R activation
69
Back-
bone R1 R3 R5 R6 R7 R8 R2’ R3’ R4’ R5’
A OH H OH H H H OH OH H
A OH H H OH H H H OH H
B H OH H OH OH OH
B H H H H H H
B H OH H OH OH OCH3
B H OH H OH OCH3 OH
B H H H H H OH
B H H H OH H OH
B H H OCH3 H H H
B H OH H OH H OH
B H OH H OH H H
B OH H H OH OH OH
B, d OH OH H OH d d
B OH OH H OH OH OH
C OH OH OH OH OH H
C OH OH OH OH OH H
C, e e OH OH OH OH H
C OH OH OH OH OH OH
C, e e OH OH
OH OH OH
D
D H OH OH H H OH OH
D H H H H H H H
D H OH H H H OH H
D H OH H H H H OH
D H OH OH H H H H
D OH OH OH H H OH OH
D H H OH H H H H
D H OH OH H H H OH
D H OH OH H OH H H
D H OH H OH H H OH
E OH OH OH H H H OH
F OH OH OH OH OH
F OH OH OH H OH
F H OH OH H OH
33
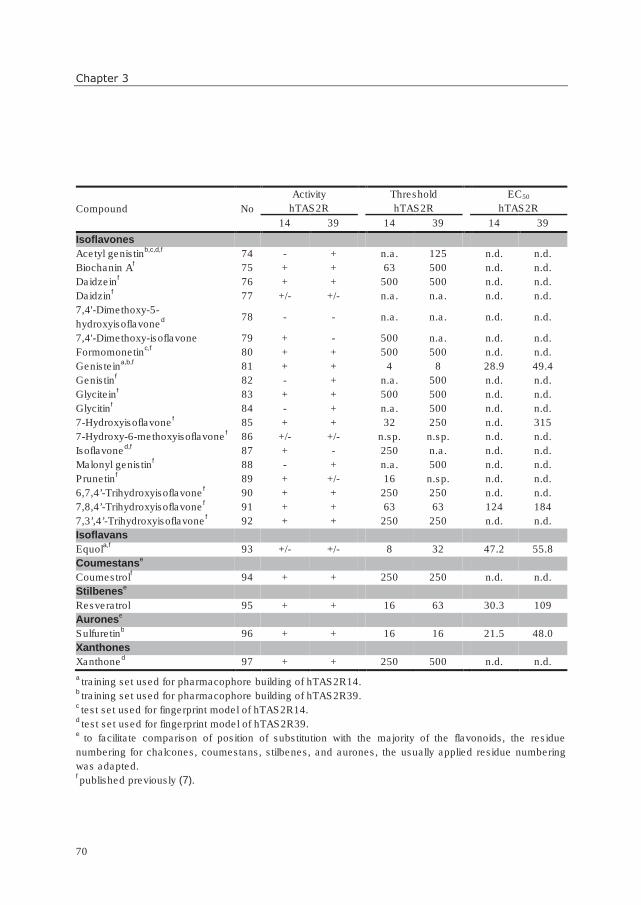
Chapter 3
70
Compound No
Activity
hTAS2R
Threshold
hTAS2R
EC50
hTAS2R
14 39 14 39 14 39
Isoflavones
Acetyl genistinb,c,d,f
74 - + n.a. 125 n.d. n.d.
Biochanin Af 75 + + 63 500 n.d. n.d.
Daidzeinf 76 + + 500 500 n.d. n.d.
Daidzinf 77 +/- +/- n.a. n.a. n.d. n.d.
7,4'-Dimethoxy-5-
hydroxyisoflavoned
78 - -
n.a. n.a.
n.d. n.d.
7,4'-Dimethoxy-isoflavone 79 + - 500 n.a. n.d. n.d.
Formomonetinc,f
80 + + 500 500 n.d. n.d.
Genisteina,b,f
81 + + 4 8 28.9 49.4
Genistinf 82 - + n.a. 500 n.d. n.d.
Glyciteinf 83 + + 500 500 n.d. n.d.
Glycitinf 84 - + n.a. 500 n.d. n.d.
7-Hydroxyisoflavonef 85 + + 32 250 n.d. 315
7-Hydroxy-6-methoxyisoflavonef 86 +/- +/- n.sp. n.sp. n.d. n.d.
Isoflavoned,f
87 + - 250 n.a. n.d. n.d.
Malonyl genistinf 88 - + n.a. 500 n.d. n.d.
Prunetinf 89 + +/- 16 n.sp. n.d. n.d.
6,7,4’-Trihydroxyisoflavonef 90 + + 250 250 n.d. n.d.
7,8,4’-Trihydroxyisoflavonef 91 + + 63 63 124 184
7,3’,4’-Trihydroxyisoflavonef 92 + + 250 250 n.d. n.d.
Isoflavans
Equola,f
93 +/- +/- 8 32 47.2 55.8
Coumestanse
Coumestrolf 94 + + 250 250 n.d. n.d.
Stilbenese
Resveratrol 95 + + 16 63 30.3 109
Auronese
Sulfuretinb 96 + + 16 16 21.5 48.0
Xanthones
Xanthoned 97 + + 250 500 n.d. n.d.
a training set used for pharmacophore building of hTAS2R14.
b training set used for pharmacophore building of hTAS2R39.
c test set used for fingerprint model of hTAS2R14.
d test set used for fingerprint model of hTAS2R39.
e to facilitate comparison of position of substitution with the majority of the flavonoids, the residue
numbering for chalcones, coumestans, stilbenes, and aurones, the usually applied residue numbering
was adapted. f published previously (7).
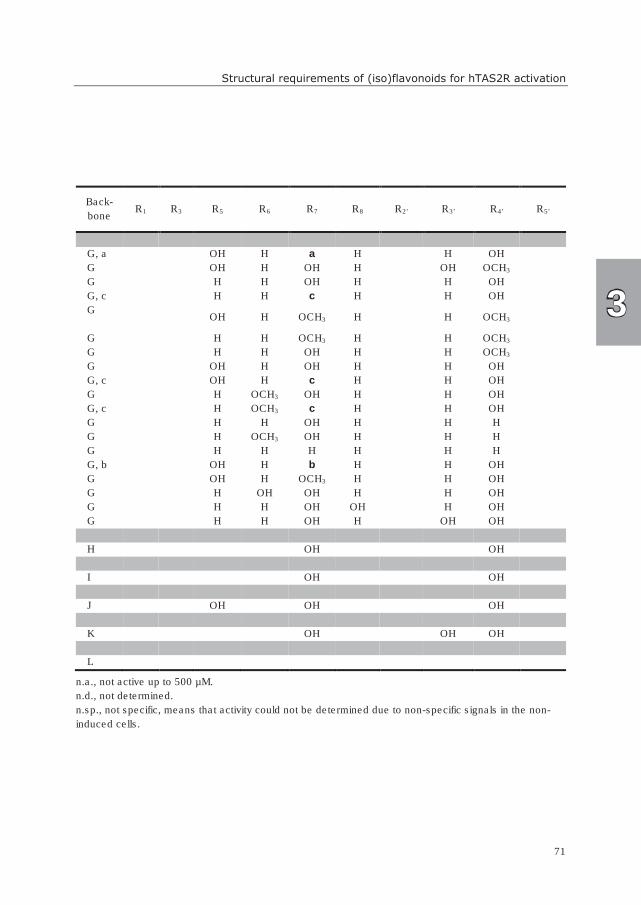
Structural requirements of (iso)flavonoids for hTAS2R activation
71
Back-
bone R1 R3 R5 R6 R7 R8 R2’ R3’ R4’ R5’
G, a OH H a H H OH
G OH H OH H OH OCH3
G H H OH H H OH
G, c H H c H H OH
G
OH H OCH3 H H OCH3
G H H OCH3 H H OCH3
G H H OH H H OCH3
G OH H OH H H OH
G, c OH H c H H OH
G H OCH3 OH H H OH
G, c H OCH3 c H H OH
G H H OH H H H
G H OCH3 OH H H H
G H H H H H H
G, b OH H b H H OH
G OH H OCH3 H H OH
G H OH OH H H OH
G H H OH OH H OH
G H H OH H OH OH
H OH OH
I OH OH
J OH OH OH
K OH OH OH
L
n.a., not active up to 500 µM.
n.d., not determined.
n.sp., not specific, means that activity could not be determined due to non-specific signals in the non-
induced cells.
3
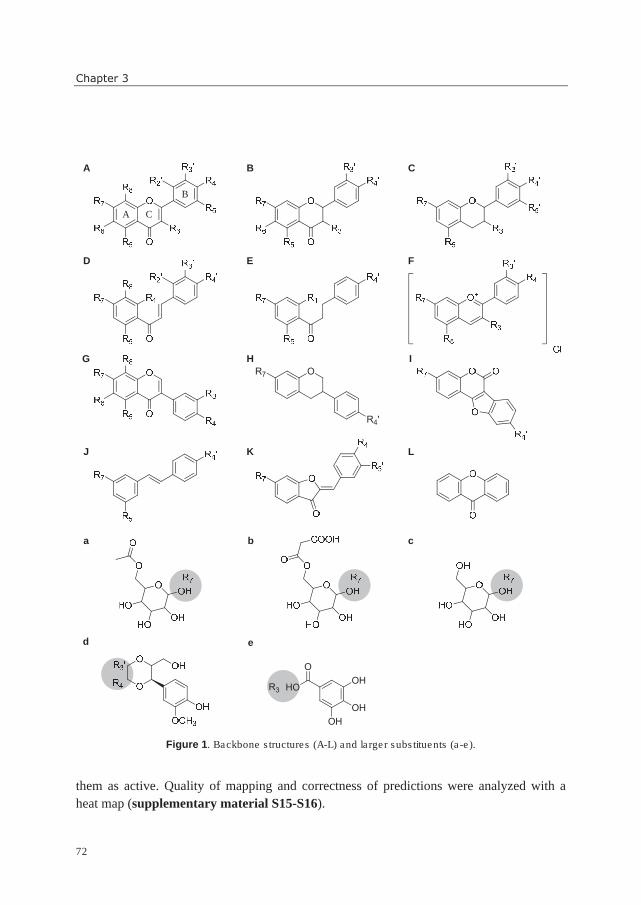
Chapter 3
72
Figure 1. Backbone structures (A-L) and larger substituents (a-e).
them as active. Quality of mapping and correctness of predictions were analyzed with a
heat map (supplementary material S15-S16).
OR7
R4'
A B C
D E F
G H I
J K L
A C
B
a b c
d e
OH
OH
OHHO
O
R3
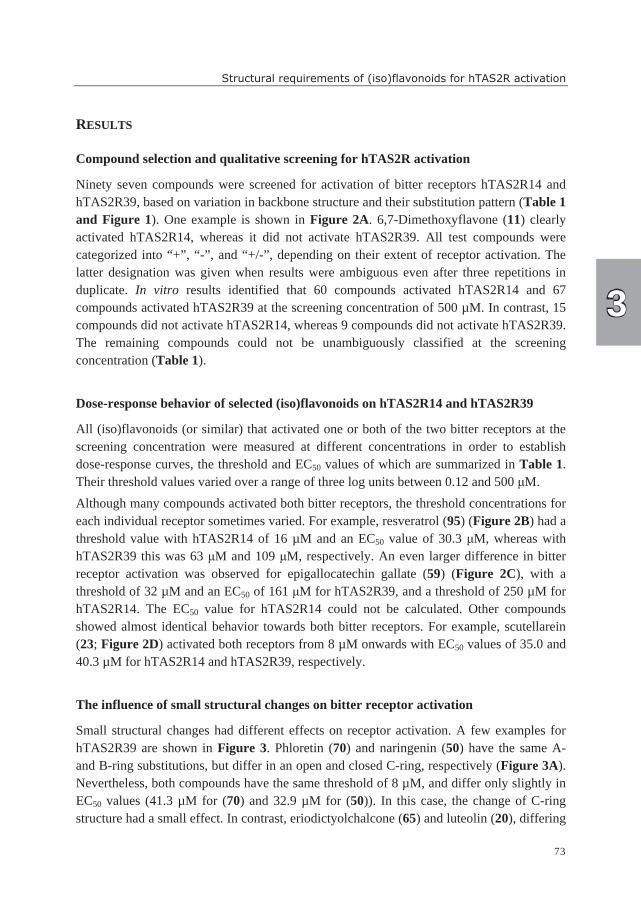
Structural requirements of (iso)flavonoids for hTAS2R activation
73
RESULTS
Compound selection and qualitative screening for hTAS2R activation
Ninety seven compounds were screened for activation of bitter receptors hTAS2R14 and
hTAS2R39, based on variation in backbone structure and their substitution pattern (Table 1
and Figure 1). One example is shown in Figure 2A. 6,7-Dimethoxyflavone (11) clearly
activated hTAS2R14, whereas it did not activate hTAS2R39. All test compounds were
categorized into “+”, “-”, and “+/-”, depending on their extent of receptor activation. The
latter designation was given when results were ambiguous even after three repetitions in
duplicate. In vitro results identified that 60 compounds activated hTAS2R14 and 67
compounds activated hTAS2R39 at the screening concentration of 500 µM. In contrast, 15
compounds did not activate hTAS2R14, whereas 9 compounds did not activate hTAS2R39.
The remaining compounds could not be unambiguously classified at the screening
concentration (Table 1).
Dose-response behavior of selected (iso)flavonoids on hTAS2R14 and hTAS2R39
All (iso)flavonoids (or similar) that activated one or both of the two bitter receptors at the
screening concentration were measured at different concentrations in order to establish
dose-response curves, the threshold and EC50 values of which are summarized in Table 1.
Their threshold values varied over a range of three log units between 0.12 and 500 µM.
Although many compounds activated both bitter receptors, the threshold concentrations for
each individual receptor sometimes varied. For example, resveratrol (95) (Figure 2B) had a
threshold value with hTAS2R14 of 16 µM and an EC50 value of 30.3 µM, whereas with
hTAS2R39 this was 63 µM and 109 µM, respectively. An even larger difference in bitter
receptor activation was observed for epigallocatechin gallate (59) (Figure 2C), with a
threshold of 32 µM and an EC50 of 161 µM for hTAS2R39, and a threshold of 250 µM for
hTAS2R14. The EC50 value for hTAS2R14 could not be calculated. Other compounds
showed almost identical behavior towards both bitter receptors. For example, scutellarein
(23; Figure 2D) activated both receptors from 8 µM onwards with EC50 values of 35.0 and
40.3 µM for hTAS2R14 and hTAS2R39, respectively.
The influence of small structural changes on bitter receptor activation
Small structural changes had different effects on receptor activation. A few examples for
hTAS2R39 are shown in Figure 3. Phloretin (70) and naringenin (50) have the same A-
and B-ring substitutions, but differ in an open and closed C-ring, respectively (Figure 3A).
Nevertheless, both compounds have the same threshold of 8 µM, and differ only slightly in
EC50 values (41.3 µM for (70) and 32.9 µM for (50)). In this case, the change of C-ring
structure had a small effect. In contrast, eriodictyolchalcone (65) and luteolin (20), differing
3
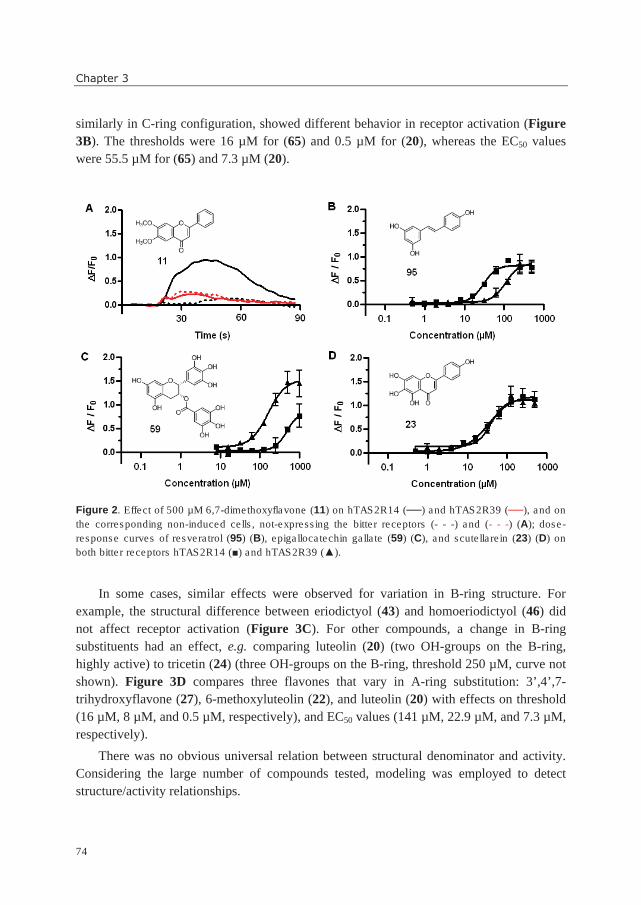
Chapter 3
74
similarly in C-ring configuration, showed different behavior in receptor activation (Figure
3B). The thresholds were 16 µM for (65) and 0.5 µM for (20), whereas the EC50 values
were 55.5 µM for (65) and 7.3 µM (20).
Figure 2. Effect of 500 µM 6,7-dimethoxyflavone (11) on hTAS2R14 (──) and hTAS2R39 (──), and on
the corresponding non-induced cells, not-expressing the bitter receptors (- - -) and (- - -) (A); dose-
response curves of resveratrol (95) (B), epigallocatechin gallate (59) (C), and scutellarein (23) (D) on
both bitter receptors hTAS2R14 (■) and hTAS2R39 (▲).
In some cases, similar effects were observed for variation in B-ring structure. For
example, the structural difference between eriodictyol (43) and homoeriodictyol (46) did
not affect receptor activation (Figure 3C). For other compounds, a change in B-ring
substituents had an effect, e.g. comparing luteolin (20) (two OH-groups on the B-ring,
highly active) to tricetin (24) (three OH-groups on the B-ring, threshold 250 µM, curve not
shown). Figure 3D compares three flavones that vary in A-ring substitution: 3’,4’,7-
trihydroxyflavone (27), 6-methoxyluteolin (22), and luteolin (20) with effects on threshold
(16 µM, 8 µM, and 0.5 µM, respectively), and EC50 values (141 µM, 22.9 µM, and 7.3 µM,
respectively).
There was no obvious universal relation between structural denominator and activity.
Considering the large number of compounds tested, modeling was employed to detect
structure/activity relationships.
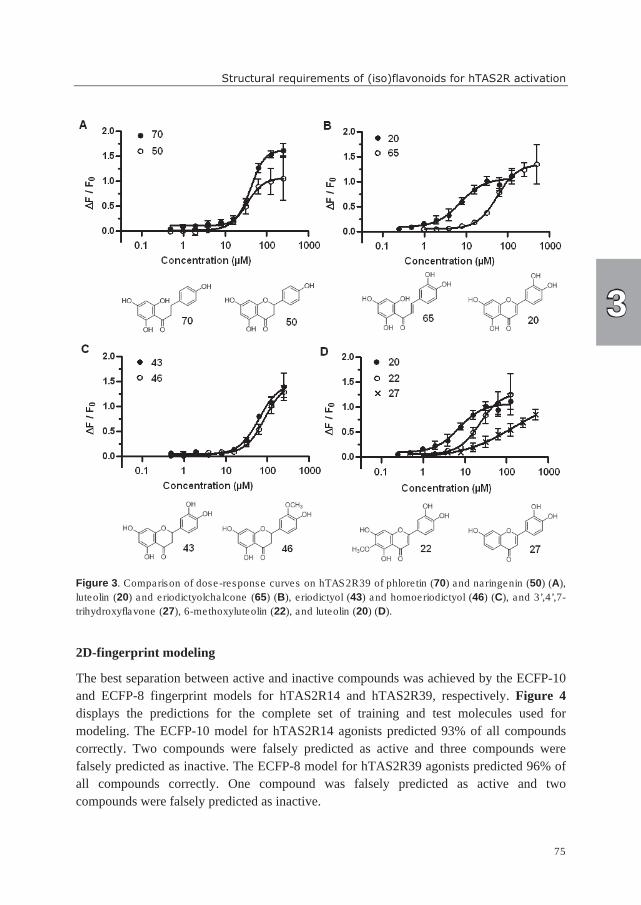
Structural requirements of (iso)flavonoids for hTAS2R activation
75
Figure 3. Comparison of dose-response curves on hTAS2R39 of phloretin (70) and naringenin (50) (A),
luteolin (20) and eriodictyolchalcone (65) (B), eriodictyol (43) and homoeriodictyol (46) (C), and 3’,4’,7-
trihydroxyflavone (27), 6-methoxyluteolin (22), and luteolin (20) (D).
2D-fingerprint modeling
The best separation between active and inactive compounds was achieved by the ECFP-10
and ECFP-8 fingerprint models for hTAS2R14 and hTAS2R39, respectively. Figure 4
displays the predictions for the complete set of training and test molecules used for
modeling. The ECFP-10 model for hTAS2R14 agonists predicted 93% of all compounds
correctly. Two compounds were falsely predicted as active and three compounds were
falsely predicted as inactive. The ECFP-8 model for hTAS2R39 agonists predicted 96% of
all compounds correctly. One compound was falsely predicted as active and two
compounds were falsely predicted as inactive.
3
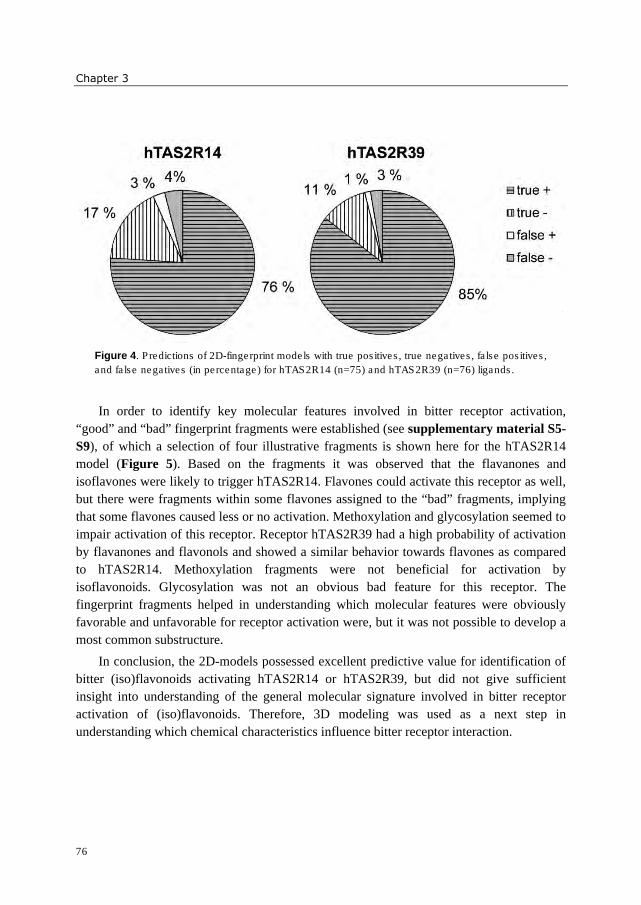
Chapter 3
76
Figure 4. Predictions of 2D-fingerprint models with true positives, true negatives, false positives,
and false negatives (in percentage) for hTAS2R14 (n=75) and hTAS2R39 (n=76) ligands.
In order to identify key molecular features involved in bitter receptor activation,
“good” and “bad” fingerprint fragments were established (see supplementary material S5-
S9), of which a selection of four illustrative fragments is shown here for the hTAS2R14
model (Figure 5). Based on the fragments it was observed that the flavanones and
isoflavones were likely to trigger hTAS2R14. Flavones could activate this receptor as well,
but there were fragments within some flavones assigned to the “bad” fragments, implying
that some flavones caused less or no activation. Methoxylation and glycosylation seemed to
impair activation of this receptor. Receptor hTAS2R39 had a high probability of activation
by flavanones and flavonols and showed a similar behavior towards flavones as compared
to hTAS2R14. Methoxylation fragments were not beneficial for activation by
isoflavonoids. Glycosylation was not an obvious bad feature for this receptor. The
fingerprint fragments helped in understanding which molecular features were obviously
favorable and unfavorable for receptor activation were, but it was not possible to develop a
most common substructure.
In conclusion, the 2D-models possessed excellent predictive value for identification of
bitter (iso)flavonoids activating hTAS2R14 or hTAS2R39, but did not give sufficient
insight into understanding of the general molecular signature involved in bitter receptor
activation of (iso)flavonoids. Therefore, 3D modeling was used as a next step in
understanding which chemical characteristics influence bitter receptor interaction.
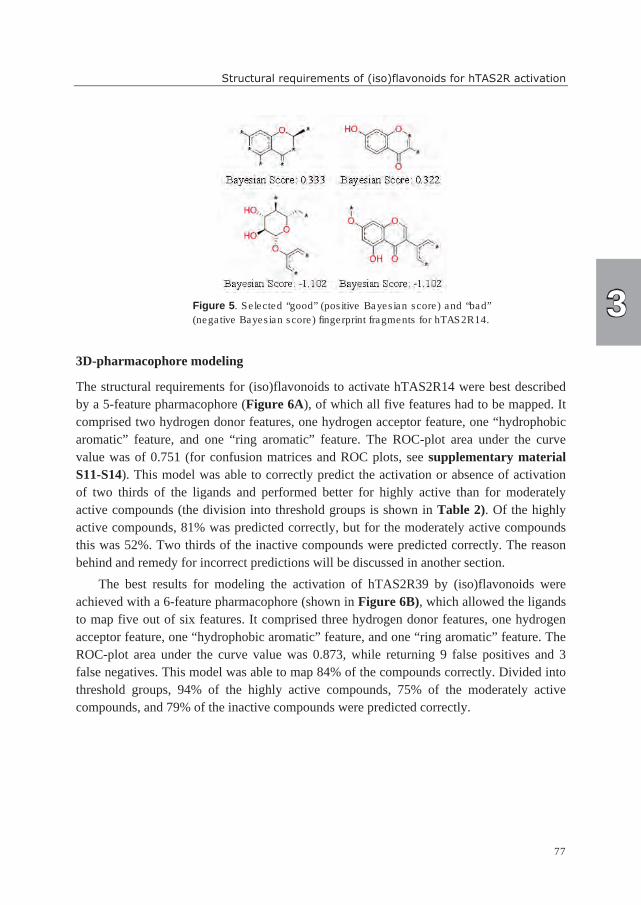
Structural requirements of (iso)flavonoids for hTAS2R activation
77
Figure 5. Selected “good” (positive Bayesian score) and “bad”
(negative Bayesian score) fingerprint fragments for hTAS2R14.
3D-pharmacophore modeling
The structural requirements for (iso)flavonoids to activate hTAS2R14 were best described
by a 5-feature pharmacophore (Figure 6A), of which all five features had to be mapped. It
comprised two hydrogen donor features, one hydrogen acceptor feature, one “hydrophobic
aromatic” feature, and one “ring aromatic” feature. The ROC-plot area under the curve
value was of 0.751 (for confusion matrices and ROC plots, see supplementary material
S11-S14). This model was able to correctly predict the activation or absence of activation
of two thirds of the ligands and performed better for highly active than for moderately
active compounds (the division into threshold groups is shown in Table 2). Of the highly
active compounds, 81% was predicted correctly, but for the moderately active compounds
this was 52%. Two thirds of the inactive compounds were predicted correctly. The reason
behind and remedy for incorrect predictions will be discussed in another section.
The best results for modeling the activation of hTAS2R39 by (iso)flavonoids were
achieved with a 6-feature pharmacophore (shown in Figure 6B), which allowed the ligands
to map five out of six features. It comprised three hydrogen donor features, one hydrogen
acceptor feature, one “hydrophobic aromatic” feature, and one “ring aromatic” feature. The
ROC-plot area under the curve value was 0.873, while returning 9 false positives and 3
false negatives. This model was able to map 84% of the compounds correctly. Divided into
threshold groups, 94% of the highly active compounds, 75% of the moderately active
compounds, and 79% of the inactive compounds were predicted correctly.
3
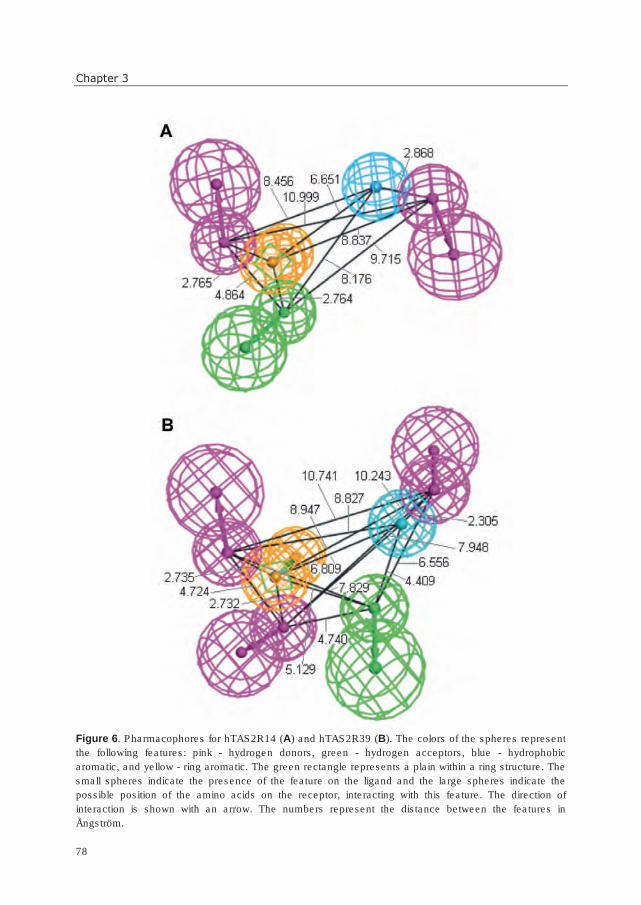
Chapter 3
78
Figure 6. Pharmacophores for hTAS2R14 (A) and hTAS2R39 (B). The colors of the spheres represent
the following features: pink - hydrogen donors, green - hydrogen acceptors, blue - hydrophobic
aromatic, and yellow - ring aromatic. The green rectangle represents a plain within a ring structure. The
small spheres indicate the presence of the feature on the ligand and the large spheres indicate the
possible position of the amino acids on the receptor, interacting with this feature. The direction of
interaction is shown with an arrow. The numbers represent the distance between the features in
Ångström.
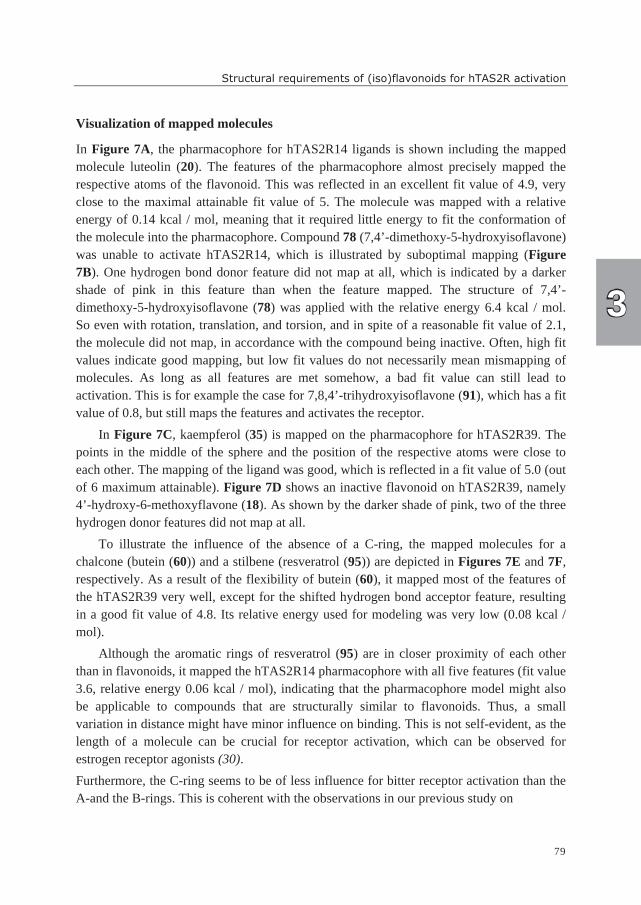
Structural requirements of (iso)flavonoids for hTAS2R activation
79
Visualization of mapped molecules
In Figure 7A, the pharmacophore for hTAS2R14 ligands is shown including the mapped
molecule luteolin (20). The features of the pharmacophore almost precisely mapped the
respective atoms of the flavonoid. This was reflected in an excellent fit value of 4.9, very
close to the maximal attainable fit value of 5. The molecule was mapped with a relative
energy of 0.14 kcal / mol, meaning that it required little energy to fit the conformation of
the molecule into the pharmacophore. Compound 78 (7,4’-dimethoxy-5-hydroxyisoflavone)
was unable to activate hTAS2R14, which is illustrated by suboptimal mapping (Figure
7B). One hydrogen bond donor feature did not map at all, which is indicated by a darker
shade of pink in this feature than when the feature mapped. The structure of 7,4’-
dimethoxy-5-hydroxyisoflavone (78) was applied with the relative energy 6.4 kcal / mol.
So even with rotation, translation, and torsion, and in spite of a reasonable fit value of 2.1,
the molecule did not map, in accordance with the compound being inactive. Often, high fit
values indicate good mapping, but low fit values do not necessarily mean mismapping of
molecules. As long as all features are met somehow, a bad fit value can still lead to
activation. This is for example the case for 7,8,4’-trihydroxyisoflavone (91), which has a fit
value of 0.8, but still maps the features and activates the receptor.
In Figure 7C, kaempferol (35) is mapped on the pharmacophore for hTAS2R39. The
points in the middle of the sphere and the position of the respective atoms were close to
each other. The mapping of the ligand was good, which is reflected in a fit value of 5.0 (out
of 6 maximum attainable). Figure 7D shows an inactive flavonoid on hTAS2R39, namely
4’-hydroxy-6-methoxyflavone (18). As shown by the darker shade of pink, two of the three
hydrogen donor features did not map at all.
To illustrate the influence of the absence of a C-ring, the mapped molecules for a
chalcone (butein (60)) and a stilbene (resveratrol (95)) are depicted in Figures 7E and 7F,
respectively. As a result of the flexibility of butein (60), it mapped most of the features of
the hTAS2R39 very well, except for the shifted hydrogen bond acceptor feature, resulting
in a good fit value of 4.8. Its relative energy used for modeling was very low (0.08 kcal /
mol).
Although the aromatic rings of resveratrol (95) are in closer proximity of each other
than in flavonoids, it mapped the hTAS2R14 pharmacophore with all five features (fit value
3.6, relative energy 0.06 kcal / mol), indicating that the pharmacophore model might also
be applicable to compounds that are structurally similar to flavonoids. Thus, a small
variation in distance might have minor influence on binding. This is not self-evident, as the
length of a molecule can be crucial for receptor activation, which can be observed for
estrogen receptor agonists (30).
Furthermore, the C-ring seems to be of less influence for bitter receptor activation than the
A-and the B-rings. This is coherent with the observations in our previous study on
3
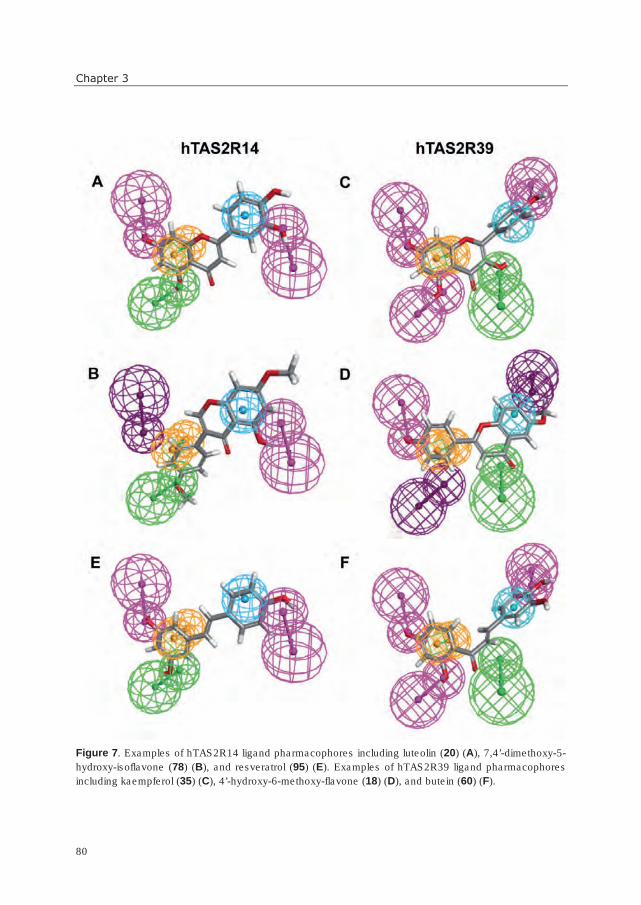
Chapter 3
80
Figure 7. Examples of hTAS2R14 ligand pharmacophores including luteolin (20) (A), 7,4’-dimethoxy-5-
hydroxy-isoflavone (78) (B), and resveratrol (95) (E). Examples of hTAS2R39 ligand pharmacophores
including kaempferol (35) (C), 4’-hydroxy-6-methoxy-flavone (18) (D), and butein (60) (F).
Structural requirements of (iso)flavonoids for hTAS2R activation
81
isoflavonoids (7), showing that the hydroxylation positions on A-and B-rings were more
crucial for activation than the exact structure in the center (e.g. C-ring) of the molecule.
DISCUSSION
(Iso)flavonoid agonists of hTAS2R14 and hTAS2R39 and their effects on bitter taste
receptors and taste perception
Amongst aglycones, catechins are the most important group of flavonoids occurring in our
diet. We identified catechins as agonists of two bitter receptors, hTAS2R14 and
hTAS2R39. Previously, only activation of hTAS2R39 was reported (14). On hTAS2R39,
we identified thresholds of ECG, EGCG, EC, and EGC, to be 32, 32, 250, and 500 µM,
respectively. Previously reported thresholds were between 10 and 30 µM for all four
catechins (14). Thus, our thresholds for galloylated catechins were in the same range as the
previously reported thresholds, but we observed by a factor of ten higher thresholds for the
non-galloylated catechins. The same trend applied to the observed EC50 values on
hTAS2R39. We obtained EC50 values of 150.6 µM and 161.2 µM for ECG and EGCG,
respectively, and values for EC and EGC could not be calculated within the suitable
concentration range (EC50 values reported by Narukawa (14) for ECG, EGCG, EGC, EC:
88.2, 181.6, 395.5, 417.7 µM, respectively). In another recent publication (16), EC was
identified as an agonist for three bitter receptors: hTAS2R39 (threshold 1 mM, EC50 3.8
mM), hTAS2R4 (threshold 2 mM, EC50 30.2 mM), and hTAS2R5 (threshold 1 mM, EC50
3.2 mM). We additionally identified hTAS2R14 (threshold 500 µM; no EC50 determined).
Thus, differences are reported between the various bitter receptor assays, which might be
caused by differences in experimental conditions. It should also be noted that in-vitro
threshold values reported in the elevated µM or in the mM range are very high, and, e.g. in
the case of EC in green tea, are unlikely to contribute to the bitter taste of the product.
Amongst the many new agonists of hTAS2R14 and hTAS2R39 reported in this study,
some compounds were known as bitter before (e.g. taxifolin, resveratrol), some compounds
had unknown taste properties (e.g. synthetic flavonoids), while three compounds were
previously reported as bitter taste maskers (homoeriodictyol, eriodictyol and phloretin (22,
31)). We identified homoeriodictyol and eriodictyol as agonists of hTAS2R14 (thresholds
32 µM for both compounds) and hTAS2R39 (thresholds 32 µM and 16 µM, respectively).
These two compounds were reported to mask bitterness of caffeine in sensory tests without
exhibiting strong taste characteristics at 100 ppm (31). The molecular mechanism of
masking by homoeriodictyol and eriodictyol requires further clarification. For phloretin, it
was reported that its masking activity (50 mg / L (= 182 µM)) for caffeine in sensory tests
competed with its bitterness observed at elevated concentrations (100 mg / L (= 365 µM))
(22). It was suggested that this might be an overlapping effect of antagonistic and agonistic
3
Chapter 3
82
activity, as described for sesquiterpene lactones (32). We identified phloretin as agonists of
hTAS2R14 and hTAS2R39 (thresholds 16 µM and 8 µM, respectively). Thus, the bitterness
of phloretin could be caused by activation of hTAS2R14 and hTAS2R39, and possibly
other receptors. Remarkably, the bitterness threshold of phloretin in-vivo was ~20-40 fold
higher than in-vitro. It has been observed before (10) that bitter compounds (hop acids) can
display higher sensory than receptor thresholds. In the case of hop acids, this has been
ascribed to their interaction with the oral mucosa. A bitter receptor assay might thus
overestimate bitterness, as interaction with mucosa or other in-vivo conditions is not
accounted for. Nevertheless, overestimation is not necessarily the case, as similar in-vivo
and in-vitro thresholds have been reported for β-D-glucopyranosides (33) and tea catechins
(14).
Evaluation of the 2D and 3D models
Even though they only operated with planar compound structures, the 2D-fingerprint
models were very effective in predicting active compounds, and discriminating them from
inactive compounds, leading to low numbers of false predictions. This might be due to the
relatively planar nature of many (iso)flavonoids. The 2D-fingerprint models can be used as
a quick in silico screening tool in compound library screening in order to identify
(iso)flavonoid (or similar) compounds that might taste bitter. Due to lower complexity, they
are more suitable than the 3D-pharmacophore models for screening large compound
databases. On the contrary, 2D-fingerprint models created only a partial understanding of
the molecular features involved in bitter receptor activation. The 3D-pharmacophore
models provided a broader insight into (iso)flavonoid bitter receptor interaction. The
structural characteristics for an (iso)flavonoid to activate hTAS2R14 (or hTAS2R39), were
determined to be composed of two (or three) hydrogen bond donor sites, one hydrogen
bond acceptor site, one hydrophobic ring structure and one aromatic ring structure.
The receptor activation threshold values lie within a range of three orders of magnitude,
which is generally considered as a relatively small range for quantitative structure activity
relationship (QSAR) modeling. In the attempt of establishing a QSAR model, a clear
correlation between features and threshold could not be determined. But even without a
quantitative prediction, the pharmacophore models are a powerful tool in prediction of
potential bitterness.
Explanation of false predictions by 3D-pharmacophore models
Several compounds were falsely predicted as positive or negative by the 3D-
pharmacophore models (see Table 2).
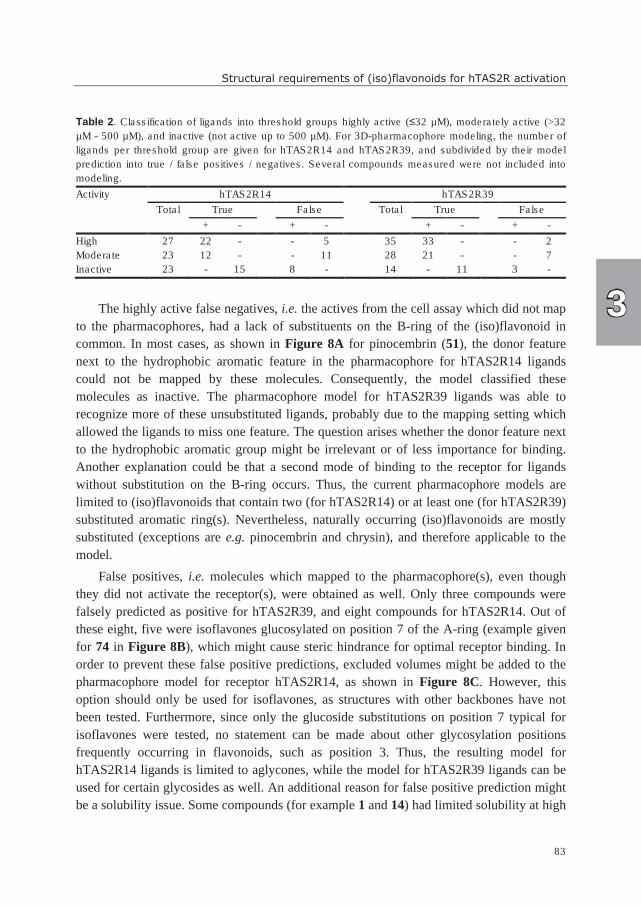
Structural requirements of (iso)flavonoids for hTAS2R activation
83
Table 2. Classification of ligands into threshold groups highly active (≤32 µM), moderately active (>32
µM - 500 µM), and inactive (not active up to 500 µM). For 3D-pharmacophore modeling, the number of
ligands per threshold group are given for hTAS2R14 and hTAS2R39, and subdivided by their model
prediction into true / false positives / negatives. Several compounds measured were not included into
modeling.
Activity hTAS2R14 hTAS2R39
Total True False Total True False
+ - + - + - + -
High 27 22 - - 5 35 33 - - 2
Moderate 23 12 - - 11 28 21 - - 7
Inactive 23 - 15 8 - 14 - 11 3 -
The highly active false negatives, i.e. the actives from the cell assay which did not map
to the pharmacophores, had a lack of substituents on the B-ring of the (iso)flavonoid in
common. In most cases, as shown in Figure 8A for pinocembrin (51), the donor feature
next to the hydrophobic aromatic feature in the pharmacophore for hTAS2R14 ligands
could not be mapped by these molecules. Consequently, the model classified these
molecules as inactive. The pharmacophore model for hTAS2R39 ligands was able to
recognize more of these unsubstituted ligands, probably due to the mapping setting which
allowed the ligands to miss one feature. The question arises whether the donor feature next
to the hydrophobic aromatic group might be irrelevant or of less importance for binding.
Another explanation could be that a second mode of binding to the receptor for ligands
without substitution on the B-ring occurs. Thus, the current pharmacophore models are
limited to (iso)flavonoids that contain two (for hTAS2R14) or at least one (for hTAS2R39)
substituted aromatic ring(s). Nevertheless, naturally occurring (iso)flavonoids are mostly
substituted (exceptions are e.g. pinocembrin and chrysin), and therefore applicable to the
model.
False positives, i.e. molecules which mapped to the pharmacophore(s), even though
they did not activate the receptor(s), were obtained as well. Only three compounds were
falsely predicted as positive for hTAS2R39, and eight compounds for hTAS2R14. Out of
these eight, five were isoflavones glucosylated on position 7 of the A-ring (example given
for 74 in Figure 8B), which might cause steric hindrance for optimal receptor binding. In
order to prevent these false positive predictions, excluded volumes might be added to the
pharmacophore model for receptor hTAS2R14, as shown in Figure 8C. However, this
option should only be used for isoflavones, as structures with other backbones have not
been tested. Furthermore, since only the glucoside substitutions on position 7 typical for
isoflavones were tested, no statement can be made about other glycosylation positions
frequently occurring in flavonoids, such as position 3. Thus, the resulting model for
hTAS2R14 ligands is limited to aglycones, while the model for hTAS2R39 ligands can be
used for certain glycosides as well. An additional reason for false positive prediction might
be a solubility issue. Some compounds (for example 1 and 14) had limited solubility at high
3
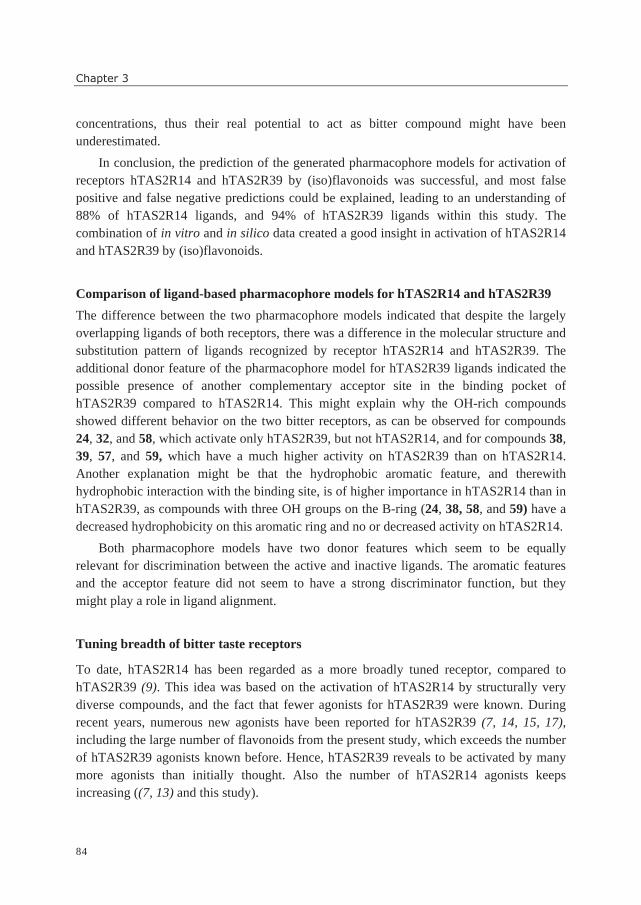
Chapter 3
84
concentrations, thus their real potential to act as bitter compound might have been
underestimated.
In conclusion, the prediction of the generated pharmacophore models for activation of
receptors hTAS2R14 and hTAS2R39 by (iso)flavonoids was successful, and most false
positive and false negative predictions could be explained, leading to an understanding of
88% of hTAS2R14 ligands, and 94% of hTAS2R39 ligands within this study. The
combination of in vitro and in silico data created a good insight in activation of hTAS2R14
and hTAS2R39 by (iso)flavonoids.
Comparison of ligand-based pharmacophore models for hTAS2R14 and hTAS2R39
The difference between the two pharmacophore models indicated that despite the largely
overlapping ligands of both receptors, there was a difference in the molecular structure and
substitution pattern of ligands recognized by receptor hTAS2R14 and hTAS2R39. The
additional donor feature of the pharmacophore model for hTAS2R39 ligands indicated the
possible presence of another complementary acceptor site in the binding pocket of
hTAS2R39 compared to hTAS2R14. This might explain why the OH-rich compounds
showed different behavior on the two bitter receptors, as can be observed for compounds
24, 32, and 58, which activate only hTAS2R39, but not hTAS2R14, and for compounds 38,
39, 57, and 59, which have a much higher activity on hTAS2R39 than on hTAS2R14.
Another explanation might be that the hydrophobic aromatic feature, and therewith
hydrophobic interaction with the binding site, is of higher importance in hTAS2R14 than in
hTAS2R39, as compounds with three OH groups on the B-ring (24, 38, 58, and 59) have a
decreased hydrophobicity on this aromatic ring and no or decreased activity on hTAS2R14.
Both pharmacophore models have two donor features which seem to be equally
relevant for discrimination between the active and inactive ligands. The aromatic features
and the acceptor feature did not seem to have a strong discriminator function, but they
might play a role in ligand alignment.
Tuning breadth of bitter taste receptors
To date, hTAS2R14 has been regarded as a more broadly tuned receptor, compared to
hTAS2R39 (9). This idea was based on the activation of hTAS2R14 by structurally very
diverse compounds, and the fact that fewer agonists for hTAS2R39 were known. During
recent years, numerous new agonists have been reported for hTAS2R39 (7, 14, 15, 17),
including the large number of flavonoids from the present study, which exceeds the number
of hTAS2R39 agonists known before. Hence, hTAS2R39 reveals to be activated by many
more agonists than initially thought. Also the number of hTAS2R14 agonists keeps
increasing ((7, 13) and this study).
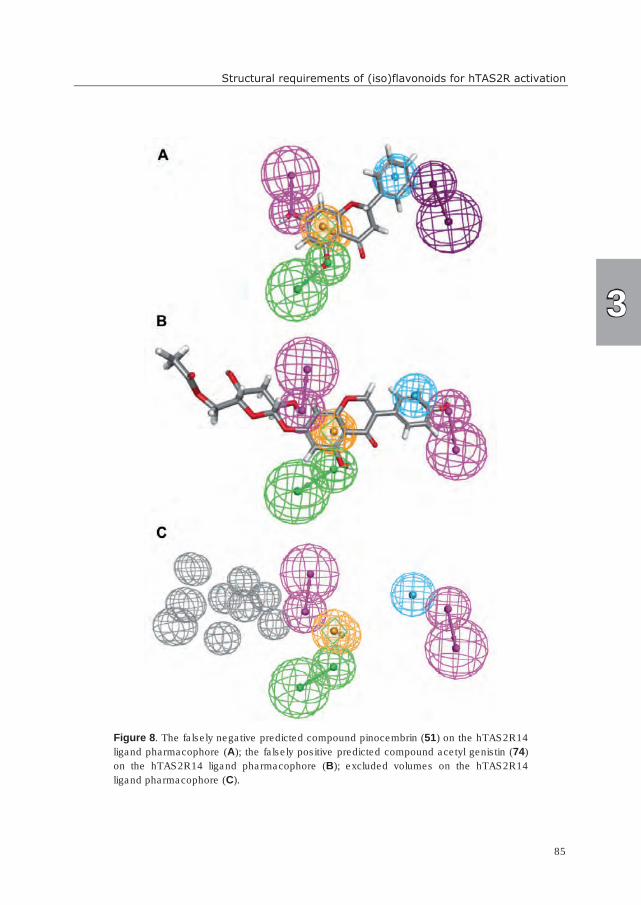
Structural requirements of (iso)flavonoids for hTAS2R activation
85
Figure 8. The falsely negative predicted compound pinocembrin (51) on the hTAS2R14
ligand pharmacophore (A); the falsely positive predicted compound acetyl genistin (74)
on the hTAS2R14 ligand pharmacophore (B); excluded volumes on the hTAS2R14
ligand pharmacophore (C).
3
Chapter 3
86
With time, the number of hTAS2R agonists will grow further, and it is questionable
whether tuning breadth should simply be related to the number of bitter receptor agonists.
Our present results show that the substitution pattern of (iso)flavonoids was of higher
importance for receptor activation than their backbone structure (e.g. whether the agonist is
a flavone or a flavanone). Our pharmacophore modeling revealed, which signatures
underlay binding to hTAS2R14 and -39. Therefore, it might be better to describe tuning
breadth of bitter receptors in terms of the number of molecular signatures recognized by the
receptor. In this way, a collection of molecules with similar signature will only count as one
with respect to tuning breadth, and tuning breadth is less likely to be overestimated.
In conclusion, this study identified many flavonoids as intrinsically bitter, and
elucidated the structural requirements for bitterness of (iso)flavonoids. Understanding their
“bitter motif” might prevent the introduction of bitter taste in the design of functional foods
enriched in (iso)flavonoid bioactives.
ACKNOWLDGEMENTS
We thank Dr. Michiel Gribnau (Unilever Vlaardingen, The Netherlands) for statistical
analysis and Diana Drennan (Unilever Trumbull, CT, USA, currently employed at
Accelrys, USA) and Katalin Nedassy (Accelrys, UK) for advice in modeling. This work
was financially supported by the Food & Nutrition Delta of the Ministry of Economic
Affairs, the Netherlands (FND 08019).
REFERENCES
1. Setchell, K. D. R.; Cassidy, A. Dietary isoflavones: Biological effects and relevance to human
health. Journal of Nutrition 1999, 129 (3), 758S-767S.
2. Manach, C.; Scalbert, A.; Morand, C.; Rémésy, C.; Jiménez, L. Polyphenols: Food sources and
bioavailability. American Journal of Clinical Nutrition 2004, 79 (5), 727-747.
3. Soto-Vaca, A.; Gutierrez, A.; Losso, J. N.; Xu, Z.; Finley, J. W. Evolution of phenolic compounds
from color and flavor problems to health benefits. Journal of Agricultural and Food
Chemistry 2012, 60 (27), 6658-6677.
4. Drewnowski, A.; Gomez-Carneros, C. Bitter taste, phytonutrients, and the consumer: A review.
American Journal of Clinical Nutrition 2000, 72 (6), 1424-1435.
5. Aldin, E.; Reitmeier, C. A.; Murphy, P. Bitterness of soy extracts containing isoflavones and
saponins. Journal of Food Science 2006, 71 (3), S211-S215.
6. Okubo, K.; Iijima, M.; Kobayashi, Y.; Yoshokoshi, M.; Uchida, T.; Kudou, S. Components
responsible for the undesirable taste of soybean seeds. Bioscience, Biotechnology, and
Biochemistry 1992, 56 (1), 99-103.
Structural requirements of (iso)flavonoids for hTAS2R activation
87
7. Roland, W. S. U.; Vincken, J. P.; Gouka, R. J.; van Buren, L.; Gruppen, H.; Smit, G. Soy
isoflavones and other isoflavonoids activate the human bitter taste receptors hTAS2R14 and
hTAS2R39. Journal of Agricultural and Food Chemistry 2011, 59 (21), 11764-11771.
8. Behrens, M.; Brockhoff, A.; Kuhn, C.; Bufe, B.; Winnig, M.; Meyerhof, W. The human taste
receptor hTAS2R14 responds to a variety of different bitter compounds. Biochemical and
Biophysical Research Communications 2004, 319 (2), 479-485.
9. Meyerhof, W.; Batram, C.; Kuhn, C.; Brockhoff, A.; Chudoba, E.; Bufe, B.; Appendino, G.;
Behrens, M. The molecular receptive ranges of human TAS2R bitter taste receptors. Chemical
Senses 2010, 35 (2), 157-170.
10. Intelmann, D.; Batram, C.; Kuhn, C.; Haseleu, G.; Meyerhof, W.; Hofmann, T. Three TAS2R
bitter taste receptors mediate the psychophysical responses to bitter compounds of hops
(Humulus lupulus L.) and beer. Chemosensory Perception 2009, 2 (3), 118-132.
11. Le Nevé, B.; Foltz, M.; Daniel, H.; Gouka, R. The steroid glycoside H.g.-12 from Hoodia
gordonii activates the human bitter receptor TAS2R14 and induces CCK release from HuTu-
80 cells. American Journal of Physiology-Gastrointestinal and Liver Physiology 2010, 299
(6), G1368-G1375.
12. Maehashi, K.; Matano, M.; Wang, H.; Vo, L. A.; Yamamoto, Y.; Huang, L. Bitter peptides
activate hTAS2Rs, the human bitter receptors. Biochemical and Biophysical Research
Communications 2008, 365 (4), 851-855.
13. Hellfritsch, C.; Brockhoff, A.; Stähler, F.; Meyerhof, W.; Hofmann, T. Human psychometric and
taste receptor responses to steviol glycosides. Journal of Agricultural and Food Chemistry
2012, 60 (27), 6782-6793.
14. Narukawa, M.; Noga, C.; Ueno, Y.; Sato, T.; Misaka, T.; Watanabe, T. Evaluation of the
bitterness of green tea catechins by a cell-based assay with the human bitter taste receptor
hTAS2R39. Biochemical and Biophysical Research Communications 2011, 405 (4), 620-625.
15. Ueno, Y.; Sakurai, T.; Okada, S.; Abe, K.; Misaka, T. Human bitter taste receptors hTAS2R8 and
hTAS2R39 with differential functions to recognize bitter peptides. Bioscience, Biotechnology
and Biochemistry 2011, 75 (6), 1188-1190.
16. Soares, S.; Kohl, S.; Thalmann, S.; Mateus, N.; Meyerhof, W.; De Freitas, V. Different phenolic
compounds activate distinct human bitter taste receptors. Journal of Agricultural and Food
Chemistry 2013, 61 (7), 1525-1533.
17. Kohl, S.; Behrens, M.; Dunkel, A.; Hofmann, T.; Meyerhof, W. Amino acids and peptides
activate at least five members of the human bitter taste receptor family. Journal of
Agricultural and Food Chemistry 2013, 61 (1), 53-60.
18. Martinez-Mayorga, K.; Medina-Franco, J. L. Chemoinformatics-applications in food chemistry.
In Advances in Food and Nutrition Research, 58 ed.; Academic Press, Burlington, MA, 2009,
pp. 33-56.
19. Glen, R. C.; Bender, A.; Arnby, C. H.; Carlsson, L.; Boyer, S.; Smith, J. Circular fingerprints:
Flexible molecular descriptors with applications from physical chemistry to ADME. IDrugs
2006, 9 (3), 199-204.
20. Wermuth, C. G.; Ganellin, C. R.; Lindberg, P.; Mitscher, L. A. Glossary of Terms Used in
Medicinal Chemistry (IUPAC Recommendations 1998). Pure and Applied Chemistry 1998,
70 (5), 1129-1143.
21. Van Drie, J. H. Monty Kier and the origin of the pharmacophore concept. Internet Electronic
Journal of Molecular Design 2007, 6 (9), 271-279.
3
Chapter 3
88
22. Ley, J. P.; Dessoy, M.; Paetz, S.; Blings, M.; Hoffmann-Lücke, P.; Reichelt, K. V.; Krammer, G.
E.; Pienkny, S.; Brandt, W.; Wessjohann, L. Identification of enterodiol as a masker for
caffeine bitterness by using a pharmacophore model based on structural analogues of
homoeriodictyol. Journal of Agricultural and Food Chemistry 2012, 60 (25), 6303-6311.
23. Kraft, P.; Bajgrowicz, J. A.; Denis, C.; Fráter, G. Odds and trends: Recent developments in the
chemistry of odorants. Angewandte Chemie - International Edition 2000, 39 (17), 2981-3010.
24. Tromelin, A.; Guichard, E. Use of catalyst in a 3D-QSAR study of the interactions between flavor
compounds and b-lactoglobulin. Journal of Agricultural and Food Chemistry 2003, 51 (7),
1977-1983.
25. Chandrashekar, J.; Mueller, K. L.; Hoon, M. A.; Adler, E.; Feng, L.; Guo, W.; Zuker, C. S.; Ryba,
N. J. P. T2Rs function as bitter taste receptors. Cell 2000, 100 (6), 703-711.
26. Kuhn, C.; Bufe, B.; Winnig, M.; Hofmann, T.; Frank, O.; Behrens, M.; Lewtschenko, T.; Slack, J.
P.; Ward, C. D.; Meyerhof, W. Bitter taste receptors for saccharin and acesulfame K. Journal
of Neuroscience 2004, 24 (45), 10260-10265.
27. Hawkins, D. M.; Basak, S. C.; Mills, D. Assessing model fit by cross-validation. Journal of
Chemical Information and Computer Sciences 2003, 43 (2), 579-586.
28. Clifford, M. N. Anthocyanins - Nature, occurrence and dietary burden. Journal of the Science of
Food and Agriculture 2000, 80 (7), 1063-1072.
29. Awika, J. M. Behavior of 3-deoxyanthocyanidins in the presence of phenolic copigments. Food
Research International 2008, 41 (5), 532-538.
30. Fang, H.; Tong, W.; Perkins, R.; Soto, A. M.; Prechtl, N. V.; Sheehan, D. M. Quantitative
comparisons of in vitro assays for estrogenic activities. Environmental Health Perspectives
2000, 108 (8), 723-729.
31. Ley, J. P.; Krammer, G.; Reinders, G.; Gatfield, I. L.; Bertram, H. J. Evaluation of bitter masking
flavanones from Herba Santa (Eriodictyon californicum (H. & A.) Torr., Hydrophyllaceae).
Journal of Agricultural and Food Chemistry 2005, 53 (15), 6061-6066.
32. Brockhoff, A.; Behrens, M.; Roudnitzky, N.; Appendino, G.; Avonto, C.; Meyerhof, W. Receptor
agonism and antagonism of dietary bitter compounds. Journal of Neuroscience 2011, 31 (41),
14775-14872.
33. Bufe, B.; Hofmann, T.; Krautwurst, D.; Raguse, J. D.; Meyerhof, W. The human TAS2R16
receptor mediates bitter taste in response to beta-glucopyranosides. Nature Genetics 2002, 32
(3), 397-401.
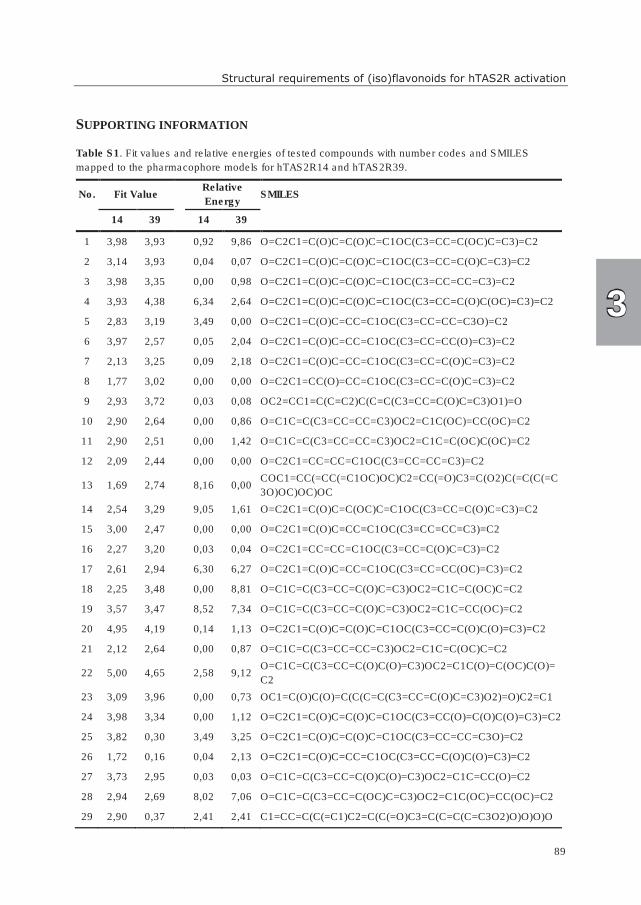
Structural requirements of (iso)flavonoids for hTAS2R activation
89
SUPPORTING INFORMATION
Table S1. Fit values and relative energies of tested compounds with number codes and SMILES
mapped to the pharmacophore models for hTAS2R14 and hTAS2R39.
No. Fit Value Relative
Energy SMILES
14 39 14 39
1 3,98 3,93 0,92 9,86 O=C2C1=C(O)C=C(O)C=C1OC(C3=CC=C(OC)C=C3)=C2
2 3,14 3,93 0,04 0,07 O=C2C1=C(O)C=C(O)C=C1OC(C3=CC=C(O)C=C3)=C2
3 3,98 3,35 0,00 0,98 O=C2C1=C(O)C=C(O)C=C1OC(C3=CC=CC=C3)=C2
4 3,93 4,38 6,34 2,64 O=C2C1=C(O)C=C(O)C=C1OC(C3=CC=C(O)C(OC)=C3)=C2
5 2,83 3,19 3,49 0,00 O=C2C1=C(O)C=CC=C1OC(C3=CC=CC=C3O)=C2
6 3,97 2,57 0,05 2,04 O=C2C1=C(O)C=CC=C1OC(C3=CC=CC(O)=C3)=C2
7 2,13 3,25 0,09 2,18 O=C2C1=C(O)C=CC=C1OC(C3=CC=C(O)C=C3)=C2
8 1,77 3,02 0,00 0,00 O=C2C1=CC(O)=CC=C1OC(C3=CC=C(O)C=C3)=C2
9 2,93 3,72 0,03 0,08 OC2=CC1=C(C=C2)C(C=C(C3=CC=C(O)C=C3)O1)=O
10 2,90 2,64 0,00 0,86 O=C1C=C(C3=CC=CC=C3)OC2=C1C(OC)=CC(OC)=C2
11 2,90 2,51 0,00 1,42 O=C1C=C(C3=CC=CC=C3)OC2=C1C=C(OC)C(OC)=C2
12 2,09 2,44 0,00 0,00 O=C2C1=CC=CC=C1OC(C3=CC=CC=C3)=C2
13 1,69 2,74
8,16 0,00 COC1=CC(=CC(=C1OC)OC)C2=CC(=O)C3=C(O2)C(=C(C(=C
3O)OC)OC)OC
14 2,54 3,29 9,05 1,61 O=C2C1=C(O)C=C(OC)C=C1OC(C3=CC=C(O)C=C3)=C2
15 3,00 2,47 0,00 0,00 O=C2C1=C(O)C=CC=C1OC(C3=CC=CC=C3)=C2
16 2,27 3,20 0,03 0,04 O=C2C1=CC=CC=C1OC(C3=CC=C(O)C=C3)=C2
17 2,61 2,94 6,30 6,27 O=C2C1=C(O)C=CC=C1OC(C3=CC=CC(OC)=C3)=C2
18 2,25 3,48 0,00 8,81 O=C1C=C(C3=CC=C(O)C=C3)OC2=C1C=C(OC)C=C2
19 3,57 3,47 8,52 7,34 O=C1C=C(C3=CC=C(O)C=C3)OC2=C1C=CC(OC)=C2
20 4,95 4,19 0,14 1,13 O=C2C1=C(O)C=C(O)C=C1OC(C3=CC=C(O)C(O)=C3)=C2
21 2,12 2,64 0,00 0,87 O=C1C=C(C3=CC=CC=C3)OC2=C1C=C(OC)C=C2
22 5,00 4,65
2,58 9,12 O=C1C=C(C3=CC=C(O)C(O)=C3)OC2=C1C(O)=C(OC)C(O)=
C2
23 3,09 3,96 0,00 0,73 OC1=C(O)C(O)=C(C(C=C(C3=CC=C(O)C=C3)O2)=O)C2=C1
24 3,98 3,34 0,00 1,12 O=C2C1=C(O)C=C(O)C=C1OC(C3=CC(O)=C(O)C(O)=C3)=C2
25 3,82 0,30 3,49 3,25 O=C2C1=C(O)C=C(O)C=C1OC(C3=CC=CC=C3O)=C2
26 1,72 0,16 0,04 2,13 O=C2C1=C(O)C=CC=C1OC(C3=CC=C(O)C(O)=C3)=C2
27 3,73 2,95 0,03 0,03 O=C1C=C(C3=CC=C(O)C(O)=C3)OC2=C1C=CC(O)=C2
28 2,94 2,69 8,02 7,06 O=C1C=C(C3=CC=C(OC)C=C3)OC2=C1C(OC)=CC(OC)=C2
29 2,90 0,37 2,41 2,41 C1=CC=C(C(=C1)C2=C(C(=O)C3=C(C=C(C=C3O2)O)O)O)O
3
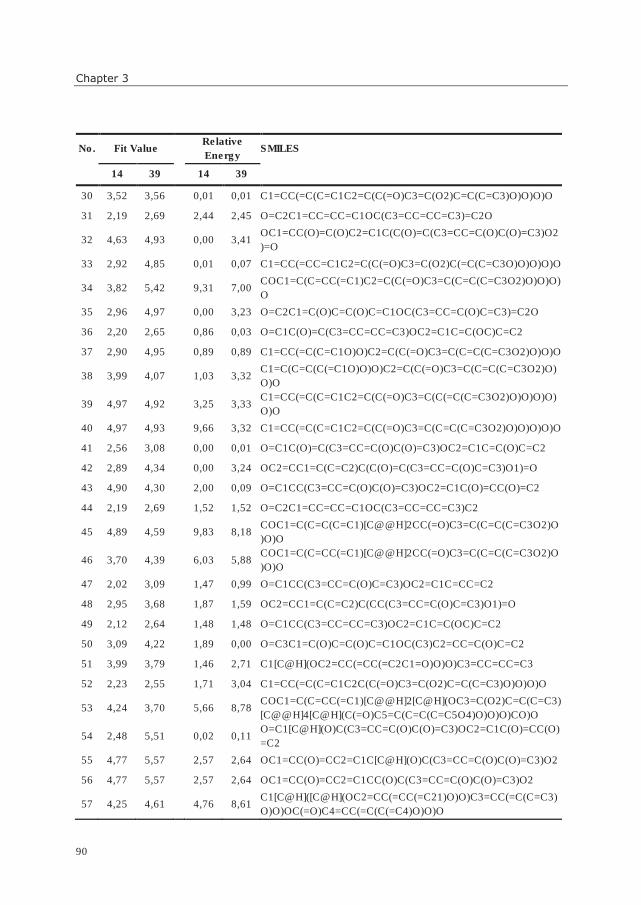
Chapter 3
90
No. Fit Value Relative
Energy SMILES
14 39 14 39
30 3,52 3,56 0,01 0,01 C1=CC(=C(C=C1C2=C(C(=O)C3=C(O2)C=C(C=C3)O)O)O)O
31 2,19 2,69 2,44 2,45 O=C2C1=CC=CC=C1OC(C3=CC=CC=C3)=C2O
32 4,63 4,93
0,00 3,41 OC1=CC(O)=C(O)C2=C1C(C(O)=C(C3=CC=C(O)C(O)=C3)O2
)=O
33 2,92 4,85 0,01 0,07 C1=CC(=CC=C1C2=C(C(=O)C3=C(O2)C(=C(C=C3O)O)O)O)O
34 3,82 5,42
9,31 7,00 COC1=C(C=CC(=C1)C2=C(C(=O)C3=C(C=C(C=C3O2)O)O)O)
O
35 2,96 4,97 0,00 3,23 O=C2C1=C(O)C=C(O)C=C1OC(C3=CC=C(O)C=C3)=C2O
36 2,20 2,65 0,86 0,03 O=C1C(O)=C(C3=CC=CC=C3)OC2=C1C=C(OC)C=C2
37 2,90 4,95 0,89 0,89 C1=CC(=C(C=C1O)O)C2=C(C(=O)C3=C(C=C(C=C3O2)O)O)O
38 3,99 4,07
1,03 3,32 C1=C(C=C(C(=C1O)O)O)C2=C(C(=O)C3=C(C=C(C=C3O2)O)
O)O
39 4,97 4,92
3,25 3,33 C1=CC(=C(C=C1C2=C(C(=O)C3=C(C(=C(C=C3O2)O)O)O)O)
O)O
40 4,97 4,93 9,66 3,32 C1=CC(=C(C=C1C2=C(C(=O)C3=C(C=C(C=C3O2)O)O)O)O)O
41 2,56 3,08 0,00 0,01 O=C1C(O)=C(C3=CC=C(O)C(O)=C3)OC2=C1C=C(O)C=C2
42 2,89 4,34 0,00 3,24 OC2=CC1=C(C=C2)C(C(O)=C(C3=CC=C(O)C=C3)O1)=O
43 4,90 4,30 2,00 0,09 O=C1CC(C3=CC=C(O)C(O)=C3)OC2=C1C(O)=CC(O)=C2
44 2,19 2,69 1,52 1,52 O=C2C1=CC=CC=C1OC(C3=CC=CC=C3)C2
45 4,89 4,59
9,83 8,18 COC1=C(C=C(C=C1)[C@@H]2CC(=O)C3=C(C=C(C=C3O2)O
)O)O
46 3,70 4,39
6,03 5,88 COC1=C(C=CC(=C1)[C@@H]2CC(=O)C3=C(C=C(C=C3O2)O
)O)O
47 2,02 3,09 1,47 0,99 O=C1CC(C3=CC=C(O)C=C3)OC2=C1C=CC=C2
48 2,95 3,68 1,87 1,59 OC2=CC1=C(C=C2)C(CC(C3=CC=C(O)C=C3)O1)=O
49 2,12 2,64 1,48 1,48 O=C1CC(C3=CC=CC=C3)OC2=C1C=C(OC)C=C2
50 3,09 4,22 1,89 0,00 O=C3C1=C(O)C=C(O)C=C1OC(C3)C2=CC=C(O)C=C2
51 3,99 3,79 1,46 2,71 C1[C@H](OC2=CC(=CC(=C2C1=O)O)O)C3=CC=CC=C3
52 2,23 2,55 1,71 3,04 C1=CC(=C(C=C1C2C(C(=O)C3=C(O2)C=C(C=C3)O)O)O)O
53 4,24 3,70
5,66 8,78 COC1=C(C=CC(=C1)[C@@H]2[C@H](OC3=C(O2)C=C(C=C3)
[C@@H]4[C@H](C(=O)C5=C(C=C(C=C5O4)O)O)O)CO)O
54 2,48 5,51
0,02 0,11 O=C1[C@H](O)C(C3=CC=C(O)C(O)=C3)OC2=C1C(O)=CC(O)
=C2
55 4,77 5,57 2,57 2,64 OC1=CC(O)=CC2=C1C[C@H](O)C(C3=CC=C(O)C(O)=C3)O2
56 4,77 5,57 2,57 2,64 OC1=CC(O)=CC2=C1CC(O)C(C3=CC=C(O)C(O)=C3)O2
57 4,25 4,61
4,76 8,61 C1[C@H]([C@H](OC2=CC(=CC(=C21)O)O)C3=CC(=C(C=C3)
O)O)OC(=O)C4=CC(=C(C(=C4)O)O)O
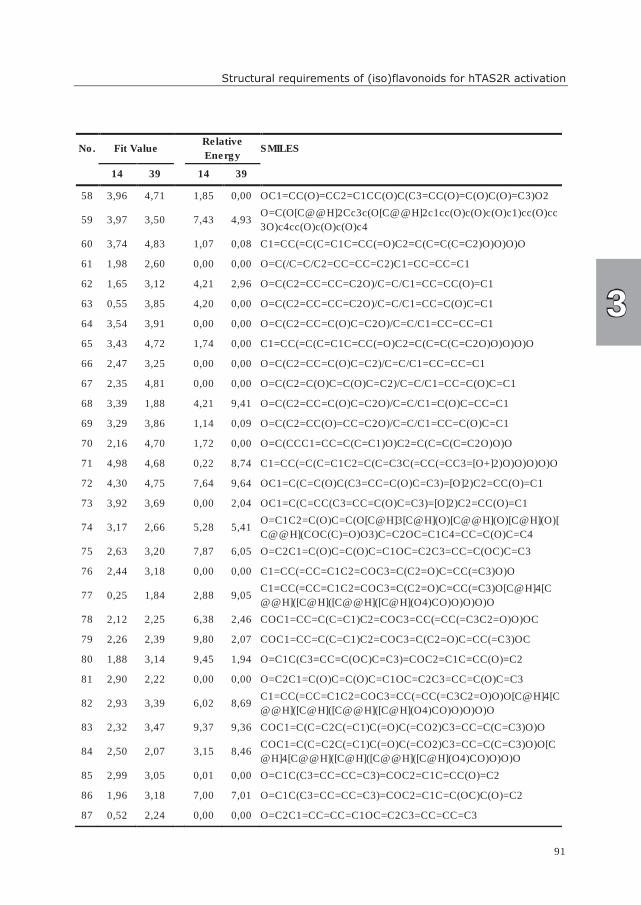
Structural requirements of (iso)flavonoids for hTAS2R activation
91
No. Fit Value Relative
Energy SMILES
14 39 14 39
58 3,96 4,71 1,85 0,00 OC1=CC(O)=CC2=C1CC(O)C(C3=CC(O)=C(O)C(O)=C3)O2
59 3,97 3,50
7,43 4,93 O=C(O[C@@H]2Cc3c(O[C@@H]2c1cc(O)c(O)c(O)c1)cc(O)cc
3O)c4cc(O)c(O)c(O)c4
60 3,74 4,83 1,07 0,08 C1=CC(=C(C=C1C=CC(=O)C2=C(C=C(C=C2)O)O)O)O
61 1,98 2,60 0,00 0,00 O=C(/C=C/C2=CC=CC=C2)C1=CC=CC=C1
62 1,65 3,12 4,21 2,96 O=C(C2=CC=CC=C2O)/C=C/C1=CC=CC(O)=C1
63 0,55 3,85 4,20 0,00 O=C(C2=CC=CC=C2O)/C=C/C1=CC=C(O)C=C1
64 3,54 3,91 0,00 0,00 O=C(C2=CC=C(O)C=C2O)/C=C/C1=CC=CC=C1
65 3,43 4,72 1,74 0,00 C1=CC(=C(C=C1C=CC(=O)C2=C(C=C(C=C2O)O)O)O)O
66 2,47 3,25 0,00 0,00 O=C(C2=CC=C(O)C=C2)/C=C/C1=CC=CC=C1
67 2,35 4,81 0,00 0,00 O=C(C2=C(O)C=C(O)C=C2)/C=C/C1=CC=C(O)C=C1
68 3,39 1,88 4,21 9,41 O=C(C2=CC=C(O)C=C2O)/C=C/C1=C(O)C=CC=C1
69 3,29 3,86 1,14 0,09 O=C(C2=CC(O)=CC=C2O)/C=C/C1=CC=C(O)C=C1
70 2,16 4,70 1,72 0,00 O=C(CCC1=CC=C(C=C1)O)C2=C(C=C(C=C2O)O)O
71 4,98 4,68 0,22 8,74 C1=CC(=C(C=C1C2=C(C=C3C(=CC(=CC3=[O+]2)O)O)O)O)O
72 4,30 4,75 7,64 9,64 OC1=C(C=C(O)C(C3=CC=C(O)C=C3)=[O]2)C2=CC(O)=C1
73 3,92 3,69 0,00 2,04 OC1=C(C=CC(C3=CC=C(O)C=C3)=[O]2)C2=CC(O)=C1
74 3,17 2,66
5,28 5,41 O=C1C2=C(O)C=C(O[C@H]3[C@H](O)[C@@H](O)[C@H](O)[
C@@H](COC(C)=O)O3)C=C2OC=C1C4=CC=C(O)C=C4
75 2,63 3,20 7,87 6,05 O=C2C1=C(O)C=C(O)C=C1OC=C2C3=CC=C(OC)C=C3
76 2,44 3,18 0,00 0,00 C1=CC(=CC=C1C2=COC3=C(C2=O)C=CC(=C3)O)O
77 0,25 1,84
2,88 9,05 C1=CC(=CC=C1C2=COC3=C(C2=O)C=CC(=C3)O[C@H]4[C
@@H]([C@H]([C@@H]([C@H](O4)CO)O)O)O)O
78 2,12 2,25 6,38 2,46 COC1=CC=C(C=C1)C2=COC3=CC(=CC(=C3C2=O)O)OC
79 2,26 2,39 9,80 2,07 COC1=CC=C(C=C1)C2=COC3=C(C2=O)C=CC(=C3)OC
80 1,88 3,14 9,45 1,94 O=C1C(C3=CC=C(OC)C=C3)=COC2=C1C=CC(O)=C2
81 2,90 2,22 0,00 0,00 O=C2C1=C(O)C=C(O)C=C1OC=C2C3=CC=C(O)C=C3
82 2,93 3,39
6,02 8,69 C1=CC(=CC=C1C2=COC3=CC(=CC(=C3C2=O)O)O[C@H]4[C
@@H]([C@H]([C@@H]([C@H](O4)CO)O)O)O)O
83 2,32 3,47 9,37 9,36 COC1=C(C=C2C(=C1)C(=O)C(=CO2)C3=CC=C(C=C3)O)O
84 2,50 2,07
3,15 8,46 COC1=C(C=C2C(=C1)C(=O)C(=CO2)C3=CC=C(C=C3)O)O[C
@H]4[C@@H]([C@H]([C@@H]([C@H](O4)CO)O)O)O
85 2,99 3,05 0,01 0,00 O=C1C(C3=CC=CC=C3)=COC2=C1C=CC(O)=C2
86 1,96 3,18 7,00 7,01 O=C1C(C3=CC=CC=C3)=COC2=C1C=C(OC)C(O)=C2
87 0,52 2,24 0,00 0,00 O=C2C1=CC=CC=C1OC=C2C3=CC=CC=C3
3
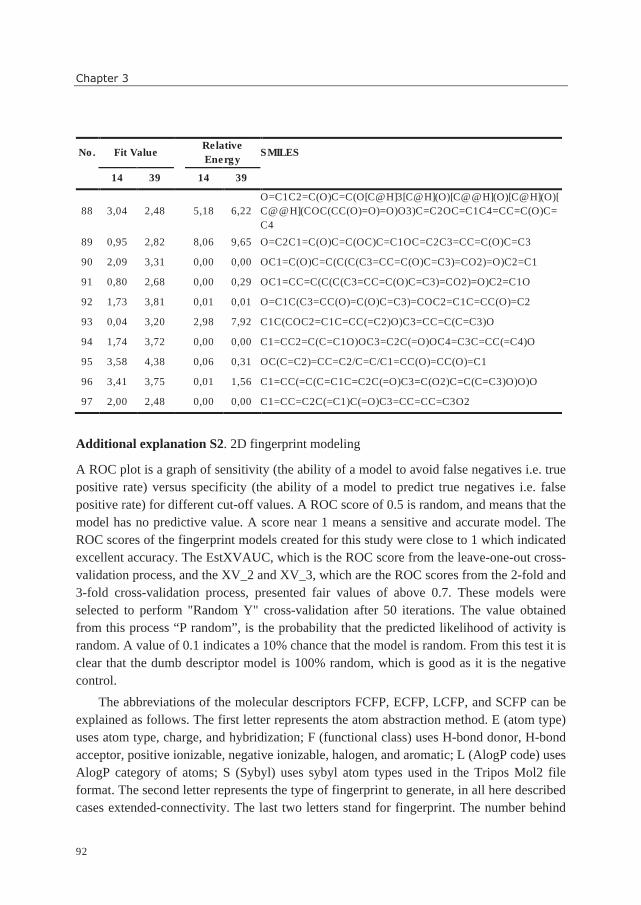
Chapter 3
92
No. Fit Value Relative
Energy SMILES
14 39 14 39
88 3,04 2,48
5,18 6,22
O=C1C2=C(O)C=C(O[C@H]3[C@H](O)[C@@H](O)[C@H](O)[
C@@H](COC(CC(O)=O)=O)O3)C=C2OC=C1C4=CC=C(O)C=
C4
89 0,95 2,82 8,06 9,65 O=C2C1=C(O)C=C(OC)C=C1OC=C2C3=CC=C(O)C=C3
90 2,09 3,31 0,00 0,00 OC1=C(O)C=C(C(C(C3=CC=C(O)C=C3)=CO2)=O)C2=C1
91 0,80 2,68 0,00 0,29 OC1=CC=C(C(C(C3=CC=C(O)C=C3)=CO2)=O)C2=C1O
92 1,73 3,81 0,01 0,01 O=C1C(C3=CC(O)=C(O)C=C3)=COC2=C1C=CC(O)=C2
93 0,04 3,20 2,98 7,92 C1C(COC2=C1C=CC(=C2)O)C3=CC=C(C=C3)O
94 1,74 3,72 0,00 0,00 C1=CC2=C(C=C1O)OC3=C2C(=O)OC4=C3C=CC(=C4)O
95 3,58 4,38 0,06 0,31 OC(C=C2)=CC=C2/C=C/C1=CC(O)=CC(O)=C1
96 3,41 3,75 0,01 1,56 C1=CC(=C(C=C1C=C2C(=O)C3=C(O2)C=C(C=C3)O)O)O
97 2,00 2,48 0,00 0,00 C1=CC=C2C(=C1)C(=O)C3=CC=CC=C3O2
Additional explanation S2. 2D fingerprint modeling
A ROC plot is a graph of sensitivity (the ability of a model to avoid false negatives i.e. true
positive rate) versus specificity (the ability of a model to predict true negatives i.e. false
positive rate) for different cut-off values. A ROC score of 0.5 is random, and means that the
model has no predictive value. A score near 1 means a sensitive and accurate model. The
ROC scores of the fingerprint models created for this study were close to 1 which indicated
excellent accuracy. The EstXVAUC, which is the ROC score from the leave-one-out cross-
validation process, and the XV_2 and XV_3, which are the ROC scores from the 2-fold and
3-fold cross-validation process, presented fair values of above 0.7. These models were
selected to perform "Random Y" cross-validation after 50 iterations. The value obtained
from this process “P random”, is the probability that the predicted likelihood of activity is
random. A value of 0.1 indicates a 10% chance that the model is random. From this test it is
clear that the dumb descriptor model is 100% random, which is good as it is the negative
control.
The abbreviations of the molecular descriptors FCFP, ECFP, LCFP, and SCFP can be
explained as follows. The first letter represents the atom abstraction method. E (atom type)
uses atom type, charge, and hybridization; F (functional class) uses H-bond donor, H-bond
acceptor, positive ionizable, negative ionizable, halogen, and aromatic; L (AlogP code) uses
AlogP category of atoms; S (Sybyl) uses sybyl atom types used in the Tripos Mol2 file
format. The second letter represents the type of fingerprint to generate, in all here described
cases extended-connectivity. The last two letters stand for fingerprint. The number behind
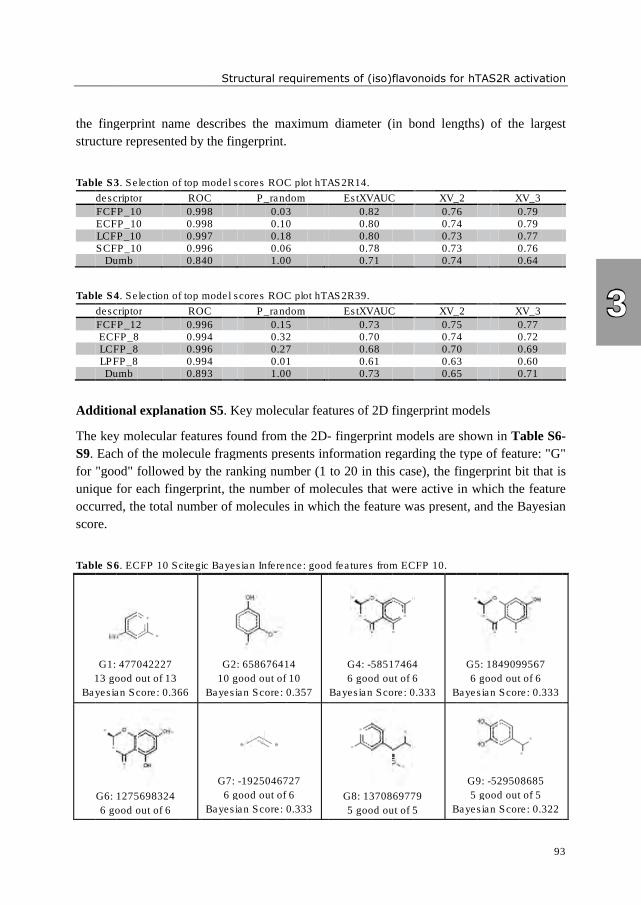
the fingerprint name describes the maximum diameter (in bond l
structure represented by the fingerprint.
Table S3
Table S4
Additional explanation S5
The key molecular features found from the 2D
S9. Each of the molecule fragments presents information regarding the type of feature: "G"
for "good" followed by the ranking number (1 to 20 in this case), the fingerpr
unique for each fingerprint, the number of molecules that were active in which the feature
occurred, the total number of molecules in which the feature was present, and the Bayesian
score.
Table S6
13 good out of 13
Bayesian Score: 0.366
the fingerprint name describes the maximum diameter (in bond l
structure represented by the fingerprint.
Table S3
descriptor
FCFP_10ECFP_10LCFP_10SCFP_10
Dumb
Table S4
descriptor
FCFP_12ECFP_8LCFP_8LPFP_8Dumb
Additional explanation S5
The key molecular features found from the 2D
. Each of the molecule fragments presents information regarding the type of feature: "G"
for "good" followed by the ranking number (1 to 20 in this case), the fingerpr
unique for each fingerprint, the number of molecules that were active in which the feature
occurred, the total number of molecules in which the feature was present, and the Bayesian
score.
Table S6
G1: 477042227
13 good out of 13
Bayesian Score: 0.366
G6: 1275698324
6 good out of 6
the fingerprint name describes the maximum diameter (in bond l
structure represented by the fingerprint.
Table S3. Selection of top model scores ROC plot hTAS2R14
descriptor
FCFP_10ECFP_10LCFP_10SCFP_10
Dumb
Table S4. Selection of top model scores ROC plot hTAS2R39
descriptor
FCFP_12ECFP_8LCFP_8LPFP_8Dumb
Additional explanation S5
The key molecular features found from the 2D
. Each of the molecule fragments presents information regarding the type of feature: "G"
for "good" followed by the ranking number (1 to 20 in this case), the fingerpr
unique for each fingerprint, the number of molecules that were active in which the feature
occurred, the total number of molecules in which the feature was present, and the Bayesian
Table S6. ECFP 10 Scitegic Bayesian Inference: goo
G1: 477042227
13 good out of 13
Bayesian Score: 0.366
G6: 1275698324
6 good out of 6
the fingerprint name describes the maximum diameter (in bond l
structure represented by the fingerprint.
election of top model scores ROC plot hTAS2R14
descriptor
FCFP_10 ECFP_10 LCFP_10 SCFP_10
election of top model scores ROC plot hTAS2R39
descriptor
FCFP_12 ECFP_8 LCFP_8 LPFP_8
Additional explanation S5
The key molecular features found from the 2D
. Each of the molecule fragments presents information regarding the type of feature: "G"
for "good" followed by the ranking number (1 to 20 in this case), the fingerpr
unique for each fingerprint, the number of molecules that were active in which the feature
occurred, the total number of molecules in which the feature was present, and the Bayesian
CFP 10 Scitegic Bayesian Inference: goo
G1: 477042227
13 good out of 13
Bayesian Score: 0.366
G6: 1275698324
6 good out of 6
the fingerprint name describes the maximum diameter (in bond l
structure represented by the fingerprint.
election of top model scores ROC plot hTAS2R14
election of top model scores ROC plot hTAS2R39
Additional explanation S5
The key molecular features found from the 2D
. Each of the molecule fragments presents information regarding the type of feature: "G"
for "good" followed by the ranking number (1 to 20 in this case), the fingerpr
unique for each fingerprint, the number of molecules that were active in which the feature
occurred, the total number of molecules in which the feature was present, and the Bayesian
CFP 10 Scitegic Bayesian Inference: goo
G1: 477042227
13 good out of 13
Bayesian Score: 0.366
G6: 1275698324
6 good out of 6
the fingerprint name describes the maximum diameter (in bond l
structure represented by the fingerprint.
election of top model scores ROC plot hTAS2R14
ROC
0.9980.9980.9970.9960.840
election of top model scores ROC plot hTAS2R39
ROC
0.9960.9940.9960.9940.893
Additional explanation S5
The key molecular features found from the 2D
. Each of the molecule fragments presents information regarding the type of feature: "G"
for "good" followed by the ranking number (1 to 20 in this case), the fingerpr
unique for each fingerprint, the number of molecules that were active in which the feature
occurred, the total number of molecules in which the feature was present, and the Bayesian
CFP 10 Scitegic Bayesian Inference: goo
Bayesian Score: 0.366
Structural requirements of
the fingerprint name describes the maximum diameter (in bond l
structure represented by the fingerprint.
election of top model scores ROC plot hTAS2R14
ROC
0.998 0.998 0.997 0.996 0.840
election of top model scores ROC plot hTAS2R39
ROC
0.996 0.994 0.996 0.994 0.893
Additional explanation S5
The key molecular features found from the 2D
. Each of the molecule fragments presents information regarding the type of feature: "G"
for "good" followed by the ranking number (1 to 20 in this case), the fingerpr
unique for each fingerprint, the number of molecules that were active in which the feature
occurred, the total number of molecules in which the feature was present, and the Bayesian
CFP 10 Scitegic Bayesian Inference: goo
G2: 658676414
10 good out of 10
Bayesian Score: 0.357
G7:
Bayesian Score: 0.333
Structural requirements of
the fingerprint name describes the maximum diameter (in bond l
structure represented by the fingerprint.
election of top model scores ROC plot hTAS2R14
election of top model scores ROC plot hTAS2R39
Additional explanation S5. Key molecular features of 2D fingerprint models
The key molecular features found from the 2D
. Each of the molecule fragments presents information regarding the type of feature: "G"
for "good" followed by the ranking number (1 to 20 in this case), the fingerpr
unique for each fingerprint, the number of molecules that were active in which the feature
occurred, the total number of molecules in which the feature was present, and the Bayesian
CFP 10 Scitegic Bayesian Inference: goo
G2: 658676414
10 good out of 10
Bayesian Score: 0.357
G7: -1925046727
6 good out of 6
Bayesian Score: 0.333
Structural requirements of
the fingerprint name describes the maximum diameter (in bond l
structure represented by the fingerprint.
election of top model scores ROC plot hTAS2R14
P_random
election of top model scores ROC plot hTAS2R39
P_random
ey molecular features of 2D fingerprint models
The key molecular features found from the 2D
. Each of the molecule fragments presents information regarding the type of feature: "G"
for "good" followed by the ranking number (1 to 20 in this case), the fingerpr
unique for each fingerprint, the number of molecules that were active in which the feature
occurred, the total number of molecules in which the feature was present, and the Bayesian
CFP 10 Scitegic Bayesian Inference: goo
G2: 658676414
10 good out of 10
Bayesian Score: 0.357
1925046727
6 good out of 6
Bayesian Score: 0.333
Structural requirements of
the fingerprint name describes the maximum diameter (in bond l
structure represented by the fingerprint.
election of top model scores ROC plot hTAS2R14
P_random
0.030.100.180.061.00
election of top model scores ROC plot hTAS2R39
P_random
0.150.320.270.011.00
ey molecular features of 2D fingerprint models
The key molecular features found from the 2D
. Each of the molecule fragments presents information regarding the type of feature: "G"
for "good" followed by the ranking number (1 to 20 in this case), the fingerpr
unique for each fingerprint, the number of molecules that were active in which the feature
occurred, the total number of molecules in which the feature was present, and the Bayesian
CFP 10 Scitegic Bayesian Inference: goo
G2: 658676414
10 good out of 10
Bayesian Score: 0.357
1925046727
6 good out of 6
Bayesian Score: 0.333
Structural requirements of
the fingerprint name describes the maximum diameter (in bond l
structure represented by the fingerprint.
election of top model scores ROC plot hTAS2R14
P_random
0.03 0.10 0.18 0.06 1.00
election of top model scores ROC plot hTAS2R39
P_random
0.15 0.32 0.27 0.01 1.00
ey molecular features of 2D fingerprint models
The key molecular features found from the 2D
. Each of the molecule fragments presents information regarding the type of feature: "G"
for "good" followed by the ranking number (1 to 20 in this case), the fingerpr
unique for each fingerprint, the number of molecules that were active in which the feature
occurred, the total number of molecules in which the feature was present, and the Bayesian
CFP 10 Scitegic Bayesian Inference: goo
G2: 658676414
10 good out of 10
Bayesian Score: 0.357
1925046727
6 good out of 6
Bayesian Score: 0.333
Structural requirements of
the fingerprint name describes the maximum diameter (in bond l
election of top model scores ROC plot hTAS2R14
election of top model scores ROC plot hTAS2R39
ey molecular features of 2D fingerprint models
The key molecular features found from the 2D-
. Each of the molecule fragments presents information regarding the type of feature: "G"
for "good" followed by the ranking number (1 to 20 in this case), the fingerpr
unique for each fingerprint, the number of molecules that were active in which the feature
occurred, the total number of molecules in which the feature was present, and the Bayesian
CFP 10 Scitegic Bayesian Inference: good features from ECFP 10
Bayesian Score: 0.357
Bayesian Score: 0.333
Structural requirements of
the fingerprint name describes the maximum diameter (in bond l
election of top model scores ROC plot hTAS2R14
EstXVAUC
election of top model scores ROC plot hTAS2R39
EstXVAUC
ey molecular features of 2D fingerprint models
- fingerprint models are shown in
. Each of the molecule fragments presents information regarding the type of feature: "G"
for "good" followed by the ranking number (1 to 20 in this case), the fingerpr
unique for each fingerprint, the number of molecules that were active in which the feature
occurred, the total number of molecules in which the feature was present, and the Bayesian
d features from ECFP 10
G4:
6 good out of 6
Bayesian Score: 0.333
G8: 1370869779
5 good out of 5
Structural requirements of (iso)flavonoid
the fingerprint name describes the maximum diameter (in bond l
election of top model scores ROC plot hTAS2R14.
EstXVAUC
0.820.800.800.780.71
election of top model scores ROC plot hTAS2R39.
EstXVAUC
0.730.700.680.610.73
ey molecular features of 2D fingerprint models
fingerprint models are shown in
. Each of the molecule fragments presents information regarding the type of feature: "G"
for "good" followed by the ranking number (1 to 20 in this case), the fingerpr
unique for each fingerprint, the number of molecules that were active in which the feature
occurred, the total number of molecules in which the feature was present, and the Bayesian
d features from ECFP 10
G4: -58517464
6 good out of 6
Bayesian Score: 0.333
G8: 1370869779
5 good out of 5
(iso)flavonoid
the fingerprint name describes the maximum diameter (in bond l
EstXVAUC
0.82 0.80 0.80 0.78 0.71
EstXVAUC
0.73 0.70 0.68 0.61 0.73
ey molecular features of 2D fingerprint models
fingerprint models are shown in
. Each of the molecule fragments presents information regarding the type of feature: "G"
for "good" followed by the ranking number (1 to 20 in this case), the fingerpr
unique for each fingerprint, the number of molecules that were active in which the feature
occurred, the total number of molecules in which the feature was present, and the Bayesian
d features from ECFP 10
58517464
6 good out of 6
Bayesian Score: 0.333
G8: 1370869779
5 good out of 5
(iso)flavonoid
the fingerprint name describes the maximum diameter (in bond l
EstXVAUC
EstXVAUC
ey molecular features of 2D fingerprint models
fingerprint models are shown in
. Each of the molecule fragments presents information regarding the type of feature: "G"
for "good" followed by the ranking number (1 to 20 in this case), the fingerpr
unique for each fingerprint, the number of molecules that were active in which the feature
occurred, the total number of molecules in which the feature was present, and the Bayesian
d features from ECFP 10
58517464
6 good out of 6
Bayesian Score: 0.333
G8: 1370869779
5 good out of 5
(iso)flavonoid
the fingerprint name describes the maximum diameter (in bond l
ey molecular features of 2D fingerprint models
fingerprint models are shown in
. Each of the molecule fragments presents information regarding the type of feature: "G"
for "good" followed by the ranking number (1 to 20 in this case), the fingerpr
unique for each fingerprint, the number of molecules that were active in which the feature
occurred, the total number of molecules in which the feature was present, and the Bayesian
d features from ECFP 10
58517464
6 good out of 6
Bayesian Score: 0.333
G8: 1370869779
5 good out of 5
(iso)flavonoids for
the fingerprint name describes the maximum diameter (in bond lengths) of the largest
XV_2
0.760.740.730.730.74
XV_2
0.750.740.700.630.65
ey molecular features of 2D fingerprint models
fingerprint models are shown in
. Each of the molecule fragments presents information regarding the type of feature: "G"
for "good" followed by the ranking number (1 to 20 in this case), the fingerpr
unique for each fingerprint, the number of molecules that were active in which the feature
occurred, the total number of molecules in which the feature was present, and the Bayesian
d features from ECFP 10.
Bayesian Score: 0.333 Bayesian Score: 0.333
Bayesian Score: 0.322
s for hTAS2R activation
engths) of the largest
XV_2
0.76 0.74 0.73 0.73 0.74
XV_2
0.75 0.74 0.70 0.63 0.65
ey molecular features of 2D fingerprint models
fingerprint models are shown in
. Each of the molecule fragments presents information regarding the type of feature: "G"
for "good" followed by the ranking number (1 to 20 in this case), the fingerpr
unique for each fingerprint, the number of molecules that were active in which the feature
occurred, the total number of molecules in which the feature was present, and the Bayesian
G5: 1849099567
6 good out of 6
Bayesian Score: 0.333
G9:
5 good out of 5
Bayesian Score: 0.322
hTAS2R activation
engths) of the largest
ey molecular features of 2D fingerprint models
fingerprint models are shown in
. Each of the molecule fragments presents information regarding the type of feature: "G"
for "good" followed by the ranking number (1 to 20 in this case), the fingerprint bit that is
unique for each fingerprint, the number of molecules that were active in which the feature
occurred, the total number of molecules in which the feature was present, and the Bayesian
G5: 1849099567
6 good out of 6
Bayesian Score: 0.333
G9: -529508685
5 good out of 5
Bayesian Score: 0.322
hTAS2R activation
engths) of the largest
XV_3
0.790.790.770.760.64
XV_3
0.770.720.690.600.71
fingerprint models are shown in Table S6
. Each of the molecule fragments presents information regarding the type of feature: "G"
int bit that is
unique for each fingerprint, the number of molecules that were active in which the feature
occurred, the total number of molecules in which the feature was present, and the Bayesian
G5: 1849099567
6 good out of 6
Bayesian Score: 0.333
529508685
5 good out of 5
Bayesian Score: 0.322
hTAS2R activation
engths) of the largest
XV_3
0.79 0.79 0.77 0.76 0.64
XV_3
0.77 0.72 0.69 0.60 0.71
Table S6
. Each of the molecule fragments presents information regarding the type of feature: "G"
int bit that is
unique for each fingerprint, the number of molecules that were active in which the feature
occurred, the total number of molecules in which the feature was present, and the Bayesian
G5: 1849099567
6 good out of 6
Bayesian Score: 0.333
529508685
5 good out of 5
Bayesian Score: 0.322
hTAS2R activation
93
engths) of the largest
Table S6-
. Each of the molecule fragments presents information regarding the type of feature: "G"
int bit that is
unique for each fingerprint, the number of molecules that were active in which the feature
occurred, the total number of molecules in which the feature was present, and the Bayesian
G5: 1849099567
6 good out of 6
Bayesian Score: 0.333
529508685
5 good out of 5
Bayesian Score: 0.322
hTAS2R activation
93
engths) of the largest
-
. Each of the molecule fragments presents information regarding the type of feature: "G"
int bit that is
unique for each fingerprint, the number of molecules that were active in which the feature
occurred, the total number of molecules in which the feature was present, and the Bayesian
3
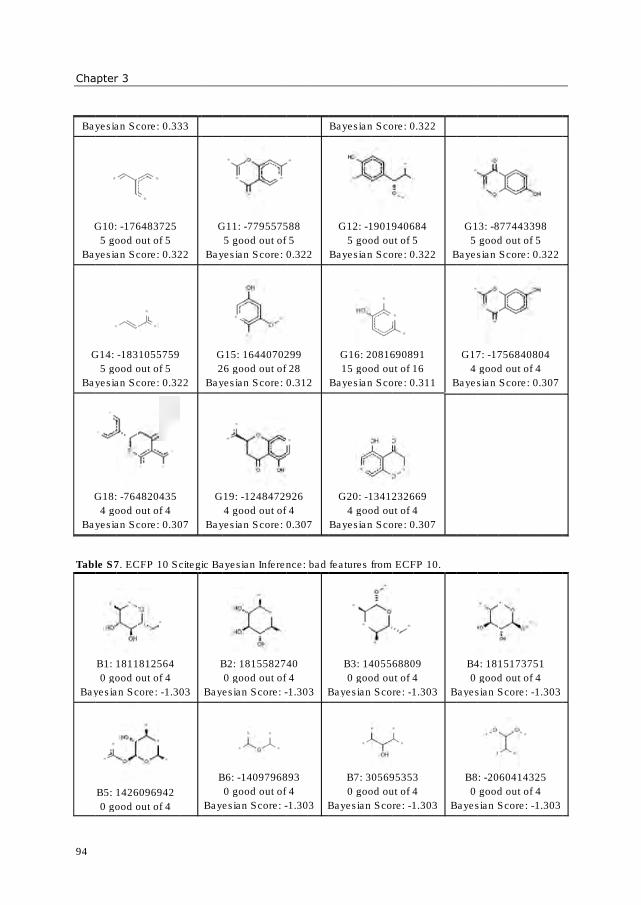
Chapter 3
94
Bayesian Score: 0.333
G10:
Bayesian Score: 0.322
G14:
Bayesian Score: 0.322
G18:
Bayesian
Table S7
Bayesian
Chapter 3
Bayesian Score: 0.333
G10:
5 good out of 5
Bayesian Score: 0.322
G14:
5 good out of 5
Bayesian Score: 0.322
G18:
4 good out of 4
Bayesian
Table S7
B1: 1811812564
0 good out of 4
Bayesian
B5: 1426096942
0 good out of 4
Chapter 3
Bayesian Score: 0.333
G10: -176483725
5 good out of 5
Bayesian Score: 0.322
G14: -1831055759
5 good out of 5
Bayesian Score: 0.322
G18: -764820435
4 good out of 4
Bayesian Score: 0.307
Table S7. ECFP 10 Scitegic Bayesian Inference: bad features from ECFP 10
B1: 1811812564
0 good out of 4
Bayesian Score:
B5: 1426096942
0 good out of 4
Bayesian Score: 0.333
176483725
5 good out of 5
Bayesian Score: 0.322
1831055759
5 good out of 5
Bayesian Score: 0.322
764820435
4 good out of 4
Score: 0.307
CFP 10 Scitegic Bayesian Inference: bad features from ECFP 10
B1: 1811812564
0 good out of 4
Score:
B5: 1426096942
0 good out of 4
Bayesian Score: 0.333
176483725
5 good out of 5
Bayesian Score: 0.322
1831055759
5 good out of 5
Bayesian Score: 0.322
764820435
4 good out of 4
Score: 0.307
CFP 10 Scitegic Bayesian Inference: bad features from ECFP 10
B1: 1811812564
0 good out of 4
Score: -1.303
B5: 1426096942
0 good out of 4
Bayesian Score: 0.333
Bayesian Score: 0.322
Bayesian Score: 0.322
Score: 0.307
CFP 10 Scitegic Bayesian Inference: bad features from ECFP 10
1.303
G11:
Bayesian Score: 0.322
G15: 1644070299
26 good out of 28
Bayesian Score: 0.312
G19:
Bayesian Score: 0.307
CFP 10 Scitegic Bayesian Inference: bad features from ECFP 10
B2: 1815582740
Bayesian Score:
B6:
Bayesian Score:
G11: -
5 good out of 5
Bayesian Score: 0.322
G15: 1644070299
26 good out of 28
Bayesian Score: 0.312
G19: -
4 good out of 4
Bayesian Score: 0.307
CFP 10 Scitegic Bayesian Inference: bad features from ECFP 10
B2: 1815582740
0 good out of 4
Bayesian Score:
B6: -1409796893
0 good out of 4
Bayesian Score:
-779557588
5 good out of 5
Bayesian Score: 0.322
G15: 1644070299
26 good out of 28
Bayesian Score: 0.312
-1248472926
4 good out of 4
Bayesian Score: 0.307
CFP 10 Scitegic Bayesian Inference: bad features from ECFP 10
B2: 1815582740
0 good out of 4
Bayesian Score:
1409796893
0 good out of 4
Bayesian Score:
779557588
5 good out of 5
Bayesian Score: 0.322
G15: 1644070299
26 good out of 28
Bayesian Score: 0.312
1248472926
4 good out of 4
Bayesian Score: 0.307
CFP 10 Scitegic Bayesian Inference: bad features from ECFP 10
B2: 1815582740
0 good out of 4
Bayesian Score: -
1409796893
0 good out of 4
Bayesian Score: -
779557588
5 good out of 5
Bayesian Score: 0.322
G15: 1644070299
26 good out of 28
Bayesian Score: 0.312
1248472926
4 good out of 4
Bayesian Score: 0.307
CFP 10 Scitegic Bayesian Inference: bad features from ECFP 10
B2: 1815582740
0 good out of 4
-1.303
1409796893
0 good out of 4
-1.303
Bayesian Score: 0.322
Bayesian Score: 0.312
Bayesian Score: 0.307
CFP 10 Scitegic Bayesian Inference: bad features from ECFP 10
1.303 Bayesian Score:
1.303 Bayesian Score:
Bayesian Score: 0.322
G12:
5 good out of 5
Bayesian Score: 0.322
G16: 2081690891
15 good out of 16
Bayesian Score: 0.311
G20:
4 good out of 4
Bayesian Score: 0.307
CFP 10 Scitegic Bayesian Inference: bad features from ECFP 10
B3: 1405568809
0 good out of 4
Bayesian Score:
B7: 305695353
0 good out of 4
Bayesian Score:
Bayesian Score: 0.322
G12: -1901940684
5 good out of 5
Bayesian Score: 0.322
G16: 2081690891
15 good out of 16
Bayesian Score: 0.311
G20: -1341232669
4 good out of 4
Bayesian Score: 0.307
CFP 10 Scitegic Bayesian Inference: bad features from ECFP 10
B3: 1405568809
0 good out of 4
Bayesian Score:
B7: 305695353
0 good out of 4
Bayesian Score:
Bayesian Score: 0.322
1901940684
5 good out of 5
Bayesian Score: 0.322
G16: 2081690891
15 good out of 16
Bayesian Score: 0.311
1341232669
4 good out of 4
Bayesian Score: 0.307
CFP 10 Scitegic Bayesian Inference: bad features from ECFP 10
B3: 1405568809
0 good out of 4
Bayesian Score: -1.303
B7: 305695353
0 good out of 4
Bayesian Score: -1.303
Bayesian Score: 0.322
1901940684
5 good out of 5
Bayesian Score: 0.322
G16: 2081690891
15 good out of 16
Bayesian Score: 0.311
1341232669
4 good out of 4
Bayesian Score: 0.307
CFP 10 Scitegic Bayesian Inference: bad features from ECFP 10
B3: 1405568809
0 good out of 4
1.303
B7: 305695353
0 good out of 4
1.303
Bayesian Score: 0.322
Bayesian Score: 0.322 Bayesian Score: 0.322
Bayesian Score: 0.311 Bayesian Score: 0.307
Bayesian Score: 0.307
CFP 10 Scitegic Bayesian Inference: bad features from ECFP 10.
1.303 Bayesian Score:
1.303 Bayesian Score:
G13:
5 good out of 5
Bayesian Score: 0.322
G17:
4 good out of 4
Bayesian Score: 0.307
B4: 1815173751
0 good out of 4
Bayesian Score:
B8:
0 good out of 4
Bayesian Score:
G13: -877443398
5 good out of 5
Bayesian Score: 0.322
G17: -1756840804
4 good out of 4
Bayesian Score: 0.307
B4: 1815173751
0 good out of 4
Bayesian Score:
B8: -2060414325
0 good out of 4
Bayesian Score:
877443398
5 good out of 5
Bayesian Score: 0.322
1756840804
4 good out of 4
Bayesian Score: 0.307
B4: 1815173751
0 good out of 4
Bayesian Score:
2060414325
0 good out of 4
Bayesian Score:
877443398
5 good out of 5
Bayesian Score: 0.322
1756840804
4 good out of 4
Bayesian Score: 0.307
B4: 1815173751
0 good out of 4
Bayesian Score: -1.303
2060414325
0 good out of 4
Bayesian Score: -1.303
877443398
5 good out of 5
Bayesian Score: 0.322
1756840804
4 good out of 4
Bayesian Score: 0.307
B4: 1815173751
0 good out of 4
1.303
2060414325
0 good out of 4
1.303
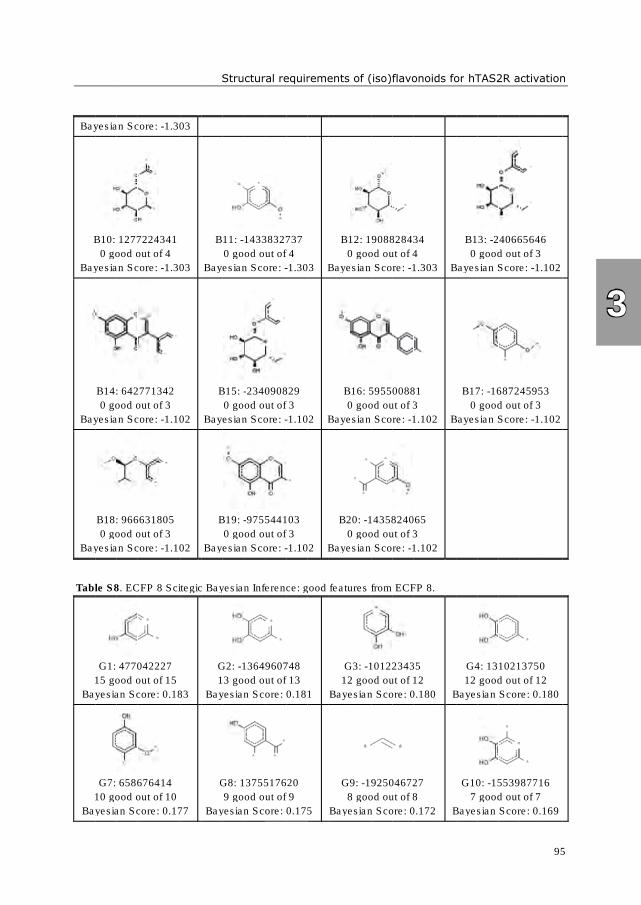
Bayesian Score:
B10: 1277224341
Bayesian Score:
Bayesian Score:
Bayesian Score:
Table S8
15 good out of 15
Bayesian Score: 0.183
10 good out of 10
Bayesian Score: 0.177
Bayesian Score:
B10: 1277224341
0 good out of 4
Bayesian Score:
B14: 642771342
0 good out of 3
Bayesian Score:
B18: 966631805
0 good out of 3
Bayesian Score:
Table S8
G1: 477042227
15 good out of 15
Bayesian Score: 0.183
G7: 658676414
10 good out of 10
Bayesian Score: 0.177
Bayesian Score:
B10: 1277224341
0 good out of 4
Bayesian Score:
B14: 642771342
0 good out of 3
Bayesian Score:
B18: 966631805
0 good out of 3
Bayesian Score:
Table S8. ECFP 8 Scitegic Bayesian Inference: good features from ECFP 8
G1: 477042227
15 good out of 15
Bayesian Score: 0.183
G7: 658676414
10 good out of 10
Bayesian Score: 0.177
Bayesian Score:
B10: 1277224341
0 good out of 4
Bayesian Score:
B14: 642771342
0 good out of 3
Bayesian Score:
B18: 966631805
0 good out of 3
Bayesian Score:
CFP 8 Scitegic Bayesian Inference: good features from ECFP 8
G1: 477042227
15 good out of 15
Bayesian Score: 0.183
G7: 658676414
10 good out of 10
Bayesian Score: 0.177
Bayesian Score: -1.303
B10: 1277224341
0 good out of 4
Bayesian Score: -1.303
B14: 642771342
0 good out of 3
Bayesian Score: -1.102
B18: 966631805
0 good out of 3
Bayesian Score: -1.102
CFP 8 Scitegic Bayesian Inference: good features from ECFP 8
G1: 477042227
15 good out of 15
Bayesian Score: 0.183
G7: 658676414
10 good out of 10
Bayesian Score: 0.177
1.303
1.303
1.102
1.102
CFP 8 Scitegic Bayesian Inference: good features from ECFP 8
Bayesian Score: 0.183
Bayesian Score: 0.177
Structural requirements of
B11:
Bayesian Score:
B15:
Bayesian Score:
B19:
Bayesian Score:
CFP 8 Scitegic Bayesian Inference: good features from ECFP 8
G2:
13 good out of 13
Bayesian
G8: 1375517620
Bayesian Score: 0.175
Structural requirements of
B11: -1433832737
0 good out of 4
Bayesian Score:
B15: -
0 good out of 3
Bayesian Score:
B19: -
0 good out of 3
Bayesian Score:
CFP 8 Scitegic Bayesian Inference: good features from ECFP 8
G2: -1364960748
13 good out of 13
Bayesian
G8: 1375517620
9 good out of 9
Bayesian Score: 0.175
Structural requirements of
1433832737
0 good out of 4
Bayesian Score:
-234090829
0 good out of 3
Bayesian Score:
-975544103
0 good out of 3
Bayesian Score:
CFP 8 Scitegic Bayesian Inference: good features from ECFP 8
1364960748
13 good out of 13
Bayesian Score: 0.181
G8: 1375517620
9 good out of 9
Bayesian Score: 0.175
Structural requirements of
1433832737
0 good out of 4
Bayesian Score: -
234090829
0 good out of 3
Bayesian Score: -
975544103
0 good out of 3
Bayesian Score: -
CFP 8 Scitegic Bayesian Inference: good features from ECFP 8
1364960748
13 good out of 13
Score: 0.181
G8: 1375517620
9 good out of 9
Bayesian Score: 0.175
Structural requirements of
1433832737
0 good out of 4
-1.303
234090829
0 good out of 3
-1.102
975544103
0 good out of 3
-1.102
CFP 8 Scitegic Bayesian Inference: good features from ECFP 8
1364960748
13 good out of 13
Score: 0.181
G8: 1375517620
9 good out of 9
Bayesian Score: 0.175
Structural requirements of
1.303 Bayesian Score:
1.102 Bayesian Score:
1.102 Bayesian Score:
CFP 8 Scitegic Bayesian Inference: good features from ECFP 8
Score: 0.181
Bayesian Score: 0.175
Structural requirements of
B12: 1908828434
0 good out of 4
Bayesian Score:
B16: 595500881
0 good out of 3
Bayesian Score:
B20:
0 good out of 3
Bayesian Score:
CFP 8 Scitegic Bayesian Inference: good features from ECFP 8
G3:
12 good out of 12
Bayesian Score: 0.180
G9:
8 good out of 8
Bayesian Score: 0.172
Structural requirements of (iso)flavonoid
B12: 1908828434
0 good out of 4
Bayesian Score:
B16: 595500881
0 good out of 3
Bayesian Score:
B20: -1435824065
0 good out of 3
Bayesian Score:
CFP 8 Scitegic Bayesian Inference: good features from ECFP 8
G3: -101223435
12 good out of 12
Bayesian Score: 0.180
G9: -1925046727
8 good out of 8
Bayesian Score: 0.172
(iso)flavonoid
B12: 1908828434
0 good out of 4
Bayesian Score:
B16: 595500881
0 good out of 3
Bayesian Score:
1435824065
0 good out of 3
Bayesian Score:
CFP 8 Scitegic Bayesian Inference: good features from ECFP 8
101223435
12 good out of 12
Bayesian Score: 0.180
1925046727
8 good out of 8
Bayesian Score: 0.172
(iso)flavonoid
B12: 1908828434
0 good out of 4
Bayesian Score: -1.303
B16: 595500881
0 good out of 3
Bayesian Score: -1.102
1435824065
0 good out of 3
Bayesian Score: -1.102
CFP 8 Scitegic Bayesian Inference: good features from ECFP 8
101223435
12 good out of 12
Bayesian Score: 0.180
1925046727
8 good out of 8
Bayesian Score: 0.172
(iso)flavonoid
B12: 1908828434
0 good out of 4
1.303
B16: 595500881
0 good out of 3
1.102
1435824065
0 good out of 3
1.102
CFP 8 Scitegic Bayesian Inference: good features from ECFP 8.
101223435
12 good out of 12
Bayesian Score: 0.180
1925046727
8 good out of 8
Bayesian Score: 0.172
(iso)flavonoids for
1.303 Bayesian Score:
1.102 Bayesian Score:
1.102
.
Bayesian Score: 0.180 Bayesian Score: 0.180
Bayesian Score: 0.172 Bayesian Score: 0.169
s for hTAS2R activation
B13:
0 good out of 3
Bayesian Score:
B17:
0 good out of 3
Bayesian Score:
G4: 1310213750
12 good out of 12
Bayesian Score: 0.180
G10:
7 good out of 7
Bayesian Score: 0.169
hTAS2R activation
B13: -240665646
0 good out of 3
Bayesian Score:
B17: -1687245953
0 good out of 3
Bayesian Score:
G4: 1310213750
12 good out of 12
Bayesian Score: 0.180
G10: -1553987716
7 good out of 7
Bayesian Score: 0.169
hTAS2R activation
240665646
0 good out of 3
Bayesian Score:
1687245953
0 good out of 3
Bayesian Score:
G4: 1310213750
12 good out of 12
Bayesian Score: 0.180
1553987716
7 good out of 7
Bayesian Score: 0.169
hTAS2R activation
240665646
0 good out of 3
Bayesian Score: -1.102
1687245953
0 good out of 3
Bayesian Score: -1.102
G4: 1310213750
12 good out of 12
Bayesian Score: 0.180
1553987716
7 good out of 7
Bayesian Score: 0.169
hTAS2R activation
95
240665646
0 good out of 3
1.102
1687245953
0 good out of 3
1.102
G4: 1310213750
12 good out of 12
Bayesian Score: 0.180
1553987716
7 good out of 7
Bayesian Score: 0.169
hTAS2R activation
95
3
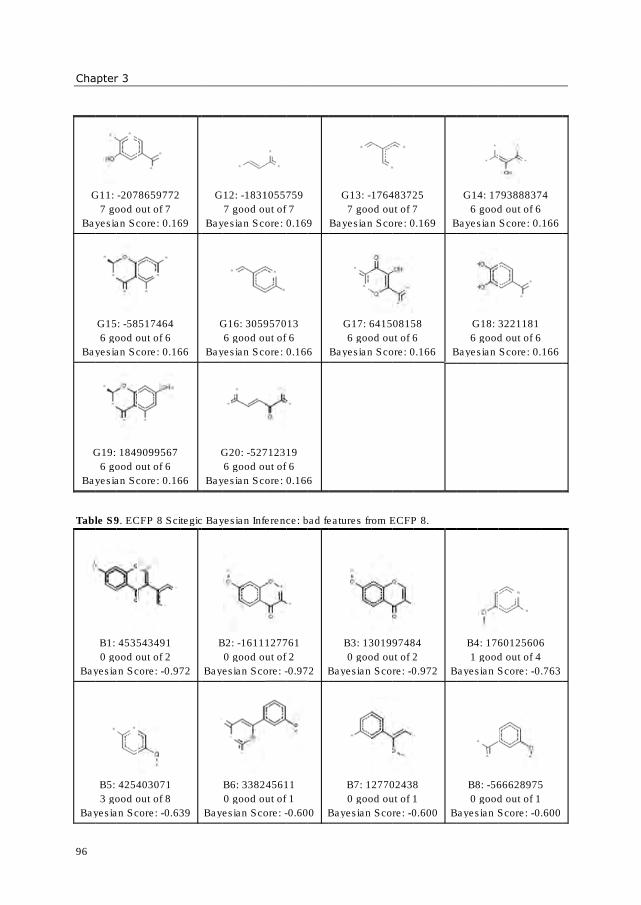
Chapter 3
96
G11:
Bayesian Score: 0.169
Bayesian Score: 0.166
G19: 1849099567
Bayesian Score: 0.166
Table S9
Bayesian Score:
Bayesian Score:
Chapter 3
G11:
7 good out of 7
Bayesian Score: 0.169
G15:
6 good out of 6
Bayesian Score: 0.166
G19: 1849099567
6 good out of 6
Bayesian Score: 0.166
Table S9
B1: 453543491
0 good out of 2
Bayesian Score:
B5: 425403071
3 good out of 8
Bayesian Score:
Chapter 3
G11: -2078659772
7 good out of 7
Bayesian Score: 0.169
G15: -58517464
6 good out of 6
Bayesian Score: 0.166
G19: 1849099567
6 good out of 6
Bayesian Score: 0.166
Table S9. ECFP 8 Scitegic
B1: 453543491
0 good out of 2
Bayesian Score:
B5: 425403071
3 good out of 8
Bayesian Score:
2078659772
7 good out of 7
Bayesian Score: 0.169
58517464
6 good out of 6
Bayesian Score: 0.166
G19: 1849099567
6 good out of 6
Bayesian Score: 0.166
CFP 8 Scitegic
B1: 453543491
0 good out of 2
Bayesian Score:
B5: 425403071
3 good out of 8
Bayesian Score:
2078659772
7 good out of 7
Bayesian Score: 0.169
58517464
6 good out of 6
Bayesian Score: 0.166
G19: 1849099567
6 good out of 6
Bayesian Score: 0.166
CFP 8 Scitegic
B1: 453543491
0 good out of 2
Bayesian Score: -0.972
B5: 425403071
3 good out of 8
Bayesian Score: -0.639
Bayesian Score: 0.169
Bayesian Score: 0.166
Bayesian Score: 0.166
CFP 8 Scitegic
0.972
0.639
G12:
Bayesian Score: 0.169
G16: 305957013
Bayesian Score: 0.166
G20:
Bayesian Score: 0.166
CFP 8 Scitegic Bayesian Inference: bad features from ECFP 8
B2:
Bayesian Score:
Bayesian Score:
G12: -
7 good out of 7
Bayesian Score: 0.169
G16: 305957013
6 good out of 6
Bayesian Score: 0.166
G20:
6 good out of 6
Bayesian Score: 0.166
Bayesian Inference: bad features from ECFP 8
B2: -1611127761
0 good out of 2
Bayesian Score:
B6: 338245611
0 good out of 1
Bayesian Score:
-1831055759
7 good out of 7
Bayesian Score: 0.169
G16: 305957013
6 good out of 6
Bayesian Score: 0.166
G20: -52712319
6 good out of 6
Bayesian Score: 0.166
Bayesian Inference: bad features from ECFP 8
1611127761
0 good out of 2
Bayesian Score:
B6: 338245611
0 good out of 1
Bayesian Score:
1831055759
7 good out of 7
Bayesian Score: 0.169
G16: 305957013
6 good out of 6
Bayesian Score: 0.166
52712319
6 good out of 6
Bayesian Score: 0.166
Bayesian Inference: bad features from ECFP 8
1611127761
0 good out of 2
Bayesian Score: -
B6: 338245611
0 good out of 1
Bayesian Score: -
1831055759
7 good out of 7
Bayesian Score: 0.169
G16: 305957013
6 good out of 6
Bayesian Score: 0.166
52712319
6 good out of 6
Bayesian Score: 0.166
Bayesian Inference: bad features from ECFP 8
1611127761
0 good out of 2
-0.972
B6: 338245611
0 good out of 1
-0.600
Bayesian Score: 0.169
Bayesian Score: 0.166
Bayesian Score: 0.166
Bayesian Inference: bad features from ECFP 8
0.972 Bayesian Score:
0.600 Bayesian Score:
G13:
7 good out of 7
Bayesian Score: 0.169
G17: 641508158
6 good out of 6
Bayesian Score: 0.166
Bayesian Inference: bad features from ECFP 8
B3: 1301997484
0 good out of 2
Bayesian Score:
B7: 127702438
0 good out of 1
Bayesian Score:
G13: -176483725
7 good out of 7
Bayesian Score: 0.169
G17: 641508158
6 good out of 6
Bayesian Score: 0.166
Bayesian Inference: bad features from ECFP 8
B3: 1301997484
0 good out of 2
Bayesian Score:
B7: 127702438
0 good out of 1
Bayesian Score:
176483725
7 good out of 7
Bayesian Score: 0.169
G17: 641508158
6 good out of 6
Bayesian Score: 0.166
Bayesian Inference: bad features from ECFP 8
B3: 1301997484
0 good out of 2
Bayesian Score:
B7: 127702438
0 good out of 1
Bayesian Score:
176483725
7 good out of 7
Bayesian Score: 0.169
G17: 641508158
6 good out of 6
Bayesian Score: 0.166
Bayesian Inference: bad features from ECFP 8
B3: 1301997484
0 good out of 2
Bayesian Score: -0.972
B7: 127702438
0 good out of 1
Bayesian Score: -0.600
176483725
7 good out of 7
Bayesian Score: 0.169
G17: 641508158
6 good out of 6
Bayesian Score: 0.166
Bayesian Inference: bad features from ECFP 8.
B3: 1301997484
0 good out of 2
0.972
B7: 127702438
0 good out of 1
0.600
Bayesian Score: 0.169 Bayesian Score: 0.166
Bayesian Score: 0.166 Bayesian Score: 0.166
0.972 Bayesian Score:
0.600 Bayesian Score:
G14: 1793888374
6 good out of 6
Bayesian Score: 0.166
G18: 3221181
6 good out of 6
Bayesian Score: 0.166
B4: 1760125606
1 good out of
Bayesian Score:
B8:
0 good out of 1
Bayesian Score:
G14: 1793888374
6 good out of 6
Bayesian Score: 0.166
G18: 3221181
6 good out of 6
Bayesian Score: 0.166
B4: 1760125606
1 good out of
Bayesian Score:
B8: -566628975
0 good out of 1
Bayesian Score:
G14: 1793888374
6 good out of 6
Bayesian Score: 0.166
G18: 3221181
6 good out of 6
Bayesian Score: 0.166
B4: 1760125606
1 good out of
Bayesian Score:
566628975
0 good out of 1
Bayesian Score:
G14: 1793888374
6 good out of 6
Bayesian Score: 0.166
G18: 3221181
6 good out of 6
Bayesian Score: 0.166
B4: 1760125606
1 good out of 4
Bayesian Score: -0.763
566628975
0 good out of 1
Bayesian Score: -0.600
G14: 1793888374
6 good out of 6
Bayesian Score: 0.166
6 good out of 6
Bayesian Score: 0.166
B4: 1760125606
4
0.763
566628975
0 good out of 1
0.600
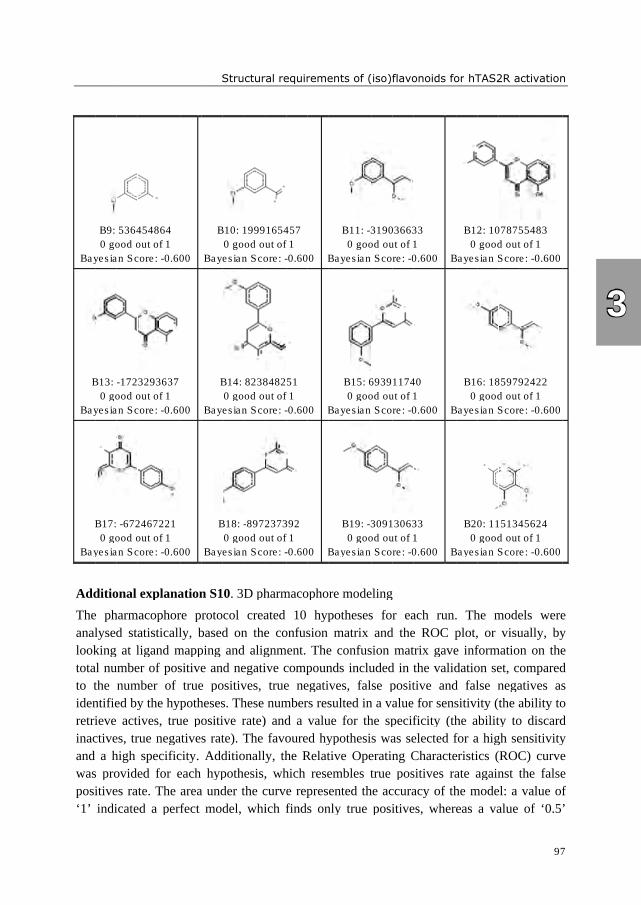
Bayesian Score:
B13:
Bayesian Score:
B17:
Bayesian Score:
Additional explanation S10
The pharmacophore protocol created 10 hypotheses for each run.
analysed statistically, based on the confusion matrix and the ROC plot, or visually, by
looking at ligand mapping and alignment. The confusion matrix gave
total number of positive and negative compounds included in the validation set, compared
to the number of true positives, true negatives, false positive and false negatives as
identified by the hypotheses. These numbers resulted in a va
retrieve actives, true positive rate) and a value for the specificity (the ability to discard
inactives, true negatives rate). The favoured hypothesis was selected for a high sensitivity
and a high specificity. Additiona
was provided for each hypothesis, which resembles true positives rate against the false
positives rate. The area under the curve represented the accuracy of the model: a value of
‘1’ indicated a perfe
B9: 536454864
0 good out of 1
Bayesian Score:
B13:
0 good out of 1
Bayesian Score:
B17:
0 good out of 1
Bayesian Score:
Additional explanation S10
The pharmacophore protocol created 10 hypotheses for each run.
analysed statistically, based on the confusion matrix and the ROC plot, or visually, by
looking at ligand mapping and alignment. The confusion matrix gave
total number of positive and negative compounds included in the validation set, compared
to the number of true positives, true negatives, false positive and false negatives as
identified by the hypotheses. These numbers resulted in a va
retrieve actives, true positive rate) and a value for the specificity (the ability to discard
inactives, true negatives rate). The favoured hypothesis was selected for a high sensitivity
and a high specificity. Additiona
was provided for each hypothesis, which resembles true positives rate against the false
positives rate. The area under the curve represented the accuracy of the model: a value of
‘1’ indicated a perfe
B9: 536454864
0 good out of 1
Bayesian Score:
-1723293637
0 good out of 1
Bayesian Score:
B17: -672467221
good out of 1
Bayesian Score:
Additional explanation S10
The pharmacophore protocol created 10 hypotheses for each run.
analysed statistically, based on the confusion matrix and the ROC plot, or visually, by
looking at ligand mapping and alignment. The confusion matrix gave
total number of positive and negative compounds included in the validation set, compared
to the number of true positives, true negatives, false positive and false negatives as
identified by the hypotheses. These numbers resulted in a va
retrieve actives, true positive rate) and a value for the specificity (the ability to discard
inactives, true negatives rate). The favoured hypothesis was selected for a high sensitivity
and a high specificity. Additiona
was provided for each hypothesis, which resembles true positives rate against the false
positives rate. The area under the curve represented the accuracy of the model: a value of
‘1’ indicated a perfe
B9: 536454864
0 good out of 1
Bayesian Score:
1723293637
0 good out of 1
Bayesian Score:
672467221
good out of 1
Bayesian Score:
Additional explanation S10
The pharmacophore protocol created 10 hypotheses for each run.
analysed statistically, based on the confusion matrix and the ROC plot, or visually, by
looking at ligand mapping and alignment. The confusion matrix gave
total number of positive and negative compounds included in the validation set, compared
to the number of true positives, true negatives, false positive and false negatives as
identified by the hypotheses. These numbers resulted in a va
retrieve actives, true positive rate) and a value for the specificity (the ability to discard
inactives, true negatives rate). The favoured hypothesis was selected for a high sensitivity
and a high specificity. Additiona
was provided for each hypothesis, which resembles true positives rate against the false
positives rate. The area under the curve represented the accuracy of the model: a value of
‘1’ indicated a perfe
B9: 536454864
0 good out of 1
Bayesian Score: -0.600
1723293637
0 good out of 1
Bayesian Score: -0.600
672467221
good out of 1
Bayesian Score: -0.600
Additional explanation S10
The pharmacophore protocol created 10 hypotheses for each run.
analysed statistically, based on the confusion matrix and the ROC plot, or visually, by
looking at ligand mapping and alignment. The confusion matrix gave
total number of positive and negative compounds included in the validation set, compared
to the number of true positives, true negatives, false positive and false negatives as
identified by the hypotheses. These numbers resulted in a va
retrieve actives, true positive rate) and a value for the specificity (the ability to discard
inactives, true negatives rate). The favoured hypothesis was selected for a high sensitivity
and a high specificity. Additiona
was provided for each hypothesis, which resembles true positives rate against the false
positives rate. The area under the curve represented the accuracy of the model: a value of
‘1’ indicated a perfe
0.600
0.600
0.600
Additional explanation S10
The pharmacophore protocol created 10 hypotheses for each run.
analysed statistically, based on the confusion matrix and the ROC plot, or visually, by
looking at ligand mapping and alignment. The confusion matrix gave
total number of positive and negative compounds included in the validation set, compared
to the number of true positives, true negatives, false positive and false negatives as
identified by the hypotheses. These numbers resulted in a va
retrieve actives, true positive rate) and a value for the specificity (the ability to discard
inactives, true negatives rate). The favoured hypothesis was selected for a high sensitivity
and a high specificity. Additiona
was provided for each hypothesis, which resembles true positives rate against the false
positives rate. The area under the curve represented the accuracy of the model: a value of
‘1’ indicated a perfect model, which finds only true positives, whereas a value of ‘0.5’
Structural requirements of
B10: 1999165457
Bayesian Score:
B14: 823848251
Bayesian Score:
B18:
Bayesian Score:
Additional explanation S10
The pharmacophore protocol created 10 hypotheses for each run.
analysed statistically, based on the confusion matrix and the ROC plot, or visually, by
looking at ligand mapping and alignment. The confusion matrix gave
total number of positive and negative compounds included in the validation set, compared
to the number of true positives, true negatives, false positive and false negatives as
identified by the hypotheses. These numbers resulted in a va
retrieve actives, true positive rate) and a value for the specificity (the ability to discard
inactives, true negatives rate). The favoured hypothesis was selected for a high sensitivity
and a high specificity. Additiona
was provided for each hypothesis, which resembles true positives rate against the false
positives rate. The area under the curve represented the accuracy of the model: a value of
ct model, which finds only true positives, whereas a value of ‘0.5’
Structural requirements of
B10: 1999165457
0 good out of 1
Bayesian Score:
B14: 823848251
0 good out of 1
Bayesian Score:
B18: -
0 good out of 1
Bayesian Score:
Additional explanation S10. 3D
The pharmacophore protocol created 10 hypotheses for each run.
analysed statistically, based on the confusion matrix and the ROC plot, or visually, by
looking at ligand mapping and alignment. The confusion matrix gave
total number of positive and negative compounds included in the validation set, compared
to the number of true positives, true negatives, false positive and false negatives as
identified by the hypotheses. These numbers resulted in a va
retrieve actives, true positive rate) and a value for the specificity (the ability to discard
inactives, true negatives rate). The favoured hypothesis was selected for a high sensitivity
and a high specificity. Additiona
was provided for each hypothesis, which resembles true positives rate against the false
positives rate. The area under the curve represented the accuracy of the model: a value of
ct model, which finds only true positives, whereas a value of ‘0.5’
Structural requirements of
B10: 1999165457
0 good out of 1
Bayesian Score:
B14: 823848251
0 good out of 1
Bayesian Score:
-897237392
0 good out of 1
Bayesian Score:
D pharmacophore modeling
The pharmacophore protocol created 10 hypotheses for each run.
analysed statistically, based on the confusion matrix and the ROC plot, or visually, by
looking at ligand mapping and alignment. The confusion matrix gave
total number of positive and negative compounds included in the validation set, compared
to the number of true positives, true negatives, false positive and false negatives as
identified by the hypotheses. These numbers resulted in a va
retrieve actives, true positive rate) and a value for the specificity (the ability to discard
inactives, true negatives rate). The favoured hypothesis was selected for a high sensitivity
and a high specificity. Additionally, the Relative Operating Characteristics (ROC) curve
was provided for each hypothesis, which resembles true positives rate against the false
positives rate. The area under the curve represented the accuracy of the model: a value of
ct model, which finds only true positives, whereas a value of ‘0.5’
Structural requirements of
B10: 1999165457
0 good out of 1
Bayesian Score: -
B14: 823848251
0 good out of 1
Bayesian Score: -
897237392
0 good out of 1
Bayesian Score: -
pharmacophore modeling
The pharmacophore protocol created 10 hypotheses for each run.
analysed statistically, based on the confusion matrix and the ROC plot, or visually, by
looking at ligand mapping and alignment. The confusion matrix gave
total number of positive and negative compounds included in the validation set, compared
to the number of true positives, true negatives, false positive and false negatives as
identified by the hypotheses. These numbers resulted in a va
retrieve actives, true positive rate) and a value for the specificity (the ability to discard
inactives, true negatives rate). The favoured hypothesis was selected for a high sensitivity
lly, the Relative Operating Characteristics (ROC) curve
was provided for each hypothesis, which resembles true positives rate against the false
positives rate. The area under the curve represented the accuracy of the model: a value of
ct model, which finds only true positives, whereas a value of ‘0.5’
Structural requirements of
B10: 1999165457
0 good out of 1
-0.600
B14: 823848251
0 good out of 1
-0.600
897237392
0 good out of 1
-0.600
pharmacophore modeling
The pharmacophore protocol created 10 hypotheses for each run.
analysed statistically, based on the confusion matrix and the ROC plot, or visually, by
looking at ligand mapping and alignment. The confusion matrix gave
total number of positive and negative compounds included in the validation set, compared
to the number of true positives, true negatives, false positive and false negatives as
identified by the hypotheses. These numbers resulted in a va
retrieve actives, true positive rate) and a value for the specificity (the ability to discard
inactives, true negatives rate). The favoured hypothesis was selected for a high sensitivity
lly, the Relative Operating Characteristics (ROC) curve
was provided for each hypothesis, which resembles true positives rate against the false
positives rate. The area under the curve represented the accuracy of the model: a value of
ct model, which finds only true positives, whereas a value of ‘0.5’
Structural requirements of
0.600 Bayesian Score:
0.600 Bayesian Score:
0.600 Bayesian Score:
pharmacophore modeling
The pharmacophore protocol created 10 hypotheses for each run.
analysed statistically, based on the confusion matrix and the ROC plot, or visually, by
looking at ligand mapping and alignment. The confusion matrix gave
total number of positive and negative compounds included in the validation set, compared
to the number of true positives, true negatives, false positive and false negatives as
identified by the hypotheses. These numbers resulted in a va
retrieve actives, true positive rate) and a value for the specificity (the ability to discard
inactives, true negatives rate). The favoured hypothesis was selected for a high sensitivity
lly, the Relative Operating Characteristics (ROC) curve
was provided for each hypothesis, which resembles true positives rate against the false
positives rate. The area under the curve represented the accuracy of the model: a value of
ct model, which finds only true positives, whereas a value of ‘0.5’
Structural requirements of
B11:
0 good out of 1
Bayesian Score:
B15: 693911740
0 good out of 1
Bayesian Score:
B19:
0 good out of 1
Bayesian Score:
pharmacophore modeling
The pharmacophore protocol created 10 hypotheses for each run.
analysed statistically, based on the confusion matrix and the ROC plot, or visually, by
looking at ligand mapping and alignment. The confusion matrix gave
total number of positive and negative compounds included in the validation set, compared
to the number of true positives, true negatives, false positive and false negatives as
identified by the hypotheses. These numbers resulted in a va
retrieve actives, true positive rate) and a value for the specificity (the ability to discard
inactives, true negatives rate). The favoured hypothesis was selected for a high sensitivity
lly, the Relative Operating Characteristics (ROC) curve
was provided for each hypothesis, which resembles true positives rate against the false
positives rate. The area under the curve represented the accuracy of the model: a value of
ct model, which finds only true positives, whereas a value of ‘0.5’
Structural requirements of (iso)flavonoid
B11: -319036633
0 good out of 1
Bayesian Score:
B15: 693911740
0 good out of 1
Bayesian Score:
B19: -309130633
0 good out of 1
Bayesian Score:
pharmacophore modeling
The pharmacophore protocol created 10 hypotheses for each run.
analysed statistically, based on the confusion matrix and the ROC plot, or visually, by
looking at ligand mapping and alignment. The confusion matrix gave
total number of positive and negative compounds included in the validation set, compared
to the number of true positives, true negatives, false positive and false negatives as
identified by the hypotheses. These numbers resulted in a va
retrieve actives, true positive rate) and a value for the specificity (the ability to discard
inactives, true negatives rate). The favoured hypothesis was selected for a high sensitivity
lly, the Relative Operating Characteristics (ROC) curve
was provided for each hypothesis, which resembles true positives rate against the false
positives rate. The area under the curve represented the accuracy of the model: a value of
ct model, which finds only true positives, whereas a value of ‘0.5’
(iso)flavonoid
319036633
0 good out of 1
Bayesian Score:
B15: 693911740
0 good out of 1
Bayesian Score:
309130633
0 good out of 1
Bayesian Score:
pharmacophore modeling
The pharmacophore protocol created 10 hypotheses for each run.
analysed statistically, based on the confusion matrix and the ROC plot, or visually, by
looking at ligand mapping and alignment. The confusion matrix gave
total number of positive and negative compounds included in the validation set, compared
to the number of true positives, true negatives, false positive and false negatives as
identified by the hypotheses. These numbers resulted in a va
retrieve actives, true positive rate) and a value for the specificity (the ability to discard
inactives, true negatives rate). The favoured hypothesis was selected for a high sensitivity
lly, the Relative Operating Characteristics (ROC) curve
was provided for each hypothesis, which resembles true positives rate against the false
positives rate. The area under the curve represented the accuracy of the model: a value of
ct model, which finds only true positives, whereas a value of ‘0.5’
(iso)flavonoid
319036633
0 good out of 1
Bayesian Score: -0.600
B15: 693911740
0 good out of 1
Bayesian Score: -0.600
309130633
0 good out of 1
Bayesian Score: -0.600
pharmacophore modeling
The pharmacophore protocol created 10 hypotheses for each run.
analysed statistically, based on the confusion matrix and the ROC plot, or visually, by
looking at ligand mapping and alignment. The confusion matrix gave
total number of positive and negative compounds included in the validation set, compared
to the number of true positives, true negatives, false positive and false negatives as
identified by the hypotheses. These numbers resulted in a value for sensitivity (the ability to
retrieve actives, true positive rate) and a value for the specificity (the ability to discard
inactives, true negatives rate). The favoured hypothesis was selected for a high sensitivity
lly, the Relative Operating Characteristics (ROC) curve
was provided for each hypothesis, which resembles true positives rate against the false
positives rate. The area under the curve represented the accuracy of the model: a value of
ct model, which finds only true positives, whereas a value of ‘0.5’
(iso)flavonoid
319036633
0 good out of 1
0.600
B15: 693911740
0 good out of 1
0.600
309130633
0 good out of 1
0.600
The pharmacophore protocol created 10 hypotheses for each run.
analysed statistically, based on the confusion matrix and the ROC plot, or visually, by
looking at ligand mapping and alignment. The confusion matrix gave
total number of positive and negative compounds included in the validation set, compared
to the number of true positives, true negatives, false positive and false negatives as
lue for sensitivity (the ability to
retrieve actives, true positive rate) and a value for the specificity (the ability to discard
inactives, true negatives rate). The favoured hypothesis was selected for a high sensitivity
lly, the Relative Operating Characteristics (ROC) curve
was provided for each hypothesis, which resembles true positives rate against the false
positives rate. The area under the curve represented the accuracy of the model: a value of
ct model, which finds only true positives, whereas a value of ‘0.5’
(iso)flavonoids for
0.600 Bayesian Score:
0.600 Bayesian Score:
0.600 Bayesian Score:
The pharmacophore protocol created 10 hypotheses for each run.
analysed statistically, based on the confusion matrix and the ROC plot, or visually, by
looking at ligand mapping and alignment. The confusion matrix gave
total number of positive and negative compounds included in the validation set, compared
to the number of true positives, true negatives, false positive and false negatives as
lue for sensitivity (the ability to
retrieve actives, true positive rate) and a value for the specificity (the ability to discard
inactives, true negatives rate). The favoured hypothesis was selected for a high sensitivity
lly, the Relative Operating Characteristics (ROC) curve
was provided for each hypothesis, which resembles true positives rate against the false
positives rate. The area under the curve represented the accuracy of the model: a value of
ct model, which finds only true positives, whereas a value of ‘0.5’
s for hTAS2R activation
B12: 1078755483
0 good out of 1
Bayesian Score:
B16: 1859792422
0 good out of 1
Bayesian Score:
B20: 1151345624
0 good out of 1
Bayesian Score:
The pharmacophore protocol created 10 hypotheses for each run. The models were
analysed statistically, based on the confusion matrix and the ROC plot, or visually, by
looking at ligand mapping and alignment. The confusion matrix gave information on the
total number of positive and negative compounds included in the validation set, compared
to the number of true positives, true negatives, false positive and false negatives as
lue for sensitivity (the ability to
retrieve actives, true positive rate) and a value for the specificity (the ability to discard
inactives, true negatives rate). The favoured hypothesis was selected for a high sensitivity
lly, the Relative Operating Characteristics (ROC) curve
was provided for each hypothesis, which resembles true positives rate against the false
positives rate. The area under the curve represented the accuracy of the model: a value of
ct model, which finds only true positives, whereas a value of ‘0.5’
hTAS2R activation
B12: 1078755483
0 good out of 1
Bayesian Score:
B16: 1859792422
0 good out of 1
Bayesian Score:
B20: 1151345624
0 good out of 1
Bayesian Score:
The models were
analysed statistically, based on the confusion matrix and the ROC plot, or visually, by
information on the
total number of positive and negative compounds included in the validation set, compared
to the number of true positives, true negatives, false positive and false negatives as
lue for sensitivity (the ability to
retrieve actives, true positive rate) and a value for the specificity (the ability to discard
inactives, true negatives rate). The favoured hypothesis was selected for a high sensitivity
lly, the Relative Operating Characteristics (ROC) curve
was provided for each hypothesis, which resembles true positives rate against the false
positives rate. The area under the curve represented the accuracy of the model: a value of
ct model, which finds only true positives, whereas a value of ‘0.5’
hTAS2R activation
B12: 1078755483
0 good out of 1
Bayesian Score: -0.600
B16: 1859792422
0 good out of 1
Bayesian Score: -0.600
B20: 1151345624
0 good out of 1
Bayesian Score: -0.600
The models were
analysed statistically, based on the confusion matrix and the ROC plot, or visually, by
information on the
total number of positive and negative compounds included in the validation set, compared
to the number of true positives, true negatives, false positive and false negatives as
lue for sensitivity (the ability to
retrieve actives, true positive rate) and a value for the specificity (the ability to discard
inactives, true negatives rate). The favoured hypothesis was selected for a high sensitivity
lly, the Relative Operating Characteristics (ROC) curve
was provided for each hypothesis, which resembles true positives rate against the false
positives rate. The area under the curve represented the accuracy of the model: a value of
ct model, which finds only true positives, whereas a value of ‘0.5’
hTAS2R activation
97
B12: 1078755483
0 good out of 1
0.600
B16: 1859792422
0 good out of 1
0.600
B20: 1151345624
0 good out of 1
0.600
The models were
analysed statistically, based on the confusion matrix and the ROC plot, or visually, by
information on the
total number of positive and negative compounds included in the validation set, compared
to the number of true positives, true negatives, false positive and false negatives as
lue for sensitivity (the ability to
retrieve actives, true positive rate) and a value for the specificity (the ability to discard
inactives, true negatives rate). The favoured hypothesis was selected for a high sensitivity
lly, the Relative Operating Characteristics (ROC) curve
was provided for each hypothesis, which resembles true positives rate against the false
positives rate. The area under the curve represented the accuracy of the model: a value of
ct model, which finds only true positives, whereas a value of ‘0.5’
hTAS2R activation
97
The models were
analysed statistically, based on the confusion matrix and the ROC plot, or visually, by
information on the
total number of positive and negative compounds included in the validation set, compared
to the number of true positives, true negatives, false positive and false negatives as
lue for sensitivity (the ability to
retrieve actives, true positive rate) and a value for the specificity (the ability to discard
inactives, true negatives rate). The favoured hypothesis was selected for a high sensitivity
lly, the Relative Operating Characteristics (ROC) curve
was provided for each hypothesis, which resembles true positives rate against the false
positives rate. The area under the curve represented the accuracy of the model: a value of
ct model, which finds only true positives, whereas a value of ‘0.5’
3
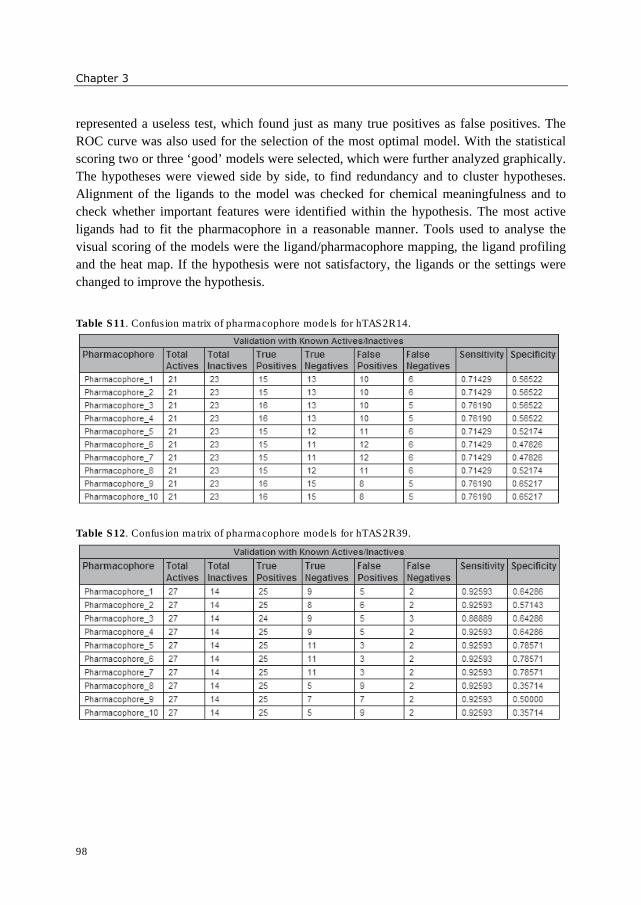
Chapter 3
98
represented a useless test, which found just as many true positives as false positives. The
ROC curve was also used for the selection of the most optimal model. With the statistical
scoring two or three ‘good’ models were selected, which were further analyzed graphically.
The hypotheses were viewed side by side, to find redundancy and to cluster hypotheses.
Alignment of the ligands to the model was checked for chemical meaningfulness and to
check whether important features were identified within the hypothesis. The most active
ligands had to fit the pharmacophore in a reasonable manner. Tools used to analyse the
visual scoring of the models were the ligand/pharmacophore mapping, the ligand profiling
and the heat map. If the hypothesis were not satisfactory, the ligands or the settings were
changed to improve the hypothesis.
Table S11. Confusion matrix of pharmacophore models for hTAS2R14.
Table S12. Confusion matrix of pharmacophore models for hTAS2R39.
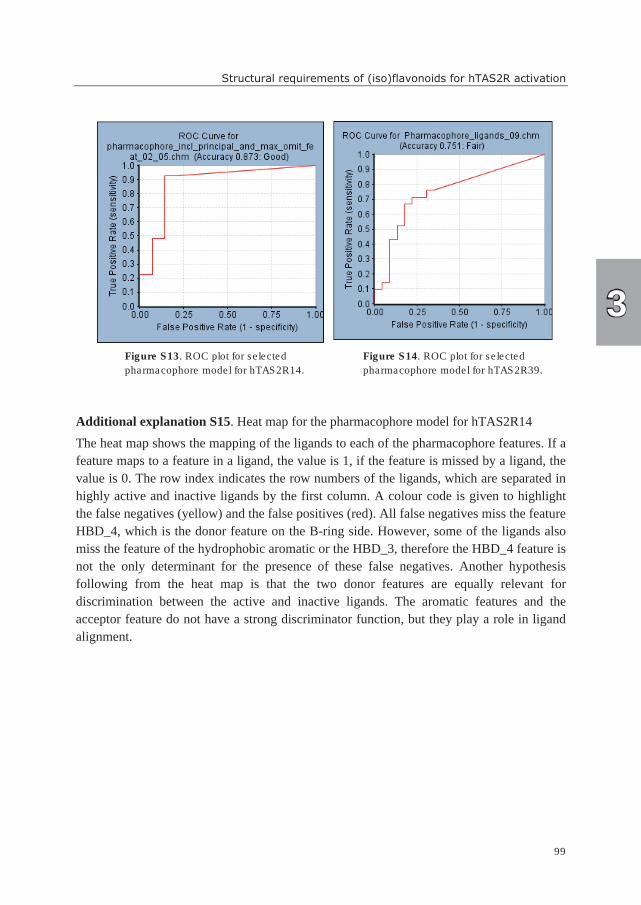
Structural requirements of (iso)flavonoids for hTAS2R activation
99
Figure S13. ROC plot for selected Figure S14. ROC plot for selected
pharmacophore model for hTAS2R14. pharmacophore model for hTAS2R39.
Additional explanation S15. Heat map for the pharmacophore model for hTAS2R14
The heat map shows the mapping of the ligands to each of the pharmacophore features. If a
feature maps to a feature in a ligand, the value is 1, if the feature is missed by a ligand, the
value is 0. The row index indicates the row numbers of the ligands, which are separated in
highly active and inactive ligands by the first column. A colour code is given to highlight
the false negatives (yellow) and the false positives (red). All false negatives miss the feature
HBD_4, which is the donor feature on the B-ring side. However, some of the ligands also
miss the feature of the hydrophobic aromatic or the HBD_3, therefore the HBD_4 feature is
not the only determinant for the presence of these false negatives. Another hypothesis
following from the heat map is that the two donor features are equally relevant for
discrimination between the active and inactive ligands. The aromatic features and the
acceptor feature do not have a strong discriminator function, but they play a role in ligand
alignment.
3
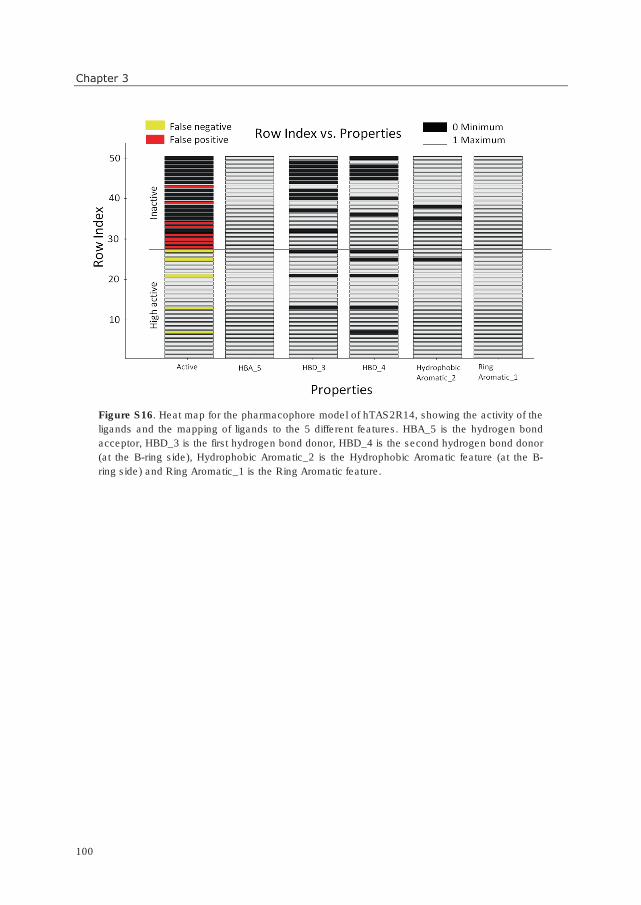
Chapter 3
100
Figure S16. Heat map for the pharmacophore model of hTAS2R14, showing the activity of the
ligands and the mapping of ligands to the 5 different features. HBA_5 is the hydrogen bond
acceptor, HBD_3 is the first hydrogen bond donor, HBD_4 is the second hydrogen bond donor
(at the B-ring side), Hydrophobic Aromatic_2 is the Hydrophobic Aromatic feature (at the B-
ring side) and Ring Aromatic_1 is the Ring Aromatic feature.
Chapter 4
6-Methoxyflavanones as bitter taste receptor
blockers for hTAS2R39
Based on: Wibke S.U. Roland, Robin J. Gouka, Harry Gruppen, Marianne Driesse, Leo
van Buren, Gerrit Smit, Jean-Paul Vincken. 6-Methoxyflavanones as bitter taste receptor
blockers for hTAS2R39. Accepted
4
Chapter 4
102
ABSTRACT
Many (dietary) bitter compounds, e.g. flavonoids, activate bitter receptor hTAS2R39 in
cell-based assays. Several flavonoids, amongst which some flavanones, are known not to
activate this receptor. As certain flavanones are known to mask bitter taste sensorially,
flavanones might act as bitter receptor antagonists. Fourteen flavanones were investigated
for their potential to reduce activation of hTAS2R39 by epicatechin gallate (ECG), one of
the main bitter compounds occurring in green tea. Three flavanones showed inhibitory
behavior towards the activation of hTAS2R39 by ECG: 4’-fluoro-6-methoxyflavanone,
6,3’-dimethoxyflavanone, and 6-methoxyflavanone (in order of decreasing potency). The 6-
methoxyflavanones also inhibited activation of hTAS2R14 (another bitter receptor
activated by ECG), though to a lesser extent. Dose-response curves of ECG at various
concentrations of the full antagonist 4’-fluoro-6-methoxyflavanone and wash-out
experiments indicated reversible insurmountable antagonism. The same effect was
observed for the structurally different agonist denatonium benzoate, suggesting a non-
competitive orthosteric mechanism.
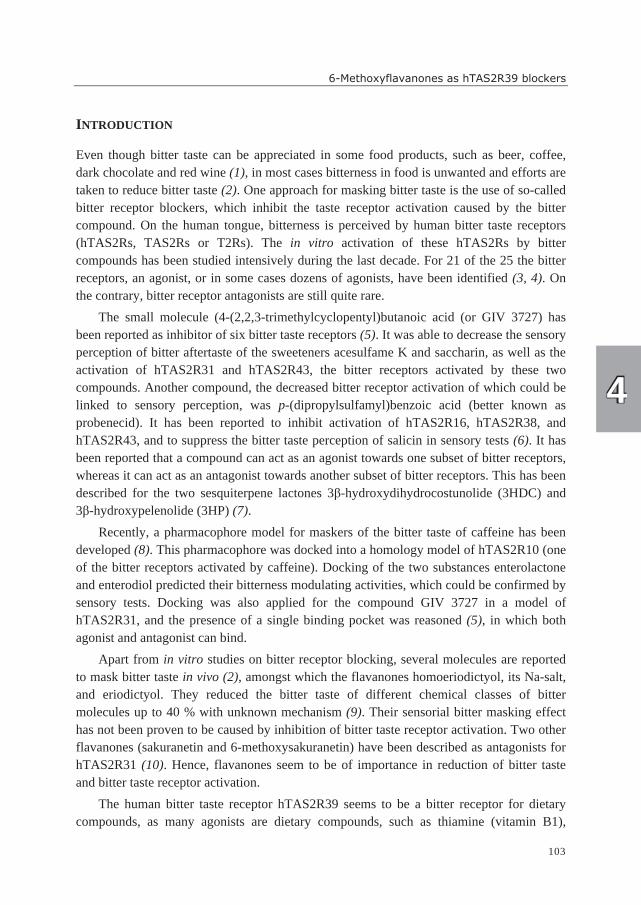
6-Methoxyflavanones as hTAS2R39 blockers
103
INTRODUCTION
Even though bitter taste can be appreciated in some food products, such as beer, coffee,
dark chocolate and red wine (1), in most cases bitterness in food is unwanted and efforts are
taken to reduce bitter taste (2). One approach for masking bitter taste is the use of so-called
bitter receptor blockers, which inhibit the taste receptor activation caused by the bitter
compound. On the human tongue, bitterness is perceived by human bitter taste receptors
(hTAS2Rs, TAS2Rs or T2Rs). The in vitro activation of these hTAS2Rs by bitter
compounds has been studied intensively during the last decade. For 21 of the 25 the bitter
receptors, an agonist, or in some cases dozens of agonists, have been identified (3, 4). On
the contrary, bitter receptor antagonists are still quite rare.
The small molecule (4-(2,2,3-trimethylcyclopentyl)butanoic acid (or GIV 3727) has
been reported as inhibitor of six bitter taste receptors (5). It was able to decrease the sensory
perception of bitter aftertaste of the sweeteners acesulfame K and saccharin, as well as the
activation of hTAS2R31 and hTAS2R43, the bitter receptors activated by these two
compounds. Another compound, the decreased bitter receptor activation of which could be
linked to sensory perception, was p-(dipropylsulfamyl)benzoic acid (better known as
probenecid). It has been reported to inhibit activation of hTAS2R16, hTAS2R38, and
hTAS2R43, and to suppress the bitter taste perception of salicin in sensory tests (6). It has
been reported that a compound can act as an agonist towards one subset of bitter receptors,
whereas it can act as an antagonist towards another subset of bitter receptors. This has been
described for the two sesquiterpene lactones 3β-hydroxydihydrocostunolide (3HDC) and
3β-hydroxypelenolide (3HP) (7).
Recently, a pharmacophore model for maskers of the bitter taste of caffeine has been
developed (8). This pharmacophore was docked into a homology model of hTAS2R10 (one
of the bitter receptors activated by caffeine). Docking of the two substances enterolactone
and enterodiol predicted their bitterness modulating activities, which could be confirmed by
sensory tests. Docking was also applied for the compound GIV 3727 in a model of
hTAS2R31, and the presence of a single binding pocket was reasoned (5), in which both
agonist and antagonist can bind.
Apart from in vitro studies on bitter receptor blocking, several molecules are reported
to mask bitter taste in vivo (2), amongst which the flavanones homoeriodictyol, its Na-salt,
and eriodictyol. They reduced the bitter taste of different chemical classes of bitter
molecules up to 40 % with unknown mechanism (9). Their sensorial bitter masking effect
has not been proven to be caused by inhibition of bitter taste receptor activation. Two other
flavanones (sakuranetin and 6-methoxysakuranetin) have been described as antagonists for
hTAS2R31 (10). Hence, flavanones seem to be of importance in reduction of bitter taste
and bitter taste receptor activation.
The human bitter taste receptor hTAS2R39 seems to be a bitter receptor for dietary
compounds, as many agonists are dietary compounds, such as thiamine (vitamin B1),
4
Chapter 4
104
quinine (3) used in tonic water, catechins from green tea (11), wine tannin precursors (12),
small peptides from casein hydrolysates (13) and cheese (14), isoflavones from soy bean
(15), and many other flavonoids from several plant sources (16). Hence, it is of interest to
identify a bitter blocker for this receptor. It is likely that an antagonist might have similar
structural elements to an agonist in order to fit into the same binding pocket. In our
previous study on (iso)flavonoid agonists of hTAS2R39, several of the compounds tested,
amongst which flavanones, did not activate the bitter receptor despite structural similarity
to active compounds (16). The aim of the present study was to investigate whether these
and other flavanones could act as antagonists towards hTAS2R39.
MATERIALS AND METHODS
Materials
Compounds tested were obtained from Extrasynthese (Genay, France), Indofine Chemical
Company (Hillsborough, NJ, USA), Interbioscreen (Moscow, Russia), and Sigma-Aldrich
(Steinheim, Germany). Each compound was dissolved in DMSO (Sigma-Aldrich) to a 100
mM stock concentration. Trypan blue solution (0.4 % w/v) and isoproterenol were
purchased from Sigma-Aldrich.
Tyrode’s buffer (140 mM NaCl, 5 mM KCl, 10 mM glucose, 1 mM MgCl2, 1 mM
CaCl2, and 20 mM Hepes, pH 7.4) with 0.5 mM probenecid (Sigma-Aldrich) was used for
dilution of compound-DMSO stock solutions and for calcium imaging assays. The presence
of probenecid in the buffer did not lead to inhibition of hTAS2R14 or hTAS2R39. All
compounds were tested for autofluorescence and toxic effects on the cells used at a
concentration of 1 mM as described before (15).
Expression of hTAS2R39 and hTAS2R14 in HEK293 cells
For functional expression of the human bitter taste receptor hTAS2R39, HEK293 T-Rex
Flp-In cells (Invitrogen, San Diego, CA, USA) were used, stably expressing the chimeric
G-protein α-subunit Gα16-gust44 (cloned into pcDNA4 (Invitrogen)) (17) and the human
bitter receptor genes for hTAS2R39 (cloned into pcDNA5/FRT (Invitrogen)). The bitter
receptor gene contained a DNA sequence encoding the first 45 amino acids of rat
somatostatin receptor type 3 at its 5’ end (the receptor expression was achieved according
to (18) with exception of the HSV-tag), in order to improve membrane targeting of the
receptor protein. The same procedure was applied for stable expression of hTAS2R14.
Cells were maintained in Dulbecco’s Modified Eagle’s Medium (DMEM) and 10 % (v/v)
tetracycline-free FBS (both Lonza, Verviers, Belgium) supplemented with blasticidin (5
µg/mL), geneticin (400 µg/mL) and hygromycin (100 µg/mL) (all from Invitrogen). Cells
were grown and maintained at 37 °C and 5 % (v/v) CO2.
6-Methoxyflavanones as hTAS2R39 blockers
105
Monitoring bitter receptor activation by intracellular calcium release
Cells were seeded into poly-L-lysine-coated (Sigma-Aldrich) 96-well plates (black wall,
clear bottom, Greiner bio-one, Frickenhausen, Germany) at a density of 7*103 cells in 100
µL/well and cultured for 24 h. Transcription of the receptors was induced by adding 0.25
µg/mL doxycycline (Sigma-Aldrich). Cells were induced for 24 h and then loaded with the
calcium-sensitive fluorescent dye Fluo-4-AM (2.5 µM, Invitrogen), which was dissolved in
Tyrode’s buffer containing 5 % (v/v) tetracycline-free FBS (Lonza). One hour after
loading, cells were washed with Tyrode’s buffer and taken up in Tyrode’s buffer. Stock
solutions of test compounds were prepared in DMSO and diluted to the appropriate
concentration in Tyrode’s buffer, not exceeding a DMSO concentration of 1 % (v/v).
Receptor activation or inhibition was measured via intracellular Ca2+ release (19) in a
FlexStation II 384 or FlexStation III (Molecular Devices Corporation, Sunnyvale, CA,
USA) by measuring fluorescence (excitation 485 nm / emission 520 nm) for either 90 s or
240 s at 37 °C. Two methods of compound administration were applied: simultaneous and
stepwise addition of potential antagonist and agonist. The first 17 s before compound
addition were used for baseline determination. For the simultaneous method, agonist and
potential antagonist were pre-mixed, administered after 17 s, and fluorescence was
measured for in total 90 s. For the stepwise method, after 17 s, the potential antagonist was
added, fluorescence was measured until 120 s, and after 120 s the agonist was added and
measured for another 120 s, in total 240 s. Non-induced cells, which did not express the
taste receptor, were measured in parallel to verify specificity of receptor activation. All
experiments were conducted in duplicate on two or more different days.
Calcium assay data processing
Data processing was done as reported previously (15). In brief, SoftMax Pro 5.4 software
(Molecular Devices Corporation) was used to plot the fluorescence signals. The
fluorescence value (∆F/F0), representing receptor activity, was calculated by subtracting the
baseline fluorescence (F0) prior to loading from the maximum fluorescence (F) after
compound addition, divided by the signal of the baseline in order to normalize background
fluorescence (20). Dose-response curves were established as non-linear regression curves
using Graph Pad Prism (version 4 for Windows, Graph Pad Software, San Diego, CA,
USA). Half-maximal effective concentrations (EC50) and half-maximal inhibitory
concentrations (IC50) were calculated. Error bars reflect the standard error of the mean
(SEM). Statistical analysis was performed in Graph Pad Prism (one-way ANOVA at 5%
risk level, followed by Bonferroni’s post hoc test).
4
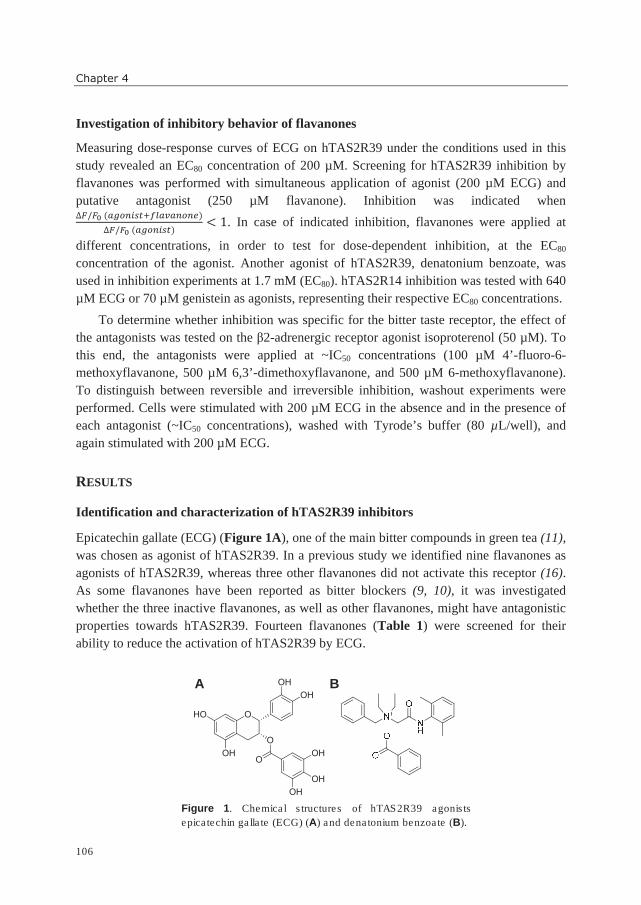
Chapter 4
106
Investigation of inhibitory behavior of flavanones
Measuring dose-response curves of ECG on hTAS2R39 under the conditions used in this
study revealed an EC80 concentration of 200 µM. Screening for hTAS2R39 inhibition by
flavanones was performed with simultaneous application of agonist (200 µM ECG) and
putative antagonist (250 µM flavanone). Inhibition was indicated when ∆�/��(���� �������)
∆�/��(���� )< 1. In case of indicated inhibition, flavanones were applied at
different concentrations, in order to test for dose-dependent inhibition, at the EC80
concentration of the agonist. Another agonist of hTAS2R39, denatonium benzoate, was
used in inhibition experiments at 1.7 mM (EC80). hTAS2R14 inhibition was tested with 640
µM ECG or 70 µM genistein as agonists, representing their respective EC80 concentrations.
To determine whether inhibition was specific for the bitter taste receptor, the effect of
the antagonists was tested on the β2-adrenergic receptor agonist isoproterenol (50 µM). To
this end, the antagonists were applied at ~IC50 concentrations (100 µM 4’-fluoro-6-
methoxyflavanone, 500 µM 6,3’-dimethoxyflavanone, and 500 µM 6-methoxyflavanone).
To distinguish between reversible and irreversible inhibition, washout experiments were
performed. Cells were stimulated with 200 µM ECG in the absence and in the presence of
each antagonist (~IC50 concentrations), washed with Tyrode’s buffer (80 µL/well), and
again stimulated with 200 µM ECG.
RESULTS
Identification and characterization of hTAS2R39 inhibitors
Epicatechin gallate (ECG) (Figure 1A), one of the main bitter compounds in green tea (11),
was chosen as agonist of hTAS2R39. In a previous study we identified nine flavanones as
agonists of hTAS2R39, whereas three other flavanones did not activate this receptor (16).
As some flavanones have been reported as bitter blockers (9, 10), it was investigated
whether the three inactive flavanones, as well as other flavanones, might have antagonistic
properties towards hTAS2R39. Fourteen flavanones (Table 1) were screened for their
ability to reduce the activation of hTAS2R39 by ECG.
Figure 1. Chemical structures of hTAS2R39 agonists
epicatechin gallate (ECG) (A) and denatonium benzoate (B).
A B
OHO
OH
OH
OH
O
O
OH
OH
OH
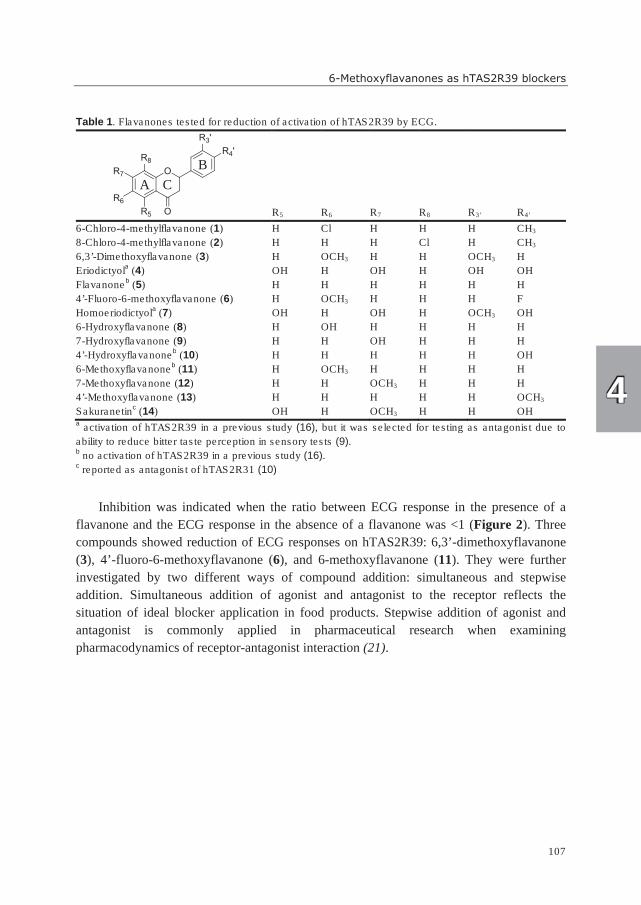
6-Methoxyflavanones as hTAS2R39 blockers
107
Table 1. Flavanones tested for reduction of activation of hTAS2R39 by ECG.
R5 R6 R7 R8 R3’ R4’
6-Chloro-4-methylflavanone (1) H Cl H H H CH3
8-Chloro-4-methylflavanone (2) H H H Cl H CH3
6,3’-Dimethoxyflavanone (3) H OCH3 H H OCH3 H
Eriodictyola (4) OH H OH H OH OH
Flavanoneb (5) H H H H H H
4’-Fluoro-6-methoxyflavanone (6) H OCH3 H H H F
Homoeriodictyola (7) OH H OH H OCH3 OH
6-Hydroxyflavanone (8) H OH H H H H
7-Hydroxyflavanone (9) H H OH H H H
4’-Hydroxyflavanoneb (10) H H H H H OH
6-Methoxyflavanoneb (11) H OCH3 H H H H
7-Methoxyflavanone (12) H H OCH3 H H H
4’-Methoxyflavanone (13) H H H H H OCH3
Sakuranetinc (14) OH H OCH3 H H OH
a activation of hTAS2R39 in a previous study (16), but it was selected for testing as antagonist due to
ability to reduce bitter taste perception in sensory tests (9). b no activation of hTAS2R39 in a previous study (16).
c reported as antagonist of hTAS2R31 (10)
Inhibition was indicated when the ratio between ECG response in the presence of a
flavanone and the ECG response in the absence of a flavanone was <1 (Figure 2). Three
compounds showed reduction of ECG responses on hTAS2R39: 6,3’-dimethoxyflavanone
(3), 4’-fluoro-6-methoxyflavanone (6), and 6-methoxyflavanone (11). They were further
investigated by two different ways of compound addition: simultaneous and stepwise
addition. Simultaneous addition of agonist and antagonist to the receptor reflects the
situation of ideal blocker application in food products. Stepwise addition of agonist and
antagonist is commonly applied in pharmaceutical research when examining
pharmacodynamics of receptor-antagonist interaction (21).
OR7
O
R6
R5
R4'
R3'
R8
A C
B
4
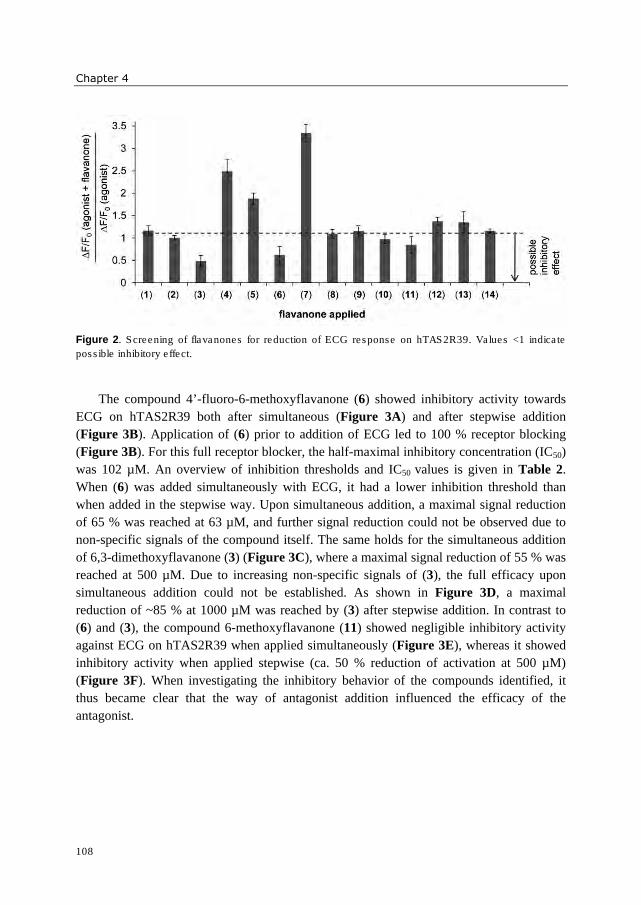
Chapter 4
108
Figure 2. Screening of flavanones for reduction of ECG response on hTAS2R39. Values <1 indicate
possible inhibitory effect.
The compound 4’-fluoro-6-methoxyflavanone (6) showed inhibitory activity towards
ECG on hTAS2R39 both after simultaneous (Figure 3A) and after stepwise addition
(Figure 3B). Application of (6) prior to addition of ECG led to 100 % receptor blocking
(Figure 3B). For this full receptor blocker, the half-maximal inhibitory concentration (IC50)
was 102 µM. An overview of inhibition thresholds and IC50 values is given in Table 2.
When (6) was added simultaneously with ECG, it had a lower inhibition threshold than
when added in the stepwise way. Upon simultaneous addition, a maximal signal reduction
of 65 % was reached at 63 µM, and further signal reduction could not be observed due to
non-specific signals of the compound itself. The same holds for the simultaneous addition
of 6,3-dimethoxyflavanone (3) (Figure 3C), where a maximal signal reduction of 55 % was
reached at 500 µM. Due to increasing non-specific signals of (3), the full efficacy upon
simultaneous addition could not be established. As shown in Figure 3D, a maximal
reduction of ~85 % at 1000 µM was reached by (3) after stepwise addition. In contrast to
(6) and (3), the compound 6-methoxyflavanone (11) showed negligible inhibitory activity
against ECG on hTAS2R39 when applied simultaneously (Figure 3E), whereas it showed
inhibitory activity when applied stepwise (ca. 50 % reduction of activation at 500 µM)
(Figure 3F). When investigating the inhibitory behavior of the compounds identified, it
thus became clear that the way of antagonist addition influenced the efficacy of the
antagonist.
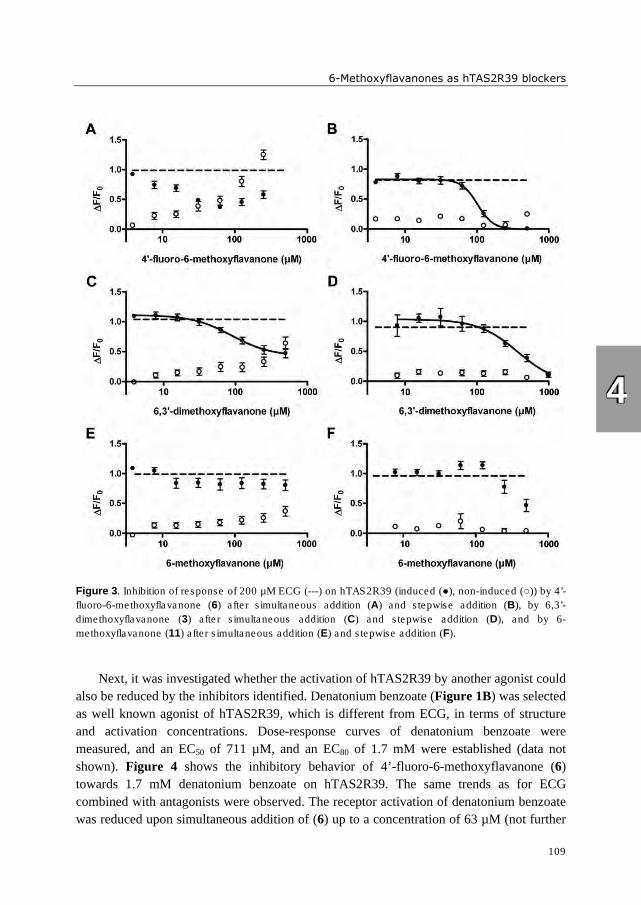
6-Methoxyflavanones as hTAS2R39 blockers
109
Figure 3. Inhibition of response of 200 µM ECG (---) on hTAS2R39 (induced (●), non-induced (○)) by 4’-
fluoro-6-methoxyflavanone (6) after simultaneous addition (A) and stepwise addition (B), by 6,3’-
dimethoxyflavanone (3) after simultaneous addition (C) and stepwise addition (D), and by 6-
methoxyflavanone (11) after simultaneous addition (E) and stepwise addition (F).
Next, it was investigated whether the activation of hTAS2R39 by another agonist could
also be reduced by the inhibitors identified. Denatonium benzoate (Figure 1B) was selected
as well known agonist of hTAS2R39, which is different from ECG, in terms of structure
and activation concentrations. Dose-response curves of denatonium benzoate were
measured, and an EC50 of 711 µM, and an EC80 of 1.7 mM were established (data not
shown). Figure 4 shows the inhibitory behavior of 4’-fluoro-6-methoxyflavanone (6)
towards 1.7 mM denatonium benzoate on hTAS2R39. The same trends as for ECG
combined with antagonists were observed. The receptor activation of denatonium benzoate
was reduced upon simultaneous addition of (6) up to a concentration of 63 µM (not further
4
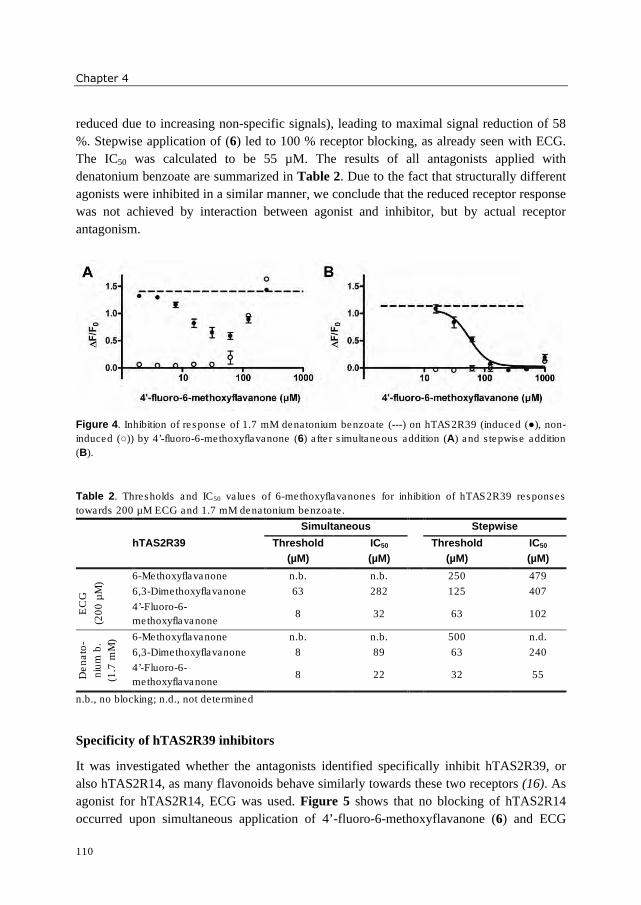
Chapter 4
110
reduced due to increasing non-specific signals), leading to maximal signal reduction of 58
%. Stepwise application of (6) led to 100 % receptor blocking, as already seen with ECG.
The IC50 was calculated to be 55 µM. The results of all antagonists applied with
denatonium benzoate are summarized in Table 2. Due to the fact that structurally different
agonists were inhibited in a similar manner, we conclude that the reduced receptor response
was not achieved by interaction between agonist and inhibitor, but by actual receptor
antagonism.
Figure 4. Inhibition of response of 1.7 mM denatonium benzoate (---) on hTAS2R39 (induced (●), non-
induced (○)) by 4’-fluoro-6-methoxyflavanone (6) after simultaneous addition (A) and stepwise addition
(B).
Table 2. Thresholds and IC50 values of 6-methoxyflavanones for inhibition of hTAS2R39 responses
towards 200 µM ECG and 1.7 mM denatonium benzoate.
Simultaneous Stepwise
hTAS2R39 Threshold
(µM)
IC50
(µM)
Threshold
(µM)
IC50
(µM)
EC
G
(20
0 µ
M)
6-Methoxyflavanone n.b. n.b. 250 479
6,3-Dimethoxyflavanone 63 282 125 407
4’-Fluoro-6-
methoxyflavanone 8 32 63 102
Den
ato
-
niu
m b
.
(1.7
mM
) 6-Methoxyflavanone n.b. n.b. 500 n.d.
6,3-Dimethoxyflavanone 8 89 63 240
4’-Fluoro-6-
methoxyflavanone 8 22 32 55
n.b., no blocking; n.d., not determined
Specificity of hTAS2R39 inhibitors
It was investigated whether the antagonists identified specifically inhibit hTAS2R39, or
also hTAS2R14, as many flavonoids behave similarly towards these two receptors (16). As
agonist for hTAS2R14, ECG was used. Figure 5 shows that no blocking of hTAS2R14
occurred upon simultaneous application of 4’-fluoro-6-methoxyflavanone (6) and ECG
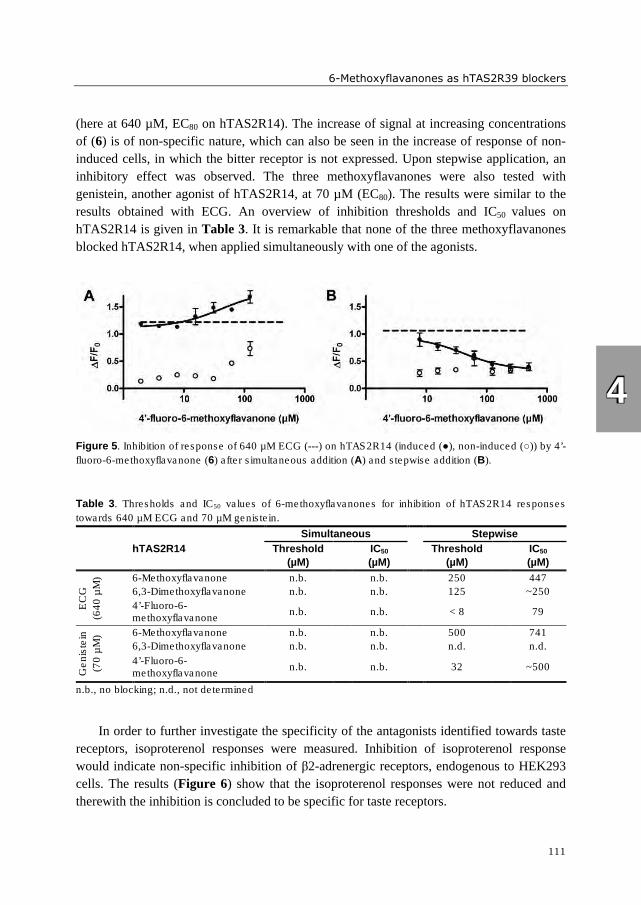
6-Methoxyflavanones as hTAS2R39 blockers
111
(here at 640 µM, EC80 on hTAS2R14). The increase of signal at increasing concentrations
of (6) is of non-specific nature, which can also be seen in the increase of response of non-
induced cells, in which the bitter receptor is not expressed. Upon stepwise application, an
inhibitory effect was observed. The three methoxyflavanones were also tested with
genistein, another agonist of hTAS2R14, at 70 µM (EC80). The results were similar to the
results obtained with ECG. An overview of inhibition thresholds and IC50 values on
hTAS2R14 is given in Table 3. It is remarkable that none of the three methoxyflavanones
blocked hTAS2R14, when applied simultaneously with one of the agonists.
Figure 5. Inhibition of response of 640 µM ECG (---) on hTAS2R14 (induced (●), non-induced (○)) by 4’-
fluoro-6-methoxyflavanone (6) after simultaneous addition (A) and stepwise addition (B).
Table 3. Thresholds and IC50 values of 6-methoxyflavanones for inhibition of hTAS2R14 responses
towards 640 µM ECG and 70 µM genistein.
Simultaneous Stepwise
hTAS2R14 Threshold
(µM)
IC50
(µM)
Threshold
(µM)
IC50
(µM)
EC
G
(64
0 µ
M) 6-Methoxyflavanone n.b. n.b. 250 447
6,3-Dimethoxyflavanone n.b. n.b. 125 ~250
4’-Fluoro-6-methoxyflavanone
n.b. n.b. < 8 79
Gen
iste
in
(70
µM
) 6-Methoxyflavanone n.b. n.b. 500 741
6,3-Dimethoxyflavanone n.b. n.b. n.d. n.d.
4’-Fluoro-6-methoxyflavanone
n.b. n.b. 32 ~500
n.b., no blocking; n.d., not determined
In order to further investigate the specificity of the antagonists identified towards taste
receptors, isoproterenol responses were measured. Inhibition of isoproterenol response
would indicate non-specific inhibition of β2-adrenergic receptors, endogenous to HEK293
cells. The results (Figure 6) show that the isoproterenol responses were not reduced and
therewith the inhibition is concluded to be specific for taste receptors.
4
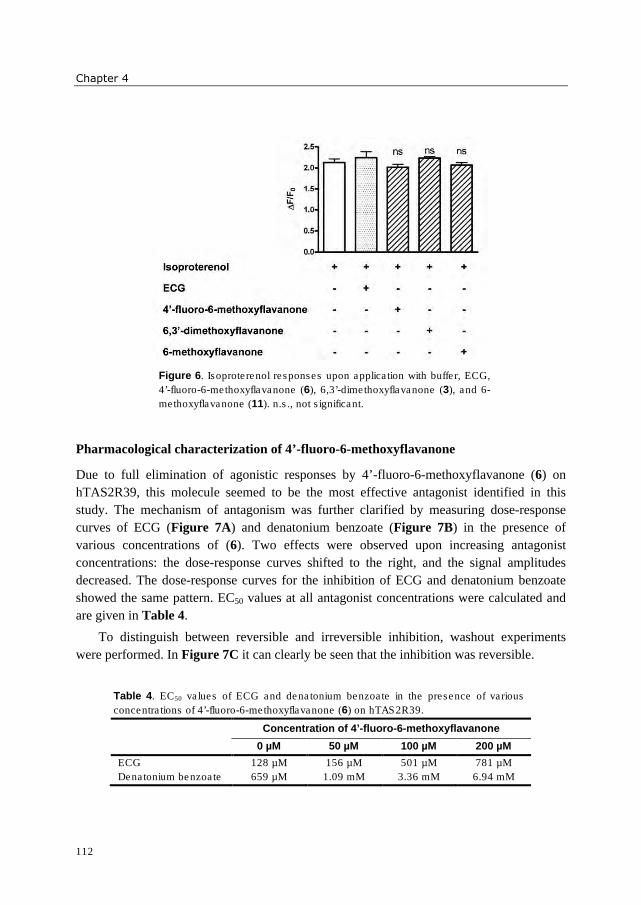
Chapter 4
112
Figure 6. Isoproterenol responses upon application with buffer, ECG,
4’-fluoro-6-methoxyflavanone (6), 6,3’-dimethoxyflavanone (3), and 6-
methoxyflavanone (11). n.s., not significant.
Pharmacological characterization of 4’-fluoro-6-methoxyflavanone
Due to full elimination of agonistic responses by 4’-fluoro-6-methoxyflavanone (6) on
hTAS2R39, this molecule seemed to be the most effective antagonist identified in this
study. The mechanism of antagonism was further clarified by measuring dose-response
curves of ECG (Figure 7A) and denatonium benzoate (Figure 7B) in the presence of
various concentrations of (6). Two effects were observed upon increasing antagonist
concentrations: the dose-response curves shifted to the right, and the signal amplitudes
decreased. The dose-response curves for the inhibition of ECG and denatonium benzoate
showed the same pattern. EC50 values at all antagonist concentrations were calculated and
are given in Table 4.
To distinguish between reversible and irreversible inhibition, washout experiments
were performed. In Figure 7C it can clearly be seen that the inhibition was reversible.
Table 4. EC50 values of ECG and denatonium benzoate in the presence of various
concentrations of 4’-fluoro-6-methoxyflavanone (6) on hTAS2R39.
Concentration of 4’-fluoro-6-methoxyflavanone
0 µM 50 µM 100 µM 200 µM
ECG 128 µM 156 µM 501 µM 781 µM
Denatonium benzoate 659 µM 1.09 mM 3.36 mM 6.94 mM
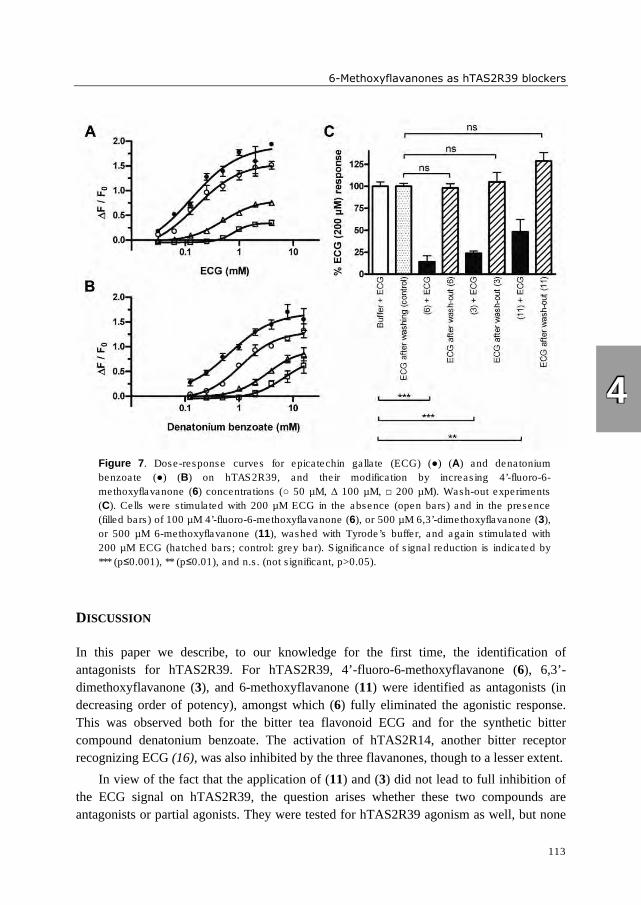
6-Methoxyflavanones as hTAS2R39 blockers
113
Figure 7. Dose-response curves for epicatechin gallate (ECG) (●) (A) and denatonium
benzoate (●) (B) on hTAS2R39, and their modification by increasing 4’-fluoro-6-
methoxyflavanone (6) concentrations (○ 50 µM, ∆ 100 µM, □ 200 µM). Wash-out experiments
(C). Cells were stimulated with 200 µM ECG in the absence (open bars) and in the presence
(filled bars) of 100 µM 4’-fluoro-6-methoxyflavanone (6), or 500 µM 6,3’-dimethoxyflavanone (3),
or 500 µM 6-methoxyflavanone (11), washed with Tyrode’s buffer, and again stimulated with
200 µM ECG (hatched bars; control: grey bar). Significance of signal reduction is indicated by
*** (p≤0.001), ** (p≤0.01), and n.s. (not significant, p>0.05).
DISCUSSION
In this paper we describe, to our knowledge for the first time, the identification of
antagonists for hTAS2R39. For hTAS2R39, 4’-fluoro-6-methoxyflavanone (6), 6,3’-
dimethoxyflavanone (3), and 6-methoxyflavanone (11) were identified as antagonists (in
decreasing order of potency), amongst which (6) fully eliminated the agonistic response.
This was observed both for the bitter tea flavonoid ECG and for the synthetic bitter
compound denatonium benzoate. The activation of hTAS2R14, another bitter receptor
recognizing ECG (16), was also inhibited by the three flavanones, though to a lesser extent.
In view of the fact that the application of (11) and (3) did not lead to full inhibition of
the ECG signal on hTAS2R39, the question arises whether these two compounds are
antagonists or partial agonists. They were tested for hTAS2R39 agonism as well, but none
4
Chapter 4
114
of them activated the receptor (data not shown). Hence, they probably act as real
antagonists.
Structural requirements for hTAS2R39 antagonists
Several flavanones similar to the antagonists identified did not show inhibitory activity
towards bitter receptor hTAS2R39. It turned out that only flavanones with a methoxy group
on the 6-position of the A-ring, and various B-ring configurations were able to act as
antagonists of hTAS2R39, as flavanone (5) (substitution of flavanone crucial for
inhibition), 6-hydroxyflavanone (8) (methoxy-substitution crucial for inhibition), 4’-
methoxyflavanone (13) (A-ring methoxylation crucial for inhibition), and 7-
methoxyflavanone (12) (6-position crucial for inhibition) did not show inhibitory activity.
Additionally, the compound 6-methoxyflavone was unable to inhibit hTAS2R39 activation
(data not shown), which indicated that absence of a double bond in the C-ring is essential
for inhibition.
Amongst the antagonists identified for hTAS2R39, the difference in substitution of the
B-ring determined the blocking potency. Compound (11), which is unsubstituted on the B-
ring, showed poor blocking behavior compared to (6) and (3). It might be speculated that
size, electronegativity and/or electron withdrawing effect of the B-ring substituent
influences the potency of antagonists.
Pharmacological characterization of 4’-fluoro-6-methoxyflavanone
Due to full elimination of agonistic responses by 4’-fluoro-6-methoxyflavanone (6) on
hTAS2R39, this molecule was investigated further with respect to a possible antagonistic
mechanism. Two effects were observed when increasing 4’-fluoro-6-methoxyflavanone
concentrations: the dose-response curves shifted to the right, and the signal amplitudes
decreased. These phenomena suggest that it can be classified as insurmountable antagonist
(22). This curve pattern can be an indication for three different mechanisms: (i) irreversible
antagonism, (ii) reversible non-competitive orthosteric antagonism, in which an equilibrium
is not reached, and (iii) reversible insurmountable allosteric antagonism (22). Washout
experiments (Figure 7C) clearly showed that the ECG responses after washing-out the
antagonist were similar to the ECG responses prior to application of the antagonist. It can
thus be concluded that the interaction was reversible. Next, in order to distinguish between
(ii) and (iii), the antagonistic behavior towards another, structurally different, agonist was
investigated. If the antagonist would be unable to inhibit a structurally different agonist, it
would strongly suggest allosteric antagonism (22). As can be seen in Figure 7B, the
synthetic hTAS2R39 agonist denatonium benzoate was also inhibited by 4’-fluoro-6-
methoxyflavanone and exhibited a curve pattern almost alike that by ECG upon different
blocker concentrations. Analogous results for two structurally different agonists might on
6-Methoxyflavanones as hTAS2R39 blockers
115
the one hand indicate orthosteric antagonism, but on the other hand they do not completely
exclude allosteric antagonism (22).
For hTAS2R46, hTAS2R31, hTAS2R43 (23), hTAS2R16 (24), and hTAS2R38 (25),
docking simulations into homology models, validated by site-directed mutagenesis, have
predicted the presence of a single binding pocket in the respective bitter receptors.
Furthermore, the mechanism of antagonism of GIV3727 on hTAS2R31 was described as
orthosteric, insurmountable antagonism (5), supported by docking the antagonist into the
same binding pocket as the agonist. In contrast, one study suggests allosteric antagonism as
mechanism for inhibition of hTAS2R16 and hTAS2R38 by probenecid (6). No information
has been reported yet on the binding pocket of hTAS2R39. As the majority of studies
suggests the presence of a single binding pocket in different bitter receptors, an orthosteric
mechanism seems most likely for explaining our observations.
Application of bitter receptor blockers
For application of blockers in food products, several requirements should be met. (i) The
blocker should be functional at a low dose. Therefore, an antagonist that has to be applied
in equimolar or higher quantity to the agonist, is not efficient. (ii) In order to block the
bitter taste of dietary compounds, for practical reasons, it is necessary that a bitter receptor
blocker is also functional when applied simultaneously with the bitter compound.
Therefore, compounds like (3) and (6) seem to be more suitable than (11). (iii) In order to
achieve a sensorial effect, blocking of all bitter receptors activated by one compound is
desirable. A blocker, that can only inhibit hTAS2R39, but not hTAS2R14, might be too
specific to effectively reduce bitterness of ECG. On the other hand, it is not known yet
whether these two receptors have an equally important role in the mouth. (iv) The blocker
should preferably be of natural origin, and should be available in sufficient quantity. We
could not find any natural source of the three inhibitors described in this study, and assume
that they are only available synthetically. (v) Only compounds that are known as safe for
consumption are of interest for food applications. Due to unknown safety of 4’-fluoro-6-
methoxyflavanone, we abstained from sensory tests, which might confirm the function as
bitter taste blocker in vivo. As not all criteria are met by the blockers discovered in the
present study, they might not be applicable to food products. Nevertheless, a 6-methoxy
substituent on the A-ring of a flavanone has been identified as important for inhibition of
hTAS2R39, which might form the basis for other, more suitable, blockers.
4
Chapter 4
116
ACKNOWLDGEMENTS
We thank Dr. Guus Duchateau (Unilever Vlaardingen, The Netherlands) for constructive
discussions about bitter receptor pharmacology. This work was financially supported by the
Food & Nutrition Delta of the Ministry of Economic Affairs, the Netherlands (FND 08019).
REFERENCES
1. Drewnowski, A.; Gomez-Carneros, C. Bitter taste, phytonutrients, and the consumer: A review.
American Journal of Clinical Nutrition 2000, 72 (6), 1424-1435.
2. Ley, J. P. Masking taste by molecules. Chemosensory Perception 2008, 1 (1), 58-77.
3. Meyerhof, W.; Batram, C.; Kuhn, C.; Brockhoff, A.; Chudoba, E.; Bufe, B.; Appendino, G.;
Behrens, M. The molecular receptive ranges of human TAS2R bitter taste receptors. Chemical
Senses 2010, 35 (2), 157-170.
4. Thalmann, S.; Behrens, M.; Meyerhof, W. Major haplotypes of the human bitter taste receptor
TAS2R41 encode functional receptors for chloramphenicol. Biochemical and Biophysical
Research Communications 2013, 435 (2), 267-273.
5. Slack, J. P.; Brockhoff, A.; Batram, C.; Menzel, S.; Sonnabend, C.; Born, S.; Galindo, M. M.;
Kohl, S.; Thalmann, S.; Ostopovici-Halip, L.; Simons, C. T.; Ungureanu, I.; Duineveld, K.;
Bologa, C. G.; Behrens, M.; Furrer, S.; Oprea, T. I.; Meyerhof, W. Modulation of bitter taste
perception by a small molecule hTAS2R antagonist. Current Biology 2010, 20 (12), 1104-
1109.
6. Greene, T. A.; Alarcon, S.; Thomas, A.; Berdougo, E.; Doranz, B. J.; Breslin, P. A. S.; Rucker, J.
B. Probenecid inhibits the human bitter taste receptor TAS2R16 and suppresses bitter
perception of salicin. PLoS ONE 2011, 6 (5), e20123.
7. Brockhoff, A.; Behrens, M.; Roudnitzky, N.; Appendino, G.; Avonto, C.; Meyerhof, W. Receptor
agonism and antagonism of dietary bitter compounds. Journal of Neuroscience 2011, 31 (41),
14775-14872.
8. Ley, J. P.; Dessoy, M.; Paetz, S.; Blings, M.; Hoffmann-Lücke, P.; Reichelt, K. V.; Krammer, G.
E.; Pienkny, S.; Brandt, W.; Wessjohann, L. Identification of enterodiol as a masker for
caffeine bitterness by using a pharmacophore model based on structural analogues of
homoeriodictyol. Journal of Agricultural and Food Chemistry 2012, 60 (25), 6303-6311.
9. Ley, J. P.; Krammer, G.; Reinders, G.; Gatfield, I. L.; Bertram, H. J. Evaluation of bitter masking
flavanones from Herba Santa (Eriodictyon californicum (H. & A.) Torr., Hydrophyllaceae).
Journal of Agricultural and Food Chemistry 2005, 53 (15), 6061-6066.
10. Fletcher, J. N.; Kinghorn, A. D.; Slack, J. P.; McCluskey, T. S.; Odley, A.; Jia, Z. In vitro
evaluation of flavonoids from Eriodictyon californicum for antagonist activity against the
bitterness receptor hTAS2R31. Journal of Agricultural and Food Chemistry 2011, 59 (24),
13117-13121.
11. Narukawa, M.; Noga, C.; Ueno, Y.; Sato, T.; Misaka, T.; Watanabe, T. Evaluation of the
bitterness of green tea catechins by a cell-based assay with the human bitter taste receptor
hTAS2R39. Biochemical and Biophysical Research Communications 2011, 405 (4), 620-625.
6-Methoxyflavanones as hTAS2R39 blockers
117
12. Soares, S.; Kohl, S.; Thalmann, S.; Mateus, N.; Meyerhof, W.; De Freitas, V. Different phenolic
compounds activate distinct human bitter taste receptors. Journal of Agricultural and Food
Chemistry 2013, 61 (7), 1525-1533.
13. Ueno, Y.; Sakurai, T.; Okada, S.; Abe, K.; Misaka, T. Human bitter taste receptors hTAS2R8 and
hTAS2R39 with differential functions to recognize bitter peptides. Bioscience, Biotechnology
and Biochemistry 2011, 75 (6), 1188-1190.
14. Kohl, S.; Behrens, M.; Dunkel, A.; Hofmann, T.; Meyerhof, W. Amino acids and peptides
activate at least five members of the human bitter taste receptor family. Journal of
Agricultural and Food Chemistry 2013, 61 (1), 53-60.
15. Roland, W. S. U.; Vincken, J. P.; Gouka, R. J.; van Buren, L.; Gruppen, H.; Smit, G. Soy
isoflavones and other isoflavonoids activate the human bitter taste receptors hTAS2R14 and
hTAS2R39. Journal of Agricultural and Food Chemistry 2011, 59 (21), 11764-11771.
16. Roland, W. S. U.; van Buren, L.; Gruppen, H.; Driesse, M.; Gouka, R. J.; Smit, G.; Vincken, J.-P.
Bitter taste receptor activation by flavonoids and isoflavonoids: Modeled structural
requirements for activation of hTAS2R14 and hTAS2R39. Journal of Agricultural and Food
Chemistry 2013, 61 (44), 10454-10466.
17. Ueda, T.; Ugawa, S.; Yamamura, H.; Imaizumi, Y.; Shimada, S. Functional interaction between
T2R taste receptors and G-protein a subunits expressed in taste receptor cells. Journal of
Neuroscience 2003, 23 (19), 7376-7380.
18. Behrens, M.; Brockhoff, A.; Kuhn, C.; Bufe, B.; Winnig, M.; Meyerhof, W. The human taste
receptor hTAS2R14 responds to a variety of different bitter compounds. Biochemical and
Biophysical Research Communications 2004, 319 (2), 479-485.
19. Chandrashekar, J.; Mueller, K. L.; Hoon, M. A.; Adler, E.; Feng, L.; Guo, W.; Zuker, C. S.; Ryba,
N. J. P. T2Rs function as bitter taste receptors. Cell 2000, 100 (6), 703-711.
20. Kuhn, C.; Bufe, B.; Winnig, M.; Hofmann, T.; Frank, O.; Behrens, M.; Lewtschenko, T.; Slack, J.
P.; Ward, C. D.; Meyerhof, W. Bitter taste receptors for saccharin and acesulfame K. Journal
of Neuroscience 2004, 24 (45), 10260-10265.
21. Kenakin, T. A Pharmacology Primer. Theory, Applications and Methods.; 2 ed.; Academic Press:
New York, NY, USA 2006.
22. Kenakin, T.; Jenkinson, S.; Watson, C. Determining the potency and molecular mechanism of
action of insurmountable antagonists. Journal of Pharmacology and Experimental
Therapeutics 2006, 319 (2), 710-723.
23. Brockhoff, A.; Behrens, M.; Niv, M. Y.; Meyerhof, W. Structural requirements of bitter taste
receptor activation. Proceedings of the National Academy of Sciences of the United States of
America 2010, 107 (24), 11110-11115.
24. Sakurai, T.; Misaka, T.; Ishiguro, M.; Masuda, K.; Sugawara, T.; Ito, K.; Kobayashi, T.; Matsuo,
S.; Ishimaru, Y.; Asakura, T.; Abe, K. Characterization of the beta-D-glucopyranoside
binding site of the human bitter taste receptor hTAS2R16. Journal of Biological Chemistry
2010, 285 (36), 28373-28378.
25. Biarnés, X.; Marchiori, A.; Giorgetti, A.; Lanzara, C.; Gasparini, P.; Carloni, P.; Born, S.;
Brockhoff, A.; Behrens, M.; Meyerhof, W. Insights into the binding of phenyltiocarbamide
(PTC) agonist to its target human TAS2R38 bitter receptor. PLoS ONE 2010, 5 (8), e12394.
4

Chapter 4
118
Chapter 5
Evaluation of the bitter-masking potential of
food proteins for EGCG by a cell-based human
bitter taste receptor assay and binding studies
Based on: Maxime C. Bohin, Wibke S.U. Roland, Harry Gruppen, Robin J. Gouka, Harry
T.W.M. van der Hijden, Peter Dekker, Gerrit Smit, Jean-Paul Vincken. Evaluation of the
bitter-masking potential of food proteins for EGCG by a cell-based human bitter taste
receptor assay and binding studies. Journal of Agricultural and Food Chemistry 2013 61
(42), 10010-10017.
5
Chapter 5
120
ABSTRACT
Epigallocatechin gallate (EGCG) has been ascribed to several health benefits, but its bitter
taste influences the liking of products with high concentrations of this compound. β-Casein,
in particular, and several gelatins are known as strong binders of EGCG, contrary to β-
lactoglobulin. The current study aimed at relating the EGCG-binding characteristics of
those proteins, and their food-grade equivalents, to their effects on reducing bitter receptor
activation by EGCG in vitro and their bitter-masking potential in vivo. Also in the bitter
receptor assay, β-casein showed the strongest effect, with a maximum reduction of
hTAS2R39 activation of about 93%. A similar potency was observed for Na-caseinate. β-
Lactoglobulin had little effect on bitter receptor activation, as expected based on its low
binding affinity for EGCG. The bitter-masking potential of Na-caseinate was confirmed in
vivo using a trained sensory panel. β-Lactoglobulin also slightly reduced EGCG bitter
perception, which could not be directly related to its binding capacity. The bitter receptor
assay appeared to be a valid tool to evaluate in vitro the efficacy of food proteins as
complexing agents for bitter-masking.
Bitter masking potential of food proteins for EGCG
121
INTRODUCTION
Epigallocatechin gallate (EGCG) is known to be the most abundant catechin in green tea
(ca. 60 % of the total catechins) and has been ascribed to several beneficial health effects
(e.g. anticarcinogenic and cardioprotective effects) (1). With respect to taste, tea catechins
are known to be astringent and bitter (2). The mechanism of astringency perception is not
yet fully defined, but can be partially attributed to the interaction of EGCG with salivary
proteins. Astringency seems sensorially coupled with bitterness, although, compared to the
latter, it has been usually reported as a secondary attribute in time-intensity experiments (3,
4).On the human tongue, bitter compounds are perceived by bitter taste receptors, referred
to as hTAS2Rs, which are part of the family of G-protein coupled receptors (5). To date, 21
hTAS2Rs out of the 25 known have identified agonists (6, 7). Amongst these, hTAS2R39
has been associated with taste perception of green tea catechins (8). As evaluated in vitro
with hTAS2R39, EGCG has a two times lower EC50 value (181.6 µM) compared to its non-
galloylated equivalent epigallocatechin (EGC; EC50 = 395.5 µM). This difference was
confirmed in vivo by a higher perceived bitterness for EGCG (2, 8).
Effective health benefits against cardiovascular and metabolic diseases have been
associated with a daily intake of green tea containing 200-300 mg of EGCG (9). Food
products with high concentrations of EGCG may have off-tastes and consequently low
consumer acceptance (10). Various approaches to modulate bitterness of bioactive
compounds in functional foods have been described, such as the use of sweeteners, blockers
for bitter taste receptors and complexation with other compounds. In the latter approach,
cyclodextrins are the most commonly used carriers while other carriers (e.g. proteins) are
seldomly reported (10-13). A typical example of off-taste reduction in food is the addition
of milk to tea, which has been linked to the interaction of tea catechins with milk proteins
(3) without impairing their bioavailability (14). Milk proteins have also been suggested as
carriers for bioactive compounds and, in particular, thermally-induced β-lactoglobulin-
EGCG complexes (12, 15).
In our previous work (16), we investigated the potential of food proteins as carriers for
flavonoids. Based on affinities and binding capacities measured, β-casein and gelatins, in
particular fish gelatin, were found to be the most promising carriers for EGCG. One
necessary condition for the applicability of those complexes in food is their effective
reduction in bitter taste perception of EGCG. Bitter receptor activation by flavonoids can be
evaluated in vitro by a cell-based receptor assay (8, 17). To our knowledge, the present
study is the first report using such a setup to evaluate the reduction in activation of bitter
receptors by EGCG after forming complexes with proteins. This primary approach can help
to predict the outcome of sensory panels. The aim of the present study was to correlate
EGCG-binding of pure β-casein, food-grade caseinates and several gelatins to the potential
of these proteins for reducing bitterness perception of EGCG. This was first tested in vitro
5
Chapter 5
122
using a cell-based bitter receptor assay and then in vivo with a trained sensory panel, in
order to evaluate the applicability of those complexes in foods.
MATERIALS AND METHODS
Materials
Bovine β-casein (≥98% of total protein), bovine β-lactoglobulin (≥90% of protein), solid
fish gelatin (Gelatin F1) from cold water fish skin, and gelatin type B (Gelatin B1) from
bovine skin (75 bloom) were purchased from Sigma-Aldrich (St. Louis, MO, USA). The
protein contents of the two gelatins were estimated to be ≥90% as detailed in a previous
study (16). Food-grade EGCG (≥94%), Sunphenon 90LB (>80% catechins including ~50%
EGCG), and food-grade calcium and sodium caseinates (protein content ≥90%, N×6.38)
were kindly provided by DSM Nutritional Products (Delft, The Netherlands), Taiyo GmbH
(Filderstadt, Germany) and DMV International (Veghel, The Netherlands), respectively.
Bovine Vinoferm® gelatin powder (≥85% of protein; N×5.55), Vinoferm® gelatin liquid
(20% (w/v) gelatin (supplier information)) and Vinoferm® Isinglass (fish gelatin, 2% (w/v)
protein (supplier information)) were food-grade and purchased from Brouwland (Beverlo,
Belgium). Throughout this study, these gelatins are referred to as gelatin B2, gelatin B3,
and gelatin F2, respectively. Food-grade BioPURE - β-lactoglobulinTM (≥90% of total
protein) was kindly provided by Davisco Food International (Eden Prairie, MN, USA).
Water for in vitro tests was obtained from a Milli-Q system (Millipore, Billerica, MA,
USA). Water (Spa Reine, Spadel Group, Brussels, Belgium) for in vivo tests was obtained
from a local supermarket. All other chemicals were of analytical grade and purchased from
Merck (Darmstadt, Germany).
Assessment of binding of proteins to EGCG by ultrafiltration (UF assay)
Determination of binding parameters of food-grade proteins for EGCG (UF assay –
method 1). All samples were prepared in a 50 mM sodium phosphate buffer, pH 7.0.
Protein stock solutions (0.2 mM) were prepared freshly before each experiment. For both
caseinates, an average molecular mass of 23.3 kDa was calculated from the protein
composition in bovine milk (18). Gelatins were prepared at a concentration equivalent to
0.2 mM β-casein (i.e. 4.72 mg/mL). Similarly, a stock solution of EGCG (6 mM) was used
to obtain a range of dilutions between 0 and 6 mM. EGCG-protein mixtures were prepared
and the binding affinities of each protein towards EGCG measured using an ultrafiltration
microtiter plate setup (Ultracel 10, Millipore, Cork, Ireland) as described previously (16).
The protein-bound and free fractions of EGCG at each concentration tested were
calculated and plots of the bound fraction versus the concentration of free EGCG were used
to determine the binding parameters. For each binding curve obtained, a linear regression
Bitter masking potential of food proteins for EGCG
123
was used on the initial linear increase (R2>0.8) in order to estimate the binding affinity (K)
of the compounds. A maximal binding capacity (Rmax) was derived from the plateau value
or the highest bound fraction observed at high phenolic compound/protein molar ratios.
Binding parameters were reported as mean ±standard deviation (SD) of two replicates.
Determination of [EGCG]free with increasing concentrations of various proteins (UF
assay – method 2)An EGCG stock solution (0.5 mM) and solutions of proteins with
concentrations ranging from 0.013 to 0.2 mM (EGCG-to-protein molar ratios from 2.5 to
40) were prepared in a similar way as described above. The concentration of free EGCG
remaining in the mixtures after incubation was determined using an ultrafiltration microtiter
plate setup as described previously (16).
In vitro assessment of hTAS2R39 activation by intracellular calcium release
Activation of bitter receptors was investigated by the release of intracellular Ca2+, using a
fluorescent calcium dye (19). The expression of hTAS2R39 in HEK293 cells and the
detailed procedure for monitoring its activation were performed as reported elsewhere (17).
All samples were prepared in Tyrode’s buffer (140 mM NaCl, 5 mM KCl, 10 mM
glucose, 1 mM MgCl2, 1 mM CaCl2, and 20 mM Hepes, pH7.4). EGCG stock solution (1
mM) was prepared freshly before each experiment. Similarly, stock solutions of proteins
(0.8 mM) were used to obtain a concentration range from 0.006 to 0.8 mM. Protein-EGCG
complexes were made in a microtiter plate by mixing protein solutions 1:1 with EGCG
solutions. Controls were made by mixing EGCG with buffer without proteins. The
microtiter plate was incubated at room temperature under constant shaking (300 rpm, 10
min).
Next, the complexes were loaded (ratio 1:1 (v/v)) in a microtiter plate containing the
cells (final concentrations of EGCG of 0.25 mM and of protein between 0 and 0.2 mM) and
evaluated for their potential to activate bitter receptor hTAS2R39 at 37 °C with a
FlexStation II 384 (Molecular Devices Corp., Sunnyvale, CA, USA) for 90 s as described
elsewhere (17). Prior to the addition of the complexes to the cells, the baseline signal was
determined in the first 17 s. Then, fluorescence signals (excitation 485 nm/emission 520
nm) were measured until 90 s. As negative control, non-induced cells, which do not express
the hTAS2R receptor, were always measured in parallel. Additionally, a dose-response
curve of EGCG was determined in the same way by measuring concentrations of EGCG up
to 1 mM without proteins. Measurements were performed at least in duplicates on two or
more different days.
Sensory analysis
Panelists. The panel consisted of 13 persons (10 males and 3 females), which were part of a
larger sensory panel familiar to bitterness rating and selected within Unilever R&D
5
Chapter 5
124
(Vlaardingen, The Netherlands) for their ability to taste and rank bitterness. Panelists could
join each session on a voluntary basis and participated in at least one of the sessions
described below. Panelists were trained to taste bitterness and rate it on a scale from 1 to 10
using a known reference (Sunphenon 90 LB). Sunphenon 90 LB was sensorially close to
EGCG as it was mostly bitter with a low astringency (supplier information) (2). The ratings
reported were relative to this EGCG-rich reference and not to pure EGCG. No specific
training was conducted to discriminate between astringency and bitterness.
Sample preparation. Proteins (10 g/L) and EGCG (1 g/L) stock solutions were
prepared freshly before each experiment. The compounds were dissolved in water (Spa
Reine), known for its neutral pH and low content in minerals. EGCG was mixed 1:1 with
each protein solution and incubated at room temperature for at least 10 min. 15 mL of each
sample was poured into a yellow cup. The colored cups were used to limit the visual
perception of the differences between samples (e.g. slight haze or color) with or without
proteins and thus to limit its possible impact on the choice and rating by the panelists.
Additionally, three solutions of Sunphenon 90 LB were prepared: Two references known to
the panelists (0.3 g/L and 0.8 g/L) and one unknown to the panelists (0.4 or 0.5 g/L). The
former were used as a calibration for the panelists prior to and throughout each session. The
latter was used by the panelists to check the accuracy of their rating at the beginning of
each session.
Selection of suitable food-grade proteins for quantitative sensory analysis. A
preliminary session was organized to select food-grade proteins with the highest potential
for bitterness reduction. Volunteers from the panel (n=8) were allowed to taste a known
sample with only EGCG (0.5 g/L) and rate it against the references. Then, each protein-
EGCG sample was tasted, described individually and subsequently discussed with the other
panelists. The group rating and the most recurrent descriptors were used to select the most
suitable proteins for further experiments.
2-Alternative Forced Choice (2-AFC) test. EGCG complexed with Na-caseinate and β-
lactoglobulin were evaluated in duplicate against a control EGCG sample without proteins.
The experiment was conducted on two different days with 12 panelists and 6 of them were
present on both days (n=36 per sample). Pairs of samples were all provided at once to each
panelist. In between samples, panelists were instructed to rinse their mouth with water or
milk, and to eat a piece of cucumber or plain cracker. For each pair, panelists had to
indicate which sample was the most bitter and to rate the two samples on a scale from 0 to
10 as described above.
Ranking test. EGCG (1 g/L) was mixed 1:1 with 4 different concentrations of Na-
caseinate (2, 5, 10, and 15 g/L) and prepared as described above. Panelists were provided
with a series of 5 samples in duplicate (13 panelists, n=26 per sample) and were instructed
to rank them in order of increasing bitterness and rate them on a scale from 0 to 10 as
described above. Series included one control containing only EGCG (0.5 g/L) and no
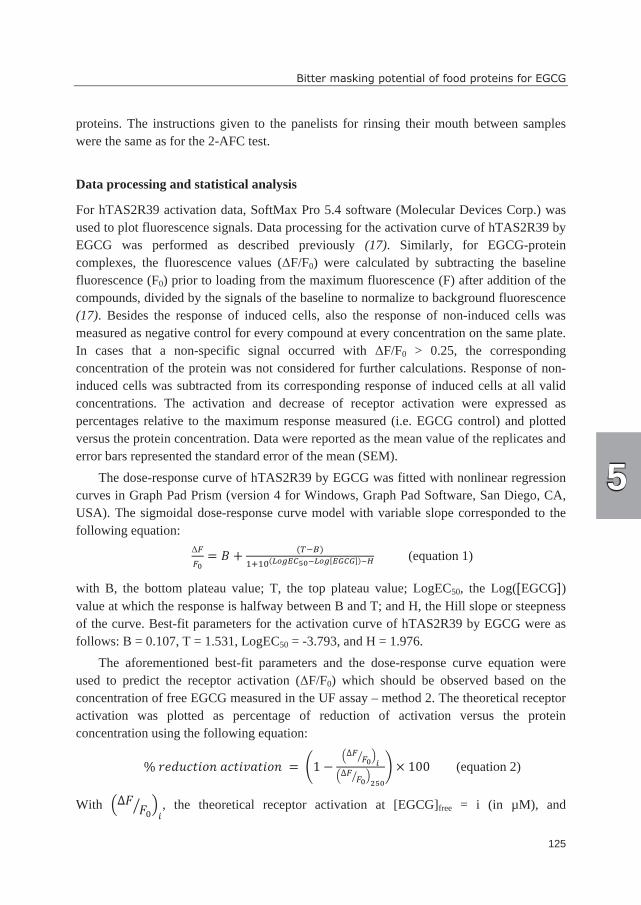
Bitter masking potential of food proteins for EGCG
125
proteins. The instructions given to the panelists for rinsing their mouth between samples
were the same as for the 2-AFC test.
Data processing and statistical analysis
For hTAS2R39 activation data, SoftMax Pro 5.4 software (Molecular Devices Corp.) was
used to plot fluorescence signals. Data processing for the activation curve of hTAS2R39 by
EGCG was performed as described previously (17). Similarly, for EGCG-protein
complexes, the fluorescence values (∆F/F0) were calculated by subtracting the baseline
fluorescence (F0) prior to loading from the maximum fluorescence (F) after addition of the
compounds, divided by the signals of the baseline to normalize to background fluorescence
(17). Besides the response of induced cells, also the response of non-induced cells was
measured as negative control for every compound at every concentration on the same plate.
In cases that a non-specific signal occurred with ∆F/F0 > 0.25, the corresponding
concentration of the protein was not considered for further calculations. Response of non-
induced cells was subtracted from its corresponding response of induced cells at all valid
concentrations. The activation and decrease of receptor activation were expressed as
percentages relative to the maximum response measured (i.e. EGCG control) and plotted
versus the protein concentration. Data were reported as the mean value of the replicates and
error bars represented the standard error of the mean (SEM).
The dose-response curve of hTAS2R39 by EGCG was fitted with nonlinear regression
curves in Graph Pad Prism (version 4 for Windows, Graph Pad Software, San Diego, CA,
USA). The sigmoidal dose-response curve model with variable slope corresponded to the
following equation:
∆��� = � + (��)
��� (�����������������)�� (equation 1)
with B, the bottom plateau value; T, the top plateau value; LogEC50, the Log([EGCG])
value at which the response is halfway between B and T; and H, the Hill slope or steepness
of the curve. Best-fit parameters for the activation curve of hTAS2R39 by EGCG were as
follows: B = 0.107, T = 1.531, LogEC50 = -3.793, and H = 1.976.
The aforementioned best-fit parameters and the dose-response curve equation were
used to predict the receptor activation (∆F/F0) which should be observed based on the
concentration of free EGCG measured in the UF assay – method 2. The theoretical receptor
activation was plotted as percentage of reduction of activation versus the protein
concentration using the following equation:
%����� !"#$� !%$ !"# = &1 − )∆� ��+ ,-)∆� ��+ ,.��
/ × 100 (equation 2)
With )∆2 2 + ,3, the theoretical receptor activation at [EGCG]free = i (in µM), and
5
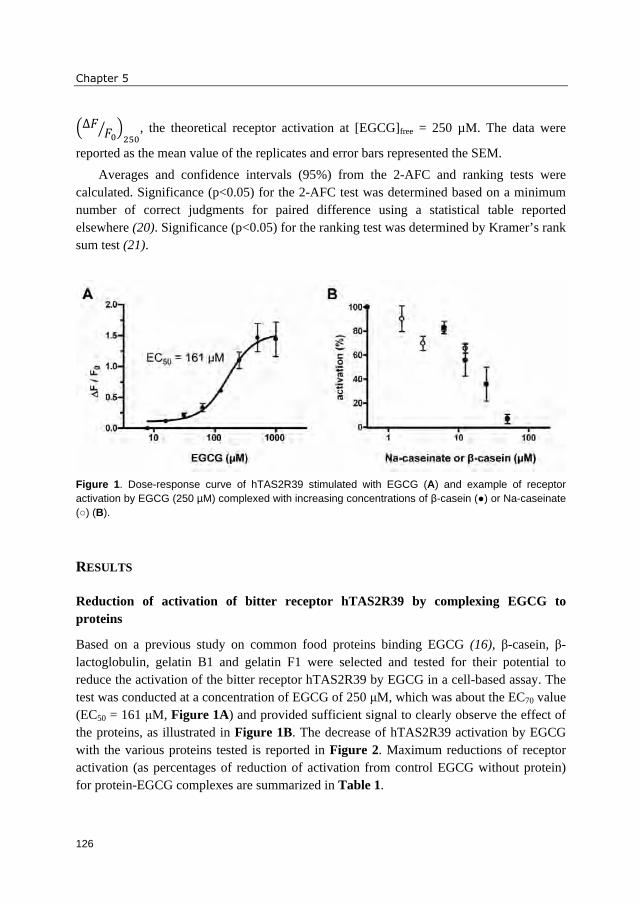
Chapter 5
126
)∆2 2 + ,45 , the theoretical receptor activation at [EGCG]free = 250 µM. The data were
reported as the mean value of the replicates and error bars represented the SEM.
Averages and confidence intervals (95%) from the 2-AFC and ranking tests were
calculated. Significance (p<0.05) for the 2-AFC test was determined based on a minimum
number of correct judgments for paired difference using a statistical table reported
elsewhere (20). Significance (p<0.05) for the ranking test was determined by Kramer’s rank
sum test (21).
Figure 1. Dose-response curve of hTAS2R39 stimulated with EGCG (A) and example of receptor
activation by EGCG (250 µM) complexed with increasing concentrations of β-casein (●) or Na-caseinate
(○) (B).
RESULTS
Reduction of activation of bitter receptor hTAS2R39 by complexing EGCG to
proteins
Based on a previous study on common food proteins binding EGCG (16), β-casein, β-
lactoglobulin, gelatin B1 and gelatin F1 were selected and tested for their potential to
reduce the activation of the bitter receptor hTAS2R39 by EGCG in a cell-based assay. The
test was conducted at a concentration of EGCG of 250 µM, which was about the EC70 value
(EC50 = 161 µM, Figure 1A) and provided sufficient signal to clearly observe the effect of
the proteins, as illustrated in Figure 1B. The decrease of hTAS2R39 activation by EGCG
with the various proteins tested is reported in Figure 2. Maximum reductions of receptor
activation (as percentages of reduction of activation from control EGCG without protein)
for protein-EGCG complexes are summarized in Table 1.
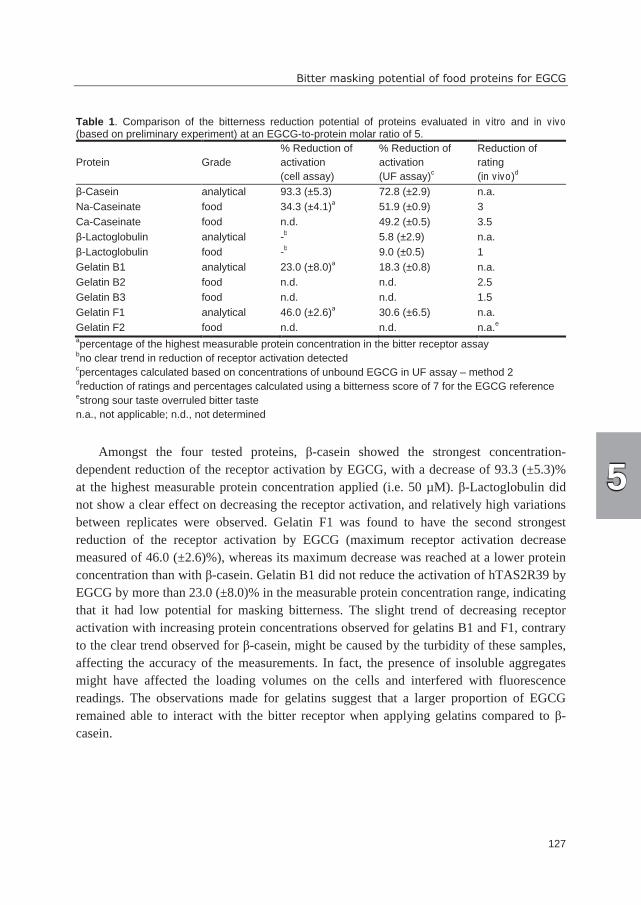
Bitter masking potential of food proteins for EGCG
127
Table 1. Comparison of the bitterness reduction potential of proteins evaluated in vitro and in vivo (based on preliminary experiment) at an EGCG-to-protein molar ratio of 5.
Protein Grade
% Reduction of
activation
(cell assay)
% Reduction of
activation
(UF assay)c
Reduction of
rating
(in vivo)d
β-Casein analytical 93.3 (±5.3) 72.8 (±2.9) n.a.
Na-Caseinate food 34.3 (±4.1)a 51.9 (±0.9) 3
Ca-Caseinate food n.d. 49.2 (±0.5) 3.5
β-Lactoglobulin analytical -b 5.8 (±2.9) n.a.
β-Lactoglobulin food -b 9.0 (±0.5) 1
Gelatin B1 analytical 23.0 (±8.0)a 18.3 (±0.8) n.a.
Gelatin B2 food n.d. n.d. 2.5
Gelatin B3 food n.d. n.d. 1.5
Gelatin F1 analytical 46.0 (±2.6)a 30.6 (±6.5) n.a.
Gelatin F2 food n.d. n.d. n.a.e
apercentage of the highest measurable protein concentration in the bitter receptor assay
bno clear trend in reduction of receptor activation detected
cpercentages calculated based on concentrations of unbound EGCG in UF assay – method 2
dreduction of ratings and percentages calculated using a bitterness score of 7 for the EGCG reference
estrong sour taste overruled bitter taste
n.a., not applicable; n.d., not determined
Amongst the four tested proteins, β-casein showed the strongest concentration-
dependent reduction of the receptor activation by EGCG, with a decrease of 93.3 (±5.3)%
at the highest measurable protein concentration applied (i.e. 50 µM). β-Lactoglobulin did
not show a clear effect on decreasing the receptor activation, and relatively high variations
between replicates were observed. Gelatin F1 was found to have the second strongest
reduction of the receptor activation by EGCG (maximum receptor activation decrease
measured of 46.0 (±2.6)%), whereas its maximum decrease was reached at a lower protein
concentration than with β-casein. Gelatin B1 did not reduce the activation of hTAS2R39 by
EGCG by more than 23.0 (±8.0)% in the measurable protein concentration range, indicating
that it had low potential for masking bitterness. The slight trend of decreasing receptor
activation with increasing protein concentrations observed for gelatins B1 and F1, contrary
to the clear trend observed for β-casein, might be caused by the turbidity of these samples,
affecting the accuracy of the measurements. In fact, the presence of insoluble aggregates
might have affected the loading volumes on the cells and interfered with fluorescence
readings. The observations made for gelatins suggest that a larger proportion of EGCG
remained able to interact with the bitter receptor when applying gelatins compared to β-
casein.
5
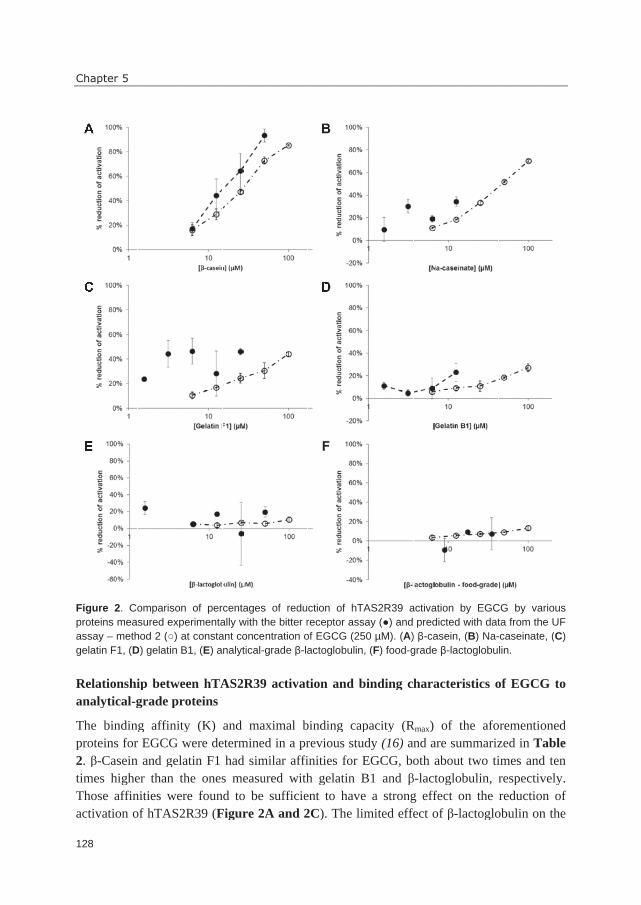
Chapter 5
128
Figure 2
proteins measured experimentally with the bitter receptor assay (
assay
gelatin F1, (
Relationship between hTAS2R39 activation and binding characteris
analytical
The binding affinity (K) and maximal binding capacity (R
proteins for EGCG were determined in a previous study
2. β
times higher than the ones measured with gelatin B1 and
Those affinities were found to be sufficient to hav
activation of hTAS2R39 (
Chapter 5
Figure 2
proteins measured experimentally with the bitter receptor assay (
assay – method 2 (
gelatin F1, (
Relationship between hTAS2R39 activation and binding characteris
analytical
The binding affinity (K) and maximal binding capacity (R
proteins for EGCG were determined in a previous study
. β-Casein and gelatin F1 had similar affinities for EGCG, both about two times and ten
times higher than the ones measured with gelatin B1 and
Those affinities were found to be sufficient to hav
activation of hTAS2R39 (
Chapter 5
Figure 2. Comparison
proteins measured experimentally with the bitter receptor assay (
method 2 (
gelatin F1, (D
Relationship between hTAS2R39 activation and binding characteris
analytical-grade proteins
The binding affinity (K) and maximal binding capacity (R
proteins for EGCG were determined in a previous study
Casein and gelatin F1 had similar affinities for EGCG, both about two times and ten
times higher than the ones measured with gelatin B1 and
Those affinities were found to be sufficient to hav
activation of hTAS2R39 (
Comparison
proteins measured experimentally with the bitter receptor assay (
method 2 (
D) gelatin B1, (
Relationship between hTAS2R39 activation and binding characteris
grade proteins
The binding affinity (K) and maximal binding capacity (R
proteins for EGCG were determined in a previous study
Casein and gelatin F1 had similar affinities for EGCG, both about two times and ten
times higher than the ones measured with gelatin B1 and
Those affinities were found to be sufficient to hav
activation of hTAS2R39 (
Comparison
proteins measured experimentally with the bitter receptor assay (
method 2 (○) at constant concentration of EGCG (250 µM). (
) gelatin B1, (
Relationship between hTAS2R39 activation and binding characteris
grade proteins
The binding affinity (K) and maximal binding capacity (R
proteins for EGCG were determined in a previous study
Casein and gelatin F1 had similar affinities for EGCG, both about two times and ten
times higher than the ones measured with gelatin B1 and
Those affinities were found to be sufficient to hav
activation of hTAS2R39 (
Comparison of percentages of reduction of hTAS2R39 activation by EGCG by various
proteins measured experimentally with the bitter receptor assay (
○) at constant concentration of EGCG (250 µM). (
) gelatin B1, (
Relationship between hTAS2R39 activation and binding characteris
grade proteins
The binding affinity (K) and maximal binding capacity (R
proteins for EGCG were determined in a previous study
Casein and gelatin F1 had similar affinities for EGCG, both about two times and ten
times higher than the ones measured with gelatin B1 and
Those affinities were found to be sufficient to hav
activation of hTAS2R39 (
of percentages of reduction of hTAS2R39 activation by EGCG by various
proteins measured experimentally with the bitter receptor assay (
) at constant concentration of EGCG (250 µM). (
) gelatin B1, (E) analytical
Relationship between hTAS2R39 activation and binding characteris
grade proteins
The binding affinity (K) and maximal binding capacity (R
proteins for EGCG were determined in a previous study
Casein and gelatin F1 had similar affinities for EGCG, both about two times and ten
times higher than the ones measured with gelatin B1 and
Those affinities were found to be sufficient to hav
activation of hTAS2R39 (Figure 2
of percentages of reduction of hTAS2R39 activation by EGCG by various
proteins measured experimentally with the bitter receptor assay (
) at constant concentration of EGCG (250 µM). (
) analytical
Relationship between hTAS2R39 activation and binding characteris
The binding affinity (K) and maximal binding capacity (R
proteins for EGCG were determined in a previous study
Casein and gelatin F1 had similar affinities for EGCG, both about two times and ten
times higher than the ones measured with gelatin B1 and
Those affinities were found to be sufficient to hav
Figure 2
of percentages of reduction of hTAS2R39 activation by EGCG by various
proteins measured experimentally with the bitter receptor assay (
) at constant concentration of EGCG (250 µM). (
) analytical-grade
Relationship between hTAS2R39 activation and binding characteris
The binding affinity (K) and maximal binding capacity (R
proteins for EGCG were determined in a previous study
Casein and gelatin F1 had similar affinities for EGCG, both about two times and ten
times higher than the ones measured with gelatin B1 and
Those affinities were found to be sufficient to hav
Figure 2A and 2C
of percentages of reduction of hTAS2R39 activation by EGCG by various
proteins measured experimentally with the bitter receptor assay (
) at constant concentration of EGCG (250 µM). (
grade
Relationship between hTAS2R39 activation and binding characteris
The binding affinity (K) and maximal binding capacity (R
proteins for EGCG were determined in a previous study
Casein and gelatin F1 had similar affinities for EGCG, both about two times and ten
times higher than the ones measured with gelatin B1 and
Those affinities were found to be sufficient to hav
A and 2C
of percentages of reduction of hTAS2R39 activation by EGCG by various
proteins measured experimentally with the bitter receptor assay (
) at constant concentration of EGCG (250 µM). (
grade β-lactoglobulin, (
Relationship between hTAS2R39 activation and binding characteris
The binding affinity (K) and maximal binding capacity (R
proteins for EGCG were determined in a previous study
Casein and gelatin F1 had similar affinities for EGCG, both about two times and ten
times higher than the ones measured with gelatin B1 and
Those affinities were found to be sufficient to hav
A and 2C
of percentages of reduction of hTAS2R39 activation by EGCG by various
proteins measured experimentally with the bitter receptor assay (
) at constant concentration of EGCG (250 µM). (
lactoglobulin, (
Relationship between hTAS2R39 activation and binding characteris
The binding affinity (K) and maximal binding capacity (R
proteins for EGCG were determined in a previous study
Casein and gelatin F1 had similar affinities for EGCG, both about two times and ten
times higher than the ones measured with gelatin B1 and
Those affinities were found to be sufficient to hav
A and 2C). The limited effect of
of percentages of reduction of hTAS2R39 activation by EGCG by various
proteins measured experimentally with the bitter receptor assay (
) at constant concentration of EGCG (250 µM). (
lactoglobulin, (
Relationship between hTAS2R39 activation and binding characteris
The binding affinity (K) and maximal binding capacity (R
proteins for EGCG were determined in a previous study
Casein and gelatin F1 had similar affinities for EGCG, both about two times and ten
times higher than the ones measured with gelatin B1 and
Those affinities were found to be sufficient to hav
). The limited effect of
of percentages of reduction of hTAS2R39 activation by EGCG by various
proteins measured experimentally with the bitter receptor assay (
) at constant concentration of EGCG (250 µM). (
lactoglobulin, (
Relationship between hTAS2R39 activation and binding characteris
The binding affinity (K) and maximal binding capacity (R
proteins for EGCG were determined in a previous study
Casein and gelatin F1 had similar affinities for EGCG, both about two times and ten
times higher than the ones measured with gelatin B1 and
Those affinities were found to be sufficient to have a strong effect on the reduction of
). The limited effect of
of percentages of reduction of hTAS2R39 activation by EGCG by various
proteins measured experimentally with the bitter receptor assay (●) and predicted with data from the UF
) at constant concentration of EGCG (250 µM). (
lactoglobulin, (F) food
Relationship between hTAS2R39 activation and binding characteris
The binding affinity (K) and maximal binding capacity (R
proteins for EGCG were determined in a previous study (16)
Casein and gelatin F1 had similar affinities for EGCG, both about two times and ten
times higher than the ones measured with gelatin B1 and
e a strong effect on the reduction of
). The limited effect of
of percentages of reduction of hTAS2R39 activation by EGCG by various
●) and predicted with data from the UF
) at constant concentration of EGCG (250 µM). (A) β
) food-grade
Relationship between hTAS2R39 activation and binding characteris
The binding affinity (K) and maximal binding capacity (R
(16) and are summarized in
Casein and gelatin F1 had similar affinities for EGCG, both about two times and ten
times higher than the ones measured with gelatin B1 and β
e a strong effect on the reduction of
). The limited effect of
of percentages of reduction of hTAS2R39 activation by EGCG by various
) and predicted with data from the UF
) β-casein, (
grade β
Relationship between hTAS2R39 activation and binding characteris
The binding affinity (K) and maximal binding capacity (Rmax) of the aforementioned
and are summarized in
Casein and gelatin F1 had similar affinities for EGCG, both about two times and ten
times higher than the ones measured with gelatin B1 and β-lactoglobulin, respectively.
e a strong effect on the reduction of
). The limited effect of
of percentages of reduction of hTAS2R39 activation by EGCG by various
) and predicted with data from the UF
casein, (
grade β-lactoglobulin.
Relationship between hTAS2R39 activation and binding characteris
) of the aforementioned
and are summarized in
Casein and gelatin F1 had similar affinities for EGCG, both about two times and ten
lactoglobulin, respectively.
e a strong effect on the reduction of
). The limited effect of β-
of percentages of reduction of hTAS2R39 activation by EGCG by various
) and predicted with data from the UF
casein, (B) Na
lactoglobulin.
Relationship between hTAS2R39 activation and binding characteristics of EGCG to
) of the aforementioned
and are summarized in
Casein and gelatin F1 had similar affinities for EGCG, both about two times and ten
lactoglobulin, respectively.
e a strong effect on the reduction of
-lactoglobulin on the
of percentages of reduction of hTAS2R39 activation by EGCG by various
) and predicted with data from the UF
) Na-
lactoglobulin.
tics of EGCG to
) of the aforementioned
and are summarized in
Casein and gelatin F1 had similar affinities for EGCG, both about two times and ten
lactoglobulin, respectively.
e a strong effect on the reduction of
lactoglobulin on the
of percentages of reduction of hTAS2R39 activation by EGCG by various
) and predicted with data from the UF
-caseinate, (
lactoglobulin.
tics of EGCG to
) of the aforementioned
and are summarized in
Casein and gelatin F1 had similar affinities for EGCG, both about two times and ten
lactoglobulin, respectively.
e a strong effect on the reduction of
lactoglobulin on the
of percentages of reduction of hTAS2R39 activation by EGCG by various
) and predicted with data from the UF
caseinate, (
tics of EGCG to
) of the aforementioned
and are summarized in Table
Casein and gelatin F1 had similar affinities for EGCG, both about two times and ten
lactoglobulin, respectively.
e a strong effect on the reduction of
lactoglobulin on the
of percentages of reduction of hTAS2R39 activation by EGCG by various
) and predicted with data from the UF
caseinate, (C
tics of EGCG to
) of the aforementioned
Table
Casein and gelatin F1 had similar affinities for EGCG, both about two times and ten
lactoglobulin, respectively.
e a strong effect on the reduction of
lactoglobulin on the
of percentages of reduction of hTAS2R39 activation by EGCG by various
) and predicted with data from the UF
C)
tics of EGCG to
) of the aforementioned
Table
Casein and gelatin F1 had similar affinities for EGCG, both about two times and ten
lactoglobulin, respectively.
e a strong effect on the reduction of
lactoglobulin on the
Bitter masking potential of food proteins for EGCG
129
reduction of receptor activation in the bitter receptor assay is thought to be linked to its low
affinity for EGCG. Even though gelatin B1 had an intermediate affinity for EGCG, it had a
limited effect on the receptor activation by EGCG, suggesting that a minimum affinity is
required for a significant reduction of receptor activation. Binding affinity seemed to be a
more important factor than Rmax as gelatin B1 had a higher Rmax than β-casein, but only
showed a limited effect on decreasing receptor activation.
A second ultrafiltration method (UF assay – method 2) was used to mimic the
conditions of the bitter receptor assay (i.e. constant [EGCG] and variable [protein]). The
concentrations of free EGCG measured in the UF assay – method 2 were used to predict the
percentage of reduction of receptor activation using equations 1 and 2, and compared to the
experimental data obtained. β-Casein was used to evaluate the accuracy of this approach
(Figure 2A). The data derived from the UF assay – method 2 and the bitter receptor assay
were in good agreement, with an underestimation of only 10-20% for the theoretical values
compared to the experimental values.
In contrast to β-casein, the theoretical and experimental values showed clear
discrepancies for gelatin F1 (Figure 2C). As mentioned earlier, interferences due to
aggregates could explain this observation. In the case of gelatin B1 (Figure 2D), a limited
amount of experimental data points could be matched, but similar trends between the
theoretical and experimental values were observed. The theoretical percentages of reduction
of receptor activation calculated for gelatin F1 are two times lower than those for β-casein
although their previously reported affinities for EGCG are similar (Table 2) (16). This
shows that affinity is not the only parameter for an efficient reduction of receptor
activation, although it might be a good first indicator. For example, the flexibility of β-
casein and its ability to form micelles which could entrap EGCG might be advantageous
characteristics compared to the more rigid structure of gelatins (16, 22, 23). Summarizing,
the bitter receptor assay was in good agreement with the ultrafiltration assay when applying
a protein with a good binding capacity, such as β-casein. Discrepancies, however, could be
observed when using proteins forming insoluble aggregates, such as gelatins, or having a
low binding capacity, such as β-lactoglobulin.
In the present study, β-casein was confirmed as promising carrier for EGCG in food as
its previously reported high binding affinity and capacity for EGCG could be linked to an
effective reduction of bitter receptor activation by EGCG.
5
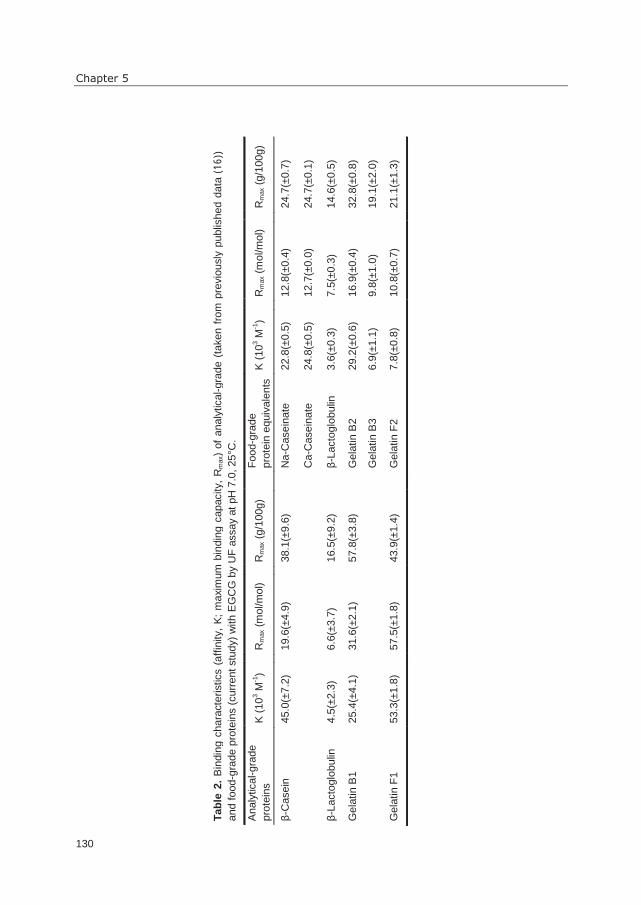
Chapter 5
130
Tab
le 2
. B
indin
g c
hara
cte
ristics (
aff
inity,
K;
maxi
mum
bin
din
g c
apacity,
Rm
ax)
of
analy
tical-gra
de (
taken f
rom
pre
vio
usly
publis
hed d
ata
(16))
and f
ood-g
rade p
rote
ins (
curr
ent stu
dy)
with E
GC
G b
y U
F a
ssay a
t pH
7.0
, 25°C
.
Analy
tical-gra
de
pro
tein
s
K (
10
3 M
-1)
R
max (
mol/m
ol)
R
max (
g/1
00g)
F
ood-g
rade
pro
tein
equiv
ale
nts
K
(10
3 M
-1)
R
max (
mol/m
ol)
R
max (
g/1
00g)
β-C
asein
45.0
(±7.2
)
19.6
(±4.9
)
38.1
(±9.6
)
Na-C
asein
ate
22.8
(±0.5
)
12.8
(±0.4
)
24.7
(±0.7
)
C
a-C
asein
ate
24.8
(±0.5
)
12.7
(±0.0
)
24.7
(±0.1
)
β-L
acto
glo
bulin
4.5
(±2.3
)
6.6
(±3.7
)
16.5
(±9.2
)
β-L
acto
glo
bulin
3.6
(±0.3
)
7.5
(±0.3
)
14.6
(±0.5
)
Gela
tin B
1
25.4
(±4.1
)
31.6
(±2.1
)
57.8
(±3.8
)
Gela
tin B
2
29.2
(±0.6
)
16.9
(±0.4
)
32.8
(±0.8
)
G
ela
tin B
3
6.9
(±1.1
)
9.8
(±1.0
)
19.1
(±2.0
)
Gela
tin F
1
53.3
(±1.8
)
57.5
(±1.8
)
43.9
(±1.4
)
Gela
tin F
2
7.8
(±0.8
)
10.8
(±0.7
)
21.1
(±1.3
)
Bitter masking potential of food proteins for EGCG
131
Efficiency of food-grade protein ingredients to complex EGCG
Highly purified proteins are not commonly used in the food industry and are, in most cases,
not commercially available as food ingredients. Hence, the analytical-grade proteins were
replaced by common food ingredients containing these proteins (e.g. β-casein replaced by
caseinates). These food-grade proteins were evaluated for their binding potential for EGCG
by the UF assay and their binding parameters were compared to the ones of their equivalent
analytical-grade proteins as summarized in Table 2. A higher concentration of proteins as
used in the current assay (i.e. 100 µM) did not seem to influence the binding affinity as
found for β-casein ((45.0 ±7.2) ×103 M-1 at 25 µM versus (43.3 ±2.2) ×103 M-1 at 100
µM). Ca-Caseinate and Na-caseinate were considered as an acceptable replacement for β-
casein with good potential for further application. The lower values obtained for the
binding parameters of caseinates compared to β-casein might be related to their more
heterogeneous protein composition, with a ratio αS1:αS2:β:κ of about 11:3:10:4, on a molar
basis (18). In fact, it has been shown that α-casein had a two times lower binding affinity
for EGCG compared to β-casein (24).
Na-Caseinate was tested for its capacity to reduce hTAS2R39 activation by EGCG
(Figure 1B). Although only a narrower range of protein concentration could be measured
due to non-specific signals, Na-caseinate showed a similar trend in receptor activation
decrease compared to β-casein at protein concentrations between 1.5 and 6 µM. Theoretical
percentages of reduction of receptor activation were calculated for Na-caseinate using the
UF assay – method 2 and were similar to those obtained for β-casein (Figure 2B), with a
maximum reduction of 70.1 (±1.2)% at a protein concentration of 100 µM (85.3 (±0.6)%
for β-casein). Theoretical and experimental values at Na-caseinate concentrations of 6 and
12.5 µM were in good agreement. Ca-Caseinate showed the same theoretical potential of
reduction of receptor activation compared to Na-caseinate using the UF assay – method 2,
with a maximum reduction of 72.0 (±0.9)% (data not shown). Hence, Na-caseinate and Ca-
caseinate were confirmed as acceptable food-grade alternatives to analytical-grade β-casein
for reducing hTAS2R39 activation by EGCG.
Gelatin B2 showed similar binding potential compared to the model protein gelatin B1,
whereas gelatins B3 and F2 displayed lower binding affinities compared to their analytical
equivalents. This difference compared to the model proteins could be due to variations in
the characteristics of the gelatin samples (e.g. amino acid composition, average molecular
mass). Food-grade and analytical-grade β-lactoglobulins had similar low binding affinities
(Table 2). As shown in Figure 2 and Table 1, the weak binding properties of both β-
lactoglobulins to EGCG also did not result in a significant effect in reduction of hTAS2R39
activation. This was also shown by the UF assay – method 2 with a maximum value in
reduction of receptor activation below 15% calculated for both proteins (Figure 2E and
2F).
5
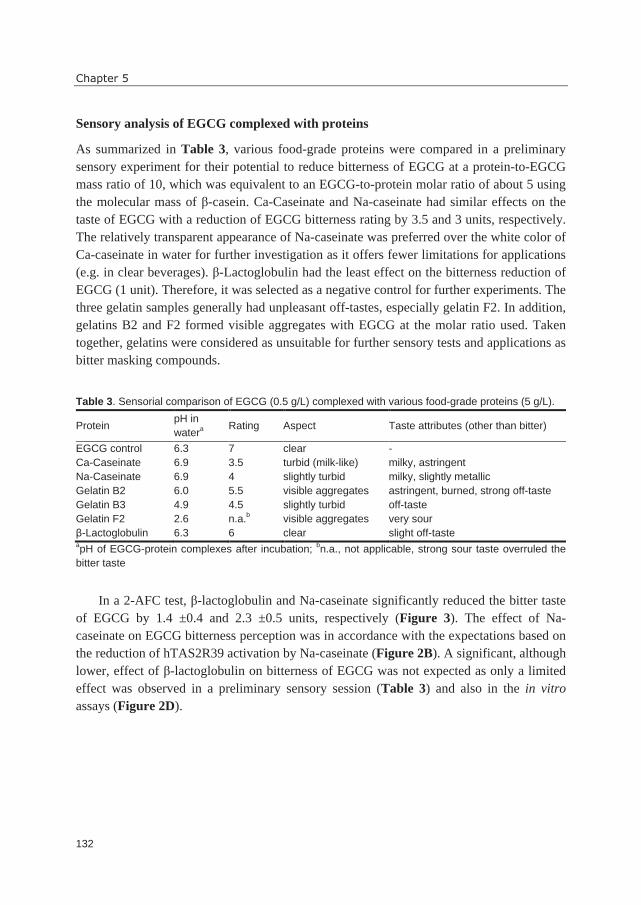
Chapter 5
132
Sensory analysis of EGCG complexed with proteins
As summarized in Table 3, various food-grade proteins were compared in a preliminary
sensory experiment for their potential to reduce bitterness of EGCG at a protein-to-EGCG
mass ratio of 10, which was equivalent to an EGCG-to-protein molar ratio of about 5 using
the molecular mass of β-casein. Ca-Caseinate and Na-caseinate had similar effects on the
taste of EGCG with a reduction of EGCG bitterness rating by 3.5 and 3 units, respectively.
The relatively transparent appearance of Na-caseinate was preferred over the white color of
Ca-caseinate in water for further investigation as it offers fewer limitations for applications
(e.g. in clear beverages). β-Lactoglobulin had the least effect on the bitterness reduction of
EGCG (1 unit). Therefore, it was selected as a negative control for further experiments. The
three gelatin samples generally had unpleasant off-tastes, especially gelatin F2. In addition,
gelatins B2 and F2 formed visible aggregates with EGCG at the molar ratio used. Taken
together, gelatins were considered as unsuitable for further sensory tests and applications as
bitter masking compounds.
Table 3. Sensorial comparison of EGCG (0.5 g/L) complexed with various food-grade proteins (5 g/L).
Protein pH in
watera
Rating Aspect Taste attributes (other than bitter)
EGCG control 6.3 7 clear -
Ca-Caseinate 6.9 3.5 turbid (milk-like) milky, astringent
Na-Caseinate 6.9 4 slightly turbid milky, slightly metallic
Gelatin B2 6.0 5.5 visible aggregates astringent, burned, strong off-taste
Gelatin B3 4.9 4.5 slightly turbid off-taste
Gelatin F2 2.6 n.a.b visible aggregates very sour
β-Lactoglobulin 6.3 6 clear slight off-taste apH of EGCG-protein complexes after incubation;
bn.a., not applicable, strong sour taste overruled the
bitter taste
In a 2-AFC test, β-lactoglobulin and Na-caseinate significantly reduced the bitter taste
of EGCG by 1.4 ±0.4 and 2.3 ±0.5 units, respectively (Figure 3). The effect of Na-
caseinate on EGCG bitterness perception was in accordance with the expectations based on
the reduction of hTAS2R39 activation by Na-caseinate (Figure 2B). A significant, although
lower, effect of β-lactoglobulin on bitterness of EGCG was not expected as only a limited
effect was observed in a preliminary sensory session (Table 3) and also in the in vitro
assays (Figure 2D).
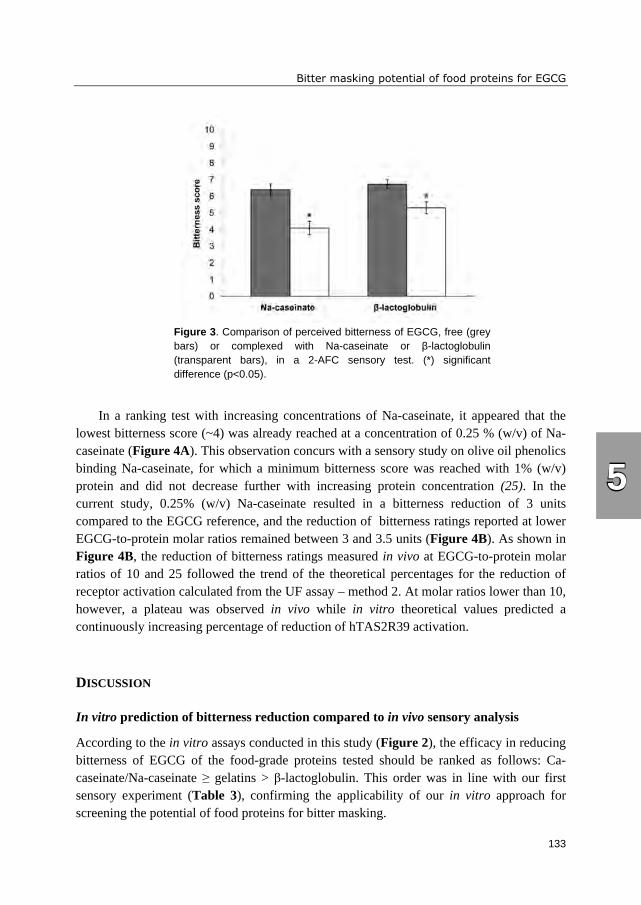
Bitter masking potential of food proteins for EGCG
133
Figure 3. Comparison of perceived bitterness of EGCG, free (grey
bars) or complexed with Na-caseinate or β-lactoglobulin
(transparent bars), in a 2-AFC sensory test. (*) significant
difference (p<0.05).
In a ranking test with increasing concentrations of Na-caseinate, it appeared that the
lowest bitterness score (~4) was already reached at a concentration of 0.25 % (w/v) of Na-
caseinate (Figure 4A). This observation concurs with a sensory study on olive oil phenolics
binding Na-caseinate, for which a minimum bitterness score was reached with 1% (w/v)
protein and did not decrease further with increasing protein concentration (25). In the
current study, 0.25% (w/v) Na-caseinate resulted in a bitterness reduction of 3 units
compared to the EGCG reference, and the reduction of bitterness ratings reported at lower
EGCG-to-protein molar ratios remained between 3 and 3.5 units (Figure 4B). As shown in
Figure 4B, the reduction of bitterness ratings measured in vivo at EGCG-to-protein molar
ratios of 10 and 25 followed the trend of the theoretical percentages for the reduction of
receptor activation calculated from the UF assay – method 2. At molar ratios lower than 10,
however, a plateau was observed in vivo while in vitro theoretical values predicted a
continuously increasing percentage of reduction of hTAS2R39 activation.
DISCUSSION
In vitro prediction of bitterness reduction compared to in vivo sensory analysis
According to the in vitro assays conducted in this study (Figure 2), the efficacy in reducing
bitterness of EGCG of the food-grade proteins tested should be ranked as follows: Ca-
caseinate/Na-caseinate ≥ gelatins > β-lactoglobulin. This order was in line with our first
sensory experiment (Table 3), confirming the applicability of our in vitro approach for
screening the potential of food proteins for bitter masking.
5
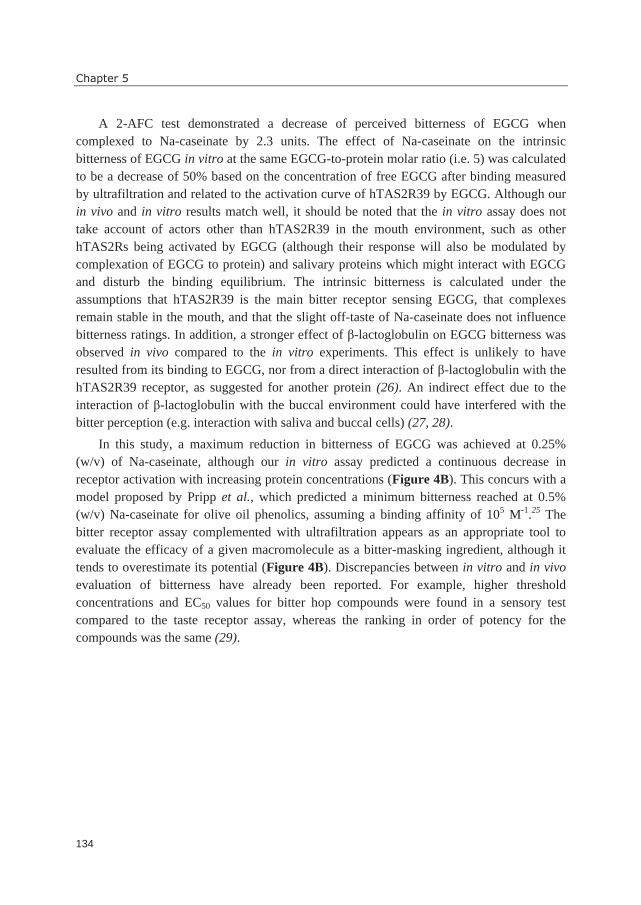
Chapter 5
134
A 2-AFC test demonstrated a decrease of perceived bitterness of EGCG when
complexed to Na-caseinate by 2.3 units. The effect of Na-caseinate on the intrinsic
bitterness of EGCG in vitro at the same EGCG-to-protein molar ratio (i.e. 5) was calculated
to be a decrease of 50% based on the concentration of free EGCG after binding measured
by ultrafiltration and related to the activation curve of hTAS2R39 by EGCG. Although our
in vivo and in vitro results match well, it should be noted that the in vitro assay does not
take account of actors other than hTAS2R39 in the mouth environment, such as other
hTAS2Rs being activated by EGCG (although their response will also be modulated by
complexation of EGCG to protein) and salivary proteins which might interact with EGCG
and disturb the binding equilibrium. The intrinsic bitterness is calculated under the
assumptions that hTAS2R39 is the main bitter receptor sensing EGCG, that complexes
remain stable in the mouth, and that the slight off-taste of Na-caseinate does not influence
bitterness ratings. In addition, a stronger effect of β-lactoglobulin on EGCG bitterness was
observed in vivo compared to the in vitro experiments. This effect is unlikely to have
resulted from its binding to EGCG, nor from a direct interaction of β-lactoglobulin with the
hTAS2R39 receptor, as suggested for another protein (26). An indirect effect due to the
interaction of β-lactoglobulin with the buccal environment could have interfered with the
bitter perception (e.g. interaction with saliva and buccal cells) (27, 28).
In this study, a maximum reduction in bitterness of EGCG was achieved at 0.25%
(w/v) of Na-caseinate, although our in vitro assay predicted a continuous decrease in
receptor activation with increasing protein concentrations (Figure 4B). This concurs with a
model proposed by Pripp et al., which predicted a minimum bitterness reached at 0.5%
(w/v) Na-caseinate for olive oil phenolics, assuming a binding affinity of 105 M-1.25 The
bitter receptor assay complemented with ultrafiltration appears as an appropriate tool to
evaluate the efficacy of a given macromolecule as a bitter-masking ingredient, although it
tends to overestimate its potential (Figure 4B). Discrepancies between in vitro and in vivo
evaluation of bitterness have already been reported. For example, higher threshold
concentrations and EC50 values for bitter hop compounds were found in a sensory test
compared to the taste receptor assay, whereas the ranking in order of potency for the
compounds was the same (29).
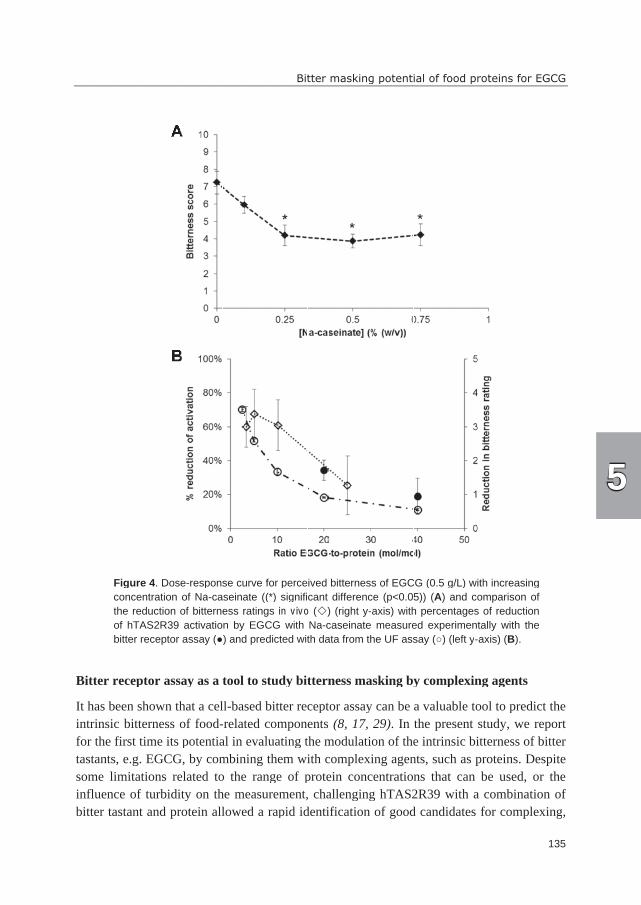
Bitter receptor assay as a tool to study bitterness masking by complexing agents
It has been
intrinsic bitterness of food
for the first time its potential in
tastants, e.g. EGCG, by combining them with complexing agents, such as proteins.
some limitatio
influence of turbidity on the measurement, challenging hTAS2R39 with a combination of
bitter tastant and protein allowed a rapid identification of good candidates
Figure 4
concentration of Na
the reduction of bitterness ratings
of hTAS2R39 activation by EGCG with Na
bitter receptor assay (
Bitter receptor assay as a tool to study bitterness masking by complexing agents
It has been shown that a cell
intrinsic bitterness of food
for the first time its potential in
tastants, e.g. EGCG, by combining them with complexing agents, such as proteins.
some limitatio
influence of turbidity on the measurement, challenging hTAS2R39 with a combination of
bitter tastant and protein allowed a rapid identification of good candidates
Figure 4.
concentration of Na
the reduction of bitterness ratings
of hTAS2R39 activation by EGCG with Na
bitter receptor assay (
Bitter receptor assay as a tool to study bitterness masking by complexing agents
shown that a cell
intrinsic bitterness of food
for the first time its potential in
tastants, e.g. EGCG, by combining them with complexing agents, such as proteins.
some limitations related to the range of protein concentrations that can be used, or the
influence of turbidity on the measurement, challenging hTAS2R39 with a combination of
bitter tastant and protein allowed a rapid identification of good candidates
. Dose
concentration of Na
the reduction of bitterness ratings
of hTAS2R39 activation by EGCG with Na
bitter receptor assay (
Bitter receptor assay as a tool to study bitterness masking by complexing agents
shown that a cell
intrinsic bitterness of food
for the first time its potential in
tastants, e.g. EGCG, by combining them with complexing agents, such as proteins.
ns related to the range of protein concentrations that can be used, or the
influence of turbidity on the measurement, challenging hTAS2R39 with a combination of
bitter tastant and protein allowed a rapid identification of good candidates
Dose-response curve for perceived bitterness of EGCG (0.5 g/L) with increasing
concentration of Na
the reduction of bitterness ratings
of hTAS2R39 activation by EGCG with Na
bitter receptor assay (
Bitter receptor assay as a tool to study bitterness masking by complexing agents
shown that a cell
intrinsic bitterness of food
for the first time its potential in
tastants, e.g. EGCG, by combining them with complexing agents, such as proteins.
ns related to the range of protein concentrations that can be used, or the
influence of turbidity on the measurement, challenging hTAS2R39 with a combination of
bitter tastant and protein allowed a rapid identification of good candidates
response curve for perceived bitterness of EGCG (0.5 g/L) with increasing
concentration of Na-caseinate ((*) significant difference (p<0.05)) (
the reduction of bitterness ratings
of hTAS2R39 activation by EGCG with Na
bitter receptor assay (●) and predicted with data from the UF assay
Bitter receptor assay as a tool to study bitterness masking by complexing agents
shown that a cell
intrinsic bitterness of food-
for the first time its potential in
tastants, e.g. EGCG, by combining them with complexing agents, such as proteins.
ns related to the range of protein concentrations that can be used, or the
influence of turbidity on the measurement, challenging hTAS2R39 with a combination of
bitter tastant and protein allowed a rapid identification of good candidates
response curve for perceived bitterness of EGCG (0.5 g/L) with increasing
caseinate ((*) significant difference (p<0.05)) (
the reduction of bitterness ratings
of hTAS2R39 activation by EGCG with Na
●) and predicted with data from the UF assay
Bitter receptor assay as a tool to study bitterness masking by complexing agents
shown that a cell-based bitter receptor assay can be a valuable tool to predict the
-related comp
for the first time its potential in
tastants, e.g. EGCG, by combining them with complexing agents, such as proteins.
ns related to the range of protein concentrations that can be used, or the
influence of turbidity on the measurement, challenging hTAS2R39 with a combination of
bitter tastant and protein allowed a rapid identification of good candidates
response curve for perceived bitterness of EGCG (0.5 g/L) with increasing
caseinate ((*) significant difference (p<0.05)) (
the reduction of bitterness ratings
of hTAS2R39 activation by EGCG with Na
) and predicted with data from the UF assay
Bitter receptor assay as a tool to study bitterness masking by complexing agents
based bitter receptor assay can be a valuable tool to predict the
related comp
evaluating the modulation of the intrinsic bitterness of bitter
tastants, e.g. EGCG, by combining them with complexing agents, such as proteins.
ns related to the range of protein concentrations that can be used, or the
influence of turbidity on the measurement, challenging hTAS2R39 with a combination of
bitter tastant and protein allowed a rapid identification of good candidates
response curve for perceived bitterness of EGCG (0.5 g/L) with increasing
caseinate ((*) significant difference (p<0.05)) (
the reduction of bitterness ratings in vivo
of hTAS2R39 activation by EGCG with Na
) and predicted with data from the UF assay
Bitter receptor assay as a tool to study bitterness masking by complexing agents
based bitter receptor assay can be a valuable tool to predict the
related comp
evaluating the modulation of the intrinsic bitterness of bitter
tastants, e.g. EGCG, by combining them with complexing agents, such as proteins.
ns related to the range of protein concentrations that can be used, or the
influence of turbidity on the measurement, challenging hTAS2R39 with a combination of
bitter tastant and protein allowed a rapid identification of good candidates
Bitter masking potential of food proteins for EGCG
response curve for perceived bitterness of EGCG (0.5 g/L) with increasing
caseinate ((*) significant difference (p<0.05)) (
in vivo
of hTAS2R39 activation by EGCG with Na
) and predicted with data from the UF assay
Bitter receptor assay as a tool to study bitterness masking by complexing agents
based bitter receptor assay can be a valuable tool to predict the
related components
evaluating the modulation of the intrinsic bitterness of bitter
tastants, e.g. EGCG, by combining them with complexing agents, such as proteins.
ns related to the range of protein concentrations that can be used, or the
influence of turbidity on the measurement, challenging hTAS2R39 with a combination of
bitter tastant and protein allowed a rapid identification of good candidates
Bitter masking potential of food proteins for EGCG
response curve for perceived bitterness of EGCG (0.5 g/L) with increasing
caseinate ((*) significant difference (p<0.05)) (
in vivo (�) (right y
of hTAS2R39 activation by EGCG with Na-caseinate measured experimentally
) and predicted with data from the UF assay
Bitter receptor assay as a tool to study bitterness masking by complexing agents
based bitter receptor assay can be a valuable tool to predict the
onents
evaluating the modulation of the intrinsic bitterness of bitter
tastants, e.g. EGCG, by combining them with complexing agents, such as proteins.
ns related to the range of protein concentrations that can be used, or the
influence of turbidity on the measurement, challenging hTAS2R39 with a combination of
bitter tastant and protein allowed a rapid identification of good candidates
Bitter masking potential of food proteins for EGCG
response curve for perceived bitterness of EGCG (0.5 g/L) with increasing
caseinate ((*) significant difference (p<0.05)) (
) (right y
caseinate measured experimentally
) and predicted with data from the UF assay
Bitter receptor assay as a tool to study bitterness masking by complexing agents
based bitter receptor assay can be a valuable tool to predict the
(8, 17, 29)
evaluating the modulation of the intrinsic bitterness of bitter
tastants, e.g. EGCG, by combining them with complexing agents, such as proteins.
ns related to the range of protein concentrations that can be used, or the
influence of turbidity on the measurement, challenging hTAS2R39 with a combination of
bitter tastant and protein allowed a rapid identification of good candidates
Bitter masking potential of food proteins for EGCG
response curve for perceived bitterness of EGCG (0.5 g/L) with increasing
caseinate ((*) significant difference (p<0.05)) (
) (right y-
caseinate measured experimentally
) and predicted with data from the UF assay
Bitter receptor assay as a tool to study bitterness masking by complexing agents
based bitter receptor assay can be a valuable tool to predict the
(8, 17, 29)
evaluating the modulation of the intrinsic bitterness of bitter
tastants, e.g. EGCG, by combining them with complexing agents, such as proteins.
ns related to the range of protein concentrations that can be used, or the
influence of turbidity on the measurement, challenging hTAS2R39 with a combination of
bitter tastant and protein allowed a rapid identification of good candidates
Bitter masking potential of food proteins for EGCG
response curve for perceived bitterness of EGCG (0.5 g/L) with increasing
caseinate ((*) significant difference (p<0.05)) (
-axis) with
caseinate measured experimentally
) and predicted with data from the UF assay
Bitter receptor assay as a tool to study bitterness masking by complexing agents
based bitter receptor assay can be a valuable tool to predict the
(8, 17, 29).
evaluating the modulation of the intrinsic bitterness of bitter
tastants, e.g. EGCG, by combining them with complexing agents, such as proteins.
ns related to the range of protein concentrations that can be used, or the
influence of turbidity on the measurement, challenging hTAS2R39 with a combination of
bitter tastant and protein allowed a rapid identification of good candidates
Bitter masking potential of food proteins for EGCG
response curve for perceived bitterness of EGCG (0.5 g/L) with increasing
caseinate ((*) significant difference (p<0.05)) (
axis) with
caseinate measured experimentally
) and predicted with data from the UF assay
Bitter receptor assay as a tool to study bitterness masking by complexing agents
based bitter receptor assay can be a valuable tool to predict the
. In the present study, we report
evaluating the modulation of the intrinsic bitterness of bitter
tastants, e.g. EGCG, by combining them with complexing agents, such as proteins.
ns related to the range of protein concentrations that can be used, or the
influence of turbidity on the measurement, challenging hTAS2R39 with a combination of
bitter tastant and protein allowed a rapid identification of good candidates
Bitter masking potential of food proteins for EGCG
response curve for perceived bitterness of EGCG (0.5 g/L) with increasing
caseinate ((*) significant difference (p<0.05)) (A
axis) with percentages of reduction
caseinate measured experimentally
) and predicted with data from the UF assay (
Bitter receptor assay as a tool to study bitterness masking by complexing agents
based bitter receptor assay can be a valuable tool to predict the
In the present study, we report
evaluating the modulation of the intrinsic bitterness of bitter
tastants, e.g. EGCG, by combining them with complexing agents, such as proteins.
ns related to the range of protein concentrations that can be used, or the
influence of turbidity on the measurement, challenging hTAS2R39 with a combination of
bitter tastant and protein allowed a rapid identification of good candidates
Bitter masking potential of food proteins for EGCG
response curve for perceived bitterness of EGCG (0.5 g/L) with increasing
A) and comparison of
percentages of reduction
caseinate measured experimentally
(○) (left y
Bitter receptor assay as a tool to study bitterness masking by complexing agents
based bitter receptor assay can be a valuable tool to predict the
In the present study, we report
evaluating the modulation of the intrinsic bitterness of bitter
tastants, e.g. EGCG, by combining them with complexing agents, such as proteins.
ns related to the range of protein concentrations that can be used, or the
influence of turbidity on the measurement, challenging hTAS2R39 with a combination of
bitter tastant and protein allowed a rapid identification of good candidates
Bitter masking potential of food proteins for EGCG
response curve for perceived bitterness of EGCG (0.5 g/L) with increasing
) and comparison of
percentages of reduction
caseinate measured experimentally
○) (left y-
Bitter receptor assay as a tool to study bitterness masking by complexing agents
based bitter receptor assay can be a valuable tool to predict the
In the present study, we report
evaluating the modulation of the intrinsic bitterness of bitter
tastants, e.g. EGCG, by combining them with complexing agents, such as proteins.
ns related to the range of protein concentrations that can be used, or the
influence of turbidity on the measurement, challenging hTAS2R39 with a combination of
bitter tastant and protein allowed a rapid identification of good candidates
Bitter masking potential of food proteins for EGCG
response curve for perceived bitterness of EGCG (0.5 g/L) with increasing
) and comparison of
percentages of reduction
caseinate measured experimentally
-axis) (
Bitter receptor assay as a tool to study bitterness masking by complexing agents
based bitter receptor assay can be a valuable tool to predict the
In the present study, we report
evaluating the modulation of the intrinsic bitterness of bitter
tastants, e.g. EGCG, by combining them with complexing agents, such as proteins.
ns related to the range of protein concentrations that can be used, or the
influence of turbidity on the measurement, challenging hTAS2R39 with a combination of
for complexing
Bitter masking potential of food proteins for EGCG
response curve for perceived bitterness of EGCG (0.5 g/L) with increasing
) and comparison of
percentages of reduction
caseinate measured experimentally with the
axis) (B).
Bitter receptor assay as a tool to study bitterness masking by complexing agents
based bitter receptor assay can be a valuable tool to predict the
In the present study, we report
evaluating the modulation of the intrinsic bitterness of bitter
tastants, e.g. EGCG, by combining them with complexing agents, such as proteins.
ns related to the range of protein concentrations that can be used, or the
influence of turbidity on the measurement, challenging hTAS2R39 with a combination of
for complexing
Bitter masking potential of food proteins for EGCG
response curve for perceived bitterness of EGCG (0.5 g/L) with increasing
) and comparison of
percentages of reduction
with the
).
Bitter receptor assay as a tool to study bitterness masking by complexing agents
based bitter receptor assay can be a valuable tool to predict the
In the present study, we report
evaluating the modulation of the intrinsic bitterness of bitter
tastants, e.g. EGCG, by combining them with complexing agents, such as proteins. Despite
ns related to the range of protein concentrations that can be used, or the
influence of turbidity on the measurement, challenging hTAS2R39 with a combination of
for complexing
Bitter masking potential of food proteins for EGCG
135
response curve for perceived bitterness of EGCG (0.5 g/L) with increasing
) and comparison of
percentages of reduction
with the
based bitter receptor assay can be a valuable tool to predict the
In the present study, we report
evaluating the modulation of the intrinsic bitterness of bitter
Despite
ns related to the range of protein concentrations that can be used, or the
influence of turbidity on the measurement, challenging hTAS2R39 with a combination of
for complexing
Bitter masking potential of food proteins for EGCG
135
based bitter receptor assay can be a valuable tool to predict the
In the present study, we report
evaluating the modulation of the intrinsic bitterness of bitter
Despite
ns related to the range of protein concentrations that can be used, or the
influence of turbidity on the measurement, challenging hTAS2R39 with a combination of
for complexing,
5
Chapter 5
136
such as β-casein. Proteins were ranked for their efficacy for reducing receptor activation as
follows, β-casein > gelatin F1 ≈ Na-caseinate > gelatin B1 > β-lactoglobulin. This ranking
was in good agreement with findings from a complementary ultrafiltration assay relating
the concentration of free EGCG with increasing protein concentration to hTAS2R39
activation.
Provided that the hTAS2R activated by the bitter compound of interest is known, the
bitter receptor assay seems to be promising for the discovery of bitter-masking agents. It
has been applied in several instances for high-throughput screening for so-called bitter
blockers, i.e. compounds that act antagonistically on the bitter receptor of interest (30, 31).
These blockers are thought to be rather specific in reducing bitterness, although their
suggested promiscuity (i.e. the bitter blocker inhibits several hTAS2Rs) (31), or their
potential agonistic behavior on other bitter receptors, might compromise this idea (32).
Besides, some bitter compounds have been described to activate more than one bitter
receptor, which might call for more than one blocker for a particular bitter tastant (6, 17,
29). Therefore, it might be advantageous to use a more generic approach for masking
bitterness, e.g. by applying complexing agents, such as food proteins, which do not act
directly at the receptor. We have now shown that the cell-based bitter receptor assay can be
used as a tool to study such complexing agents, given that the protein is able to bind a
significant amount of the bitter tastant.
ACKNOWLDGEMENTS
We would like to thank the panelists who contributed to this study, and Teun De Joode and
Max Batenburg (Unilever R&D, Vlaardingen, The Netherlands) for their assistance in
setting up the sensory experiments. This work was financially supported by the Food and
Nutrition Delta of the Ministry of Economic Affairs, The Netherlands (FND 08018 and
FND 08019).
REFERENCES
1. Cabrera, C.; Artacho, R.; Giménez, R. Beneficial effects of green tea - A review. Journal of the
American College of Nutrition 2006, 25 (2), 79-99.
2. Narukawa, M.; Kimata, H.; Noga, C.; Watanabe, T. Taste characterisation of green tea catechins.
International Journal of Food Science and Technology 2010, 45 (8), 1579-1585.
3. Rossetti, D.; Bongaerts, J. H. H.; Wantling, E.; Stokes, J. R.; Williamson, A. M. Astringency of tea
catechins: More than an oral lubrication tactile percept. Food Hydrocolloids 2009, 23 (7),
1984-1992.
4. Brossaud, F.; Cheynier, V.; Noble, A. C. Bitterness and astringency of grape and wine polyphenols.
Australian Journal of Grape and Wine Research 2001, 7 (1), 33-39.
5. Adler, E.; Hoon, M. A.; Mueller, K. L.; Chandrashekar, J.; Ryba, N. J. P.; Zuker, C. S. A novel
family of mammalian taste receptors. Cell 2000, 100 (6), 693-702.
Bitter masking potential of food proteins for EGCG
137
6. Meyerhof, W.; Batram, C.; Kuhn, C.; Brockhoff, A.; Chudoba, E.; Bufe, B.; Appendino, G.;
Behrens, M. The molecular receptive ranges of human TAS2R bitter taste receptors. Chemical
Senses 2010, 35 (2), 157-170.
7. Thalmann, S.; Behrens, M.; Meyerhof, W. Major haplotypes of the human bitter taste receptor
TAS2R41 encode functional receptors for chloramphenicol. Biochemical and Biophysical
Research Communications 2013, 435 (2), 267-273.
8. Narukawa, M.; Noga, C.; Ueno, Y.; Sato, T.; Misaka, T.; Watanabe, T. Evaluation of the bitterness
of green tea catechins by a cell-based assay with the human bitter taste receptor hTAS2R39.
Biochemical and Biophysical Research Communications 2011, 405 (4), 620-625.
9. Wolfram, S. Effects of green tea and EGCG on cardiovascular and metabolic health. Journal of the
American College of Nutrition 2007, 26 (4), 373S-388S.
10. Drewnowski, A.; Gomez-Carneros, C. Bitter taste, phytonutrients, and the consumer: A review.
American Journal of Clinical Nutrition 2000, 72 (6), 1424-1435.
11. Szejtli, J.; Szente, L. Elimination of bitter, disgusting tastes of drugs and foods by cyclodextrins.
European Journal of Pharmaceutics and Biopharmaceutics 2005, 61 (3), 115-125.
12. Shpigelman, A.; Cohen, Y.; Livney, Y. D. Thermally-induced β-lactoglobulin-EGCG
nanovehicles: Loading, stability, sensory and digestive-release study. Food Hydrocolloids
2012, 29 (1), 57-67.
13. Sun-Waterhouse, D.; Wadhwa, S. S. Industry-relevant approaches for minimising the bitterness of
bioactive compounds in functional foods: A review. Food and Bioprocess Technology 2013, 6
(3), 607-627.
14. Van Het Hof, K. H.; Kivits, G. A. A.; Weststrate, J. A.; Tijburg, L. B. M. Bioavailability of
catechins from tea: The effect of milk. European Journal of Clinical Nutrition 1998, 52 (5),
356-359.
15. Livney, Y. D. Milk proteins as vehicles for bioactives. Current Opinion in Colloid and Interface
Science 2010, 15 (1-2), 73-83.
16. Bohin, M. C.; Vincken, J. P.; Van Der Hijden, H. T. W. M.; Gruppen, H. Efficacy of food
proteins as carriers for flavonoids. Journal of Agricultural and Food Chemistry 2012, 60 (16),
4136-4143.
17. Roland, W. S. U.; Vincken, J. P.; Gouka, R. J.; van Buren, L.; Gruppen, H.; Smit, G. Soy
isoflavones and other isoflavonoids activate the human bitter taste receptors hTAS2R14 and
hTAS2R39. Journal of Agricultural and Food Chemistry 2011, 59 (21), 11764-11771.
18. Walstra, P.; Wouters, J. T. M.; Geurts, T. J. Milk components. In Dairy Science Technology, 2
ed.; CRC Press, Boca Raton, FL, USA, 2006; pp 17-108.
19. Chandrashekar, J.; Mueller, K. L.; Hoon, M. A.; Adler, E.; Feng, L.; Guo, W.; Zuker, C. S.; Ryba,
N. J. P. T2Rs function as bitter taste receptors. Cell 2000, 100 (6), 703-711.
20. Roessler, E. B.; Pangborn, R. M.; Sidel, J. L.; Stone, H. Expanded statistical tables for estimating
significance in paired-preference, paired-difference, duo-trio and triangle tests. Journal of
Food Science 1978, 43 (3), 940-943.
21. Lawless, H.; Heymann, H. Sensory evaluation of food: Principles and practices; Springer
Science+Business Media: New York, NY, USA, 1998.
22. O'Connell, J. E.; Grinberg, V. Y.; De Kruif, C. G. Association behavior of β-casein. Journal of
Colloid and Interface Science 2003, 258 (1), 33-39.
23. Zanchi, D.; Narayanan, T.; Hagenmuller, D.; Baron, A.; Guyot, S.; Cabane, B.; Bouhallab, S.
Tannin-assisted aggregation of natively unfolded proteins. EPL 2008, 82 (5).
24. Hasni, I.; Bourassa, P.; Hamdani, S.; Samson, G.; Carpentier, R.; Tajmir-Riahi, H. A. Interaction
of milk α- and β-caseins with tea polyphenols. Food Chemistry 2011, 126 (2), 630-639.
25. Pripp, A. H.; Busch, J.; Vreeker, R. Effect of viscosity, sodium caseinate and oil on bitterness
perception of olive oil phenolics. Food Quality and Preference 2004, 15 (4), 375-382.
26. Maehashi, K.; Matano, M.; Nonaka, M.; Udaka, S.; Yamamoto, Y. Riboflavin-binding protein is a
novel bitter inhibitor. Chemical Senses 2008, 33 (1), 57-63.
5
Chapter 5
138
27. Vardhanabhuti, B.; Cox, P. W.; Norton, I. T.; Foegeding, E. A. Lubricating properties of human
whole saliva as affected by β-lactoglobulin. Food Hydrocolloids 2011, 25 (6), 1499-1506.
28. Ye, A.; Zheng, T.; Ye, J. Z.; Singh, H. Potential role of the binding of whey proteins to human
buccal cells on the perception of astringency in whey protein beverages. Physiology and
Behavior 2012, 106 (5), 645-650.
29. Intelmann, D.; Batram, C.; Kuhn, C.; Haseleu, G.; Meyerhof, W.; Hofmann, T. Three TAS2R
bitter taste receptors mediate the psychophysical responses to bitter compounds of hops
(Humulus lupulus L.) and beer. Chemosensory Perception 2009, 2 (3), 118-132.
30. Fletcher, J. N.; Kinghorn, A. D.; Slack, J. P.; McCluskey, T. S.; Odley, A.; Jia, Z. In vitro
evaluation of flavonoids from Eriodictyon californicum for antagonist activity against the
bitterness receptor hTAS2R31. Journal of Agricultural and Food Chemistry 2011, 59 (24),
13117-13121.
31. Slack, J. P.; Brockhoff, A.; Batram, C.; Menzel, S.; Sonnabend, C.; Born, S.; Galindo, M. M.;
Kohl, S.; Thalmann, S.; Ostopovici-Halip, L.; Simons, C. T.; Ungureanu, I.; Duineveld, K.;
Bologa, C. G.; Behrens, M.; Furrer, S.; Oprea, T. I.; Meyerhof, W. Modulation of bitter taste
perception by a small molecule hTAS2R antagonist. Current Biology 2010, 20 (12), 1104-
1109.
32. Brockhoff, A.; Behrens, M.; Roudnitzky, N.; Appendino, G.; Avonto, C.; Meyerhof, W. Receptor
agonism and antagonism of dietary bitter compounds. Journal of Neuroscience 2011, 31 (41),
14775-14872.

Chapter 6
General Discussion
6
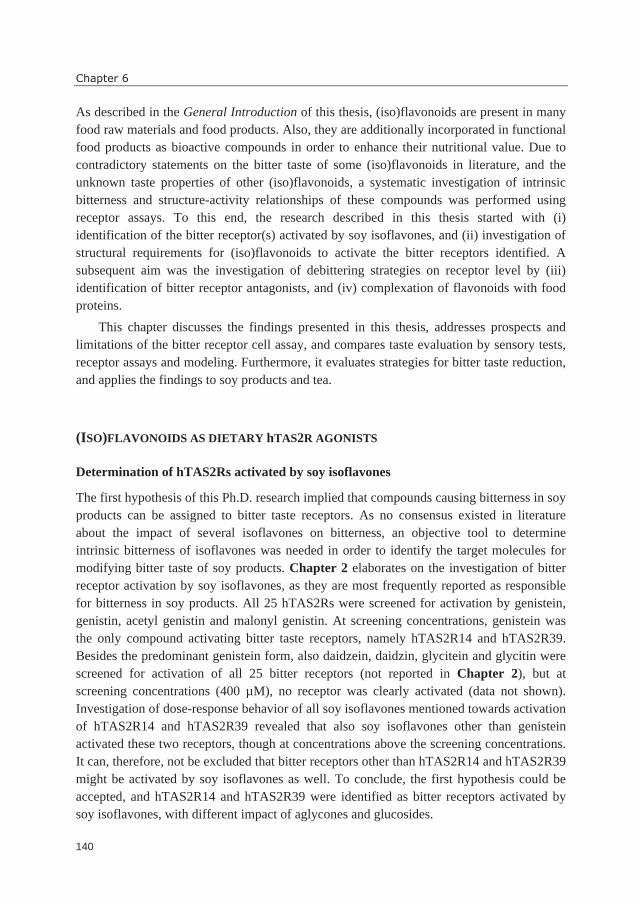
Chapter 6
140
As described in the General Introduction of this thesis, (iso)flavonoids are present in many
food raw materials and food products. Also, they are additionally incorporated in functional
food products as bioactive compounds in order to enhance their nutritional value. Due to
contradictory statements on the bitter taste of some (iso)flavonoids in literature, and the
unknown taste properties of other (iso)flavonoids, a systematic investigation of intrinsic
bitterness and structure-activity relationships of these compounds was performed using
receptor assays. To this end, the research described in this thesis started with (i)
identification of the bitter receptor(s) activated by soy isoflavones, and (ii) investigation of
structural requirements for (iso)flavonoids to activate the bitter receptors identified. A
subsequent aim was the investigation of debittering strategies on receptor level by (iii)
identification of bitter receptor antagonists, and (iv) complexation of flavonoids with food
proteins.
This chapter discusses the findings presented in this thesis, addresses prospects and
limitations of the bitter receptor cell assay, and compares taste evaluation by sensory tests,
receptor assays and modeling. Furthermore, it evaluates strategies for bitter taste reduction,
and applies the findings to soy products and tea.
(ISO)FLAVONOIDS AS DIETARY hTAS2R AGONISTS
Determination of hTAS2Rs activated by soy isoflavones
The first hypothesis of this Ph.D. research implied that compounds causing bitterness in soy
products can be assigned to bitter taste receptors. As no consensus existed in literature
about the impact of several isoflavones on bitterness, an objective tool to determine
intrinsic bitterness of isoflavones was needed in order to identify the target molecules for
modifying bitter taste of soy products. Chapter 2 elaborates on the investigation of bitter
receptor activation by soy isoflavones, as they are most frequently reported as responsible
for bitterness in soy products. All 25 hTAS2Rs were screened for activation by genistein,
genistin, acetyl genistin and malonyl genistin. At screening concentrations, genistein was
the only compound activating bitter taste receptors, namely hTAS2R14 and hTAS2R39.
Besides the predominant genistein form, also daidzein, daidzin, glycitein and glycitin were
screened for activation of all 25 bitter receptors (not reported in Chapter 2), but at
screening concentrations (400 µM), no receptor was clearly activated (data not shown).
Investigation of dose-response behavior of all soy isoflavones mentioned towards activation
of hTAS2R14 and hTAS2R39 revealed that also soy isoflavones other than genistein
activated these two receptors, though at concentrations above the screening concentrations.
It can, therefore, not be excluded that bitter receptors other than hTAS2R14 and hTAS2R39
might be activated by soy isoflavones as well. To conclude, the first hypothesis could be
accepted, and hTAS2R14 and hTAS2R39 were identified as bitter receptors activated by
soy isoflavones, with different impact of aglycones and glucosides.
General Discussion
141
Based on sensory tests, there was no consensus in literature about the impact on
bitterness of genistein, daidzein, genistin, daidzin, and malonyl isoflavones They were all
reported as bitter (1-4), but while converting isoflavone glucosides enzymatically into their
aglycones was suggested as method to reduce bitterness and astringency by one author (5),
another author reported increasing objectionable taste after β-glucosidase treatment, caused
by aglycones (6). The results presented in Chapter 2 enable us to clarify the potential
bitterness of soy isoflavones from the more objective receptor point of view. On
hTAS2R39, the order of intrinsic bitterness was determined genistein > acetyl genistein >
genistin / malonyl genistin / glycitin / glycitein / daidzein. hTAS2R14 was only activated
by aglycones (genistein >> glycitein / daidzein). It is not known yet, which of the two
receptors hTAS2R14 and hTAS2R39 is more important in the mouth, and whether the joint
activation of two bitter taste receptors can lead to an additive effect in the mouth. Even
without knowledge about this, it is expected that the aglycone genistein has a much larger
contribution to bitter taste than daidzein and genistein glucosides, and therefore, probably
represents the key bitter compound amongst soy isoflavones. This conclusion is discussed
in Chapter 2 in the context of intrinsic bitterness thresholds and isoflavone concentrations
in different soy products.
Molecular signature of dietary (iso)flavonoids activating hTAS2R14 and hTAS2R39
The second hypothesis of this thesis research implied that bitter isoflavonoids and
flavonoids hold molecular signatures involved in bitter receptor activation. This was
investigated by comparing several isoflavonoids in their behavior towards hTAS2R14 and
hTAS2R39 (Chapter 2), and was extended to a large set of flavonoids (Chapter 3). This
allowed a systematic investigation of the influences of (iso)flavonoid backbones and
substitutions. Owing to the large number of possible structural variations, molecular
signatures responsible for bitter receptor activation were not easily recognizable. Therefore,
different molecular modeling approaches were applied. In the end, molecular features of
(iso)flavonoids with distinct relative spatial orientation were identified as signatures
responsible for activation of hTAS2R14 and hTAS2R39. This allowed discrimination
between active and inactive (iso)flavonoids. The substitution pattern of (iso)flavonoid
aglycones was shown to be of higher importance for bitter receptor activation than the
backbone structure. Therewith, the second hypothesis could be accepted, and we were able
to precise the molecular signature involved.
Approximately 70 (iso)flavonoids revealed to be agonists of one or both bitter
receptors hTAS2R14 and hTAS2R39 (Chapter 3). The identification of such a large
number of agonists can be ascribed to the systematic investigation of substitution patterns
and backbone variation of the (iso)flavonoids. So far, an approach like this has scarcely
been reported in literature (7) and has never been applied with such a large set of
6
Chapter 6
142
structurally similar compounds. Mostly, structurally different bitter compounds have been
tested.
As discussed in Chapter 3, pharmacophore modeling revealed, which common
signatures underlay binding of (iso)flavonoids to hTAS2R14 and -39. Therefore, it might
be better to describe tuning breadth of bitter receptors in terms of the number of molecular
signatures recognized by the receptor, instead of in terms of the number of receptor
agonists. In this way, a collection of molecules with similar signature will only count as one
with respect to tuning breadth, and tuning breadth is less likely to be overestimated.
Taste properties of dietary (iso)flavonoid sources
Besides looking at structural variation, it is of great interest to look at the occurrence in
food products of the compounds exhibiting the highest intrinsic bitterness. The dietary
isoflavonoids identified as bitter receptor agonists occur mainly in soybeans and soy
products, amongst which fermented products, such as tempeh (8) (an Indonesian soybean
cake), are especially rich in the aglycones identified. The isoflavonoid activating
hTAS2R14 and hTAS2R39 with the lowest threshold (4 µM and 8 µM, respectively) was
genistein, the aglycone of the predominant soy isoflavone form. The dietary flavonoids
identified as bitter receptor agonists occur in various kinds of honeys, fruits, vegetables,
herbs and roots (licorice). Some compounds identified with very low bitterness thresholds
are present in many food sources (9-11) (e.g. kaempferol and luteolin), whereas others are
quite rare (9-11) (e.g. morin and pinocembrin), or have disappeared from our diet in
modern days (12) (e.g. silibinin).
Several dietary sources of (iso)flavonoids have been reported as bitter before, whereas
other dietary sources, containing (iso)flavonoids identified as intrinsically bitter in Chapter
3, are not known to be bitter (e.g. strawberries (source of morin and pelargonidin) (9-11),
licorice root (source of isoliquitirigenin) (13), and oregano (source of apigenin, lutelin,
pinocembrin, and naringenin). This is probably caused by the low concentrations of
aglycones, or by naturally occurring masking compounds, such as sweet compounds (e.g.
high sugar content in fruits and occurrence of intensely sweet triterpenoids in licorice root
(14), and the intense aroma of herbs. Products containing exceptionally high amounts of
aglycones are typically tea and fermented soy products, which are discussed further on in
this chapter.
(Iso)flavonoid glycosides have scarcely been investigated, although they are often the
predominant (iso)flavonoid form in foods. So far, the only hTAS2R activation reported for
flavonoid glycosides is the activation of hTAS2R39 by four isoflavone glucosides (reported
in Chapter 2, published as (15)) and the activation of hTAS2R7 by malvidin-3-glucoside
(16). Therefore, a next step of interest would be the investigation of more flavonoid
glycosides for hTAS2R activation, although this is currently limited by the poor
commercial availability of these compounds.
General Discussion
143
Possible impact of hTAS2R39 on food perception
With the identification of (iso)flavonoids as bitter receptor agonists in this thesis, the
number of dietary bitter taste receptor agonists for hTAS2R14 and hTAS2R39 is elevated
enormously. The number of agonists for hTAS2R14 was doubled, which is largely
contributing to the spectrum of dietary agonists for hTAS2R14. More than two thirds of all
hTAS2R39 agonists have been newly reported in this thesis, of which the majority is of
dietary origin. Dietary agonists have been reported for 16 of the 25 bitter taste receptors.
Amongst them, a few receptors are activated by numerous representatives of the same
chemical class, e.g. sesquiterpene lactones (mainly hTAS2R46, hTAS2R10 and
hTAS2R14) (17), peptides (mainly hTAS2R1, hTAS2R4, and hTAS2R39) (18-21), hop
acids (hTAS2R1, hTAS2R14, and hTAS2R40) (22), steviosides (hTAS2R4 and
hTAS2R14) (23), and flavonoids (mainly hTAS2R14 and hTAS2R39) (this thesis,
Chapters 2 and 3 and (16)). In contrast to niche compounds, peptides and flavonoids are
ubiquitously present in many food products consumed in our daily diet. This makes
hTAS2R39 a potentially important receptor for sensing bitter compounds in foods, although
its contribution in the mouth (e.g. density in comparison to other hTAS2Rs) is still not
known. Furthermore, no functional polymorphisms for this receptor are known to result in
different sensitivities towards certain bitter compounds, as reported for e.g. hTAS2R16,
hTAS2R38, and hTAS2R43 (24-26). This could mean that everyone should be able to
perceive the bitter taste of (iso)flavonoids.
PROSPECTS AND LIMITATIONS OF THE BITTER RECEPTOR CELL ASSAY
In this thesis, it has been demonstrated that the bitter receptor assay is an appropriate tool
not only for identification of bitter receptor agonists (Chapter 2 and 3) and antagonists
(Chapter 4), as reported before, but also for identification of reduced receptor activation by
complexing agents (Chapter 5). So far, bitter receptor assays have been used with
relatively small molecules only. We have shown now that this cell assay can also be applied
in combination with macromolecules. The applicable concentrations were, however, limited
to ~1 g/L for most proteins investigated.
Some compounds reported in Chapter 2 and 3 could not be characterized due to non-
specific signals. The receptor assay in its widely used form appeared to be inappropriate to
some bitter compounds. This will be discussed below based on results for soy saponins,
another class of bitter compounds, not earlier reported in this thesis.
Screening bitter receptors for activation by soy saponins
In soybeans, not only isoflavones have been reported as bitter, but also saponins. Soybean
saponins are triterpenoid glycosides, consisting of an aglycone backbone (called sapogenin
6
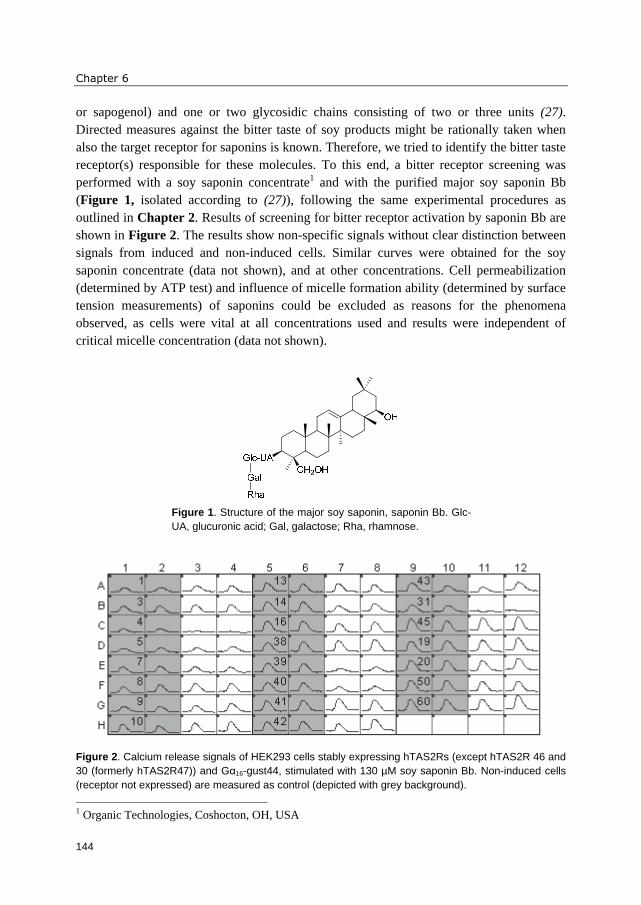
Chapter 6
144
or sapogenol) and one or two glycosidic chains consisting of two or three units (27).
Directed measures against the bitter taste of soy products might be rationally taken when
also the target receptor for saponins is known. Therefore, we tried to identify the bitter taste
receptor(s) responsible for these molecules. To this end, a bitter receptor screening was
performed with a soy saponin concentrate1 and with the purified major soy saponin Bb
(Figure 1, isolated according to (27)), following the same experimental procedures as
outlined in Chapter 2. Results of screening for bitter receptor activation by saponin Bb are
shown in Figure 2. The results show non-specific signals without clear distinction between
signals from induced and non-induced cells. Similar curves were obtained for the soy
saponin concentrate (data not shown), and at other concentrations. Cell permeabilization
(determined by ATP test) and influence of micelle formation ability (determined by surface
tension measurements) of saponins could be excluded as reasons for the phenomena
observed, as cells were vital at all concentrations used and results were independent of
critical micelle concentration (data not shown).
Figure 1. Structure of the major soy saponin, saponin Bb. Glc-
UA, glucuronic acid; Gal, galactose; Rha, rhamnose.
Figure 2. Calcium release signals of HEK293 cells stably expressing hTAS2Rs (except hTAS2R 46 and
30 (formerly hTAS2R47)) and Gα16-gust44, stimulated with 130 µM soy saponin Bb. Non-induced cells
(receptor not expressed) are measured as control (depicted with grey background).
1 Organic Technologies, Coshocton, OH, USA
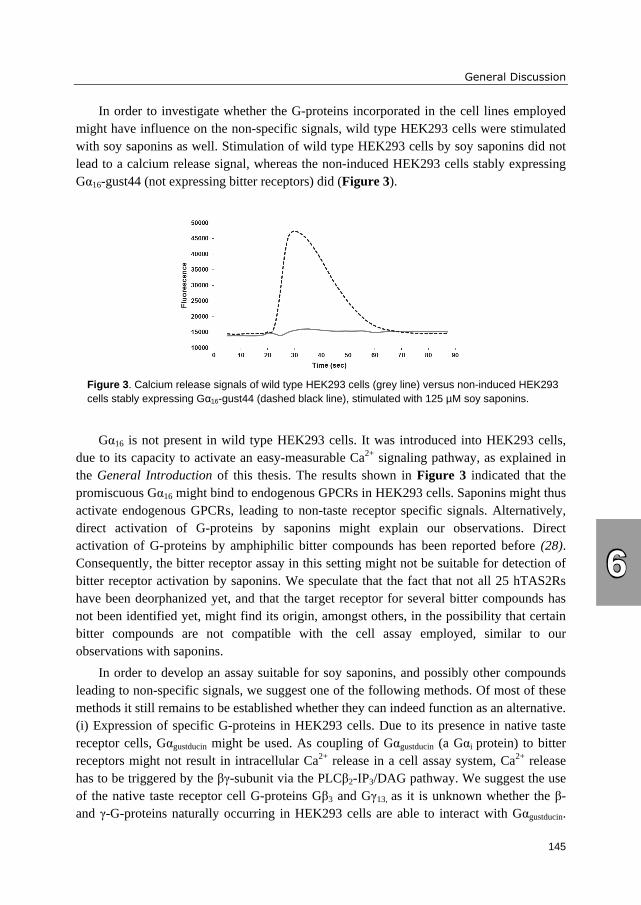
General Discussion
145
In order to investigate whether the G-proteins incorporated in the cell lines employed
might have influence on the non-specific signals, wild type HEK293 cells were stimulated
with soy saponins as well. Stimulation of wild type HEK293 cells by soy saponins did not
lead to a calcium release signal, whereas the non-induced HEK293 cells stably expressing
Gα16-gust44 (not expressing bitter receptors) did (Figure 3).
Figure 3. Calcium release signals of wild type HEK293 cells (grey line) versus non-induced HEK293
cells stably expressing Gα16-gust44 (dashed black line), stimulated with 125 µM soy saponins.
Gα16 is not present in wild type HEK293 cells. It was introduced into HEK293 cells,
due to its capacity to activate an easy-measurable Ca2+ signaling pathway, as explained in
the General Introduction of this thesis. The results shown in Figure 3 indicated that the
promiscuous Gα16 might bind to endogenous GPCRs in HEK293 cells. Saponins might thus
activate endogenous GPCRs, leading to non-taste receptor specific signals. Alternatively,
direct activation of G-proteins by saponins might explain our observations. Direct
activation of G-proteins by amphiphilic bitter compounds has been reported before (28).
Consequently, the bitter receptor assay in this setting might not be suitable for detection of
bitter receptor activation by saponins. We speculate that the fact that not all 25 hTAS2Rs
have been deorphanized yet, and that the target receptor for several bitter compounds has
not been identified yet, might find its origin, amongst others, in the possibility that certain
bitter compounds are not compatible with the cell assay employed, similar to our
observations with saponins.
In order to develop an assay suitable for soy saponins, and possibly other compounds
leading to non-specific signals, we suggest one of the following methods. Of most of these
methods it still remains to be established whether they can indeed function as an alternative.
(i) Expression of specific G-proteins in HEK293 cells. Due to its presence in native taste
receptor cells, Gαgustducin might be used. As coupling of Gαgustducin (a Gαi protein) to bitter
receptors might not result in intracellular Ca2+ release in a cell assay system, Ca2+ release
has to be triggered by the βγ-subunit via the PLCβ2-IP3/DAG pathway. We suggest the use
of the native taste receptor cell G-proteins Gβ3 and Gγ13, as it is unknown whether the β-
and γ-G-proteins naturally occurring in HEK293 cells are able to interact with Gαgustducin.
6
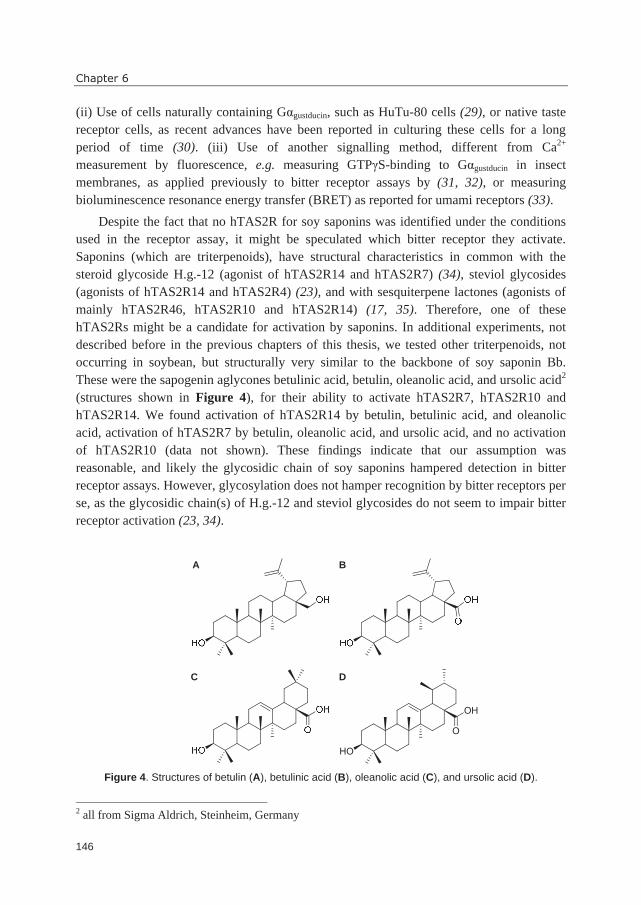
Chapter 6
146
(ii) Use of cells naturally containing Gαgustducin, such as HuTu-80 cells (29), or native taste
receptor cells, as recent advances have been reported in culturing these cells for a long
period of time (30). (iii) Use of another signalling method, different from Ca2+
measurement by fluorescence, e.g. measuring GTPγS-binding to Gαgustducin in insect
membranes, as applied previously to bitter receptor assays by (31, 32), or measuring
bioluminescence resonance energy transfer (BRET) as reported for umami receptors (33).
Despite the fact that no hTAS2R for soy saponins was identified under the conditions
used in the receptor assay, it might be speculated which bitter receptor they activate.
Saponins (which are triterpenoids), have structural characteristics in common with the
steroid glycoside H.g.-12 (agonist of hTAS2R14 and hTAS2R7) (34), steviol glycosides
(agonists of hTAS2R14 and hTAS2R4) (23), and with sesquiterpene lactones (agonists of
mainly hTAS2R46, hTAS2R10 and hTAS2R14) (17, 35). Therefore, one of these
hTAS2Rs might be a candidate for activation by saponins. In additional experiments, not
described before in the previous chapters of this thesis, we tested other triterpenoids, not
occurring in soybean, but structurally very similar to the backbone of soy saponin Bb.
These were the sapogenin aglycones betulinic acid, betulin, oleanolic acid, and ursolic acid2
(structures shown in Figure 4), for their ability to activate hTAS2R7, hTAS2R10 and
hTAS2R14. We found activation of hTAS2R14 by betulin, betulinic acid, and oleanolic
acid, activation of hTAS2R7 by betulin, oleanolic acid, and ursolic acid, and no activation
of hTAS2R10 (data not shown). These findings indicate that our assumption was
reasonable, and likely the glycosidic chain of soy saponins hampered detection in bitter
receptor assays. However, glycosylation does not hamper recognition by bitter receptors per
se, as the glycosidic chain(s) of H.g.-12 and steviol glycosides do not seem to impair bitter
receptor activation (23, 34).
Figure 4. Structures of betulin (A), betulinic acid (B), oleanolic acid (C), and ursolic acid (D).
2 all from Sigma Aldrich, Steinheim, Germany
HO
O
OH
DC
BA
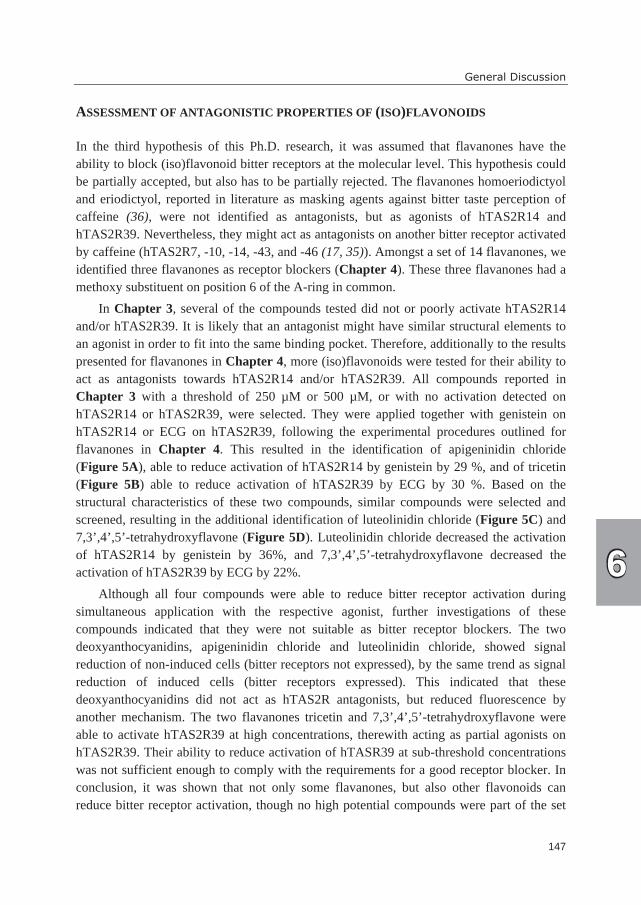
General Discussion
147
ASSESSMENT OF ANTAGONISTIC PROPERTIES OF (ISO)FLAVONOIDS
In the third hypothesis of this Ph.D. research, it was assumed that flavanones have the
ability to block (iso)flavonoid bitter receptors at the molecular level. This hypothesis could
be partially accepted, but also has to be partially rejected. The flavanones homoeriodictyol
and eriodictyol, reported in literature as masking agents against bitter taste perception of
caffeine (36), were not identified as antagonists, but as agonists of hTAS2R14 and
hTAS2R39. Nevertheless, they might act as antagonists on another bitter receptor activated
by caffeine (hTAS2R7, -10, -14, -43, and -46 (17, 35)). Amongst a set of 14 flavanones, we
identified three flavanones as receptor blockers (Chapter 4). These three flavanones had a
methoxy substituent on position 6 of the A-ring in common.
In Chapter 3, several of the compounds tested did not or poorly activate hTAS2R14
and/or hTAS2R39. It is likely that an antagonist might have similar structural elements to
an agonist in order to fit into the same binding pocket. Therefore, additionally to the results
presented for flavanones in Chapter 4, more (iso)flavonoids were tested for their ability to
act as antagonists towards hTAS2R14 and/or hTAS2R39. All compounds reported in
Chapter 3 with a threshold of 250 µM or 500 µM, or with no activation detected on
hTAS2R14 or hTAS2R39, were selected. They were applied together with genistein on
hTAS2R14 or ECG on hTAS2R39, following the experimental procedures outlined for
flavanones in Chapter 4. This resulted in the identification of apigeninidin chloride
(Figure 5A), able to reduce activation of hTAS2R14 by genistein by 29 %, and of tricetin
(Figure 5B) able to reduce activation of hTAS2R39 by ECG by 30 %. Based on the
structural characteristics of these two compounds, similar compounds were selected and
screened, resulting in the additional identification of luteolinidin chloride (Figure 5C) and
7,3’,4’,5’-tetrahydroxyflavone (Figure 5D). Luteolinidin chloride decreased the activation
of hTAS2R14 by genistein by 36%, and 7,3’,4’,5’-tetrahydroxyflavone decreased the
activation of hTAS2R39 by ECG by 22%.
Although all four compounds were able to reduce bitter receptor activation during
simultaneous application with the respective agonist, further investigations of these
compounds indicated that they were not suitable as bitter receptor blockers. The two
deoxyanthocyanidins, apigeninidin chloride and luteolinidin chloride, showed signal
reduction of non-induced cells (bitter receptors not expressed), by the same trend as signal
reduction of induced cells (bitter receptors expressed). This indicated that these
deoxyanthocyanidins did not act as hTAS2R antagonists, but reduced fluorescence by
another mechanism. The two flavanones tricetin and 7,3’,4’,5’-tetrahydroxyflavone were
able to activate hTAS2R39 at high concentrations, therewith acting as partial agonists on
hTAS2R39. Their ability to reduce activation of hTASR39 at sub-threshold concentrations
was not sufficient enough to comply with the requirements for a good receptor blocker. In
conclusion, it was shown that not only some flavanones, but also other flavonoids can
reduce bitter receptor activation, though no high potential compounds were part of the set
6
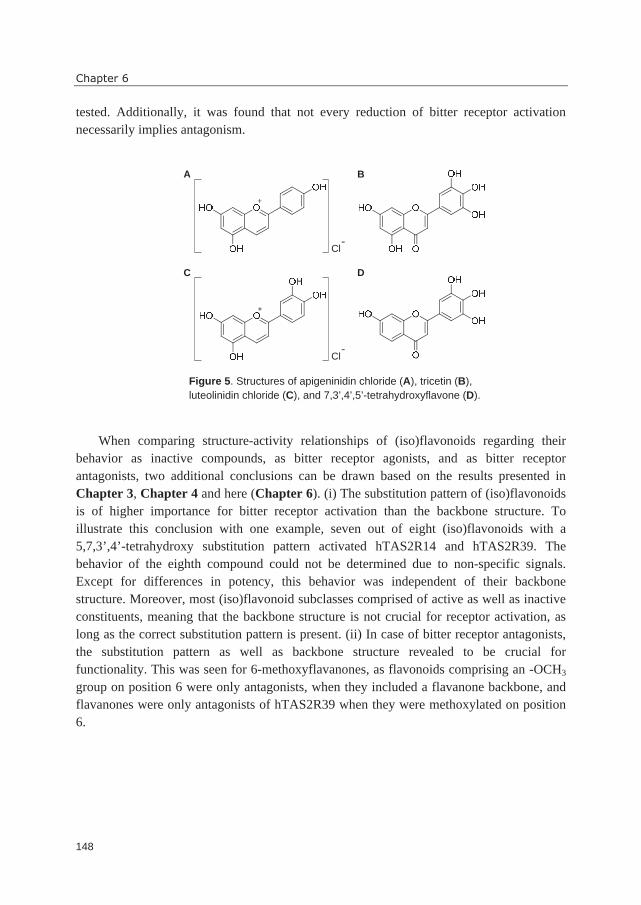
Chapter 6
148
tested. Additionally, it was found that not every reduction of bitter receptor activation
necessarily implies antagonism.
Figure 5. Structures of apigeninidin chloride (A), tricetin (B),
luteolinidin chloride (C), and 7,3’,4’,5’-tetrahydroxyflavone (D).
When comparing structure-activity relationships of (iso)flavonoids regarding their
behavior as inactive compounds, as bitter receptor agonists, and as bitter receptor
antagonists, two additional conclusions can be drawn based on the results presented in
Chapter 3, Chapter 4 and here (Chapter 6). (i) The substitution pattern of (iso)flavonoids
is of higher importance for bitter receptor activation than the backbone structure. To
illustrate this conclusion with one example, seven out of eight (iso)flavonoids with a
5,7,3’,4’-tetrahydroxy substitution pattern activated hTAS2R14 and hTAS2R39. The
behavior of the eighth compound could not be determined due to non-specific signals.
Except for differences in potency, this behavior was independent of their backbone
structure. Moreover, most (iso)flavonoid subclasses comprised of active as well as inactive
constituents, meaning that the backbone structure is not crucial for receptor activation, as
long as the correct substitution pattern is present. (ii) In case of bitter receptor antagonists,
the substitution pattern as well as backbone structure revealed to be crucial for
functionality. This was seen for 6-methoxyflavanones, as flavonoids comprising an -OCH3
group on position 6 were only antagonists, when they included a flavanone backbone, and
flavanones were only antagonists of hTAS2R39 when they were methoxylated on position
6.
A
C
B
D
Cl-
Cl-
General Discussion
149
SENSORY TESTS, RECEPTOR ASSAYS AND MODELING COMPARED FOR
EVALUATION OF BITTER TASTE
Testing for bitter compounds and bitter taste maskers
The use of the bitter receptor assay enabled us to identify (iso)flavonoid bitter receptors,
and to compare and characterize almost 100 (iso)flavonoids regarding their intrinsic
bitterness, receptor activation thresholds and EC50 values (Chapter 3). With the knowledge
of the target bitter receptors and the identified bitter receptor agonists, we were able to
identify three antagonists of hTAS2R39 (Chapter 4). Although we were not able to test
their functionality as bitter blockers in the mouth, due to unknown safety for human
consumption, their identification created insight into structural requirements to inhibit
hTAS2R39. This might lead to other blockers, suitable for food applications. The bitter
receptor assay is a high throughput method, sometimes limited by poor solubility and non-
specific signals of the test compounds, but without safety concerns. The findings just
described would not have been possible to achieve by the use of sensory tests. Sensory tests
have a low throughput, they are laborious, and it is difficult to find panel members for
tasting unpleasant compounds. Their outcomes can be highly variable, depending on the
sensory protocol, genetic profile of the panellists, and environmental and physiological
conditions. Most importantly, only food-grade compounds, safe for human consumption
(GRAS), can be used. A complicating factor for bitterness detection by sensory tests is that
bitterness and astringency are difficult to distinguish. On the other hand, only sensory tests
can establish the real taste perception, as receptor assays cannot account for interactions of
bitter compounds with saliva, or cross-modal interactions. The bitter receptor assay can
thus be seen as a filter to reduce the number of candidate compounds to the most potent
ones. In this way, the services of sensory panels can be minimized to evaluate the impact of
compounds of high interest.
In Chapter 5 we demonstrated a successful combination of the advantages of
bitter receptor assays and sensory tests. We studied the ability of the bitter compound
EGCG to bind to various proteins (in ultrafiltration assays), investigated whether this
phenomenon could be translated to reduced availability of EGCG for activation of
hTAS2R39 (in bitter receptor assays), and selected the protein with the highest ability to
reduce bitter receptor activation. The best protein, Na-caseinate, was tested in sensory tests
together with EGCG, and we could show that the in vitro findings were in agreement with
actual perception in vivo. Therewith, the last hypothesis of this thesis, namely that bitter
taste reduction for dietary flavonoids by complexation with food proteins can be predicted
by the use of in vitro assays, was accepted. However, not all in vitro and in vivo
observations were in full agreement with each other, as slight bitter taste reduction by use
of β-lactoglobulin was not predicted by in vitro assays. This bitterness reduction was most
likely not caused by complexation, but by interactions between β-lactoglobulin and the
buccal environment, which cannot be accounted for in the bitter receptor assays.
6
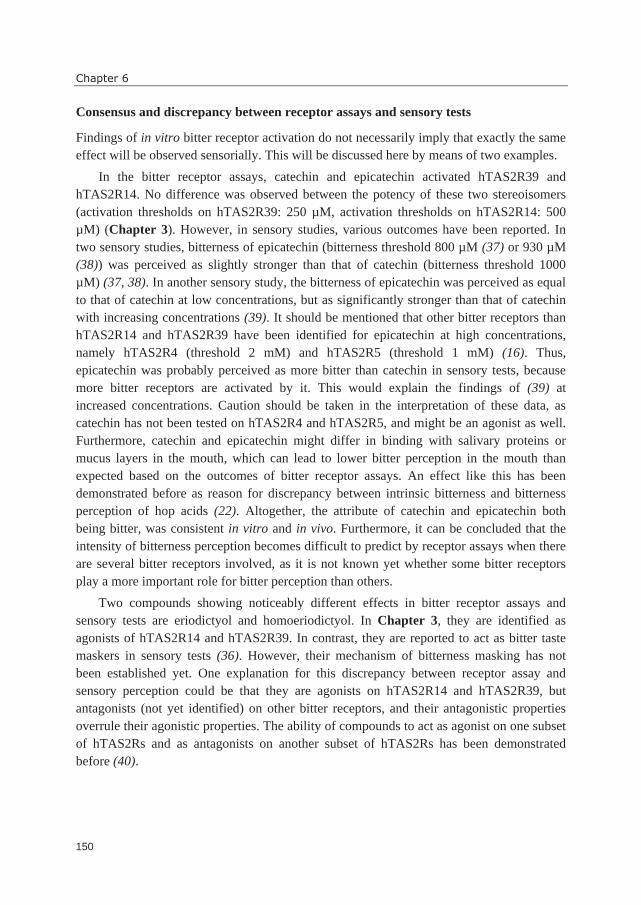
Chapter 6
150
Consensus and discrepancy between receptor assays and sensory tests
Findings of in vitro bitter receptor activation do not necessarily imply that exactly the same
effect will be observed sensorially. This will be discussed here by means of two examples.
In the bitter receptor assays, catechin and epicatechin activated hTAS2R39 and
hTAS2R14. No difference was observed between the potency of these two stereoisomers
(activation thresholds on hTAS2R39: 250 µM, activation thresholds on hTAS2R14: 500
µM) (Chapter 3). However, in sensory studies, various outcomes have been reported. In
two sensory studies, bitterness of epicatechin (bitterness threshold 800 µM (37) or 930 µM
(38)) was perceived as slightly stronger than that of catechin (bitterness threshold 1000
µM) (37, 38). In another sensory study, the bitterness of epicatechin was perceived as equal
to that of catechin at low concentrations, but as significantly stronger than that of catechin
with increasing concentrations (39). It should be mentioned that other bitter receptors than
hTAS2R14 and hTAS2R39 have been identified for epicatechin at high concentrations,
namely hTAS2R4 (threshold 2 mM) and hTAS2R5 (threshold 1 mM) (16). Thus,
epicatechin was probably perceived as more bitter than catechin in sensory tests, because
more bitter receptors are activated by it. This would explain the findings of (39) at
increased concentrations. Caution should be taken in the interpretation of these data, as
catechin has not been tested on hTAS2R4 and hTAS2R5, and might be an agonist as well.
Furthermore, catechin and epicatechin might differ in binding with salivary proteins or
mucus layers in the mouth, which can lead to lower bitter perception in the mouth than
expected based on the outcomes of bitter receptor assays. An effect like this has been
demonstrated before as reason for discrepancy between intrinsic bitterness and bitterness
perception of hop acids (22). Altogether, the attribute of catechin and epicatechin both
being bitter, was consistent in vitro and in vivo. Furthermore, it can be concluded that the
intensity of bitterness perception becomes difficult to predict by receptor assays when there
are several bitter receptors involved, as it is not known yet whether some bitter receptors
play a more important role for bitter perception than others.
Two compounds showing noticeably different effects in bitter receptor assays and
sensory tests are eriodictyol and homoeriodictyol. In Chapter 3, they are identified as
agonists of hTAS2R14 and hTAS2R39. In contrast, they are reported to act as bitter taste
maskers in sensory tests (36). However, their mechanism of bitterness masking has not
been established yet. One explanation for this discrepancy between receptor assay and
sensory perception could be that they are agonists on hTAS2R14 and hTAS2R39, but
antagonists (not yet identified) on other bitter receptors, and their antagonistic properties
overrule their agonistic properties. The ability of compounds to act as agonist on one subset
of hTAS2Rs and as antagonists on another subset of hTAS2Rs has been demonstrated
before (40).
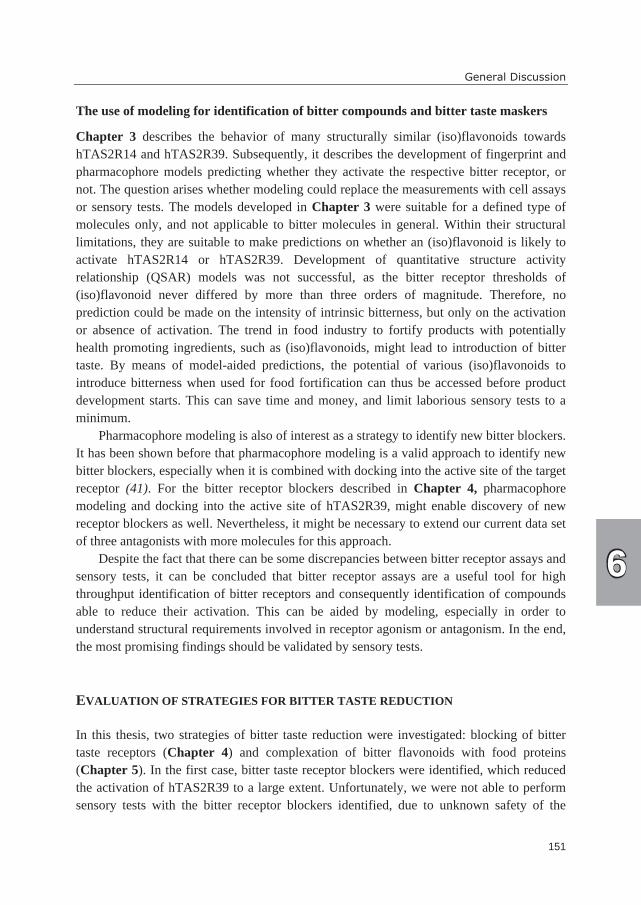
General Discussion
151
The use of modeling for identification of bitter compounds and bitter taste maskers
Chapter 3 describes the behavior of many structurally similar (iso)flavonoids towards
hTAS2R14 and hTAS2R39. Subsequently, it describes the development of fingerprint and
pharmacophore models predicting whether they activate the respective bitter receptor, or
not. The question arises whether modeling could replace the measurements with cell assays
or sensory tests. The models developed in Chapter 3 were suitable for a defined type of
molecules only, and not applicable to bitter molecules in general. Within their structural
limitations, they are suitable to make predictions on whether an (iso)flavonoid is likely to
activate hTAS2R14 or hTAS2R39. Development of quantitative structure activity
relationship (QSAR) models was not successful, as the bitter receptor thresholds of
(iso)flavonoid never differed by more than three orders of magnitude. Therefore, no
prediction could be made on the intensity of intrinsic bitterness, but only on the activation
or absence of activation. The trend in food industry to fortify products with potentially
health promoting ingredients, such as (iso)flavonoids, might lead to introduction of bitter
taste. By means of model-aided predictions, the potential of various (iso)flavonoids to
introduce bitterness when used for food fortification can thus be accessed before product
development starts. This can save time and money, and limit laborious sensory tests to a
minimum.
Pharmacophore modeling is also of interest as a strategy to identify new bitter blockers.
It has been shown before that pharmacophore modeling is a valid approach to identify new
bitter blockers, especially when it is combined with docking into the active site of the target
receptor (41). For the bitter receptor blockers described in Chapter 4, pharmacophore
modeling and docking into the active site of hTAS2R39, might enable discovery of new
receptor blockers as well. Nevertheless, it might be necessary to extend our current data set
of three antagonists with more molecules for this approach.
Despite the fact that there can be some discrepancies between bitter receptor assays and
sensory tests, it can be concluded that bitter receptor assays are a useful tool for high
throughput identification of bitter receptors and consequently identification of compounds
able to reduce their activation. This can be aided by modeling, especially in order to
understand structural requirements involved in receptor agonism or antagonism. In the end,
the most promising findings should be validated by sensory tests.
EVALUATION OF STRATEGIES FOR BITTER TASTE REDUCTION
In this thesis, two strategies of bitter taste reduction were investigated: blocking of bitter
taste receptors (Chapter 4) and complexation of bitter flavonoids with food proteins
(Chapter 5). In the first case, bitter taste receptor blockers were identified, which reduced
the activation of hTAS2R39 to a large extent. Unfortunately, we were not able to perform
sensory tests with the bitter receptor blockers identified, due to unknown safety of the
6
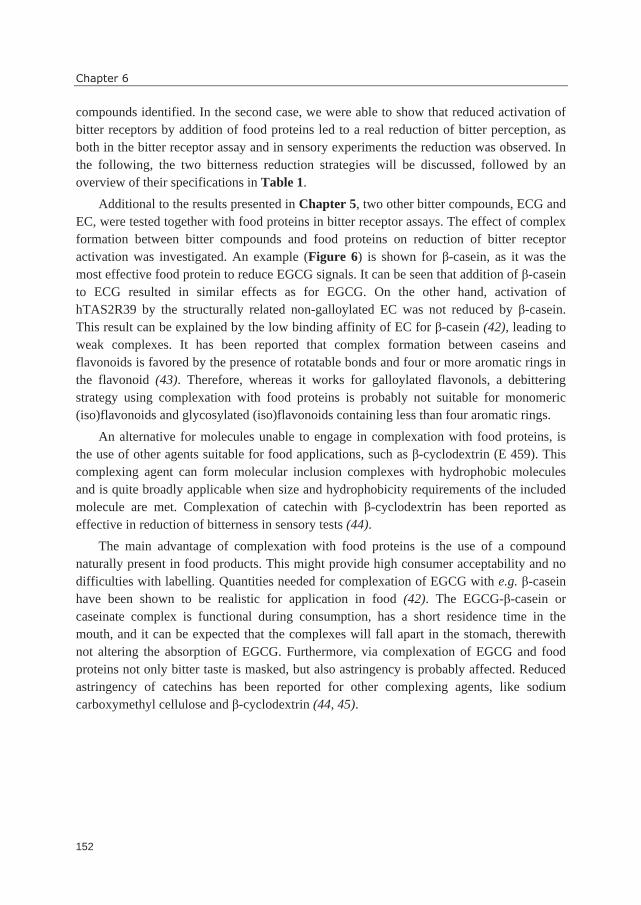
Chapter 6
152
compounds identified. In the second case, we were able to show that reduced activation of
bitter receptors by addition of food proteins led to a real reduction of bitter perception, as
both in the bitter receptor assay and in sensory experiments the reduction was observed. In
the following, the two bitterness reduction strategies will be discussed, followed by an
overview of their specifications in Table 1.
Additional to the results presented in Chapter 5, two other bitter compounds, ECG and
EC, were tested together with food proteins in bitter receptor assays. The effect of complex
formation between bitter compounds and food proteins on reduction of bitter receptor
activation was investigated. An example (Figure 6) is shown for β-casein, as it was the
most effective food protein to reduce EGCG signals. It can be seen that addition of β-casein
to ECG resulted in similar effects as for EGCG. On the other hand, activation of
hTAS2R39 by the structurally related non-galloylated EC was not reduced by β-casein.
This result can be explained by the low binding affinity of EC for β-casein (42), leading to
weak complexes. It has been reported that complex formation between caseins and
flavonoids is favored by the presence of rotatable bonds and four or more aromatic rings in
the flavonoid (43). Therefore, whereas it works for galloylated flavonols, a debittering
strategy using complexation with food proteins is probably not suitable for monomeric
(iso)flavonoids and glycosylated (iso)flavonoids containing less than four aromatic rings.
An alternative for molecules unable to engage in complexation with food proteins, is
the use of other agents suitable for food applications, such as β-cyclodextrin (E 459). This
complexing agent can form molecular inclusion complexes with hydrophobic molecules
and is quite broadly applicable when size and hydrophobicity requirements of the included
molecule are met. Complexation of catechin with β-cyclodextrin has been reported as
effective in reduction of bitterness in sensory tests (44).
The main advantage of complexation with food proteins is the use of a compound
naturally present in food products. This might provide high consumer acceptability and no
difficulties with labelling. Quantities needed for complexation of EGCG with e.g. β-casein
have been shown to be realistic for application in food (42). The EGCG-β-casein or
caseinate complex is functional during consumption, has a short residence time in the
mouth, and it can be expected that the complexes will fall apart in the stomach, therewith
not altering the absorption of EGCG. Furthermore, via complexation of EGCG and food
proteins not only bitter taste is masked, but also astringency is probably affected. Reduced
astringency of catechins has been reported for other complexing agents, like sodium
carboxymethyl cellulose and β-cyclodextrin (44, 45).
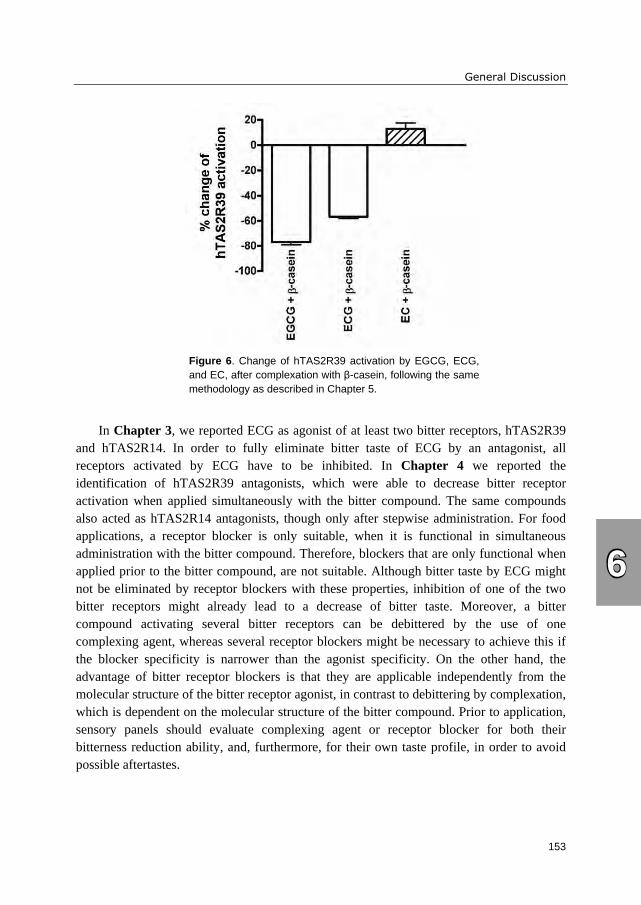
General Discussion
153
Figure 6. Change of hTAS2R39 activation by EGCG, ECG,
and EC, after complexation with β-casein, following the same
methodology as described in Chapter 5.
In Chapter 3, we reported ECG as agonist of at least two bitter receptors, hTAS2R39
and hTAS2R14. In order to fully eliminate bitter taste of ECG by an antagonist, all
receptors activated by ECG have to be inhibited. In Chapter 4 we reported the
identification of hTAS2R39 antagonists, which were able to decrease bitter receptor
activation when applied simultaneously with the bitter compound. The same compounds
also acted as hTAS2R14 antagonists, though only after stepwise administration. For food
applications, a receptor blocker is only suitable, when it is functional in simultaneous
administration with the bitter compound. Therefore, blockers that are only functional when
applied prior to the bitter compound, are not suitable. Although bitter taste by ECG might
not be eliminated by receptor blockers with these properties, inhibition of one of the two
bitter receptors might already lead to a decrease of bitter taste. Moreover, a bitter
compound activating several bitter receptors can be debittered by the use of one
complexing agent, whereas several receptor blockers might be necessary to achieve this if
the blocker specificity is narrower than the agonist specificity. On the other hand, the
advantage of bitter receptor blockers is that they are applicable independently from the
molecular structure of the bitter receptor agonist, in contrast to debittering by complexation,
which is dependent on the molecular structure of the bitter compound. Prior to application,
sensory panels should evaluate complexing agent or receptor blocker for both their
bitterness reduction ability, and, furthermore, for their own taste profile, in order to avoid
possible aftertastes.
6
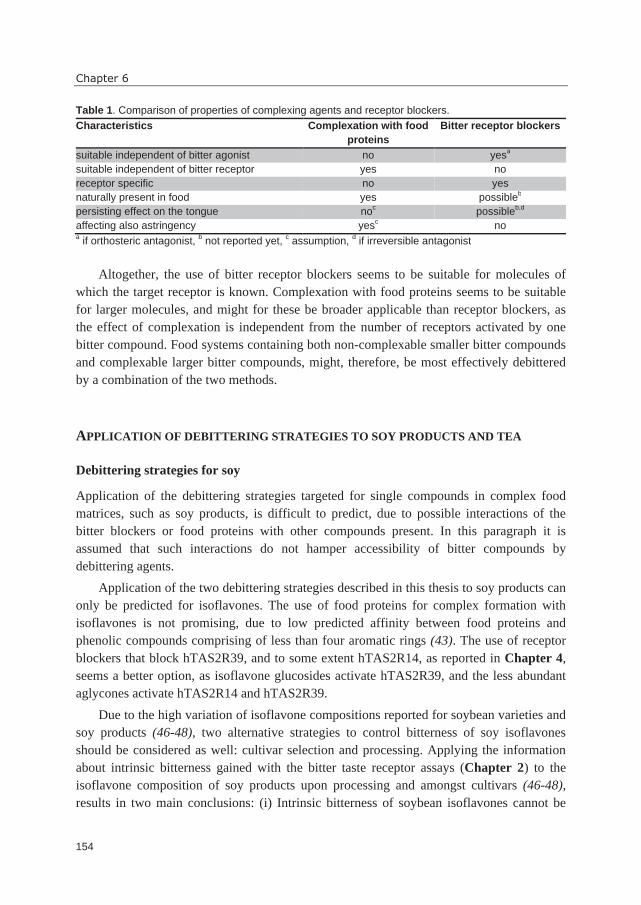
Chapter 6
154
Table 1. Comparison of properties of complexing agents and receptor blockers.
Characteristics Complexation with food
proteins
Bitter receptor blockers
suitable independent of bitter agonist no yesa
suitable independent of bitter receptor yes no
receptor specific no yes
naturally present in food yes possibleb
persisting effect on the tongue noc possible
b,d
affecting also astringency yesc no
a if orthosteric antagonist,
b not reported yet,
c assumption,
d if irreversible antagonist
Altogether, the use of bitter receptor blockers seems to be suitable for molecules of
which the target receptor is known. Complexation with food proteins seems to be suitable
for larger molecules, and might for these be broader applicable than receptor blockers, as
the effect of complexation is independent from the number of receptors activated by one
bitter compound. Food systems containing both non-complexable smaller bitter compounds
and complexable larger bitter compounds, might, therefore, be most effectively debittered
by a combination of the two methods.
APPLICATION OF DEBITTERING STRATEGIES TO SOY PRODUCTS AND TEA
Debittering strategies for soy
Application of the debittering strategies targeted for single compounds in complex food
matrices, such as soy products, is difficult to predict, due to possible interactions of the
bitter blockers or food proteins with other compounds present. In this paragraph it is
assumed that such interactions do not hamper accessibility of bitter compounds by
debittering agents.
Application of the two debittering strategies described in this thesis to soy products can
only be predicted for isoflavones. The use of food proteins for complex formation with
isoflavones is not promising, due to low predicted affinity between food proteins and
phenolic compounds comprising of less than four aromatic rings (43). The use of receptor
blockers that block hTAS2R39, and to some extent hTAS2R14, as reported in Chapter 4,
seems a better option, as isoflavone glucosides activate hTAS2R39, and the less abundant
aglycones activate hTAS2R14 and hTAS2R39.
Due to the high variation of isoflavone compositions reported for soybean varieties and
soy products (46-48), two alternative strategies to control bitterness of soy isoflavones
should be considered as well: cultivar selection and processing. Applying the information
about intrinsic bitterness gained with the bitter taste receptor assays (Chapter 2) to the
isoflavone composition of soy products upon processing and amongst cultivars (46-48),
results in two main conclusions: (i) Intrinsic bitterness of soybean isoflavones cannot be
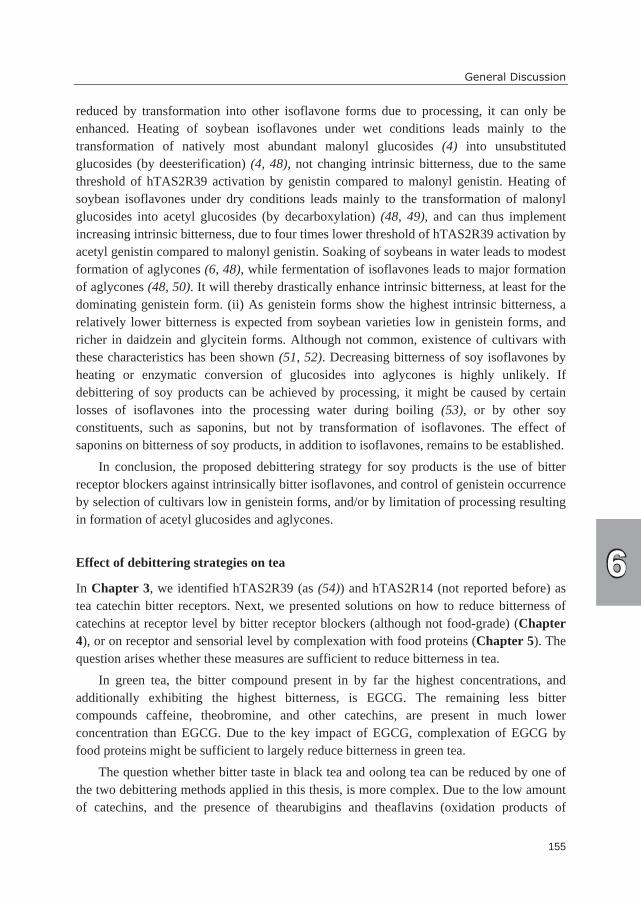
General Discussion
155
reduced by transformation into other isoflavone forms due to processing, it can only be
enhanced. Heating of soybean isoflavones under wet conditions leads mainly to the
transformation of natively most abundant malonyl glucosides (4) into unsubstituted
glucosides (by deesterification) (4, 48), not changing intrinsic bitterness, due to the same
threshold of hTAS2R39 activation by genistin compared to malonyl genistin. Heating of
soybean isoflavones under dry conditions leads mainly to the transformation of malonyl
glucosides into acetyl glucosides (by decarboxylation) (48, 49), and can thus implement
increasing intrinsic bitterness, due to four times lower threshold of hTAS2R39 activation by
acetyl genistin compared to malonyl genistin. Soaking of soybeans in water leads to modest
formation of aglycones (6, 48), while fermentation of isoflavones leads to major formation
of aglycones (48, 50). It will thereby drastically enhance intrinsic bitterness, at least for the
dominating genistein form. (ii) As genistein forms show the highest intrinsic bitterness, a
relatively lower bitterness is expected from soybean varieties low in genistein forms, and
richer in daidzein and glycitein forms. Although not common, existence of cultivars with
these characteristics has been shown (51, 52). Decreasing bitterness of soy isoflavones by
heating or enzymatic conversion of glucosides into aglycones is highly unlikely. If
debittering of soy products can be achieved by processing, it might be caused by certain
losses of isoflavones into the processing water during boiling (53), or by other soy
constituents, such as saponins, but not by transformation of isoflavones. The effect of
saponins on bitterness of soy products, in addition to isoflavones, remains to be established.
In conclusion, the proposed debittering strategy for soy products is the use of bitter
receptor blockers against intrinsically bitter isoflavones, and control of genistein occurrence
by selection of cultivars low in genistein forms, and/or by limitation of processing resulting
in formation of acetyl glucosides and aglycones.
Effect of debittering strategies on tea
In Chapter 3, we identified hTAS2R39 (as (54)) and hTAS2R14 (not reported before) as
tea catechin bitter receptors. Next, we presented solutions on how to reduce bitterness of
catechins at receptor level by bitter receptor blockers (although not food-grade) (Chapter
4), or on receptor and sensorial level by complexation with food proteins (Chapter 5). The
question arises whether these measures are sufficient to reduce bitterness in tea.
In green tea, the bitter compound present in by far the highest concentrations, and
additionally exhibiting the highest bitterness, is EGCG. The remaining less bitter
compounds caffeine, theobromine, and other catechins, are present in much lower
concentration than EGCG. Due to the key impact of EGCG, complexation of EGCG by
food proteins might be sufficient to largely reduce bitterness in green tea.
The question whether bitter taste in black tea and oolong tea can be reduced by one of
the two debittering methods applied in this thesis, is more complex. Due to the low amount
of catechins, and the presence of thearubigins and theaflavins (oxidation products of
6
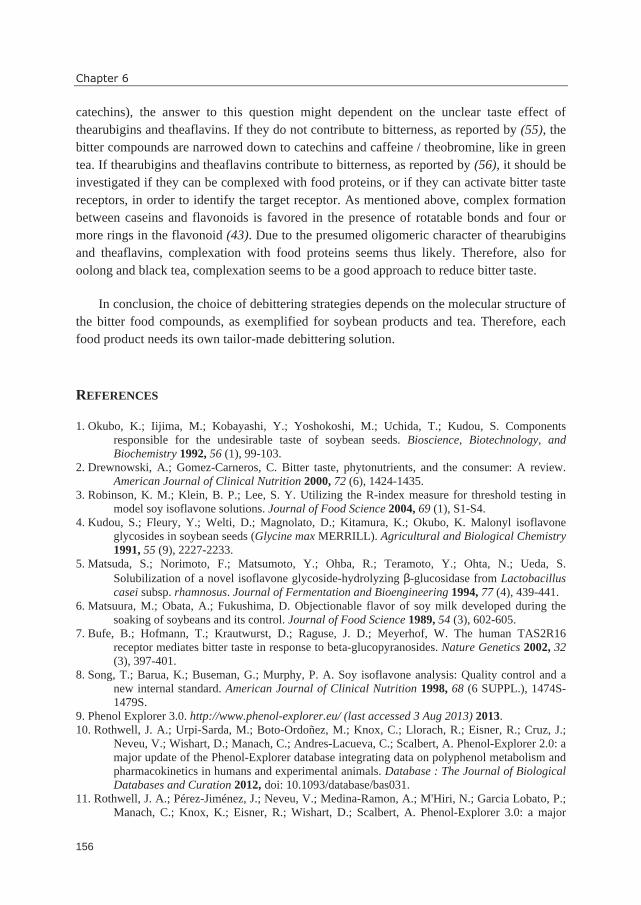
Chapter 6
156
catechins), the answer to this question might dependent on the unclear taste effect of
thearubigins and theaflavins. If they do not contribute to bitterness, as reported by (55), the
bitter compounds are narrowed down to catechins and caffeine / theobromine, like in green
tea. If thearubigins and theaflavins contribute to bitterness, as reported by (56), it should be
investigated if they can be complexed with food proteins, or if they can activate bitter taste
receptors, in order to identify the target receptor. As mentioned above, complex formation
between caseins and flavonoids is favored in the presence of rotatable bonds and four or
more rings in the flavonoid (43). Due to the presumed oligomeric character of thearubigins
and theaflavins, complexation with food proteins seems thus likely. Therefore, also for
oolong and black tea, complexation seems to be a good approach to reduce bitter taste.
In conclusion, the choice of debittering strategies depends on the molecular structure of
the bitter food compounds, as exemplified for soybean products and tea. Therefore, each
food product needs its own tailor-made debittering solution.
REFERENCES
1. Okubo, K.; Iijima, M.; Kobayashi, Y.; Yoshokoshi, M.; Uchida, T.; Kudou, S. Components
responsible for the undesirable taste of soybean seeds. Bioscience, Biotechnology, and
Biochemistry 1992, 56 (1), 99-103.
2. Drewnowski, A.; Gomez-Carneros, C. Bitter taste, phytonutrients, and the consumer: A review.
American Journal of Clinical Nutrition 2000, 72 (6), 1424-1435.
3. Robinson, K. M.; Klein, B. P.; Lee, S. Y. Utilizing the R-index measure for threshold testing in
model soy isoflavone solutions. Journal of Food Science 2004, 69 (1), S1-S4.
4. Kudou, S.; Fleury, Y.; Welti, D.; Magnolato, D.; Kitamura, K.; Okubo, K. Malonyl isoflavone
glycosides in soybean seeds (Glycine max MERRILL). Agricultural and Biological Chemistry
1991, 55 (9), 2227-2233.
5. Matsuda, S.; Norimoto, F.; Matsumoto, Y.; Ohba, R.; Teramoto, Y.; Ohta, N.; Ueda, S.
Solubilization of a novel isoflavone glycoside-hydrolyzing β-glucosidase from Lactobacillus
casei subsp. rhamnosus. Journal of Fermentation and Bioengineering 1994, 77 (4), 439-441.
6. Matsuura, M.; Obata, A.; Fukushima, D. Objectionable flavor of soy milk developed during the
soaking of soybeans and its control. Journal of Food Science 1989, 54 (3), 602-605.
7. Bufe, B.; Hofmann, T.; Krautwurst, D.; Raguse, J. D.; Meyerhof, W. The human TAS2R16
receptor mediates bitter taste in response to beta-glucopyranosides. Nature Genetics 2002, 32
(3), 397-401.
8. Song, T.; Barua, K.; Buseman, G.; Murphy, P. A. Soy isoflavone analysis: Quality control and a
new internal standard. American Journal of Clinical Nutrition 1998, 68 (6 SUPPL.), 1474S-
1479S.
9. Phenol Explorer 3.0. http://www.phenol-explorer.eu/ (last accessed 3 Aug 2013) 2013.
10. Rothwell, J. A.; Urpi-Sarda, M.; Boto-Ordoñez, M.; Knox, C.; Llorach, R.; Eisner, R.; Cruz, J.;
Neveu, V.; Wishart, D.; Manach, C.; Andres-Lacueva, C.; Scalbert, A. Phenol-Explorer 2.0: a
major update of the Phenol-Explorer database integrating data on polyphenol metabolism and
pharmacokinetics in humans and experimental animals. Database : The Journal of Biological
Databases and Curation 2012, doi: 10.1093/database/bas031.
11. Rothwell, J. A.; Pérez-Jiménez, J.; Neveu, V.; Medina-Ramon, A.; M'Hiri, N.; Garcia Lobato, P.;
Manach, C.; Knox, K.; Eisner, R.; Wishart, D.; Scalbert, A. Phenol-Explorer 3.0: a major
General Discussion
157
update of the Phenol-Explorer database to incorporate data on the effects of food processing
on polyphenol content. submitted 2013.
12. Manitoba Agriculture, Food and Rural Initiatives. Milk thistle. http://www.manitoba.ca/
agriculture/crops/medicinal/bkq00s15. html, (last accessed 22-8-2013).
13. Chen, X. J.; Zhao, J.; Meng, Q.; Li, S. P.; Wang, Y. T. Simultaneous determination of five
flavonoids in licorice using pressurized liquid extraction and capillary electrochromatography
coupled with peak suppression diode array detection. Journal of Chromatography A 2009,
1216 (43), 7329-7335.
14. Kitagawa, I. Licorice root. A natural sweetener and an important ingredient in Chinese medicine.
Pure and applied chemistry 2002, 74 (7), 1189-1198.
15. Roland, W. S. U.; Vincken, J. P.; Gouka, R. J.; van Buren, L.; Gruppen, H.; Smit, G. Soy
isoflavones and other isoflavonoids activate the human bitter taste receptors hTAS2R14 and
hTAS2R39. Journal of Agricultural and Food Chemistry 2011, 59 (21), 11764-11771.
16. Soares, S.; Kohl, S.; Thalmann, S.; Mateus, N.; Meyerhof, W.; De Freitas, V. Different phenolic
compounds activate distinct human bitter taste receptors. Journal of Agricultural and Food
Chemistry 2013, 61 (7), 1525-1533.
17. Brockhoff, A.; Behrens, M.; Massarotti, A.; Appending, G.; Meyerhof, W. Broad tuning of the
human bitter taste receptor hTAS2R46 to various sesquiterpene lactones, clerodane and
labdane diterpenoids, strychnine, and denatonium. Journal of Agricultural and Food
Chemistry 2007, 55 (15), 6236-6243.
18. Maehashi, K.; Matano, M.; Wang, H.; Vo, L. A.; Yamamoto, Y.; Huang, L. Bitter peptides
activate hTAS2Rs, the human bitter receptors. Biochemical and Biophysical Research
Communications 2008, 365 (4), 851-855.
19. Upadhyaya, J.; Pydi, S. P.; Singh, N.; Aluko, R. E.; Chelikani, P. Bitter taste receptor T2R1 is
activated by dipeptides and tripeptides. Biochemical and Biophysical Research
Communications 2010, 398 (2), 331-335.
20. Ueno, Y.; Sakurai, T.; Okada, S.; Abe, K.; Misaka, T. Human bitter taste receptors hTAS2R8 and
hTAS2R39 with differential functions to recognize bitter peptides. Bioscience, Biotechnology
and Biochemistry 2011, 75 (6), 1188-1190.
21. Kohl, S.; Behrens, M.; Dunkel, A.; Hofmann, T.; Meyerhof, W. Amino acids and peptides
activate at least five members of the human bitter taste receptor family. Journal of
Agricultural and Food Chemistry 2013, 61 (1), 53-60.
22. Intelmann, D.; Batram, C.; Kuhn, C.; Haseleu, G.; Meyerhof, W.; Hofmann, T. Three TAS2R
bitter taste receptors mediate the psychophysical responses to bitter compounds of hops
(Humulus lupulus L.) and beer. Chemosensory Perception 2009, 2 (3), 118-132.
23. Hellfritsch, C.; Brockhoff, A.; Stähler, F.; Meyerhof, W.; Hofmann, T. Human psychometric and
taste receptor responses to steviol glycosides. Journal of Agricultural and Food Chemistry
2012, 60 (27), 6782-6793.
24. Soranzo, N.; Bufe, B.; Sabeti, P. C.; Wilson, J. F.; Weale, M. E.; Marguerie, R.; Meyerhof, W.;
Goldstein, D. B. Positive selection on a high-sensitivity allele of the human bitter-taste
receptor TAS2R16. Current Biology 2005, 15 (14), 1257-1265.
25. Bufe, B.; Breslin, P. A. S.; Kuhn, C.; Reed, D. R.; Tharp, C. D.; Slack, J. P.; Kim, U. K.; Drayna,
D.; Meyerhof, W. The molecular basis of individual differences in phenylthiocarbamide and
propylthiouracil bitterness perception. Current Biology 2005, 15 (4), 322-327.
26. Pronin, A. N.; Xu, H.; Tang, H.; Zhang, L.; Li, Q.; Li, X. Specific alleles of bitter receptor genes
influence human sensitivity to the bitterness of aloin and saccharin. Current Biology 2007, 17
(16), 1403-1408.
27. Decroos, K.; Vincken, J. P.; Heng, L.; Bakker, R.; Gruppen, H.; Verstraete, W. Simultaneous
quantification of differently glycosylated, acetylated, and 2,3-dihydro-2,5-dihydroxy-6-
methyl-4H-pyran-4-one-conjugated soyasaponins using reversed-phase high-performance
liquid chromatography with evaporative light scattering detection. Journal of
Chromatography A 2005, 1072 (2), 185-193.
6
Chapter 6
158
28. Naim, M.; Seifert, R.; Nurnberg, B.; Grunbaum, L.; Schultz, G. Some taste substances are direct
activators of G-proteins. Biochemical Journal 1994, 297 (3), 451-454.
29. Rozengurt, N.; Wu, S. V.; Chen, M. C.; Huang, C.; Sternini, C.; Rozengurt, E. Colocalization of
the α−subunit of gustducin with PYY and GLP-1 in L cells of human colon. American
Journal of Physiology - Gastrointestinal and Liver Physiology 2006, 291 (5), G792-G802.
30. Ozdener, M. H.; Brand, J. G.; Spielman, A. I.; Lischka, F. W.; Teeter, J. H.; Breslin, P. A.;
Rawson, N. E. Characterization of human fungiform papillae cells in culture. Chemical
Senses 2011, 36 (7), 601-612.
31. Chandrashekar, J.; Mueller, K. L.; Hoon, M. A.; Adler, E.; Feng, L.; Guo, W.; Zuker, C. S.; Ryba,
N. J. P. T2Rs function as bitter taste receptors. Cell 2000, 100 (6), 703-711.
32. Pronin, A. N.; Tang, H.; Connor, J.; Keung, W. Identification of ligands for two human bitter T2R
receptors. Chemical Senses 2004, 29 (7), 583-593.
33. Wieland, K. Improved method for screening a potential modulator compound of a taste receptor.
WO 2011/067202 A1, 2011.
34. Le Nevé, B.; Foltz, M.; Daniel, H.; Gouka, R. The steroid glycoside H.g.-12 from Hoodia
gordonii activates the human bitter receptor TAS2R14 and induces CCK release from HuTu-
80 cells. American Journal of Physiology-Gastrointestinal and Liver Physiology 2010, 299
(6), G1368-G1375.
35. Meyerhof, W.; Batram, C.; Kuhn, C.; Brockhoff, A.; Chudoba, E.; Bufe, B.; Appendino, G.;
Behrens, M. The molecular receptive ranges of human TAS2R bitter taste receptors. Chemical
Senses 2010, 35 (2), 157-170.
36. Ley, J. P.; Krammer, G.; Reinders, G.; Gatfield, I. L.; Bertram, H. J. Evaluation of bitter masking
flavanones from Herba Santa (Eriodictyon californicum (H. & A.) Torr., Hydrophyllaceae).
Journal of Agricultural and Food Chemistry 2005, 53 (15), 6061-6066.
37. Stark, T.; Bareuther, S.; Hofmann, T. Sensory-guided decomposition of roasted cocoa nibs
(Theobroma cacao) and structure determination of taste-active polyphenols. Journal of
Agricultural and Food Chemistry 2005, 53 (13), 5407-5418.
38. Hufnagel, J. C.; Hofmann, T. Orosensory-directed identification of astringent mouthfeel and
bitter-tasting compounds in red wine. Journal of Agricultural and Food Chemistry 2008, 56
(4), 1376-1386.
39. Kallithraka, S.; Bakker, J.; Clifford, M. N. Evaluation of bitterness and astringency of (+)-
catechin and (-)-epicatechin in red wine and in model solution. Journal of Sensory Studies
1997, 12 (1), 25-37.
40. Brockhoff, A.; Behrens, M.; Roudnitzky, N.; Appendino, G.; Avonto, C.; Meyerhof, W. Receptor
agonism and antagonism of dietary bitter compounds. Journal of Neuroscience 2011, 31 (41),
14775-14872.
41. Ley, J. P.; Dessoy, M.; Paetz, S.; Blings, M.; Hoffmann-Lücke, P.; Reichelt, K. V.; Krammer, G.
E.; Pienkny, S.; Brandt, W.; Wessjohann, L. Identification of enterodiol as a masker for
caffeine bitterness by using a pharmacophore model based on structural analogues of
homoeriodictyol. Journal of Agricultural and Food Chemistry 2012, 60 (25), 6303-6311.
42. Bohin, M. C.; Vincken, J. P.; Van Der Hijden, H. T. W. M.; Gruppen, H. Efficacy of food
proteins as carriers for flavonoids. Journal of Agricultural and Food Chemistry 2012, 60 (16),
4136-4143.
43. Bohin, M. C. Food proteins as potential carriers for phenolics. Ph.D. thesis. Wageningen
University, Wageningen, The Netherlands, 2013.
44. Gaudette, N. J.; Pickering, G. J. The efficacy of bitter blockers on health-relevant bitterants.
Journal of Functional Foods 2012, 4 (1), 177-184.
45. Gaudette, N. J.; Pickering, G. J. Optimizing the Orosensory Properties of Model Functional
Beverages: The influence of novel sweeteners, odorants, bitter blockers, and their mixtures on
(+)-catechin. Journal of Food Science 2012, 77 (6), S226-S232.
General Discussion
159
46. Wang, H. J.; Murphy, P. A. Isoflavone composition of American and Japanese soybeans in Iowa:
Effects of variety, crop year, and location. Journal of Agricultural and Food Chemistry 1994,
42 (8), 1674-1677.
47. Wang, H. J.; Murphy, P. A. Isoflavone content in commercial soybean foods. Journal of
Agricultural and Food Chemistry 1994, 42 (8), 1666-1673.
48. Murphy, P. A.; Barua, K.; Hauck, C. C. Solvent extraction selection in the determination of
isoflavones in soy foods. Journal of Chromatography B: Analytical Technologies in the
Biomedical and Life Sciences 2002, 777 (1-2), 129-138.
49. Coward, L.; Barnes, N. C.; Setchell, K. D. R.; Barnes, S. Genistein, daidzein, and their beta-
glycoside conjugates - Antitumor isoflavones in soybean foods from American and Asian
diets. Journal of Agricultural and Food Chemistry 1993, 41 (11), 1961-1967.
50. Yang, S.; Wang, L.; Yan, Q.; Jiang, Z.; Li, L. Hydrolysis of soybean isoflavone glycosides by a
thermostable β-glucosidase from Paecilomyces thermophila. Food Chemistry 2009, 115 (4),
1247-1252.
51. Genovese, M. I.; Hassimotto, N. M. A.; Lajolo, P. M. Isoflavone profile and antioxidant activity
of Brazilian soybean varieties. Food Science and Technology International 2005, 11 (3), 205-
211.
52. Lee, J. H.; Choung, M. G. Comparison of nutritional components in soybean varieties with
different geographical origins. Journal of Applied Biological Chemistry 2011, 54 (2), 254-
263.
53. Franke, A. A.; Hankin, J. H.; Yu, M. C.; Maskarinec, G.; Low, S. H.; Custer, L. J. Isoflavone
levels in soy foods consumed by multiethnic populations in Singapore and Hawaii. Journal of
Agricultural and Food Chemistry 1999, 47 (3), 977-986.
54. Narukawa, M.; Noga, C.; Ueno, Y.; Sato, T.; Misaka, T.; Watanabe, T. Evaluation of the
bitterness of green tea catechins by a cell-based assay with the human bitter taste receptor
hTAS2R39. Biochemical and Biophysical Research Communications 2011, 405 (4), 620-625.
55. Scharbert, S.; Hofmann, T. Molecular definition of black tea taste by means of quantitative
studies, taste reconstitution, and omission experiments. Journal of Agricultural and Food
Chemistry 2005, 53 (13), 5377-5384.
56. Sanderson, G.; Ranadive, A.; Eisenberg, L.; Farrel, F.; Simons, R.; Manley, C.; Coggon, P.
Contribution of polyphenolic compounds to the taste of tea. In Phenolic, sulfur, and nitrogen
compounds in food flavors, Charalambous, G.; Katz, I., Eds.; American Chemical Society:
Washington, DC, USA 1976.
6

Chapter 6
160

Summary
Summary
162
Many flavonoids and isoflavonoids have been associated with beneficial health effects.
Therefore, consumption of (iso)flavonoid-rich food products, and enrichment of foods with
(iso)flavonoids is becoming increasingly popular. However, several (iso)flavonoids have
been reported as bitter. Consequently, their incorporation in (or fortification of) foods can
introduce (or enhance) bitterness. Hence, debittering strategies are demanded.
Some (iso)flavonoids have unknown taste properties, as they have never been
incorporated in high levels in food products. For other (iso)flavonoids, contradictory
findings on bitterness have been made in sensory tests. Therefore, objective tests are
necessary to identify which (iso)flavonoids contribute to bitterness of a food product. An
objective tool to study bitterness is a cell-based bitter taste receptor assay. Twenty-five
different bitter taste receptors (hTAS2Rs) occur on the human tongue, each of which has
been introduced in a separate human embryonic kidney (HEK)293 cell line. With these, the
“intrinsic bitterness” of a compound can be investigated in vitro. Intrinsic bitterness is the
capacity of a compound to activate bitter taste receptors, uncoupled from cross-modal
interactions and interactions with salivary proteins and oral mucosa. The aim of this
research was to study the intrinsic bitterness of a large set of (iso)flavonoids and to
investigate structural requirements for (iso)flavonoids to activate the bitter receptors
identified. A subsequent aim was the investigation of different debittering strategies by the
use of the bitter receptor assay.
Chapter 1 provides an overview of flavonoids and isoflavonoids with respect to their
structural classification, sensorial properties and occurrence as dietary compounds. Taste
perception and the mode of action of bitter taste receptors are introduced. The measurement
of bitter receptor activation in vitro is explained, as well as strategies to reduce bitter
receptor activation, and bitter taste in general. A state-of-the-art overview of all 25 bitter
taste receptors is given with respect to known agonists and antagonists.
The aim of Chapter 2 was to identify the bitter receptor(s) that recognize the bitter
taste of the soy isoflavone genistein. Screening of all 25 human bitter receptors revealed
genistein as agonist of hTAS2R14 and hTAS2R39. Genistein displayed threshold values of
4 and 8 µM on hTAS2R14 and hTAS2R39, and EC50 values of 29 and 49 µM, respectively.
Besides, the behavior of structurally similar isoflavonoids was investigated. Although the
two receptors are not closely related, the results for hTAS2R14 and hTAS2R39 were
similar towards most isoflavonoid aglycones. Glucosylation of isoflavones seemed to
inhibit activation of hTAS2R14, whereas four of five glucosylated isoflavones were
agonists of hTAS2R39, namely glycitin, genistin, acetyl genistin, and malonyl genistin. A
total of three hydroxyl substitutions of the A- and B-rings of the isoflavonoids seemed to be
more favorable for receptor activation than less hydroxyl groups. The concentration of the
trihydroxylated genistein in several soy foods exceeds the bitter receptor threshold values
determined, whereas those of other soy isoflavones are around or below their respective
threshold values. Despite its low concentration, genistein might be one of the main
Summary
163
contributors to the bitterness of soy products. Furthermore, the bioactive isoflavonoids
equol and coumestrol activated both receptors, indicating that their sensory impact should
be considered when used as food ingredients.
In Chapter 3, the intrinstic bitterness of (iso)flavonoids, which can hamper their use as
food bioactives, was investigated further. The effect of a large set of structurally similar
(iso)flavonoids on the activation of bitter receptors hTAS2R14 and hTAS2R39 was tested,
and their structural requirements to activate these receptors were predicted. In total, 68
compounds activated hTAS2R14 and 70 compounds activated hTAS2R39, amongst which
58 ligands were overlapping. Their activation threshold values varied over a range of three
log units between 0.12 and 500 µM. Ligand-based 2D-fingerprint and 3D-pharmacophore
models were created to detect structure activity relationships. The 2D-models demonstrated
excellent predictive power in identifying bitter (iso)flavonoids and discrimination from
inactive ones. The structural characteristics for an (iso)flavonoid to activate hTAS2R14 and
hTAS2R39 were determined by 3D-pharmacophore models to be composed of two (for
hTAS2R14) or three (for hTAS2R39) hydrogen bond donor sites, one hydrogen bond
acceptor site, and two aromatic ring structures, of which one had to be hydrophobic. An
additional hydrogen bond donor feature for hTAS2R39 ligands indicated the possible
presence of another complementary acceptor site in the binding pocket, compared to
hTAS2R14. Hydrophobic interaction of the aromatic feature with the binding site might be
of higher importance in hTAS2R14 than in hTAS2R39. Together, this might explain why
OH-rich compounds showed different behavior towards the two bitter receptors. The
combination of in vitro data and different in silico methods created a good insight in
activation of hTAS2R14 and hTAS2R39 by (iso)flavonoids and provided a powerful tool in
prediction of their potential bitterness. By understanding the “bitter motif”, introduction of
bitter taste in functional foods enriched in (iso)flavonoid bioactives might be avoided.
Bitter receptor hTAS2R39 is activated by many different classes of bitter compounds,
amongst which (iso)flavonoids. Nevertheless, several flavanones are known to mask bitter
taste sensorially, and not all flavanones reported in Chapter 3 activated hTAS2R39. For
that reason, in Chapter 4, fourteen flavanones were investigated for their potential to
reduce activation of hTAS2R39 by epicatechin gallate (ECG), one of the main bitter
compounds present in green tea. Three compounds showed inhibitory behavior towards the
activation of hTAS2R39 by ECG: 4’-fluoro-6-methoxyflavanone, 6,3’-
dimethoxyflavanone, and 6-methoxyflavanone (in order of decreasing potency). The 6-
methoxyflavanones also inhibited activation of hTAS2R14 (another bitter receptor
activated by ECG), though to a lesser extent. Dose-response curves of ECG at various
concentrations of the most potent antagonist 4’-fluoro-6-methoxyflavanone and wash-out
experiments indicated reversible insurmountable antagonism. The same effect was
observed for the structurally different agonist denatonium benzoate, suggesting a non-
competitive orthosteric mechanism. The bitter receptor blockers identified might not be
Summary
164
applicable to food products. Nevertheless, they create insight into structural requirements,
which might lead to other, more suitable, blockers.
Chapter 5 investigates another strategy to reduce bitterness, namely complexation of
bitter flavonoids with food proteins. The binding characteristics of the bitter tea compound
epigallocatechin gallate (EGCG) to purified food proteins, and their equivalent food-grade
preparations, were related to their effects on reducing bitter receptor activation by EGCG in
vitro and their bitter-masking potential in vivo. β-Casein, in particular, and several gelatins,
are known as strong binders of EGCG, contrary to β-lactoglobulin. Also in the bitter
receptor assay, β-casein showed the strongest effect, with a maximum reduction of
hTAS2R39 activation of about 93%. A similar potency was observed for Na-caseinate,
which was applied as food-grade alternative for β-casein. β-Lactoglobulin had little effect
on bitter receptor activation, as expected based on its low binding affinity for EGCG. The
bitter-masking potential of Na-caseinate was confirmed in vivo using a trained sensory
panel. β-Lactoglobulin also slightly reduced EGCG bitter perception, which could not be
directly related to its binding capacity. The bitter receptor assay appeared to be a valid tool
to evaluate in vitro the efficacy of food proteins as complexing agents for bitter-masking.
Chapter 6 discusses the findings presented in this thesis, addresses prospects and
limitations of the bitter receptor cell assay, presents additional results on testing
(iso)flavonoids for possible antagonistic properties, and compares taste evaluation by
sensory tests, receptor assays and modeling. Furthermore, it evaluates strategies for bitter
taste reduction, and applies the findings to soy products and tea.
The systematic investigation of (iso)flavonoid aglycones showed that the substitution
pattern of (iso)flavonoids is of higher importance for bitter receptor activation than the
backbone structure. In case of bitter receptor antagonists, the substitution pattern as well as
backbone structure revealed to be crucial for functionality. The bitter receptor assay was
shown to be an appropriate tool not only for identification of bitter receptor agonists and
antagonists, but also for identification of reduced receptor activation by complexing agents.
Based on the findings of this thesis, it was concluded that complexation with food proteins
is the most promising strategy to reduce bitter taste of flavonoids in tea. On the other hand,
for soybean isoflavones, debittering by use of bitter receptor blockers seemed to be a
promising debittering strategy. Alternatively to the use of receptor blockers, processing
conditions (leading to low isoflavone aglycone formation) or raw material choice (i.e.
cultivars low in genistein forms) were recommended. In conclusion, the choice of
debittering strategies depends on the molecular structure of the bitter food compounds, as
exemplified for soybean products and tea. Therefore, each food product seems to require its
own tailor-made debittering solution.

Samenvatting
Samenvatting
166
Veel flavonoïden en isoflavonoïden worden in verband gebracht met gezondheids-
bevorderende effecten. Om deze reden wordt de consumptie van voedingsmiddelen rijk aan
(iso)flavonoïden en het verrijken van producten met (iso)flavonoïden steeds populairder.
Verschillende (iso)flavonoïden worden echter als bitter ervaren. Als gevolg hiervan kan het
toevoegen van of verrijken met (iso)flavonoïden voedingsmiddelen bitter maken of de
bitterheid verhogen. Er is daarom behoefte aan methoden om producten te ontbitteren.
Van sommige (iso)flavonoïden zijn de smaakeigenschappen onbekend, omdat ze nooit
in hoge concentraties aan voedingsmiddelen zijn toegevoegd. Voor andere zijn
tegenstrijdige resultaten gevonden in sensorisch onderzoek. Daarom zijn objectieve
methoden nodig om te bepalen welke (iso)flavonoïden bijdragen aan de bitterheid van een
product. Een objectief hulpmiddel om bitterheid te bestuderen is een cel-gebaseerde
bitterreceptor-assay. Op de menselijke tong komen 25 verschillende bitterreceptoren
(hTAS2Rs) voor, welke allemaal in een afzonderlijke HEK 293 cellijn zijn geïntroduceerd.
Met behulp van deze cellijnen kan de “intrinsieke bitterheid” van een verbinding in vitro
worden onderzocht. Intrinsieke bitterheid is de capaciteit van een verbinding om
bitterreceptoren te activeren, losgekoppeld van cross-modale interacties en interacties met
speekseleiwitten en mondslijmvlies. Het doel van dit onderzoek was het bestuderen van de
intrinsieke bitterheid van een groot aantal (iso)flavonoïden en het identificeren van hun
structurele eigenschappen, die het activeren van bitterreceptoren mogelijk maken.
Daarnaast is door middel van de bitterreceptor-assay onderzocht welke verschillende
strategieën er zijn voor ontbittering.
In hoofdstuk 1 wordt een overzicht gegeven van flavonoïden en isoflavonoïden met
betrekking tot hun structurele indeling, sensorische eigenschappen en voorkomen als
dieetbestanddelen. Smaakperceptie en de werking van bitterreceptoren worden
geïntroduceerd. Het in vitro meten van bitterreceptoractivatie wordt uitgelegd, evenals
strategieën om bitterreceptoractivatie, en bittere smaak in het algemeen, te verminderen. Er
wordt een actueel overzicht weergegeven van de bekende agonisten en antagonisten van
alle 25 bitterreceptoren.
Het doel van hoofdstuk 2 was het identificeren van de bitterreceptor(en) die de bittere
smaak van het sojaisoflavon genisteïne herkennen. Screening van alle 25 humane
bitterreceptoren maakte duidelijk dat genisteïne een agonist van hTAS2R14 en hTAS2R39
is. Drempelwaarden van genisteïne waren 4 en 8 µM voor hTAS2R14 en hTAS2R39, EC50
waarden waren respectievelijk 29 en 49 µM. Daarnaast werd het gedrag van structureel
vergelijkbare isoflavonoïden onderzocht. Hoewel de twee receptoren hTAS2R14 en
hTAS2R39 niet nauwverwant zijn, waren de resultaten met de meeste isoflavon aglyconen
vergelijkbaar. Glucosylering van isoflavonen leek de activatie van hTAS2R14 te remmen,
terwijl vier van de vijf geglucosyleerde isoflavonen, namelijk glycitine, genistine,
acetylgenistine en malonylgenistine, agonisten waren van hTAS2R39. Een totaal aantal van
drie hydroxylsubstituenten op de A- en B-ring van de isoflavonoïden leek meer
Samenvatting
167
bevorderlijk voor receptoractivatie dan minder hydroxylgroepen. De concentraties van het
trihydroxyl isoflavonoïd genisteïne in verschillende sojaproducten overschrijden de
gevonden bitterreceptor drempelwaarden, terwijl die van andere soja-isoflavonen rond of
onder hun respectievelijke drempelwaarden liggen. Ondanks zijn lage concentratie zou
genisteïne een van de belangrijkste veroorzakers van bitterheid van sojaproducten kunnen
zijn. Verder activeerden de bioactieve isoflavonoiden equol en coumestrol beide
receptoren. Hetgeen suggereert dat hun sensorische invloed in acht moet worden genomen
wanneer ze gebruikt worden als ingrediënt in voedsel.
In hoofdstuk 3 werd de intrinsieke bitterheid van (iso)flavonoïden, wat hun toepassing
als bioactieve ingrediënten kan bemoeilijken, verder onderzocht. Het effect van een grote
set structureel vergelijkbare (iso)flavonoïden op de activatie van bitterreceptoren
hTAS2R14 en hTAS2R39 werd onderzocht en hun structurele vereisten om deze receptoren
te activeren werden voorspeld. 68 verbindingen activeerden hTAS2R14 en 70 verbindingen
activeerden hTAS2R39, waarvan 58 liganden overlapten. Hun drempelwaarden voor
activatie varieerden over een bereik van drie logeenheden tussen 0,12 en 500 µM. Ligand
gebaseerde 2D-vingerafdruk en 3D-pharmocaphore modellen werden gemaakt om
structuur-activiteit-relaties te vinden. De 2D modellen konden erg goed voorspellen of
(iso)flavonoïden bitter zijn of niet. Met behulp van 3D-pharmacophoremodellen werd
gevonden dat de structurele eigenschappen voor (iso)flavonoïden om hTAS2R14 en
hTAS2R39 te activeren bestaan uit twee (voor hTAS2R14) of drie (voor hTAS2R39)
waterstofbrugdonoren, één waterstofbrugacceptor en twee aromatische ringstructuren,
waarvan één hydrofoob dient te zijn. Een additionele waterstofbrugdonor voor hTAS2R39
liganden duidt op de mogelijke aanwezigheid van nog een complementaire acceptorplaats
in de bindingsplaats, vergeleken met hTAS2R14. Hydrofobe interactie van de aromatische
eigenschap met de bindingsplaats zou in hTAS2R14 belangrijker kunnen zijn dan in
hTAS2R39. Tezamen zou dit kunnen verklaren waarom OH-rijke verbindingen een
verschillend effect op de twee bitterreceptoren lieten zien. De combinatie van in vitro data
met verschillende in silico methoden heeft geleid tot een goed inzicht in de activatie van
hTAS2R14 en hTAS2R39 door (iso)flavonoïden en bleek een krachtig hulpmiddel te zijn
bij het voorspellen van hun potentiële bitterheid. Door het begrijpen van het “bitter motief”
kan het introduceren van bittere smaak in functional foods verrijkt met (iso)flavonoïden
mogelijk voorkomen worden.
Bitterreceptor hTAS2R39 wordt geactiveerd door veel verschillende klassen van bittere
verbindingen, waaronder ook (iso)flavonoïden. Desalniettemin zijn er enkele flavanonen
bekend die bittere smaak sensorisch maskeren, en niet alle in hoofdstuk 3 genoemde
flavanonen activeerden hTAS2R39. Om deze reden werden in hoofdstuk 4 veertien
flavanonen onderzocht op hun potentieel om de activatie van hTAS2R39 door epicatechine
gallaat (ECG), een van de belangrijkste bittere verbindingen in thee, te verminderen. Drie
verbindingen remden de activatie van hTAS2R39 door ECG: 4’-fluor-6-methoxyflavanone,
Samenvatting
168
6,3’-dimethoxyflavanone en 6-methoxyflavanone (in volgorde van afnemende potentie). De
6-methoxyflavanonen remden ook de activatie van hTAS2R14 (een andere bitterreceptor
die wordt geactiveerd door ECG), maar in mindere mate. Dosis-respons curves van ECG
met verschillende concentraties van de meest potente antagonist 4’-fluoro-6-
methoxyflavanone en wash-out experimenten wezen op omkeerbaar onoverkomelijk
antagonisme. Hetzelfde effect werd gevonden voor de structureel verschillende agonist
denatoniumbenzoaat, hetgeen een niet-competitief orthosterisch mechanisme suggereert.
Hoewel de geïdentificeerde bitterreceptorblokkeerders mogelijk niet kunnen worden
toegepast in levensmiddelen, geven ze inzicht in structurele vereisten welke tot andere,
meer geschikte blokkeerders zouden kunnen leiden.
Hoofdstuk 5 onderzoekt een andere strategie om bitterheid te verminderen, namelijk
complexatie van bittere flavonoïden met voedingseiwitten. De karakteristieken van de
binding van de bittere theeverbinding epigallocatechine gallaat (EGCG) met gezuiverde
voedingseiwitten en hun vergelijkbare food-grade preparaten, werden gerelateerd aan hun
effecten op de reductie van bitterreceptoractivatie door EGCG in vitro en hun
bittermaskeringspotentieel in vivo. Van vooral β-caseïne en van verscheidene gelatines is
bekend dat het sterke binders van EGCG zijn, dit in tegenstelling tot β-lactoglobuline. Ook
in de bitterreceptor-assay had β-caseïne het grootste effect met een maximale reductie van
hTAS2R39 activatie van ongeveer 93%. Een vergelijkbare potentie werd gevonden voor
Na-caseïnaat, welke als food-grade alternatief voor β-caseïne werd gebruikt. β-
Lactoglobuline had weinig effect op bitterreceptoractivatie, zoals verwacht op basis van de
lage bindingsaffiniteit voor EGCG. Het bittermaskerende effect van Na-caseïnaten werd in
vivo bevestigd met behulp van een getraind sensorisch panel. β-Lactoglobuline verlaagde
de bitterperceptie van EGCG ook enigszins, hetgeen niet direct gerelateerd kon worden aan
de bindingscapaciteit. De bitterreceptor-assay bleek een goed hulpmiddel te zijn om in vitro
de effectiviteit van voedingseiwitten als bittermaskeerder te onderzoeken.
Hoofdstuk 6 bediscussieert de in dit proefschrift beschreven resultaten, behandelt
kansen en beperkingen van de bitterreceptor-cel-assay, beschrijft aanvullende resultaten
aangaande onderzoek naar mogelijke antagonistische eigenschappen van (iso)flavonoïden
en vergelijkt smaakevaluatie door middel van sensorisch onderzoek, receptor-assays en
modelleren. Daarnaast worden strategieën voor de reductie van bittere smaak geëvalueerd
en worden de gevonden resultaten toegepast op sojaproducten en thee.
Het systematische onderzoek van (iso)flavonoïde-aglyconen toonde aan dat het
substitutiepatroon van (iso)flavonoïden belangrijker is voor het activeren van de
bitterreceptoren dan de basisstructuur. In het geval van bitterreceptorantagonisten bleken
zowel het substitutiepatroon als de basisstructuur cruciaal te zijn voor functionaliteit.
Aangetoond werd dat de bitterreceptor-assay niet alleen een geschikt hulpmiddel is voor de
identificatie van bitterreceptoragonisten en –antagonisten, maar ook voor het identificeren
van verminderde receptoractivatie door complexerende verbindingen. Gebaseerd op de
Samenvatting
169
resultaten in dit proefschrift wordt geconcludeerd dat complexatie van flavonoïden met
voedingseiwitten de meest veelbelovende strategie is om hun bittere smaak in thee te
verminderen. Voor isoflavonen uit soja bleek ontbittering door middel van
bitterreceptorblokkeerders een veelbelovende strategie te zijn. Als alternatief voor het
gebruik van receptorblokkeerders werden aangepaste verwerkingscondities (resulterend in
een beperkte vorming van isoflavon aglyconen) en de keuze van grondstoffen (het
gebruiken van cultivars met een lage concentratie van de verschillende vormen van
genisteïne) aanbevolen. Geconcludeerd kan worden dat de keuze van geschikte
ontbitteringsstrategieën afhankelijk is van de moleculaire structuur van de bittere
verbindingen, zoals toegelicht is aan de hand van sojaproducten en thee. Op grond hiervan
lijkt het dat elk voedingsmiddel een eigen, op maat gemaakte ontbitteringsstrategie vereist.

Samenvatting
170

Zusammenfassung
Zusammenfassung
172
Die Aufnahme von Flavonoiden und Isoflavonoiden wird häufig mit gesundheitsfördernden
Effekten assoziiert. Aus diesem Grund besteht sowohl für den Verzehr von (iso-)flavonoid-
reichen Lebensmitteln als auch für die Anreicherung von Lebensmitteln mit (Iso-)
Flavonoiden wachsendes Interesse. Einige (Iso-)Flavonoide besitzen jedoch einen bitteren
Geschmack. Daher kann ihre Zugabe (oder Anreicherung) Bitterkeit in Lebensmitteln
verursachen (oder verstärken). Die Entwicklung von Entbitterungsstrategien ist daher nötig,
um dieses Problem zu lösen.
Die Geschmackseigenschaften vieler (Iso-)Flavonoide sind unbekannt, da sie noch nie
in höheren Konzentrationen in Lebensmitteln angewandt wurden. Für andere (Iso-)
Flavonoide ergaben sensorische Tests widersprüchliche Ergebnisse bezüglich ihres bitteren
Geschmacks. Objektive Tests sind notwendig, um zu identifizieren, welche (Iso-)
Flavonoide zum bitteren Geschmack von Lebensmitteln beitragen können. Ein objektives
Instrument für Bitterkeitsstudien ist ein zellbasiertes Bitterrezeptor-Assay. Auf der
menschlichen Zunge befinden sich 25 verschiedene Bittergeschmacksrezeptoren
(hTAS2Rs). Jeder dieser Rezeptoren wurde individuell in Zellkulturen (HEK 293)
eingebracht. Mit diesen Bitterrezeptor enthaltenden Zellen kann die „intrinsische Bitterkeit“
eines Stoffes in vitro untersucht werden. Intrinsische Bitterkeit ist ein Maß für die Fähigkeit
eines Stoffes, Bitterrezeptoren zu aktivieren, unabhängig von anderen sensorischen
Wahrnehmungen und von Wechselwirkungen mit Speicheleiweißen und der
Mundschleimhaut. Das Ziel der vorliegenden Arbeit war es, die intrinsische Bitterkeit einer
Vielzahl von (Iso-)Flavonoiden zu untersuchen und Strukturvoraussetzungen für die
Aktivierung von Bitterrezeptoren durch (Iso-)Flavonoide zu erforschen. Anschließend
wurden verschiedene Entbitterungsstrategien mit Hilfe des Bitterrezeptor-Assays getestet.
Im ersten Kapitel wird eine Übersicht über Flavonoide und Isoflavonoide bezüglich
ihrer Strukturklassifizierung, ihrer sensorischen Eigenschaften und ihres Vorkommens in
Lebensmitteln gegeben. Außerdem werden Geschmackswahrnehmung und die
Wirkungsweise von Bitterrezeptoren erklärt. Sowohl der Mechanismus von Bitterrezeptor-
Aktivierung in vitro als auch Strategien zur Verminderung von Bitterrezeptor-Aktivierung
und Bittergeschmack im Allgemeinen werden beschrieben. Es wird ein aktueller Überblick
über alle 25 Bitterrezeptoren in Bezug auf bekannte Agonisten und Antagonisten gegeben.
Das Ziel der im zweiten Kapitel beschriebenen Studie war die Identifizierung der
Bitterrezeptoren, die den bitteren Geschmack des Soja-Isoflavons Genistein erkennen. Das
Screening aller 25 menschlichen Bitterrezeptoren ergab, dass Genistein einen Agonisten für
hTAS2R14 und hTAS2R39 darstellt. Genistein-Wahrnehmungsschwellenwerte lagen bei 4
und 8 µM für hTAS2R14 und hTAS2R39. Die jeweiligen EC50-Werte waren 29 und 49
µM. Neben Genistein wurden außerdem Isoflavonoide mit einer genistein-ähnlichen
Struktur untersucht. Obwohl die zwei Rezeptoren nicht eng verwandt sind, konnten
ähnliche Resultate für hTAS2R14 und hTAS2R39 für die meisten Isoflavonoid-Aglykone
erzielt werden. Für hTAS2R39 konnten vier von fünf glykosylierten Isoflavonen (Glycitin,
Zusammenfassung
173
Genistin, Acetyl-Genistin, Malonyl-Genistin) als Agonisten identifiziert werden,
wohingegen die Aktivierung von hTAS2R14 durch Glykosylierung von Isoflavonen
verhindert zu werden schien. Eine dreifache Hydroxylierung des A- und B-Rings eines
Isoflavonoids schien für eine Rezeptor-Aktivierung günstiger zu sein als eine geringere
Hydroxylierung. Die Konzentration des dreifach-hydroxylierten Genistein liegt in vielen
soja-basierten Lebensmitteln über dem in dieser Studie bestimmten Grenzwert. Die
Konzentrationen anderer Soja-Isoflavone liegen dicht bei oder unter ihren
Wahrnehmungsgrenzwerten. Trotz seiner niedrigen Konzentration könnte Genistein daher
einer der Hauptverursacher des Bittergeschmacks von Soja-Produkten sein. Da auch die
bioaktiven Isoflavonoiden Equol und Coumestrol beide Rezeptoren aktivierten, sollte vor
ihrem Einsatz in Lebensmitteln ihr möglicher sensorischer Einfluss in Betracht gezogen
werden.
Im dritten Kapitel wird die intrinsische Bitterkeit, die den Einsatz von (Iso-)
Flavonoiden als bioaktive Lebensmittelinhaltsstoffe einschränken könnte, genauer
untersucht. Eine große Anzahl von (Iso-)Flavonoiden mit einander ähnelnden Strukturen
wurde bezüglich ihres Effekts auf die Bitterrezeptoren hTAS2R14 und hTAS2R39
untersucht und die strukturellen Voraussetzungen für die Aktivierung dieser Rezeptoren
wurden vorausgesagt. Insgesamt aktivierten 68 Stoffe hTAS2R14 und 70 Stoffe
hTAS2R39, wovon 58 Liganden identisch waren. Die Aktivierungsschwellenwerte lagen
bis zu drei logarithmische Einheiten auseinander, nämlich zwischen 0.12 und 500 µM.
Ligand-basierte 2D-Fingerprint- und 3D-Pharmakophor-Modelle wurden entwickelt, um
Struktur-Aktivitäts-Beziehungen bestimmen zu können. Die 2D-Modelle zeigten
hervorragende Voraussageeigenschaften für die Identifizierung von bitteren (Iso-)
Flavonoiden und unterschieden diese von inaktiven (Iso-)Flavonoiden. Mit Hilfe der 3D-
Pharmakophor-Modelle konnte für hTAS2R14- und hTAS2R39-aktivierende (Iso-)
Flavonoidmoleküle bestimmt werden, welche Elemente sie aufweisen müssen, nämlich:
entweder zwei (hTAS2R14) oder drei (hTAS2R39) Wasserstoffdonoren, einen
Wasserstoffakzeptor und zwei aromatische Ringstrukturen, wovon mindestens ein Ring
hydrophobe Eigenschaften aufweisen muss. Ein zusätzliches Wasserstoffdonor-Element für
hTAS2R39 (verglichen mit hTAS2R14) wies auf die mögliche Anwesenheit eines weiteren,
komplementären Akzeptor-Elementes im aktiven Zentrum von hTAS2R39 hin.
Hydrophobe Wechselwirkungen zwischen dem aromatischen Element und dem aktiven
Zentrum könnten für hTAS2R14 von höherer Bedeutung sein als für hTAS2R39.
Zusammengenommen können die beiden letzten Eigenschaften erklären, warum OH-reiche
Stoffe sich gegenüber diesen zwei Bitterrezeptoren anders verhalten. Die Kombination von
In-vitro-Daten und verschiedenen In-silico-Methoden erlaubten eine gute Einsicht in die
Aktivierung von hTAS2R14 und hTAS2R39 durch (Iso-)Flavonoide und stellten ein
leistungsstarkes Instrument für die Voraussage ihrer möglichen Bitterkeit dar. Durch das
Begreifen des „Bitter-Motives“ könnte das Einbringen eines bitteren Geschmacks in
funktionelle Lebensmittel durch (Iso-)Flavoinoide verhindert werden.
Zusammenfassung
174
Der Bitterrezeptor hTAS2R39 kann durch viele verschiedene Klassen von
Bitterstoffen, worunter auch (Iso-)Flavonoide fallen, aktiviert werden. Jedoch sind auch
einige Flavanone bekannt, die einen bitteren Geschmack maskieren können und nicht alle
im dritten Kapitel beschriebenen Flavanone aktivierten hTAS2R39. Aus diesem Grund
wurde im vierten Kapitel für 14 Flavonone untersucht, ob sie die Aktivierung von
hTAS2R39 durch Epicatechingallat (ECG), einem der Hauptbitterstoffe in grünem Tee,
reduzieren können. Drei der getesteten Stoffe zeigten einen hemmenden Effekt auf die
Aktivierung von hTAS2R39 durch ECG: 4’-Fluoro-6-methoxyflavanon, 6,3’-
Dimethoxyflavanon, und 6-Methoxyflavanon (in abnehmender Wirkungsstärke). Die
getesteten 6-Methoxyflavanone hemmten auch die Aktivierung von hTAS2R14 (einem
anderen Bitter-Rezeptor, der auch durch ECG aktiviert wird), jedoch in geringerem Maße.
Sowohl die bei verschiedenen Konzentrationen des wirksamsten Antagonisten 4’-Fluoro-6-
methoxyflavanon gemessenen Dosis-Wirkungs-Kurven von ECG als auch
Waschexperimente wiesen auf reversiblen unüberwindbaren Antagonismus hin. Da ein
vergleichbarer Effekt auch für den strukturell anders aufgebauten Agonisten
Denatoniumbenzoat beobachtet werden konnte, kann von einem nichtkompetitiven
orthosterischen Mechanismus ausgegangen werden. Die hier identifizierten Bitterrezeptor-
Blocker können wahrscheinlich nicht in Lebensmitteln angewandt werden. Sie tragen
jedoch zu einem besseren Verständnis von strukturellen Voraussetzungen für
Bitterrezeptor-Blocker bei und können bei der Identifizierung von für den Einsatz in
Lebensmitteln geeigneten Blockern helfen.
Im fünften Kapitel wird eine andere Strategie zur Reduzierung von Bitterkeit
untersucht: die Komplexbildung von bitteren Flavonoiden mit in Lebensmitteln
vorkommenden Eiweißen. Der bittere Teeinhaltsstoff Epigallocatechingallat (EGCG)
wurde bezüglich seiner Bindungseigenschaften zu aufgereinigten Lebensmitteleiweißen
und ihren entsprechenden Zubereitungen in Lebensmittelqualität untersucht. Diese
Bindungseigenschaften wurden sowohl zu reduzierter Bitterrezeptor-Aktivierung in vitro
als auch zu ihren Bitterkeit-Maskierungseigenschaften in vivo in Beziehung gesetzt. Im
Gegenteil zu β-Laktoglobulin sind vor allem β-Kasein und einige Gelatinearten für ihre
starke Bindungsneigung mit EGCG bekannt. Auch im Bitterrezeptor-Assay zeigte β-Kasein
die stärksten Bindungseigenschaften mit einer maximalen Abnahme der Aktivierung von
hTAS2R39 von ungefähr 93%. Eine vergleichbare Wirkung konnte für Na-Kaseinat, die
Alternative zu β-Kasein in Lebensmittelqualität, beobachtete werden. Wie bereits durch
seine niedrige Bindungsaffinität zu EGCG zu erwarten, hatte β-Laktoglobulin einen
geringen Effekt auf die Bitterrezeptor-Aktivierung. Das Bittermaskierungspotential von Na-
Kaseinat konnte in vivo durch ein sensorisch geschultes Expertenpanel bestätigt werden.
Auch β-Laktoglobulin konnte die Bitter-Wahrnehmung leicht vermindern. Dieses Ergebnis
konnte nicht direkt den Bindungskapazitätsergebnissen zugeordnet werden. Das
Bitterrezeptor-Assay konnte als hilfreiches In-vitro-Instrument für die Einschätzung der
Zusammenfassung
175
Wirkungskraft von Lebensmitteleiweißen als Komplexbildner zu
Bittermaskierungszwecken eingesetzt werden.
Im sechsten Kapitel werden sowohl die in der vorliegenden Arbeit beschriebenen
Ergebnisse als auch die Möglichkeiten und Einschränkungen des Bitterrezeptor-Zell-
Assays diskutiert. Außerdem werden weitere Testergebnisse zu möglichen antagonistischen
Eigenschaften von (Iso-)Flavonoiden präsentiert und Geschmacksbewertungen durch
sensorische Tests, Rezeptor-Assays und Modellieren verglichen. Des Weiteren werden
Strategien zur Reduzierung von Bitterkeit evaluiert und auf Soja-Produkte und Tee
angewandt.
Die systematische Untersuchung von (Iso-)Flavonoid-Aglykonen zeigte, dass ihr
Substitutionsprofil von größerer Bedeutung für die Bitter-Rezeptor-Aktivierung ist als die
Struktur ihres Molekülskeletts. Für die Funktion von Bitter-Rezeptor-Antagonisten sind
jedoch sowohl ihr Substitutionsprofil als auch die Struktur ihres Molekülskeletts essenziell.
Das Bitterrezeptor-Assay konnte als hilfreiches Instrument sowohl für die Identifizierung
von Bitterrezeptor-Agonisten und -Antagonisten als auch die Identifizierung von
reduzierter Rezeptor-Aktivierung durch Komplexbildner beschrieben werden. Basierend
auf den Ergebnissen dieser Arbeit konnte die Komplexbildung mit Lebensmitteleiweißen
als die erfolgversprechendste Strategie für die Reduzierung des bitteren Geschmacks von in
Tee vorkommenden Flavonoiden identifiziert werden. Für in Sojabohnen vorkommende
Isoflavone scheint jedoch die Entbitterung durch die Verwendung von Bitterrezeptor-
Blockern die erfolgversprechendste Strategie zu sein. Neben der Verwendung von
Rezeptor-Blockern konnten auch Anpassung von Prozessmethoden (dergestalt, dass für
eine nur geringe Bildung von Isoflavon-Aglykonen gesorgt wird) und die sorgfältige
Auswahl von Rohstoffen (z.B. Sorten mit niedrigem Genisteingehalt) zur Vermeidung
eines bitteren Geschmacks empfohlen werden. Abschließend kann festgestellt werden, dass
die Wahl der Entbitterungsstrategien von der molekularen Struktur des bitteren
Lebensmittelinhaltsstoffes abhängt. Dies wurde an Hand von soja-basierten Produkten und
Tee gezeigt. Offensichtlich ist für jedes Lebensmittelprodukt eine maßgeschneiderte
Entbitterungsstrategie nötig.

Zusammenfassung
176

Acknowledgments
Acknowledgments
178
When I came to Wageningen in 2005 as an exchange student, I never expected that I would
keep coming back to the Netherlands and eventually even stay here. But life is full of
surprises. Looking back on the last years, I would like to thank everyone who supported
me, directly or indirectly, to accomplish this thesis.
Ten eerste mijn dank aan de belangrijkste persoon voor mijn onderzoek. Jean-Paul, ik ben
heel erg blij dat jij mijn directe begeleider was. Het was heel plezierig om met jou samen te
werken en je wist me altijd als geen ander te motiveren en te ondersteunen en mijn teksten
te verbeteren. Gelukkig wist je me ook soms in mijn data-verzamel-enthousiasme te
remmen, jouw vergelijking van mij met een mol zal me altijd bijblijven. Fijn dat de
Wageningen-Vlaardingen-afstand nooit een probleem was en dat we altijd zo goed contact
hebben gehad, voor goed nieuws (bijzonder leuk om ook goed nieuws te delen!) en voor
slecht nieuws. Jouw betrokkenheid en enthousiasme hebben me heel veel gegeven. Bedankt
dat je altijd een luisterend oor had voor alle dingen waar ik tegenaan liep, op het werk en
ook privé. Ik heb me in onze gezellige fytonutriënten-groep altijd heel erg op mijn gemak
gevoeld.
Robin, bedankt voor jouw super-begeleiding bij Unilever en voor je geduld bij je pogingen
om wat biologisch begrip in mijn chemicus hoofd te krijgen. Het is jou gelukt ☺ Bedankt
dat je er altijd was voor vragen en altijd tijd voor mij hebt gemaakt. Het was echt heel fijn
om met jou te werken. Bedankt ook voor het doorzetten van de cellen als ik weer eens een
lang weekend weg was en vooral voor het meten van platen helemaal in het eind!
Mijn promotoren Harry en Gerrit, bedankt voor jullie wetenschappelijke input, die zeker de
kwaliteit van mijn publicaties verhoogd heeft en voor de tijd die jullie voor correcties
hebben genomen. Harry, je bent een baas bent die goed voor zijn mensen zorgt. Je weet
altijd voor financiële middelen te zorgen en leuke sociale activiteiten mogelijk te maken,
wat het werken in onze leerstoelgroep zo speciaal en aangenaam maakt.
Dear Phytos Rudy, Tomas, Maxime, Carlos, Aisyah, Yannick, Milou, Annewieke, Ya,
Carla and Anne, thanks for the great social time in our smurf village, which feels like a
little family. Making styrofoam molecules for Jean-Paul, photo shooting at Jean-Paul’s
place for Maxime’s surprise calendar, dinners in Wageningen, Renkum, Vlaardingen and
Alphen,…. All this and many more great moments will stay in my memory and continue to
make me smile.
Stéphanie, Connie, Yannick and Carlos, it was a great experience to organize the PhD trip
to Asia together. My old office mates of room 503 Carlos, Maxime, Tomas, Connie, Claire,
and shortly Matthias, Emma and Anne. It was great sharing a room with you. I will never
forget the hilarious fun we had with the “feestbeesten” (sorry Claire for annoying you!) and
the fun you had wrapping my computer screen and keyboard in air bubble foil to surprise
me every time I came back from Vlaardingen. If I would have kept all the foil over the
years, we could have managed the whole moving to the Axis with it… ;-) Dear new 1.05
Acknowledgments
179
office mates Surrender, Uttara and Kok-Phen, thanks for bearing grumpy Wibke in the first
weeks in our new building, I hope I made up for it with spreading happiness after I handed
in my thesis ;-)
Tomas and Maxime, you were my closest company at FCH from the beginning until the
end. Thank you for being my paranymphs now. Tomas, bedankt voor je gezelligheid en je
hulp met ALLES, het invullen van de belastingaangifte, andere formulieren (volgens mij
ben jij de enige die weet waar al de afkortingen op de salarisstrook voor staan),
verzekeringen, bankzaken, Nederlandse spelling, feiten opzoeken, etc. etc.! Maxime,
although “street painting” had a bitter note, I still have to smile when I think of our early-
PhD adventure. I enjoyed our experiments at Unilever and writing our article together.
Thank you for providing furniture storage space (for a bit longer than initially thought..)
and for being such a good colleague, neighbor and friend.
Meine liebe alte FCH-Berlin-Brandenburg-Gang Anita, Anne, Anja und Stefan, es war
super mit euch hier. Schade, dass ich die letzte im Bunde war und euch alle hab gehen
sehen, aber ich hoffe wir treffen uns auch weiterhin im traditionellen Dezember-
Geburtstags-Weihnachts-Marathon in Berlin. Anjalein, viele unser NL-Abenteur haben wir
gemeinsam erlebt und du bist in kurzer Zeit eine echt gute Freundin geworden. Wie toll
dass wir jetzt mit Den Haag – Gouda wieder beieinander in der Nähe wohnen.
Marijn, Frederik and Roy, I have not mentioned you in any other context yet, but I don’t
want to leave you unmentioned, as we spent so many lunch breaks together, which cheered
me up for the second part of the day. Jolanda, je bent echt een super-secretaresse! Bedankt
voor je geduld om dingen uit te leggen en dat je altijd alles zo snel en zo goed afhandelt. En
natuurlijk voor de gezellige praatjes tussendoor! En dank aan alle analisten voor het
bestellen van goederen en jullie hulp in het gebruiken van de apparatuur. All other
colleagues at Food Chemistry, thank you for the good cooperation, the nice social activities
and the pleasant atmosphere.
Of course I don’t want to forget my five students Merel, Elise, Marianne, Lisanne and Na. I
enjoyed supervising you. Thanks for your contributions and enthusiasm for our research.
Marianne, ik ben bijzonder trots op wat er allemaal uit jouw project is gekomen.
Beste MAoH collega’s, Robin, Mustafa, Erik, Alex, Paul, Wim, Kerstin, Jan, Leo,
Monique, Pieter, Diny, Linda, Nathalie, Varsha, Guus, Erwin, Martin en Jolanda, bedankt
voor het plezierige samenwerken, de aangename sfeer en de gezelligheid. Ik heb dankzij
jullie allemaal echt genoten van mijn tijd bij Unilever. Leo, het was leuk om met jou te
modeleren, en soms een hele opluchting (ik denk voor ons allebei) om een beetje in
chemische termen te kunnen kletsen in deze biologische groep ;-) En ja, ik weet nog steeds
alle nummers uit mijn hoofd… Guus, bedankt voor jouw advies in alle farmacologische
vragen. Erwin und Kerstin, danke für eure Antworten zu Rezeptor-Fragen und natürlich
euren Beitrag daran, dass ich Deutsch nicht verlernt habe. Jolanda, bedankt voor je hulp
Acknowledgments
180
met alles organisatorische en de gezelligheid waarvoor jij altijd wist te zorgen! De collega’s
van andere afdelingen, Michiel, Ursula, Teun, Max, en de leden van het sensorische panel,
bedankt voor jullie bijdrage aan mijn onderzoek.
Tina, auch meinen Dank an dich für das Anfertigen des Rezeptor-Bildes auf dem
Umschlag. Toll dass wir noch einen Artikel zusammen schreiben! Bedankt Anja en Tomas
voor het zorgen voor de vertalingen, en Liesbeth, Woest en Thea voor de laatste correcties.
Beste nieuwe collega’s bij NIZO food research, bedankt dat jullie mij zo gastvrij hebben
ontvangen, zodat ik me snel op mijn gemak ben gaan voelen, en voor het faciliteren van het
afronden van de allerlaatste lootjes voor dit proefschrift. Ich möchte auch Thomas Speck
und Herrn Ott danken, dir /Ihnen ist es zu verdanken dass ich mich für Chemie begeistert
habe! Thomas, es ist lange her, aber ich profitiere immer noch von unseren vielen
Sonntagen.
Beste Wageningen Wallies, de tijd met jullie op de Walstraat was GEWELDIG! Nadia,
Meike, Maartje, Femke, Daniël, Felicia, Linda, Joep, Klaas, Carlette, Maarten Lisanne en
Rinske, onder andere door jullie ben ik me helemaal thuis gaan voelen in Nederland. Jullie
waren de beste inburgeringscursus die ik kon krijgen. En jullie hebben me uit elke PhD-
frustratie weer naar boven geholpen en me altijd eraan herinnerd om ook van het leven te
genieten. Dear old Vlaardingen Voorstraat housemates Annabel, Juan, Maria, it was nice to
share this beautiful house with you. Anne, bedankt dat ik in jouw super-huis mocht wonen.
Liebe “alte” Berliner Freunde zu Hause und wohin es euch alle jetzt so verstreut hat. Es ist
nicht einfach über so viele Jahre auf so eine Entfernung Kontakt zu halten. Ich bin froh,
dass es uns meinstens doch irgendwie gelungen ist. Vielen Dank euch allen für eure
Freundschaft und Unterstützung, die meine Energiespeicher immer wieder füllen.
Liebe Frauke, liebe Mama, lieber Papa. Vielen Dank für eure Unterstützung und euer
Verständnis dafür dass ich so wenig Zeit habe. Mama und Papa, danke für was ihr mir alles
ermöglicht habt. Euer Glauben in mein Können und eure Freude über jeden kleinen Erfolg
haben mich vorwärts gebracht. Vielen Dank auch für eure Deutsch-Expertise für meine
Zusammenfassung. Fraukilein, sister twister, trotz unserer unterschiedlichen
Veranlagungen Musik – Chemie bist du mir so ähnlich wie sonst niemand. Du bist die beste
Schwester der Welt.
Lieve schoonfamilie Thea, Wilbert, Jan, Carla, Liesbeth, Marcel, Tijmen, Brenda, Rinske,
Marieke, Walter, Bas en Laura. Bedankt dat jullie mij zo warm in jullie familie hebben
opgenomen! Lieve Joost. Jij geeft me de rust die ik vaak zelf niet vind en het geloof erin dat
het allemaal meevalt en goed komt. Jij bent een oneindige bron van inspiratie en geluk,
mijn vitamine J. Bedankt voor je steun en je geduld, en het begrip ervoor dat ik zo veel
avonden en weekenden niet met jou maar met mijn proefschrift heb moeten doorbrengen.
Ik heb heel veel zin in de toekomst met jou en binnenkort met z’n drieën.

About the author
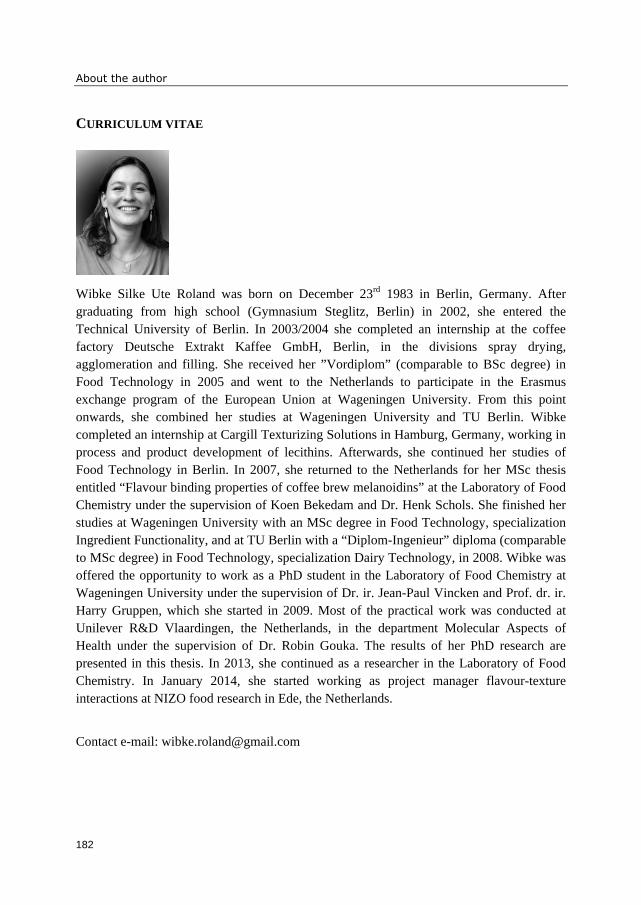
About the author
182
CURRICULUM VITAE
Wibke Silke Ute Roland was born on December 23rd 1983 in Berlin, Germany. After
graduating from high school (Gymnasium Steglitz, Berlin) in 2002, she entered the
Technical University of Berlin. In 2003/2004 she completed an internship at the coffee
factory Deutsche Extrakt Kaffee GmbH, Berlin, in the divisions spray drying,
agglomeration and filling. She received her ”Vordiplom” (comparable to BSc degree) in
Food Technology in 2005 and went to the Netherlands to participate in the Erasmus
exchange program of the European Union at Wageningen University. From this point
onwards, she combined her studies at Wageningen University and TU Berlin. Wibke
completed an internship at Cargill Texturizing Solutions in Hamburg, Germany, working in
process and product development of lecithins. Afterwards, she continued her studies of
Food Technology in Berlin. In 2007, she returned to the Netherlands for her MSc thesis
entitled “Flavour binding properties of coffee brew melanoidins” at the Laboratory of Food
Chemistry under the supervision of Koen Bekedam and Dr. Henk Schols. She finished her
studies at Wageningen University with an MSc degree in Food Technology, specialization
Ingredient Functionality, and at TU Berlin with a “Diplom-Ingenieur” diploma (comparable
to MSc degree) in Food Technology, specialization Dairy Technology, in 2008. Wibke was
offered the opportunity to work as a PhD student in the Laboratory of Food Chemistry at
Wageningen University under the supervision of Dr. ir. Jean-Paul Vincken and Prof. dr. ir.
Harry Gruppen, which she started in 2009. Most of the practical work was conducted at
Unilever R&D Vlaardingen, the Netherlands, in the department Molecular Aspects of
Health under the supervision of Dr. Robin Gouka. The results of her PhD research are
presented in this thesis. In 2013, she continued as a researcher in the Laboratory of Food
Chemistry. In January 2014, she started working as project manager flavour-texture
interactions at NIZO food research in Ede, the Netherlands.
Contact e-mail: [email protected]
About the author
183
LIST OF PUBLICATIONS
Roland, W.S.U.; Vincken, J.-P.; Gouka, R.J.; van Buren, L.; Gruppen, H.; Smit, G. Soy
isoflavones and other isoflavonoids activate the human bitter taste receptors hTAS2R14 and
hTAS2R39. J Agric Food Chem. 2011, 59 (21):11764-11771.
Bohin, M.C.; Roland, W.S.U.; Gruppen, H.; Gouka, R.J.; van der Hijden, H.T.W.M.;
Dekker, P.; Smit, G.; Vincken, J.-P. Evaluation of the bitter-masking potential of food
proteins for EGCG by a cell-based human bitter taste receptor assay and binding studies. J
Agric Food Chem. 2013, 61 (42):10010-10017.
Roland, W.S.U.; van Buren, L.; Gruppen, H.; Driesse, M.; Gouka, R.J.; Smit, G.; Vincken,
J.-P. Bitter taste receptor activation by flavonoids and isoflavonoids: Modeled structural
requirements for activation of hTAS2R14 and hTAS2R39. J Agric Food Chem. 2013, 61
(44):10454-10466.
Roland, W.S.U.; Gouka, R.J.; Gruppen, H.; Driesse, M.; van Buren, L.; Smit, G.; Vincken,
J.-P. 6-Methoxyflavanones as bitter taste receptor blockers for hTAS2R39. - accepted for
publication in PLOS ONE
About the author
184
OVERVIEW OF COMPLETED TRAINING ACTIVITIES
Discipline specific activities
Courses
• Advanced Food Analysis† (VLAG), Wageningen (The Netherlands), 2010
• Gut-Brain Communications (ABS), Kuopio (Finland), 2011
• International Chemical Design and Discovery course, Nijmegen (The
Netherlands), 2012
Conferences and meetings
• 8th Pangborn Symposium of Sensory Science, Florence (Italy), 2009
• Mini-Symposium Sensory Science, Vlaardingen (The Netherlands), 2010
• Mini-Symposium Food Fortification, Vlaardingen (The Netherlands), 2010
• GPCR symposium‡, Vlaardingen (The Netherlands), 2011
• Lecture Sensory Engineering, Vlaardingen (The Netherlands), 2011
• Process-Net Annual Meeting, Vlaardingen (The Netherlands), 2011
• 2nd International Conference on Food Oral Processing†‡, Beaune (France), 2012
• Mini-Symposium “The Chemistry between Science and Industry”, Vlaardingen
(The Netherlands), 2013
General courses
• PhD introduction week (VLAG), Maastricht (The Netherlands), 2009
• Speed reading (KLV), Wageningen (The Netherlands), 2010
• Philosophy and Ethics of Food Science and Technology (VLAG), Wageningen
(The Netherlands), 2010
• Techniques for writing and presenting a scientific paper (WGS), Wageningen (The
Netherlands), 2011
• Teaching and supervising thesis students (WU), Wageningen (The Netherlands),
2011
• Career orientation (WGS), Wageningen (The Netherlands), 2012
• Project and time management, (WGS), Wageningen (The Netherlands), 2013
Optionals
• FCH study trip to Ghent, Belgium, WU (FCH), 2009
• PhD trip FCH Switzerland / Italy†‡, WU (FCH), 2010
• PhD trip FCH Singapore / Malaysia†‡, WU (FCH), 2012
• Organisation PhD trip FCH Singapore / Malaysia, WU (FCH), 2011-2012
About the author
185
• BSc / MSc thesis students presentations and colloquia, WU (FCH), 2009-2013
• PhD presentations, WU (FCH), 2009-2013
• Phytonutrient meetings, WU (FCH), 2009-2013
• Molecular aspects of health meetings, URDV, 2010-2012
• Nutrition and health meetings, URDV, 2010-2012
• Science update presentations, URDV, 2010-2012
• PhD research proposal
† Poster presentation; ‡ Oral presentation
Abbreviations used:
ABS: Applied Bioscience Graduate School
FCH: Laboratory of Food Chemistry
KLV: Koninklijke Landbouwkundige Vereniging Wageningen Alumni Network
URDV: Unilever R&D Vlaardingen
VLAG: Graduate School for Nutrition, Food Technology, Agrobiotechnology and Health Science
WGS: Wageningen Graduate Schools
WU: Wageningen University

About the author
186

187
The work described in this thesis was performed at Unilever R&D Vlaardingen, The
Netherlands, and the Laboratory of Food Chemistry, Wageningen University, The
Netherlands. The research was financially supported by the Food and Nutrition Delta of the
Ministry of Economic Affairs, The Netherlands (FND 08019).
Financial support from Wageningen University for printing this thesis is gratefully
acknowledged.

188
This thesis was printed by Gildeprint Drukkerijen, Enschede, The Netherlands
Edition: 380 copies
Wibke S.U. Roland, 2014


