1. INTRODUCTIONIt is well known that differences in mean luminance(first-order statistics) can be used by humans to segregateimage regions. To distinguish this type of performancefrom segregation based on small-scale luminancevariation,1 line patterns with equal total line length (andthus equal mean luminance) have been used frequentlyas texture elements. A difference in orientation of linesis a strong cue for segregation, but in this paper we do notconsider differences in orientation. We use only textureswith randomly oriented micropatterns such that there isno spatially average difference in orientation. There arevarious other ways to arrange lines with the same totalline length to compose different patterns: The lines canbe bent or broken, or line segments of equal length can beshifted to have different relative positions within micro-patterns. Bending or breaking changes the curvature ofa line and results in distinct micropattern features suchas line ends, corners, T junctions, and crossings (see Fig.1).
Since a difference in such features has often been foundto create distinguishable textures, terminators, corners,crossings, etc., have been considered to be textons2 in thesense that texture segregation can be based on the differ-ences in the spatial density of such features. We shall re-fer to this hypothesis as feature-density segregation(FDS). The texton concept has in turn been criticized fortwo reasons: (i) A computational theory of visual pro-cessing that would render textons such as terminatorsand crossings was not available. (According to Bergenand Adelson, ‘‘One major difficulty with this approach isthat it is based on a verbal description of image featuresrather than on the raw intensity values in the image it-self. This makes it difficult to test under more generalconditions. In order to apply this analysis to a more gen-eral class of images, it would first be necessary to con-struct operators that extract the feature descriptions be-ing invoked—a task that has yet to be accomplished.’’ p.364)3; (ii) size- and orientation-tuned linear filters (fol-
lowed by some standard nonlinearities) have been shownto predict perceptual segregation for a fairly large class oftexture pairs. Early approaches included a 1982 modelby Wermser and Liedtke4 that used size- and orientation-tuned filters and a model by Coggins and Jain5 that usedonly orientation-tuned filters. Over the years a numberof investigators have suggested that texture segregationcould be based on differences in the outputs of size- andorientation-tuned filters.3,6–15 Caelli’s models incorpo-rate filling in procedures followed by regionclassification.16–18 The most comprehensive but noncom-putational criticism of the texton concept, in particular ofits abstract notions such as terminators and crossings,was formulated by Nothdurft.19 For reviews on theoriesof visual texture perception see Julesz20 and Bergen.21
With respect to texton criticism (i), the situation hasimproved. Nonlinear end-stopped neurons that detectcurved image features (corners, line ends, curved lines,and edges) have attracted increasing attention in recentyears. Mechanisms possibly underlying the activity ofsuch neurons have been investigated by a fewauthors.7,22–29 An attempt to identify a general theoryfor end stopping and related phenomena was made byZetzsche and Barth.26,27 Their approach is based on dif-ferential geometry and filter theory and revolves aroundthe concept of intrinsic dimensionality. Accordingly, im-age regions can be classified into three basic categories:intrinsic zero-dimensional regions, where image intensityis constant; intrinsic one-dimensional (i1D) regions,where image intensity is constant along one direction(straight patterns); and i2D regions, where intensity var-ies along all directions, thus leading to curved patternssuch as corners, line ends, and curved boundaries. Forthe latter image regions, the Gaussian curvature of theassociated surface is different from zero (the term intrin-sic emphasizes the fact that the Gaussian curvature is anintrinsic property of surfaces). An i2D operator respondsonly to i2D features. It is important to note in this con-text that the emergence of i2D operators in a system that
1998 Optical Society of America
1724 J. Opt. Soc. Am. A/Vol. 15, No. 7 /July 1998 Barth et al.
processes images taken from our natural environmentcan be deduced from general principles of informationprocessing30 and that images can be reconstructed ap-proximately from i2D-features.31 The initial approachhas been extended so that we can use the Volterra–Wiener theory of nonlinear systems.32–34
Regarding texton criticism (ii), we should first recallthat linear filters alone cannot predict texturediscrimination.12,14,16,21,35 Naıvely, one could think that,even with standard nonlinearities, simple filters cannotwork for the textures considered here, because they areline or edge detectors, and line length is kept constant.But this is wrong for (at least) two reasons: (a) The non-linearities can change the selectivity of the filters in away that they become selective for i2D features, and (b) atlow resolution, spatial filters can exploit differences in thesize of the micropatterns. Figure 2 illustrates that bend-ing, breaking, and shifting of lines with equal length notonly leads to differences in i2D features but can also re-sult in differences in the size of the micropatterns. Thus,for a quite large class of patterns, one cannot, at firstglance, distinguish whether texture segregation is basedon differences in the density of i2D features as opposed todifferences in size. We shall refer to the latter hypoth-esis as blob-size segregation (BSS as opposed to FDS).As a reply to Bergen and Adelson,3 Julesz and Krose1
showed that perceptual segregation of the L and the crosstextures is still possible even if the low levels of the La-placian pyramid are filtered out. This finding providessome evidence against BSS but cannot rule it out, becausein high-pass-filtered images low frequencies can be rein-troduced by some early nonlinearities. It would there-fore be possible for a model that operates solely on blobsizes to predict the segregation of the high-pass-filteredimages.
After exploring further theoretical issues related to thelimitations of standard texture models (Section 2), we de-velop an example for which a BSS explanation seems un-convincing (Section 3). The theoretical arguments are
Fig. 1. Micropatterns with the same total line length. Bendingleads to corners, breaking leads to line ends, and different rela-tive positions of line segments can yield different types of junc-tions.
Fig. 2. Different relative positions of line segments can lead todifferences in size. The two disks drawn the same size for allmicropatterns cover the micropatterns to different extents.
supported by a brief experiment (Section 4). We discussour new approach (Section 5) and venture some generalconclusions (Section 6).
2. LINEAR–NONLINEAR–LINEAR MODELSIn this section we explain how we make model predictionsand discuss from a more theoretical perspective some con-ceptual issues raised in Section 1. Our scope is not tofind a specific model of texture perception but to investi-gate what general principles of visual information pro-cessing might be involved in texture perception.
A. The Laplacian and an Isotropic IntrinsicTwo-Dimensional OperatorWe want to compare predictions of models based on linearfilters followed by standard nonlinearities with those ofmodels based on i2D operators. For simplicity we choseone exemplary model from each of these two classes. Thegeneral distinguishing criterion between the classeswould be whether the models make explicit use of i2D op-erators. As noted above, orientation selectivity is ex-cluded from this analysis, and so both operators are iso-tropic. The first class is represented by the Laplacianpyramid, followed by rectification or squaring of the out-put signal. The second class is represented by theclipped-eigenvalues (CEV) operator. To obtain the CEVoperator the determinant of the Hessian of the image-intensity function l(x, y) can be rewritten as27,31
G 514 ~lxx 1 lyy!2 2
14 ~lxx 2 lyy!2 2 lxy
2 5 ~¹2l !2 2 e2,
(1)where indices denote partial derivatives (lxx 5 ]2l/]x).The Laplacian ¹2l and eccentricity e 5 @
14 (lxx 2 lyy)2
1 lxy2#1/2 5
12 @(lxx 2 lyy)2 1 (lx8x8 2 ly8y8)
2#1/2 [coordi-nates (x8, y8) are rotated by 45° relative to (x, y)] deter-mine the eigenvalues of the Hessian:
d1 5 ¹2l 1 e; d2 5 ¹2l 2 e. (2)
The CEV operator is defined as
CEV5d212d1
2, (3)
where the clipping operation d6 takes the positive and thenegative values, respectively (half-wave rectification).The multiscale version of the CEV is obtained by blurringthe intensity l(x, y) with a Gaussian kernel. The differ-ential operations have been implemented by using thefast Fourier transform and by filtering with the Fouriertransforms of the blurred derivatives. The midfrequen-cies of these bandpass filters are specified on the finalplots. The CEV operator yields an output that is identi-cal to that of the Laplacian when e 5 0. This is the casefor isotropic features, where the oriented-filter outputslxx , lyy , lx8x8 , ly8y8 are equal. Depending on the scale,these features can be dots or blobs. When blobs becomeelongated, the response of the CEV operator is reducedmore than the response of the Laplacian and equals zerofor features that are i1D relative to the chosen scale.27,31
Therefore these two representations are well suited to il-lustrate the principal differences between models that doand do not involve i2D operators. Both representationsare computed on N different scales. We describe the
Barth et al. Vol. 15, No. 7 /July 1998 /J. Opt. Soc. Am. A 1725
multiscale Laplacian as ¹2l(x, y, i), the image l(x, y)being filtered at scale i. The sampling of the scales islogarithmic, and coarse scales are subsampled in (x, y) toobtain a pyramid. For each texture and each scale theseresults are spatially averaged to obtain N mean valuesRi 5 (x,yC@¹2l(x, y, i)# for each texture. We examinedboth half-wave rectification and squaring as the staticnonlinearity C[•]. Finally, the absolute values of the dif-ferences between the mean values, i.e., Di 5 uRiut1
2 Riut2u (for different textures t1 , t2), are plotted as a
function of scale. Comparable predictions for the CEVoperator are obtained and presented similarly.
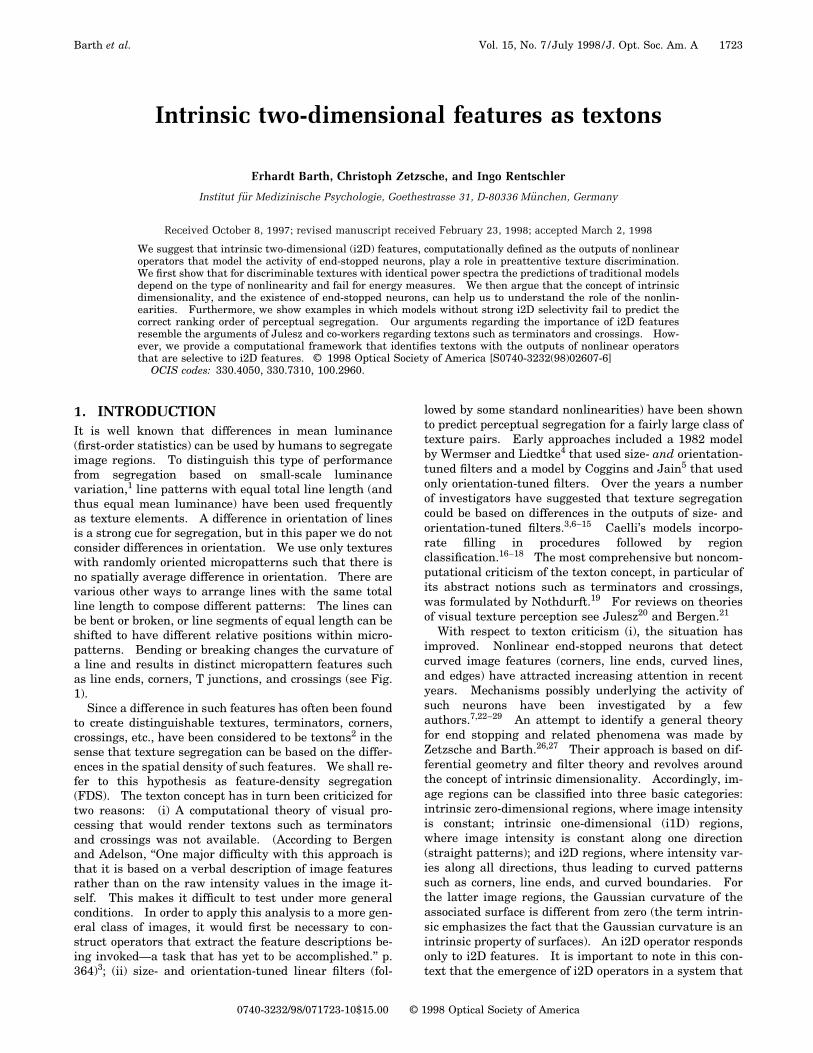
We shall now consider the textures presented in Fig. 3.The arrow (Ta) textures and the triangle (Tt) textures inFig. 3(a) have been chosen as a classical example of aniso-second-order texture pair that segregates well. The Ztexture (Tz) in Fig. 3(b) segregates less from the Ta tex-ture and is introduced for comparison. The textures inFig. 3(c) differ only in line length (see fig. caption). Themotivation for Fig. 3(c) is presented below (Subsection 2.Band Section 4). A texture pair is presented with threequadrants of one and one quadrant of the other to illus-trate the experimental procedure used in Section 4.
Fig. 3. Arrow–Z (Ta –Tz) and arrow–triangle (Ta –Tt) texturepairs. Patterns are computer-generated raster images (10243 1024 pixels) with lines 70 pixels long (with one exception) and2 pixels wide, randomly rotated by use of an affine transformwith B-splines interpolation. (c), Lines in the upper right quad-rant are 66-pixels long.
The filtering results shown in Fig. 4 lead to the simu-lation results shown in Fig. 5, which will be further dis-cussed in Subsection 2.B and Section 3 and are shownhere to illustrate the procedure. The values Di are plot-ted as a function of scale and in percent of the activity cor-responding to an optimally sized checkerboard patternwith the same contrast as the textures. Thus, under theassumption that there exist neurons that spatially aver-age the activity of the multiscale representation, we ex-
Fig. 4. Representations of single micropatterns (arrow and tri-angle) at logarithmically sampled scales from 0.5 to 8 c/micropattern (Laplacian top rows, CEV bottom rows). Note thatthe CEV operator responds only to i2D features and that it re-sponds differently to the tip and the line ends of the arrow com-pared with the corners of the triangle. Also note that Laplacianand CEV outputs become more similar at coarse scales.
1726 J. Opt. Soc. Am. A/Vol. 15, No. 7 /July 1998 Barth et al.
press all further results in percent of the dynamic rangeof such a unit. A value of 0.5 can be regarded as signifi-cant if the noise level is below 0.5%, but we do not makeany specific assumption about the noise level, since weare interested in a qualitative analysis. On the abscissaof the plots, c/micro pattern indexes the number of cyclesper line length. In those cases in which line length wasvaried, the unit refers to the spatial period defined by thelongest line. We shall assess different representations ormodels by their ability to predict the correct segregationranking order of different texture pairs. Nevertheless,the absolute values that we plot are meaningful in thesense explained above. We consider a model’s incorrectranking order of discriminability to be a serious short-coming and to indicate that texture discriminability is notdetermined by features at those scales.
B. Limitations of Energy MeasuresThe textures considered here consist of identical lines(with some noted exceptions that are due to line-lengthvariations) with identical power spectra, differing in ori-entation. Since it is unlikely that the segregation of dif-ferent textures is due to random differences in the orien-tations of the micropatterns, it must be due to differencesin the configurations of lines within micropatterns. In
terms of power spectra, such configuration differences arenot evident unless there are differences in the orienta-tions of the individual lines (Fig. 6). Thus micropatternswith (thin) lines at equal relative orientations (e.g., cross,L, and T, and also Ta, Tt in Fig. 3) cannot be segregatedby mechanisms based exclusively on the power spectra ofthe textures. In other words, the power spectra of thetextures cannot differ if the power spectra of the micro-patterns are identical (and the distributions of micropat-tern orientations are equal).
Why bother with analysis of the power spectra if linearfilters followed by a static nonlinearity can discriminatethese textures12 (see top left of Fig. 5 at 0.5 c/micropattern)? Such predictions raise a conceptual prob-lem, since rectification plus spatial average is often un-derstood as an approximate energy measure. Given thefact that the power spectra of the two textures are verysimilar (the thinner the lines, the more similar they are),any multiscale energy measure would only sample thesetwo similar functions and thus should not differ. Thisassertion can be tested with an exact energy measure, i.e.,by squaring the output of the bandpass filters (instead ofusing rectification). In this case the spectral energy ofthe filters and the energy computed by spatial averageare identical, owing to Parseval’s theorem.36 If f(x, y) is
Fig. 5. Predicted segregation, for the texture pairs shown in Fig. 3, for four different operators. The predictions for the different tex-ture pairs in Fig. 3 are plotted with thick lines and diamonds [Fig. 3(a), textures with equal power spectra which segregate well] dashedlines and stars [Fig. 3(b), textures that segregate less] and thin lines and squares [Fig. 3(c), a texture pair that does not segregate]. Thedifferences that are due to the type of nonlinearity are discussed in Subsection 2.B. Table 2 (below) gives a qualitative interpretationof the predictions compared with the data presented in Section 4.
Barth et al. Vol. 15, No. 7 /July 1998 /J. Opt. Soc. Am. A 1727
a convolution kernel and t1(x, y), t2(x, y) are two differ-ent images with identical power spectra uT1(u, v)u2
5 uT2(u, v)u2, we can write
ExE
y@ f~x, y ! ^ t1~x, y !#2dxdy
5 EuE
vuF~u, v ! 3 T1~u, v !u2dudv
5 EuE
vuF~u, v !u2 3 uT1~u, v !u2dudv
5 EuE
vuF~u, v !u2 3 uT2~u, v !u2dudv
5 EuE
vuF~u, v ! 3 T2~u, v !u2dudv
5 ExE
y@ f~x, y ! ^ t2~x, y !#2dxdy, (4)
where capital letters denote Fourier transforms, ucu de-notes the magnitude of the complex number c, and ^ de-notes convolution. It is straightforward to extend the ar-gument to local energy measures that are based on thesum of squared even and odd filter outputs. Thereforemodels based on spatial averages of local energy mea-sures cannot discriminate texture pairs with identicalpower spectra. Accordingly, the results in Fig. 5 for thesquared Laplacian predict that the iso-second-order tex-ture pair Ta, Tt cannot be well segmented; however, per-ceptual discrimination is in fact very good. Furthermore,the results show that the predictions of the Laplacian atfine scales can be easily affected by line-length variations.
The CEV operator behaves differently, as shown on thebottom row of Fig. 5. Note that the predictions based onsquared CEV match the perceptual ranking order at spa-tial scales finer than 2 c/micropattern, consistent with theassumption of FDS.
C. Iso-Curvature Edge DetectorsIn this section we briefly discuss the role of nonlinearitiesin the context of i1D versus i2D selectivity. In Fig. 7, re-sponses of linear filters, followed by four different nonlin-earities, show that the selectivity of the linear filters tothe curvature of the line or edge depends strongly on thetype of nonlinearity. In other words, the differences inresponse to lines versus line ends or straight edges versus
Fig. 6. Power spectra for the arrow-, triangle-, and Z-textures(see text).
corners depend on the nonlinearity. Note that for thetextures considered here, isocurvature line or edge detec-tors (an edge detector that gives the same response to anedge, independent of the curvature of that edge, e.g., thelocal energy operator shown in the far-right column) can-not predict segregation, because the different micropat-terns have equal line lengths. It follows that to explaintexture segregation (of the equal-line-length micropat-terns considered here) with a model based on linear fil-ters, one must look for nonlinearities that have differentselectivities for the i1D and i2D features of the micropat-terns. We believe that such problems should not besolved by some trial-and-error search for the best nonlin-earity but be treated within a theory of i2D operators.We found that some authors, without having special in-terests in i1D and i2D problems and end stopping, wereactually defining i2D operators to model texture data.For example, Sutter et al.10,14 proposed a complex-cellmodel that turns out to be an i2D operator modeling a hy-percomplex rather than a cell, since it would predict endstopping.
We have argued that the textures considered here areindistinguishable for measures based on isocurvature op-erators with a resolution related to line width rather thanline length. As an alternative to using nonlinearitiesthat differentiate between i1D and i2D features, onemight argue that only coarse features are involved (BSS).In Section 3 we will show that although the contributionof low-resolution features might be strong in many cases,it is unlikely that perceptual segregation could be basedonly on BSS.
Fig. 7. Responses of different i1D operators to the input pat-terns shown at the left: Laplacian followed by one-way rectifi-cation, Laplacian followed by squaring, local amplitude, and localenergy (from left to right). Local amplitude is computed as( i
4(ei2 1 oi
2) and local amplitude as ( i4(ei
2 1 oi2)1/2, where e
and o are functions of (x, y) denoting outputs of oriented evenand odd filters and i indexes orientation. Details of the imple-mentation are irrelevant for the point we make here, which issimply that the four operators have different selectivities for i2Dfeatures relative to i1D features.
1728 J. Opt. Soc. Am. A/Vol. 15, No. 7 /July 1998 Barth et al.
D. ConclusionsWe conclude that the Laplacian gives inconsistent predic-tions for the discriminability of the two texture pairs, de-pending on the type of nonlinearity and small line-lengthdifferences. In particular, for nonlinearities that lead toan energy measure, all limitations that refer to Julesz’soriginal conjecture apply,37 according to which the visualsystem can discriminate only textures that differ in theirsecond-order properties. We do not question the well-established fact that existing texture models, in whichlinear filters are followed by some nonlinearity, can pre-dict segregation in many cases. But, as we have shown,the success of the particular model will much depend onthe type of nonlinearity. Obviously there is a need forunderstanding what the nonlinearities do besides eventu-ally fitting the data through the model. A common un-derstanding of the standard models is that plausibleretina- or V1-type model units that involve linear filteringand an additional energy measure are used, the latter be-ing needed because of the zero-mean output of the linearbandpass filters. However, our example, in which one-way rectification makes very different predictions fromsquaring, illustrates that the functional importance of thenonlinearities needs to be stressed and differentiated.Furthermore, we have shown that if high-frequency fea-tures are to make a positive contribution to the percep-tual segregation of the micropatterns considered here,they must differentiate between i1D and i2D features.As shown in Section 1, a further explanation for what thenonlinearities might do is that they extract differences inthe size of the micropatterns. We show limitations ofthis view in Section 3.
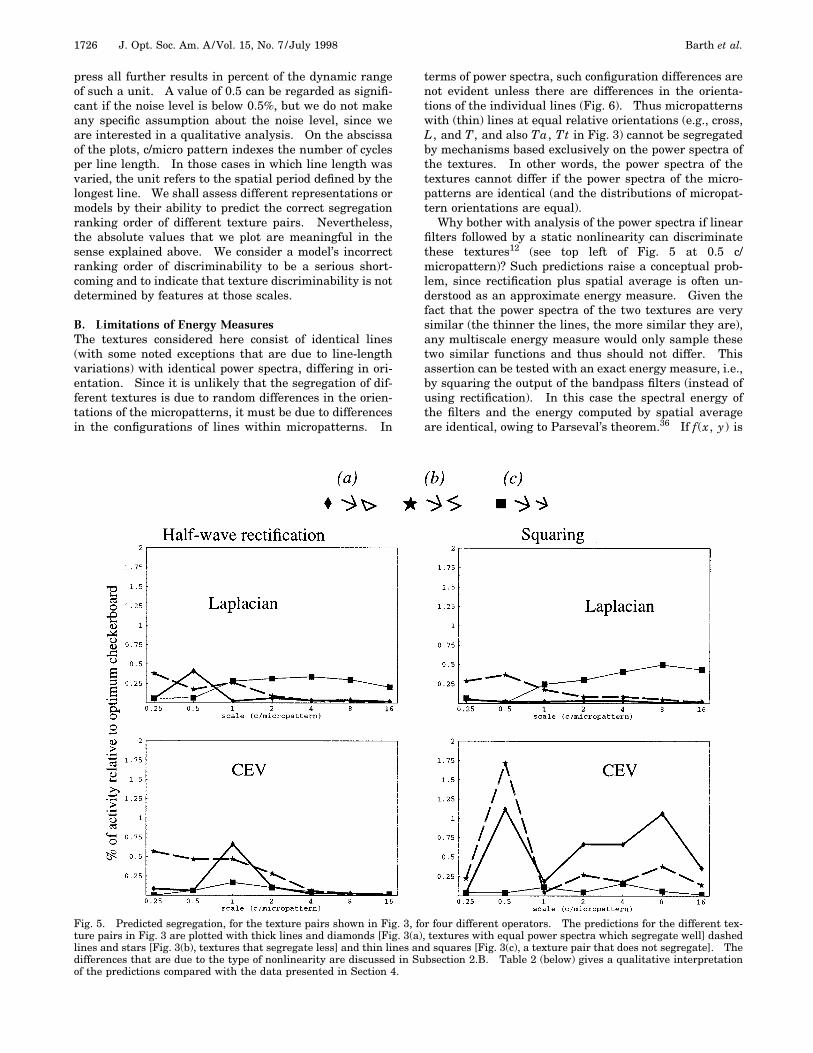
3. SEGREGATION AT EQUAL BLOB SIZEIn this section we present an example in which texturediscrimination based on size differences seems unlikelyand perceptual segregation is good. We made up tex-tures of micropatterns of fixed size by using a square inwhich we inserted two different patterns made up of thesame lines but in different arrangements relative to thesquare. Figure 8(a) shows the pair ‘‘aligned cross’’ (Tac)and ‘‘oblique cross’’ (Toc). In (b) the micropatterns differin both type and size whereas in (c) they differ in sizeonly.
Simulation results are shown in Fig. 9 with the samearrangement as in Fig. 5. The results obtained for thetwo representations are qualitatively similar for the tex-ture pair in Fig. 8(a) (thick lines in the plot) and thus sug-gest that the Laplacian and the CEV operator performequally well. Note, however, that the fact that these tex-tures segregate at all cannot be predicted from the lowscales (0.25 to 0.5 c/micropattern) that would correspondto size-tuned mechanisms.
It remains to be shown that the predictions based onthe Laplacian are unreliable at higher resolution. This isillustrated by the predictions obtained for the texturepairs in Figs. 8(b) and 8(c), which are quite similar, al-though perceptual segregation is noticeably different.The results in Section 4 show that it is not only the sub-jective judgement that is different for the two texturepairs but also the performance measured with brief pre-
sentations. Thus we conclude that texture models thatare built with bandpass filters and are followed by a staticnonlinearity (see Bergen21 for a review) would fail to ro-bustly predict the segregation of the textures in Fig. 8.The simulations for the CEV operator are shown at thebottom of Fig. 9 and are in good agreement with the datain Section 4.
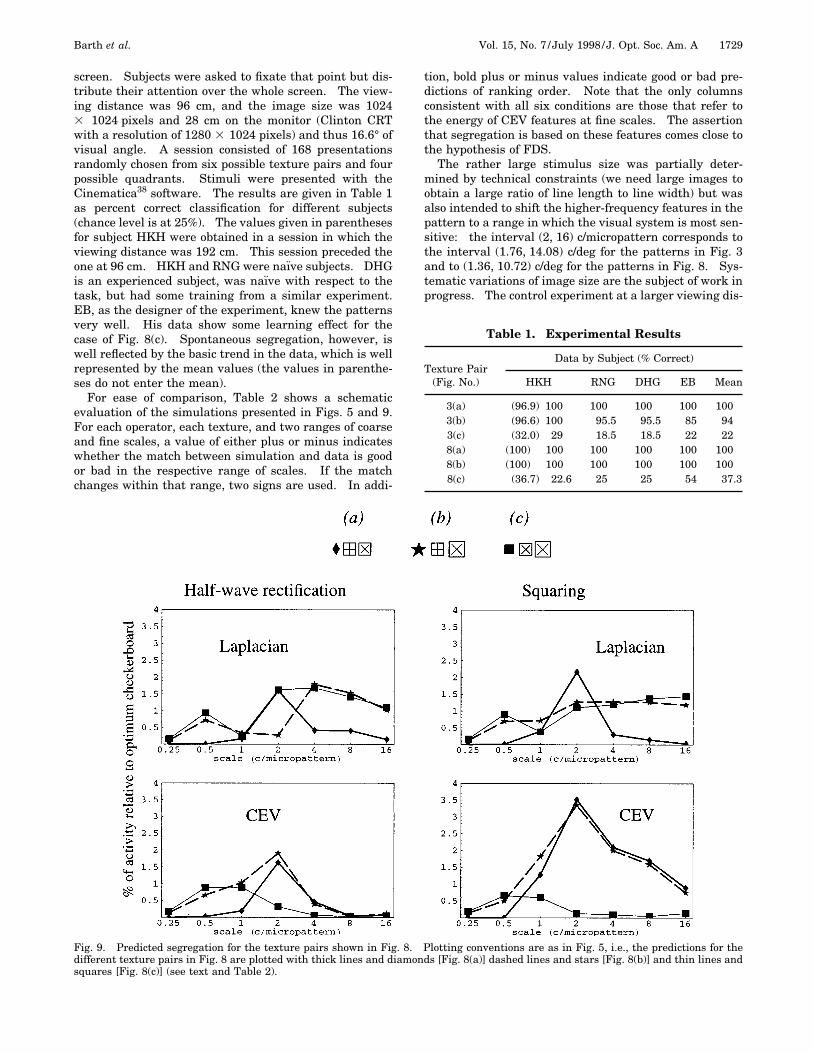
4. EXPERIMENTAL RESULTSThe experiment was designed to use the six texture pairsshown in Figs. 3 and 8. The 6 pairs have been combinedto form 24 images such that each different texture wasplaced in the 4 possible quadrants. By pressing one offour possible keys (four-alternative forced choice) after astimulus presentation of 133 ms (10 frames at 75 Hz) sub-jects chose the quadrant that seemed different. Subse-quently a gray background with the same luminance(52 cd m22) as the texture background was presentedthat included a small fixation point in the center of the
Fig. 8. Original in-square texture pairs are shown in (a). Thelines are 82 pixels long and 2 pixels wide unless different valuesare given below for (b) and (c). The procedures for generatingthe textures are as in Fig. 3. In (b) the lines of the target tex-ture Toc are 92 pixels long and in (c) the lines of the backgroundtexture are 90 pixels long. The values for line length have beenchosen so as to approximately equalize the predictions of the La-placian (Fig. 9) for the two pairs in (b) and (c) and raise them toa level comparable to the one obtained for (a).
Barth et al. Vol. 15, No. 7 /July 1998 /J. Opt. Soc. Am. A 1729
screen. Subjects were asked to fixate that point but dis-tribute their attention over the whole screen. The view-ing distance was 96 cm, and the image size was 10243 1024 pixels and 28 cm on the monitor (Clinton CRTwith a resolution of 1280 3 1024 pixels) and thus 16.6° ofvisual angle. A session consisted of 168 presentationsrandomly chosen from six possible texture pairs and fourpossible quadrants. Stimuli were presented with theCinematica38 software. The results are given in Table 1as percent correct classification for different subjects(chance level is at 25%). The values given in parenthesesfor subject HKH were obtained in a session in which theviewing distance was 192 cm. This session preceded theone at 96 cm. HKH and RNG were naıve subjects. DHGis an experienced subject, was naıve with respect to thetask, but had some training from a similar experiment.EB, as the designer of the experiment, knew the patternsvery well. His data show some learning effect for thecase of Fig. 8(c). Spontaneous segregation, however, iswell reflected by the basic trend in the data, which is wellrepresented by the mean values (the values in parenthe-ses do not enter the mean).
For ease of comparison, Table 2 shows a schematicevaluation of the simulations presented in Figs. 5 and 9.For each operator, each texture, and two ranges of coarseand fine scales, a value of either plus or minus indicateswhether the match between simulation and data is goodor bad in the respective range of scales. If the matchchanges within that range, two signs are used. In addi-
tion, bold plus or minus values indicate good or bad pre-dictions of ranking order. Note that the only columnsconsistent with all six conditions are those that refer tothe energy of CEV features at fine scales. The assertionthat segregation is based on these features comes close tothe hypothesis of FDS.
The rather large stimulus size was partially deter-mined by technical constraints (we need large images toobtain a large ratio of line length to line width) but wasalso intended to shift the higher-frequency features in thepattern to a range in which the visual system is most sen-sitive: the interval (2, 16) c/micropattern corresponds tothe interval (1.76, 14.08) c/deg for the patterns in Fig. 3and to (1.36, 10.72) c/deg for the patterns in Fig. 8. Sys-tematic variations of image size are the subject of work inprogress. The control experiment at a larger viewing dis-
Fig. 9. Predicted segregation for the texture pairs shown in Fig. 8. Plotting conventions are as in Fig. 5, i.e., the predictions for thedifferent texture pairs in Fig. 8 are plotted with thick lines and diamonds [Fig. 8(a)] dashed lines and stars [Fig. 8(b)] and thin lines andsquares [Fig. 8(c)] (see text and Table 2).
1730 J. Opt. Soc. Am. A/Vol. 15, No. 7 /July 1998 Barth et al.
Scale Coarse Fine Coarse Fine Coarse Fine Coarse Fine
3(a) 1 2 2 2 1 2 1 1
3(b) 1 12 2 2 1 2 2 2 1 21 2 2 12 2 1 1
3(c) 1 2 1 2 1 1 1 1
8(a) 21 12 21 12 21 12 21 1
8(b) 1 2 1 2 1 2 1 2 1 2 1 12 1 21 1 1
8(c) 2 2 2 2 2 1 2 1
tance suggests that smaller images lead to some improve-ment for the pairs in Figs. 3(c) and 8(c), but the effect issmall. Our main minus for BSS, however, is that for thepair in Fig. 8(a), i.e., the fact that the textures Tac andToc have equal blob size and still segregate well.
5. DISCUSSIONA. Higher-Order Statistics and Nonlinear OperationsWe have seen that models of texture perception based onan energy measure (e.g., size-tuned filters followed bysquaring and spatial average) will confound all texturepairs with identical power spectra. This class of patternscomprises iso-second-order binary textures that can bediscriminated2 as well as a large class of grey-level im-ages that have identical power spectra but different phaseproperties and that look very different. Such patternscan be generated easily, e.g., as compound sinusoidalgratings,39–41 and have been used to illustrate the impor-tance of phase information for image coding.42
From the above considerations it seems that the visualsystem does exploit higher-order statistical dependenciesin images, and it is known that this must involve nonlin-ear operations. It is less clear, however, which type ofstatistical dependencies can be associated with whichclass of nonlinear operations. In this context it is of par-ticular interest to know how i2D operators, as one par-ticular class of nonlinear operators, are related to higher-order structures in images.30
B. Spatially Averaged Intrinsic Two-DimensionalFeaturesWe have shown examples for which the conceptual differ-entiation between i1D and i2D features seems necessary,and we have related i2D selectivity to the activity of end-stopped neurons. At this point our view is reminiscent ofthe texton theory of Julesz and co-workers, which postu-lated the necessity of textons such as terminators, cor-ners, and crossings.2,43 We did not, however, rely on ver-bal descriptions of image features but started with theraw images and computed the responses of nonlinear i2Doperators. For example, we did not define a terminatoras being the end of a line but used operators that are sen-sitive to the end of a line and do not respond to thestraight part of the line. As to a more detailed specifica-tion of the i2D operators, further psychophysical experi-ments and data from the neurophysiology of end-stopped
neurons are needed. Experimental evidence for the ne-cessity of curvature-sensitive mechanisms in texture seg-mentation based on curved-line elements has been pro-vided by Simmons and Foster.44 In this paper we haveshown computationally that the responses of spatially av-eraged i2D operators can explain perceptual segregationin cases in which standard models would fail. Our re-sults can hence provide some further evidence for the im-portance of i2D features for vision.
Our viewpoint is, more or less explicitly, supported byother authors. For example, Rubenstein and Sagi45 pro-posed an analysis of filter-energy distributions across ori-entation in the case of micropatterns with identical powerspectra. As shown in our previous paper,27 this is onepossibility for discriminating between i1D and i2D fea-tures. Also, by using the classical micropatterns withopen versus closed circles or octagons, Rubenstein andSagi found that line terminations are important cues forsegmentation. The model by Malik and Perona12 usesfilters and nonlinearities that involve two-stage lateralinhibition, each followed by one-way rectification, and ithas been shown that i2D operators can be built by use ofsuch computations.46,47 However, the question of whichspecific i2D-selective operator will fit most of the avail-able data remains open for further investigation.
In the simulations presented in this paper we do not in-troduce task-specific nonlinearities to fit some data in thecontext of texture perception; instead we use operatorsthat have been derived from general principles of imageprocessing30 and have previously been introduced as mod-els for end-stopped neurons.26,27 Moreover, the spatiallyaveraged CEV operator has already been shown to ex-plain topological perception, and a model based on a lo-cally averaged CEV operator has been presented for thebug detector in a frog’s retina.48 The issue of topologicalperception is closely related to the perceptual relevance ofcontour closure for perception, which was emphasized byGestalt psychologists49 and was later derived from experi-ments on texture perception.43 It has also been recog-nized that it is not closure but the absence of terminatorsthat might be the relevant stimulus property.50 The lat-ter argument has been weakened by visual search experi-ments that suggest the existence of a closurecontinuum.51 Here again the dispute originates from theabstract notion of terminators. Since i2D operators arelimited to a certain spatial scale, averaged i2D featureswould be limited in their selectivity to closure and would
Barth et al. Vol. 15, No. 7 /July 1998 /J. Opt. Soc. Am. A 1731
naturally predict a continuum. We expect that spatiallyaveraged i2D features might also lead to a measure of clo-sure that would match the one derived by Elder andZucker52 but be data driven. Thus we are confidentabout dealing with a general principle of visual process-ing rather than presenting a task-specific model.
C. Critical Predictions of Intrinsic Two-DimensionalOperatorsWe shall now discuss whether a model based on i2D op-erators could be falsified easily. Simplistic objections canbe made by disregarding the fact that i2D operators maybe implemented at different levels of resolution. Low-resolution i2D operators can be selective to the length of aline even if, at high resolution, line length is disregarded.Another objection would be that orientation is a strongcue in texture segregation but has nothing to do with i2Dfeatures such as curvature. End-stopped neurons, how-ever, are usually orientation selective and would thus al-low for segregation based on differences in orientation.Models for oriented and end-stopped cells, including local-energy i2D operators, have been presented in previousstudies.26 Here, for simplicity, we have considered onlyisotropic operators.
Still we are left with a few problems. First, it seemsrather difficult to find patterns that segregate stronglywithout differences at the blob-size level, and, for the bestexample we have found so far (Fig. 8), segregation is notvery strong. This could be due to low-resolution cues be-ing stronger in general. Second, it seems easy to falsify atexture model that is based on only high-resolution i2Doperators by adding additional texture elements (e.g.,dots) to the background of one texture. This wouldstrongly affect the predictions of high-resolution i2D op-erators without having a similarly strong influence onperceptual segregation. Additional mechanisms to dealwith this and perhaps other problems will be needed. Inthis sense the task defined by Bergen and Adelson3 (seequote in the Section 1) is not yet fully accomplished.
6. GENERAL CONCLUSIONSWe have argued that in certain texture-segregation tasksthe visual system must use operations that distinguishi1D and i2D features. We have questioned theoreticalmodels in which the role of the nonlinearities is not un-derstood, and we have argued that i2D operators consti-tute a particularly useful class of nonlinear operators be-cause they are related to the neural mechanism of endstopping and to optimal strategies of information process-ing. As to the debate on filter models versus textons, weargue for a unification based on i2D-operators: At lowresolution such operators are selective to blob size and athigh resolution are selective to textons such as line endsand crossings.
ACKNOWLEDGMENTSThe work has been supported by a grant from DeutscheForschungsgemeinschaft (DFG-Re 337/7) to I. Rentschlerand C. Zetzsche. Some of the results have been pre-sented before.53 A substantial revision was completed at
the NASA Ames Research Center and was supported byDFG grant Ba 1176/4-1 to E. Barth. For assistance withthe experimental setup we thank A. B. Watson, whom wealso thank along with D. H. Grosof for comments on themanuscript.
Erhardt Barth can be reached at MS 262-2, NASAAmes Research Center, Moffet Field, California 94035-1000, by telephone at 650-604-1182, by fax at 650-604-0255, or by e-mail at [email protected].
REFERENCES1. B. Julesz and B. Krose, ‘‘Features and spatial filters,’’ Na-
ture 333, 302–303 (1988).2. B. Julesz, ‘‘Textons, the elements of texture perception, and
their interactions,’’ Nature 290, 91–97 (1981).3. J. R. Bergen and E. H. Adelson, ‘‘Early vision and texture
perception,’’ Nature 333, 363–364 (1988).4. D. Wermser and C.-E. Liedtke, ‘‘Texture analysis using a
model of the visual system,’’ in Proceedings of the Sixth In-ternational Conference on Pattern Recognition (Institute ofElectrical and Electronics Engineers, Piscataway, N.J.,1982), pp. 1078–1080.
5. J. M. Coggins and A. K. Jain, ‘‘A spatial filtering approachto texture analysis,’’ Pattern Recogn. Lett. 3, 195–203(1985).
6. M. R. Turner, ‘‘Texture discrimination by Gabor functions,’’Biol. Cybern. 55, 71–82 (1986).
7. C. Zetzsche and W. Schonecker, ‘‘Orientation selective fil-ters lead to entropy reduction in the processing of naturalimages,’’ Perception 16, 229 (1987).
8. U. Kriegeskotten-Thiede and C. Zetzsche, ‘‘Local amplitudeof filter outputs predicts the influence of micropattern spac-ing, orientation, and elongation on texture discrimination,’’Perception 17, 398 (1988).
9. I. Fogel and D. Sagi, ‘‘Gabor filters as texture discrimina-tors,’’ Biol. Cybern. 61, 103–113 (1989).
10. A. Sutter, J. Beck, and N. Graham, ‘‘Contrast and spatialvariables in texture segregation: testing a simple spatial-frequency channels model,’’ Percept. Psychophys. 46, 312–332 (1989).
11. A. C. Bovik, M. Clark, and W. S. Geisler, ‘‘Multi-channeltexture analysis using localized spatial filters,’’ IEEETrans. Pattern Anal. Mach. Intell. 12, 55–73 (1990).
12. J. Malik and P. Perona, ‘‘Preattentive texture discrimina-tion with early vision mechanisms,’’ J. Opt. Soc. Am. A 7,923–932 (1990).
13. M. S. Landy and J. R. Bergen, ‘‘Texture segregation and ori-entation gradient,’’ Vision Res. 31, 679–691 (1991).
14. N. Graham, J. Beck, and A. Sutter, ‘‘Nonlinear processes inspatial-frequency channel models of perceived texture seg-regation: effects of sign and amount of contrast,’’ VisionRes. 32, 719–743 (1992).
15. A. Gorea and T. V. Papathomas, ‘‘Double opponency as ageneralized concept in texture segregation illustrated withstimuli defined by color, luminance, and orientation, ’’ J.Opt. Soc. Am. A 10, 1450–1462 (1993).
16. T. M. Caelli, ‘‘Three processing characteristics of visual tex-ture segmentation,’’ Spatial Vis. 1, 19–30 (1985).
17. T. M. Caelli, ‘‘An adaptive computational model for texturesegmentation,’’ IEEE Trans. Semicond. Manuf. 18, 9–17(1988).
18. D. Carevic and T. Caelli, ‘‘Application of partial modellingtechniques for texture segmentation,’’ J. Opt. Soc. Am. A14, 2924–2937 (1997).
19. H. C. Nothdurft, ‘‘Texton segregation by associated differ-ences in global and local luminance distribution,’’ Proc. R.Soc. London Ser. B 239, 295–320 (1990).
20. B. Julesz, ‘‘Early vision and focal attention,’’ Review Mod.Phys. 63, 735–772 (1991).
21. J. R. Bergen, ‘‘Theories of visual texture perception,’’ in
1732 J. Opt. Soc. Am. A/Vol. 15, No. 7 /July 1998 Barth et al.
Vision and Visual Disfunction, D. Regan, ed. (Macmillan,New York, 1991), Vol. 10B, pp. 114–134.
22. A. Dobbins, S. W. Zucker, and M. S. Cynader, ‘‘Endstoppedneurons in the visual cortex as a substrate for calculatingcurvature,’’ Nature 329, 438–441 (1987).
23. C. Zetzsche, ‘‘Statistical properties of the representation ofnatural images at different levels in the visual system,’’Perception 17, 359 (1988).
24. J. J. Koenderink and W. Richards, ‘‘Two-dimensional cur-vature operators,’’ J. Opt. Soc. Am. A 5, 1136–1141 (1988).
25. H. R. Wilson and W. A. Richards, ‘‘Mechanisms of contourcurvature discrimination,’’ J. Opt. Soc. Am. A 6, 106–115(1989).
26. C. Zetzsche and E. Barth, ‘‘Fundamental limits of linear fil-ters in the visual processing of two-dimensional signals,’’Vision Res. 30, 1111–1117 (1990).
27. C. Zetzsche and E. Barth, ‘‘Image surface predicates andthe neural encoding of two-dimensional signal variation,’’ inHuman Vision and Electronic Imaging: Models, Methods,and Applications, B. Rogowitz, ed., Proc. SPIE 1249, 160–177 (1990).
28. F. Heitger, L. Rosenthaler, R. von der Heydt, E. Peterhans,and O. Kubler, ‘‘Simulation of neural contour mechanisms:from simple to end-stopped cells,’’ Vision Res. 32, 63–981(1992).
29. C. Zetzsche and E. Barth, ‘‘Detection of intrinsic signal di-mensionality in images and optic flow fields,’’ Perception20, 71 (1991).
30. C. Zetzsche, E. Barth, and B. Wegmann, ‘‘The importance ofintrinsically two-dimensional image features in biologicalvision and picture coding,’’ in Digital Images and HumanVision, A. Watson, ed. (MIT Press, Cambridge, Mass.,1993), pp. 109–138.
31. E. Barth, T. Caelli, and C. Zetzsche, ‘‘Image encoding, la-belling and reconstruction from differential geometry,’’ CV-GIP: Graph. Models Image Process. 55, 428–446 (1993).
32. G. Krieger, C. Zetzsche, and E. Barth, ‘‘2D-detectors in bio-logical vision: Volterra–Wiener kernels for end-stopped,dot-responsive, and motion-specific cells,’’ Perception 22(Suppl.), 143 (1993).
33. G. Krieger, C. Zetzsche, and E. Barth, ‘‘Nonlinear image op-erators for the detection of local intrinsic dimensionality,’’in Proceedings of the IEEE Workshop Nonlinear Signal andImage Processing (Institute of Electrical and ElectronicsEngineers, Piscataway, N.J., 1995), pp. 182–185.
34. G. Krieger and C. Zetzsche, ‘‘Nonlinear image operators forthe evaluation of local intrinsic dimensionality,’’ Special is-sue on Nonlinear Image Processing, IEEE Trans. ImageProcess. 5, 1026–1042 (1996).
35. T. M. Caelli, M. Hubner, and I. Rentschler, ‘‘On the dis-crimination of micropatterns and textures,’’ Hum. Neuro-biol. 5, 129–136 (1986).
36. A. Papoulis, The Fourier Integral and its Applications(McGraw-Hill, New York, 1962).
37. B. Julesz, ‘‘Experiments in the visual perception of tex-ture,’’ Sci. Am. 232, 34–43 (1975).
38. J. A. Solomon and A. B. Watson, ‘‘Cinematica: a systemfor calibrated, Macintosh-driven displays from withinMathematica,’’ Behav. Res. Methods Instrum. Comput. 28,607–610 (1996).
39. I. Rentschler and B. Treutwein, ‘‘Loss of spatial phase rela-tionships in extrafoveal vision,’’ Nature 313, 308–310(1985).
40. I. Rentschler, M. Huebner, and T. Caelli, ‘‘On the discrimi-nation of compound Gabor signals and textures,’’ VisionRes. 28, 279–291 (1988).
41. S. A. Klein and C. W. Tyler, ‘‘Phase discrimination of com-pound gratings: generalized autocorrelation analysis,’’ J.Opt. Soc. Am. A 3, 868–879 (1986).
42. C. Zetzsche and B. Wegmann, ‘‘Coding properties of localamplitude and phase of two-dimensional filter outputs,’’Perception 17, 396 (1988).
43. T. M. Caelli, B. Julesz, and E. Gilbert, ‘‘On perceptualanalysers underlying visual texture discrimination. PartII,’’ Biol. Cybern. 29, 201–214 (1978).
44. D. S. Simmons and D. H. Foster, ‘‘Segmenting textures ofcurved-line elements,’’ in Artificial and Biological VisionSystems, G. A. Orban and H.-H. Nagel, eds. (Springer-Verlag, Berlin, 1992), pp. 324–349.
45. B. S. Rubenstein and D. Sagi, ‘‘Preattentive texturesegmentation: the role of line terminations, size, andfilter wavelength,’’ Percept. Psychophys. 58, 489–509(1996).
46. E. Barth, G. Krieger, I. Rentschler, and B. Treutwein,‘‘Receptor-horizontal cell interactions may induce endstop-ping,’’ Invest. Ophthalmol. Visual Sci. 37 (Suppl.), 1056(1996).
47. E. Barth and C. Zetzsche, ‘‘Endstopped operators based oniterated nonlinear center-surround inhibition,’’ in HumanVision and Electronic Imaging III, B. Rogowitz, ed., Proc.SPIE 3299, pp. 41–53 (1998).
48. E. Barth, M. Ferraro, C. Zetzsche, and I. Rentschler, ‘‘Com-putational models for the topological selectivity in early andprimitive vision systems,’’ OSA Annual Meeting, Vol. 16 of1993 OSA Technical Digest Series (Optical Society ofAmerica, Washington, D.C., 1993), p. 186.
49. K. Koffka, Principles of Gestalt Psychology (Harcourt,Brace, New York, 1935).
50. B. Julesz, ‘‘Spatial nonlinearities in the instantaneous per-ception of textures with identical power spectra,’’ Philos.Trans. R. Soc. London Ser. B 290, 83–94 (1980).
51. J. Elder and S. Zucker, ‘‘The effect of contour closure on therapid discrimination of two-dimensional shapes,’’ VisionRes. 33, 981–991 (1993).
52. J. Elder and S. Zucker, ‘‘A measure of closure,’’ Vision Res.34, 3361–3369 (1994).
53. E. Barth, C. Zetzsche, and I. Rentschler, ‘‘End-stoppingmay yield textons,’’ Perception 24 (Suppl.), 19 (1995).