29
Intro to basic statistics Lilla Zöllei Feb 5, 2009 Why’N’How

Intro to basic statistics
Lilla ZölleiFeb 5, 2009Why’N’How

02-05-09 Why'N'How -- Intro to Statistics 2
Outline
Correlations
t-tests
ANOVA

02-05-09 Why'N'How -- Intro to Statistics 3
CorrelationCovariance: measures strength of linear link between two (numerical) random variables
large: strong linear link between RVssmall: weak OR nonlinear link between RVsdepends on measurement unit!!!
Correlation coefficient: standardized version on covariance
( ) ( )( )[ ]22121,Cov μμ −−= 1 XXEXX
( )( ) ( )21
21
VarVar,Cov
XXXX
=ρ

02-05-09 Why'N'How -- Intro to Statistics 4
andsymmetrical: if both have unit variances:
distributions known through a sample (Pearson):
Correlation coefficient facts11 +≤≤− ρ
21 XX = ( ) ( ) ( )2121 VarVar,Cov XXXX ==
( ) ( )1221 ,, XXXX ρρ =( ) 1, 11 +=XXρ
( ) ( )2121 ,,Cov XXXX ρ=
( )( )( ) ( )∑
∑−−
−−=
22 yyxx
yyxx
ii
iiρ

02-05-09 Why'N'How -- Intro to Statistics 5
: perfect linear functional relationship between X1 and X2
iff the relationship between X1 and X2 is linear, their relationship is weak
uncorrelated variables
≠ causality≠ independence!!!independence is much stronger than lack of correlation
Interpretation( ) 1, 21 ±=XXρ
( ) 0, 21 ≈XXρ
02-05-09 Why'N'How -- Intro to Statistics 6
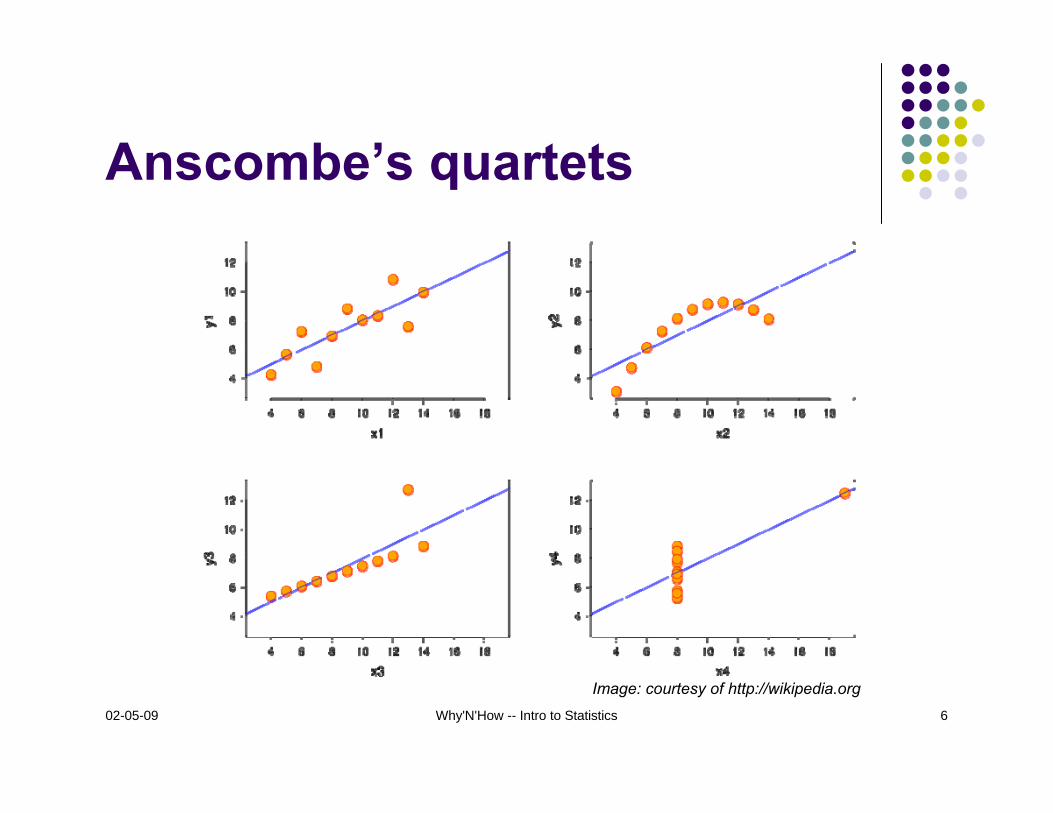
Anscombe’s quartets
Image: courtesy of http://wikipedia.org

02-05-09 Why'N'How -- Intro to Statistics 7
Non-parametric corr. coeff.’s
When the sample distribution is not normal the following tests are more useful:
Chi-square, Point biserial correlation, Spearman’s, Kendall’s, Goodman’s, Kruskal’s, …

02-05-09 Why'N'How -- Intro to Statistics 8

02-05-09 Why'N'How -- Intro to Statistics 9
t-testTwo strong assumptions
samples are drawn from normal populationsfor the two samples the variances (either known or unknown) are identical
“How much can we trust the sample mean as a guess of the mean of the normal distribution from which the sample was drawn ?”
Examples: Single sampleTwo samples (paired an unpaired)

02-05-09 Why'N'How -- Intro to Statistics 10
One sample t-test with reference
μ0: reference valuem : sample mean
QUESTION: "Is m significantly different from μ0?"
Null hypothesis: H0 : μ = μ0.
Image: courtesy of http://www.aiaccess.net

02-05-09 Why'N'How -- Intro to Statistics 11
Assumptions about variance
variance of the sample generating normal distribution
known distribution of the standardized sample mean is the standard normal distribution N(0, 1)unknown variance has to be estimated from the sample; but distribution of the standardized sample mean is known: (Student's) t-distribution

02-05-09 Why'N'How -- Intro to Statistics 12
t-distribution wrt N(0,1)DOF = 1, 2, 3, 5, 10, 30
Image: courtesy of http://wikipedia.org

02-05-09 Why'N'How -- Intro to Statistics 13
t-test: one- or two-sided
Two-sided:“Is there is a significant difference between m and μ0?” (in absolute!) alternative hypothesis: H1: μ ≠ μ0
One-sided:“Is the mean of the population larger (smaller) than μ0?”alternative hypothesis H1: μ ≥ μ0 (μ ≤ μ0)
H0 : μ = μ0

02-05-09 Why'N'How -- Intro to Statistics 14
Two paired samples t-test
QUESTION: “Is the average shift of the observations due to the treatment significantly different from 0?”
not : “Are the means of the two samples significantly different?”
Image: courtesy of http://www.aiaccess.net

02-05-09 Why'N'How -- Intro to Statistics 15
Two independent samples t-test
QUESTION: “Are the means m1 and m2 significantly different?”
large difference between them rejects the null hypothesis H0: μ1 = μ2
Image: courtesy of http://www.aiaccess.net

02-05-09 Why'N'How -- Intro to Statistics 16
Variations
variance of the two populations known difference between the two standardized sample means is N(0, 1)unknown difference between the two standardized sample means is t distributed
can also be one- or two-sided

02-05-09 Why'N'How -- Intro to Statistics 17
A more general scenario…
What if there are more than two groups of observations?
series of t-tests on every pair of groups; find at least one pair of groups where hypothesis is rejected
ANOVA (global test)

02-05-09 Why'N'How -- Intro to Statistics 18
REMINDER: t-testtwo strong assumptions
samples are drawn from normal populationsfor the two samples the variances (either known or unknown) are identical
test for normality: Kolmogorov-Smirnov test, Shapiro-Wilks test, …test for equality of variances: F-test, Levene’s test, Bartlett’s test…
in case the above assumptions failMann-Whitney test (non-parametric)

02-05-09 Why'N'How -- Intro to Statistics 19
To proceedSelect significance level α = 0.05 or 0.01t-test p-value
if (p < α): reject H0
else: the data is not incompatible (at this significance level) with H0 (does notmean that H0 is true!!!)

02-05-09 Why'N'How -- Intro to Statistics 20
nSXXt
XX 221
21 −=2
2221
21
XXXX
SSS
+=
21
21
1121 nn
S
XXt
XX +
−= ( ) ( )
111
21
22
21 21
21 −+
−+−=
nnSnSn
S XXXX
21
21
XXsXXt
−
−=
2
22
1
21
21 ns
nss XX +=−
NsXt
D
D 0μ−=
differences are computed!dependent (paired)
two sample
WSindep. two samples: unequal sample
size, unequal variance (Welsch)
(n1+n2-1)indep. two samples:
unequal sample size, equal variance
(2n-2)indep. two samples: equal sample size,
equal variance
(n-1)s: std; n: sample sizeindep. one sample with reference
DOFSTATISTICSCENARIO
nsxt 0μ−=

02-05-09 Why'N'How -- Intro to Statistics 21
Some history…
1908: first t-distribution derivation publishedWilliam Sealy Gosset (Student); Guinness Brewery, Dublin
t-test and theory: through work of R.A. Fisher --“Student's distribution”

02-05-09 Why'N'How -- Intro to Statistics 22
02-05-09 Why'N'How -- Intro to Statistics 23
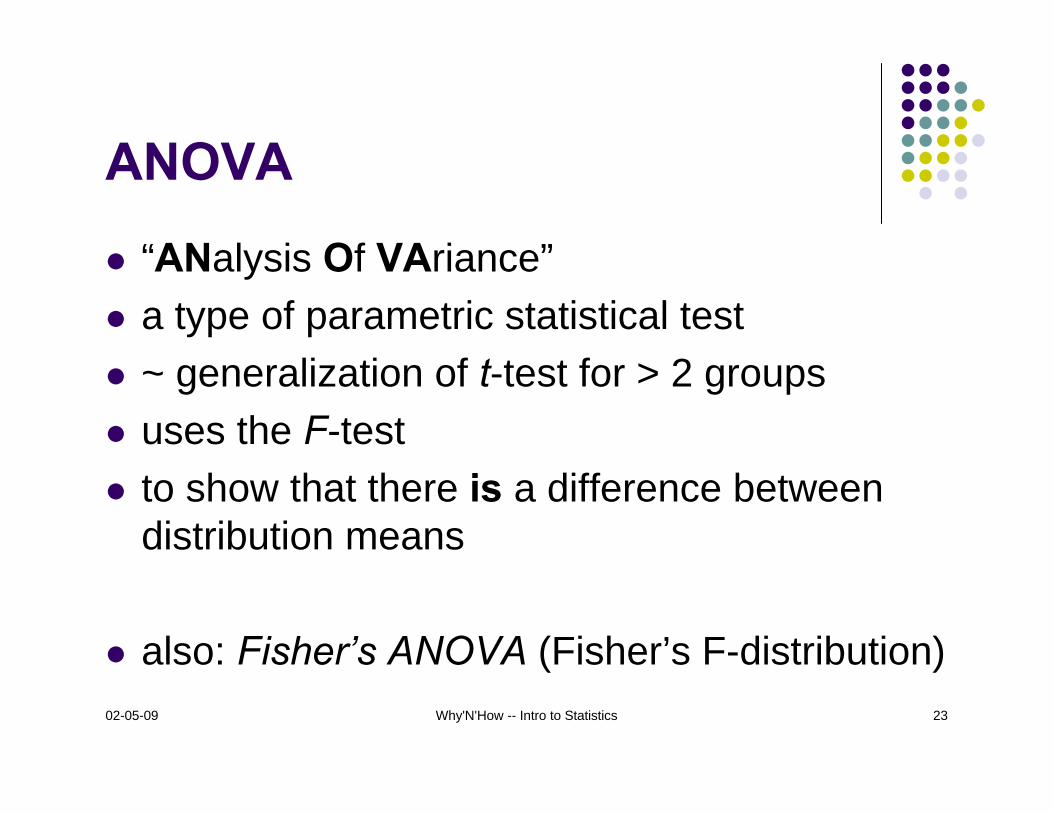
ANOVA
“ANalysis Of VAriance”a type of parametric statistical test~ generalization of t-test for > 2 groupsuses the F-testto show that there is a difference between distribution means
also: Fisher’s ANOVA (Fisher’s F-distribution)

02-05-09 Why'N'How -- Intro to Statistics 24
Example
Null hypothesis: H0 : μ1 = μ2 = μ3
Assumptions about the sampling distributions: normal, identical variances (homoscedasticity), independent
Image: courtesy of http://www.aiaccess.net
02-05-09 Why'N'How -- Intro to Statistics 25
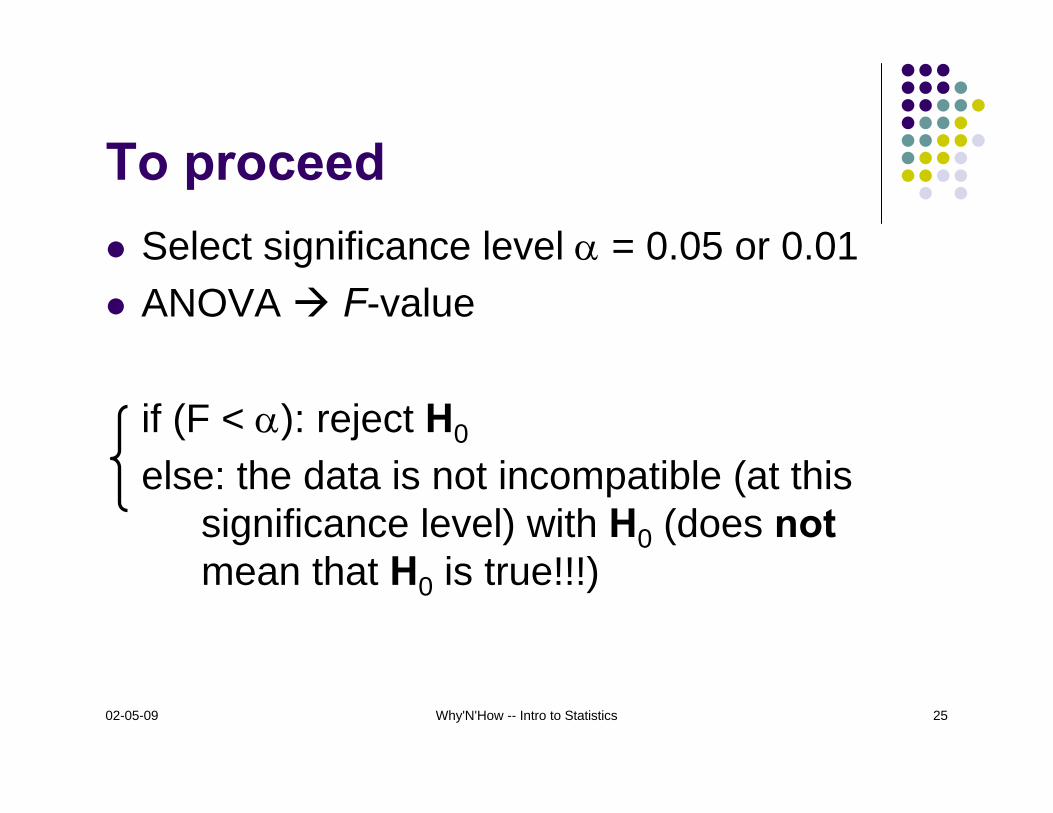
To proceedSelect significance level α = 0.05 or 0.01ANOVA F-value
if (F < α): reject H0
else: the data is not incompatible (at this significance level) with H0 (does notmean that H0 is true!!!)

02-05-09 Why'N'How -- Intro to Statistics 26
After ANOVA rejects H0 …
Follow-up tests to analyze the reasons why the hypothesis was rejected: planned (a priori) vs. post hoc (a posteriori)post hoc examples: Tukey’s test, Dunnett'stest

02-05-09 Why'N'How -- Intro to Statistics 27
Power analysis
To determine sufficient sample size to possibly reject null hypothesis

02-05-09 Why'N'How -- Intro to Statistics 28
REMINDER: ANOVAStrong assumptions
normal sampling distributionshomogeneous variance of the sampling distributions
To test for them:normality: Kolmogorov-Smirnov test, Shapiro-Wilk test, …homoscedasticity: Bartlett test, Levene test, …
In case the above assumptions failKruskal-Wallace test (non-parametric)

02-05-09 Why'N'How -- Intro to Statistics 29
References / useful citesWIKIPEDIAhttp://www.aiaccess.net/English/home.htm(images in the talk were obtained from above)
http://www.physics.csbsju.edu/stats/anova.htmlhttp://udel.edu/~mcdonald/statanovaintro.html


