25
Intro to Statistics for Intro to Statistics for the Behavioral Sciences the Behavioral Sciences PSYC 1900 PSYC 1900 Lecture 6: Correlation Lecture 6: Correlation
| Date post: | 21-Dec-2015 |
| Category: |
Documents |
| View: | 220 times |
| Download: | 4 times |
Intro to Statistics for the Intro to Statistics for the Behavioral SciencesBehavioral Sciences
PSYC 1900PSYC 1900
Lecture 6: CorrelationLecture 6: Correlation
CorrelationCorrelation
One of the most basic questions asked One of the most basic questions asked in behavioral science involves whether in behavioral science involves whether a relation exists between two variables.a relation exists between two variables. Do changes or scores on X correspond to Do changes or scores on X correspond to
changes or scores on Y?changes or scores on Y?
An easy way to visually ask this An easy way to visually ask this question is to use a scatter plot.question is to use a scatter plot.
Breast Cancer and Solar Breast Cancer and Solar RadiationRadiation
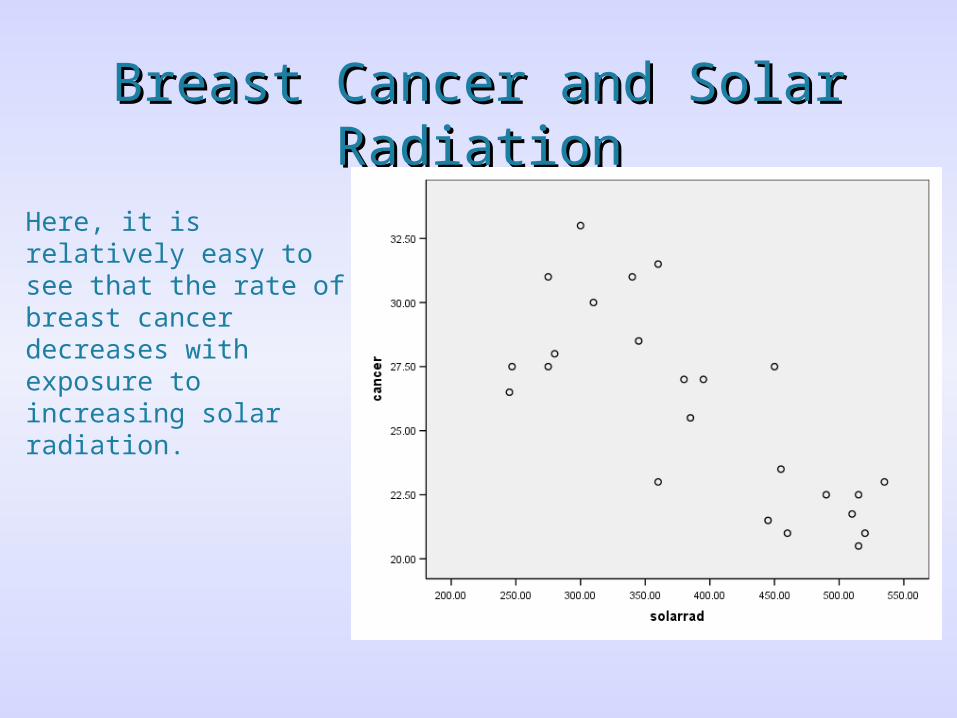
Here, it is relatively easy to see that the rate of breast cancer decreases with exposure to increasing solar radiation.
Life Expectancy and Per Life Expectancy and Per Capital Health ExpendituresCapital Health Expenditures
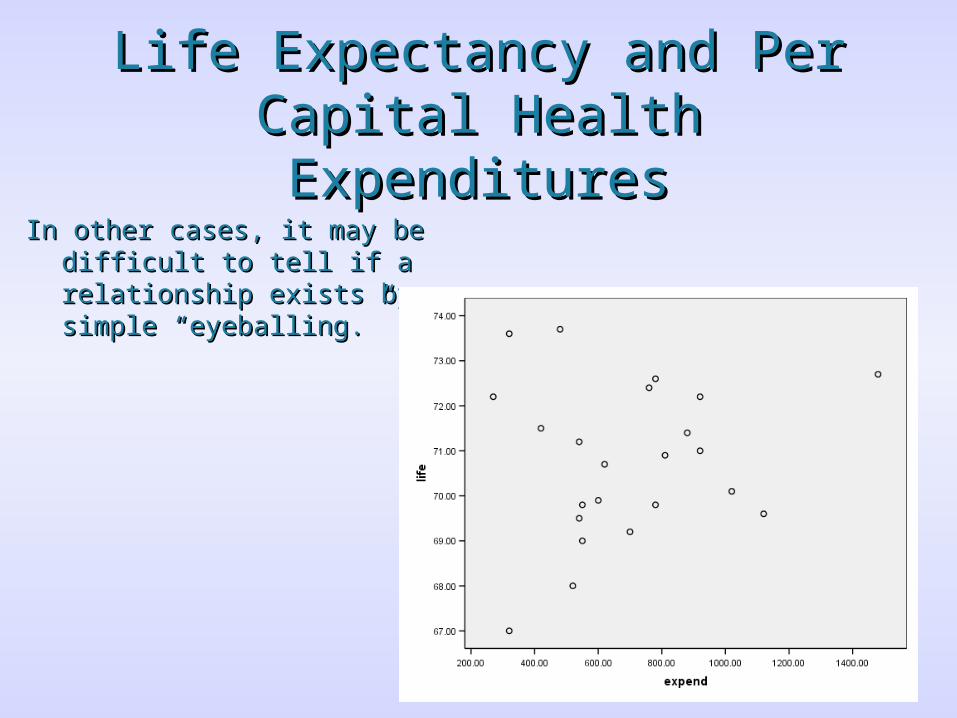
In other cases, it may be In other cases, it may be difficult to tell if a difficult to tell if a relationship exists by relationship exists by simple “eyeballing.”simple “eyeballing.”
CorrelationCorrelation
Correlation is one statistical technique Correlation is one statistical technique that is used to examine whether any that is used to examine whether any relation exists between two variables.relation exists between two variables. Correlation coefficient provides a Correlation coefficient provides a
numerical measure of the degree and numerical measure of the degree and direction of the relation.direction of the relation.
Note that existence of a correlation does Note that existence of a correlation does not imply that one variable causes the not imply that one variable causes the other.other.
CorrelationCorrelation
In essence, a correlation analysis fits a In essence, a correlation analysis fits a linear function to a scatterplot.linear function to a scatterplot. A linear function is one with a constant slope A linear function is one with a constant slope
(i.e. a straight line).(i.e. a straight line). The function is the one that minimizes all The function is the one that minimizes all
possible prediction errors or residuals.possible prediction errors or residuals. Residuals are represented by the vertical Residuals are represented by the vertical
distance from the prediction line to the data distance from the prediction line to the data points.points.
This is also termed the regression regression This is also termed the regression regression line.line.
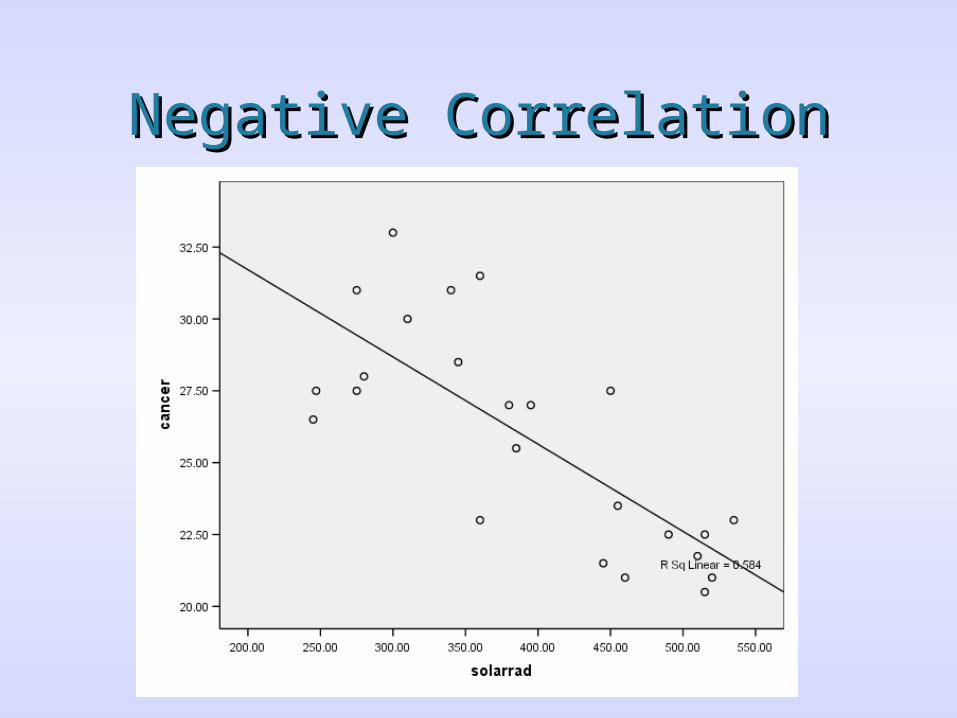
Negative CorrelationNegative Correlation
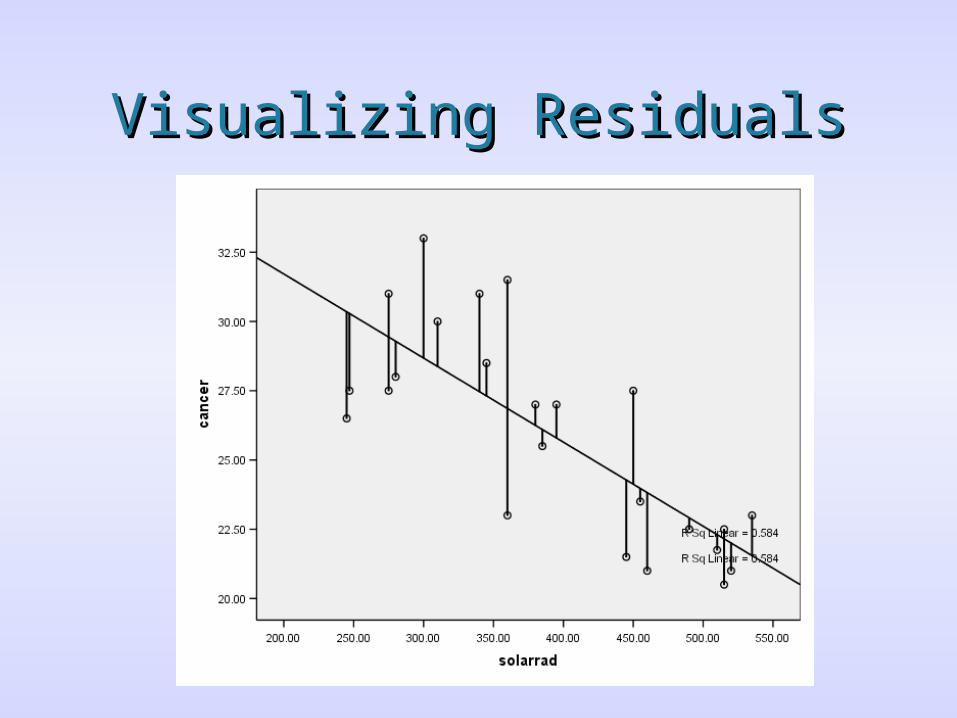
Visualizing ResidualsVisualizing Residuals
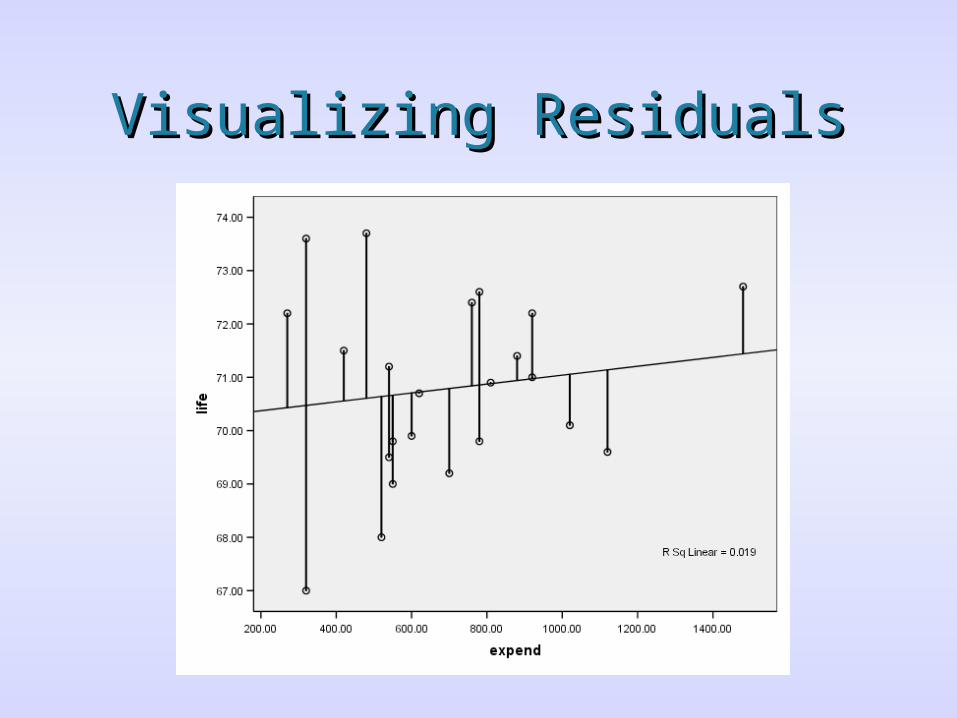
Visualizing ResidualsVisualizing Residuals
CorrelationCorrelation
Remember that correlations only Remember that correlations only examine linear relationships.examine linear relationships.
Variable could possess a very high Variable could possess a very high curvilinear relation, but the curvilinear relation, but the correlation coefficient could be zero.correlation coefficient could be zero.
AppletApplet
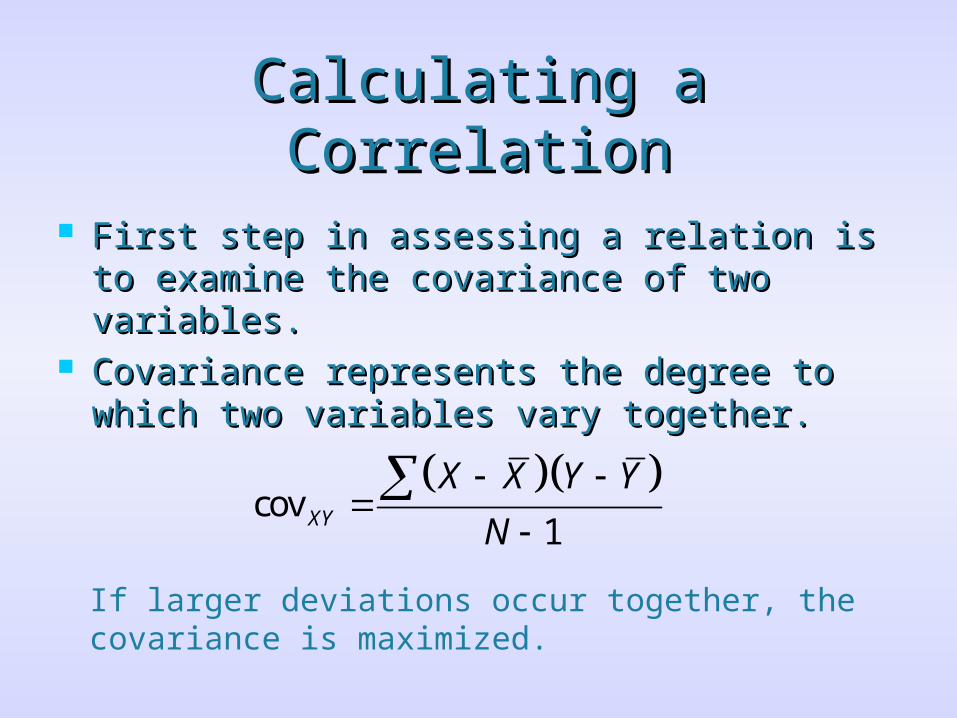
Calculating a CorrelationCalculating a Correlation
First step in assessing a relation is to First step in assessing a relation is to examine the covariance of two variables.examine the covariance of two variables.
Covariance represents the degree to which Covariance represents the degree to which two variables vary together.two variables vary together.
cov
1XY
X X Y Y
N
If larger deviations occur together, the covariance is maximized.
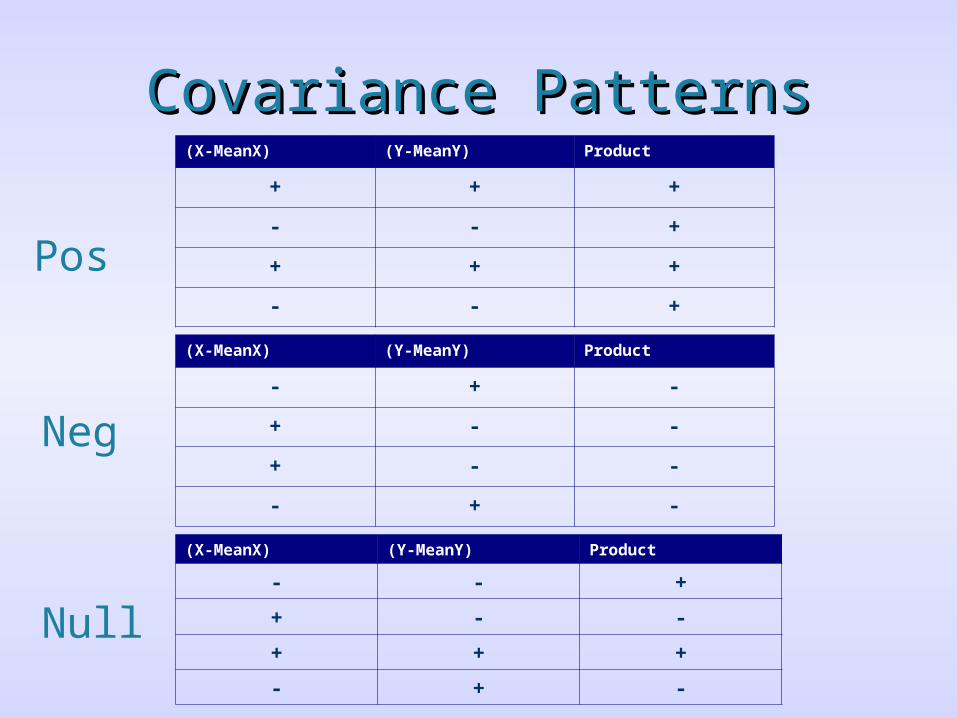
Covariance PatternsCovariance Patterns(X-MeanX) (Y-MeanY) Product
+ + +
- - +
+ + +
- - +
(X-MeanX) (Y-MeanY) Product
- + -
+ - -
+ - -
- + -
(X-MeanX) (Y-MeanY) Product
- - +
+ - -
+ + +
- + -
Pos
Neg
Null
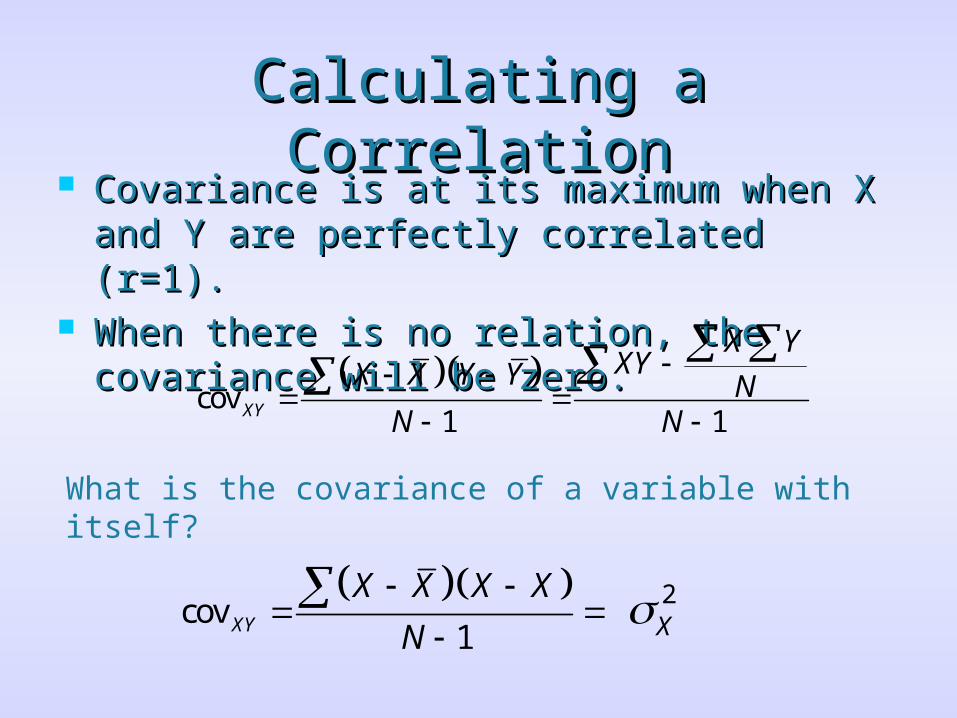
Calculating a CorrelationCalculating a Correlation Covariance is at its maximum when X and Covariance is at its maximum when X and
Y are perfectly correlated (r=1).Y are perfectly correlated (r=1). When there is no relation, the covariance When there is no relation, the covariance
will be zero.will be zero.
cov1 1XY
X YXYX X Y Y N
N N
What is the covariance of a variable with itself?
cov
1XY
X X X X
N
2
X
Calculating a CorrelationCalculating a Correlation
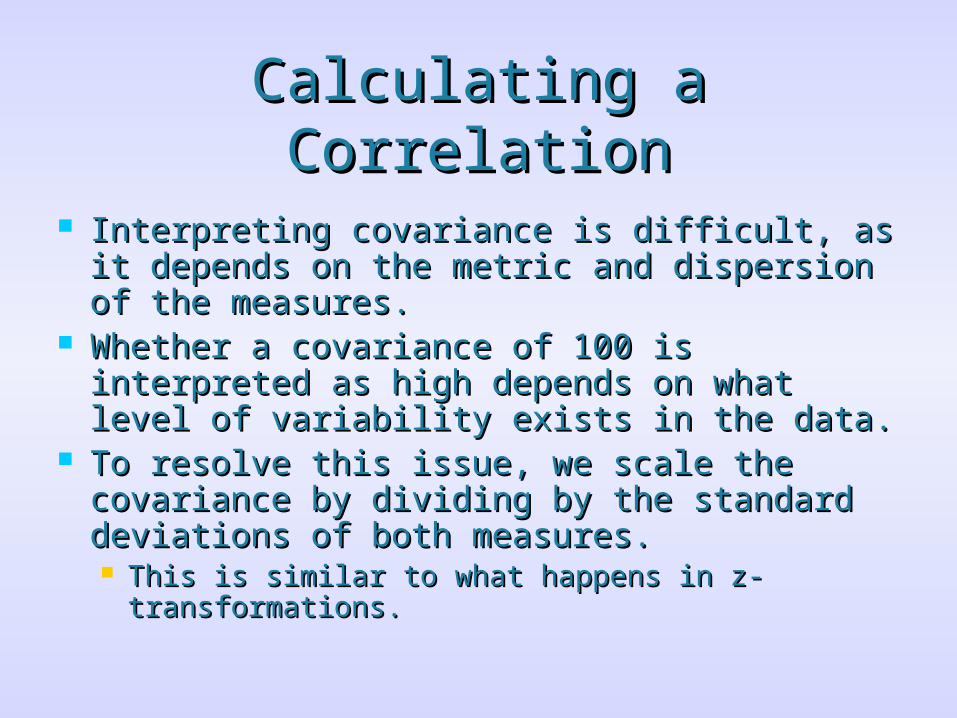
Interpreting covariance is difficult, as it Interpreting covariance is difficult, as it depends on the metric and dispersion of the depends on the metric and dispersion of the measures.measures.
Whether a covariance of 100 is interpreted Whether a covariance of 100 is interpreted as high depends on what level of variability as high depends on what level of variability exists in the data.exists in the data.
To resolve this issue, we scale the To resolve this issue, we scale the covariance by dividing by the standard covariance by dividing by the standard deviations of both measures.deviations of both measures. This is similar to what happens in z-This is similar to what happens in z-
transformations.transformations.
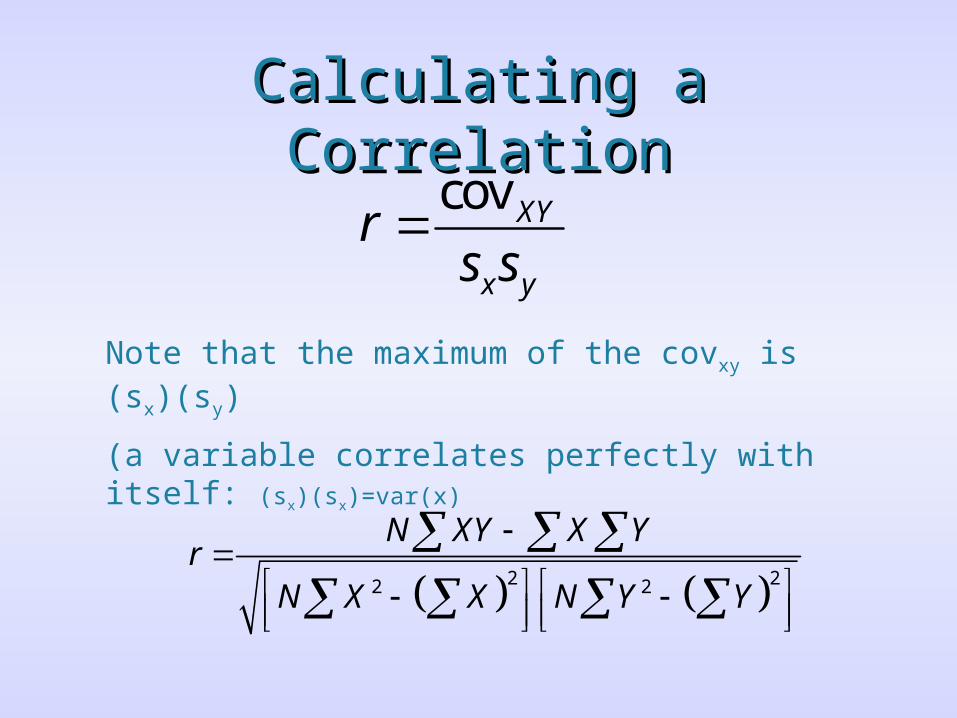
Calculating a CorrelationCalculating a Correlationcov XY
x y
rs s
Note that the maximum of the covxy is (sx)(sy)
(a variable correlates perfectly with itself: (sx)(sx)=var(x)
2 22 2
N XY X Yr
N X X N Y Y
Interpreting Pearson Interpreting Pearson CorrelationsCorrelations
Correlation coefficients do not directly Correlation coefficients do not directly translate into meaningful values.translate into meaningful values.
Higher absolute variables reflect Higher absolute variables reflect greater prediction accuracy.greater prediction accuracy. Put differently, they predict smaller errors Put differently, they predict smaller errors
of prediction or residuals in the scatterplot.of prediction or residuals in the scatterplot.
AppletApplet
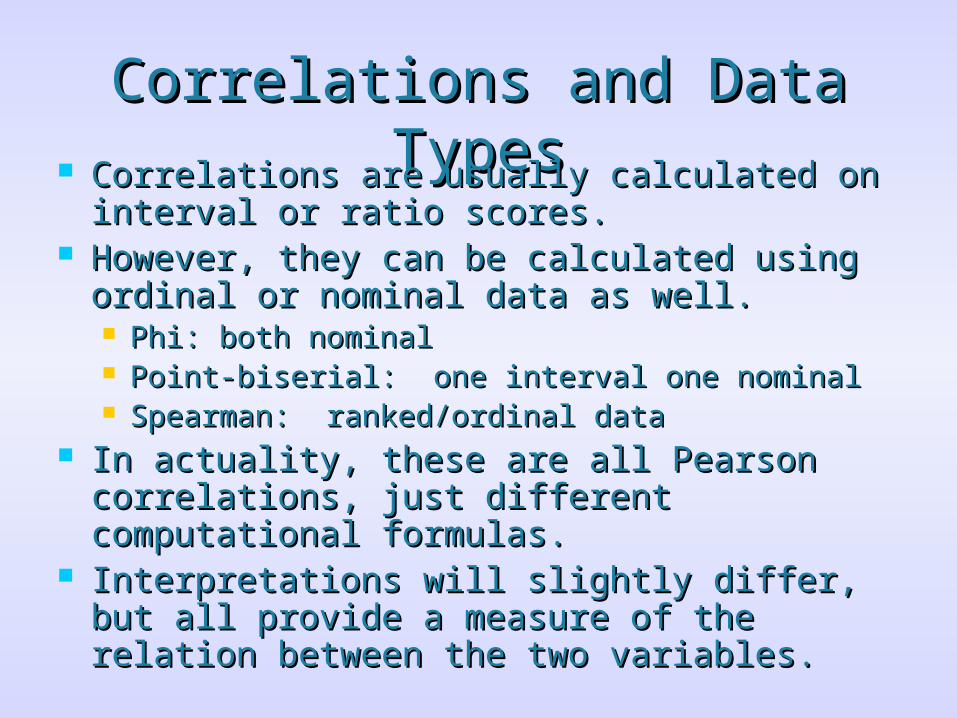
Correlations and Data TypesCorrelations and Data Types Correlations are usually calculated on Correlations are usually calculated on
interval or ratio scores.interval or ratio scores. However, they can be calculated using However, they can be calculated using
ordinal or nominal data as well.ordinal or nominal data as well. Phi: both nominalPhi: both nominal Point-biserial: one interval one nominalPoint-biserial: one interval one nominal Spearman: ranked/ordinal dataSpearman: ranked/ordinal data
In actuality, these are all Pearson In actuality, these are all Pearson correlations, just different computational correlations, just different computational formulas.formulas.
Interpretations will slightly differ, but all Interpretations will slightly differ, but all provide a measure of the relation between provide a measure of the relation between the two variables.the two variables.
Factors that Affect the Factors that Affect the CorrelationCorrelation
Range RestrictionsRange Restrictions
Heterogeneous SubsamplesHeterogeneous Subsamples
Extreme ObservationsExtreme Observations Two-dimensional outliersTwo-dimensional outliers
Range RestrictionsRange Restrictions
If the full range of values of a variable is If the full range of values of a variable is not included in the sample, the resulting not included in the sample, the resulting correlation coefficient may be attenuated.correlation coefficient may be attenuated.
For example, if only the upper range of SAT For example, if only the upper range of SAT scores are used to predict college GPA, the scores are used to predict college GPA, the relation may seem relatively small.relation may seem relatively small. SAT may explain a good deal of variability in SAT may explain a good deal of variability in
GPA’s, but not all. Within a small range of GPA’s, but not all. Within a small range of observed SAT scores, prediction may be observed SAT scores, prediction may be minimal.minimal.
AppletApplet
Heterogeneous SubsamplesHeterogeneous Subsamples
If the sample contains heterogeneous If the sample contains heterogeneous subsamples, the correlation coefficient subsamples, the correlation coefficient may be biased.may be biased. Heterogeneous subsamples are distinct groups Heterogeneous subsamples are distinct groups
that may possess different relations among the that may possess different relations among the variables (e.g., men vs. women)variables (e.g., men vs. women)
For example, one might investigate the For example, one might investigate the relation between number of dependents and relation between number of dependents and psychological wellbeing (this is made-up data).psychological wellbeing (this is made-up data).
AppletApplet
Extreme ValuesExtreme Values
Here again, outliers may cause havoc.Here again, outliers may cause havoc. Important to remember that we are now Important to remember that we are now
looking for outliers in 2 dimensions.looking for outliers in 2 dimensions.
For example, the following is For example, the following is hypothetical data on the relation of hypothetical data on the relation of liberal ideology to attitudes toward liberal ideology to attitudes toward gay marriage.gay marriage.
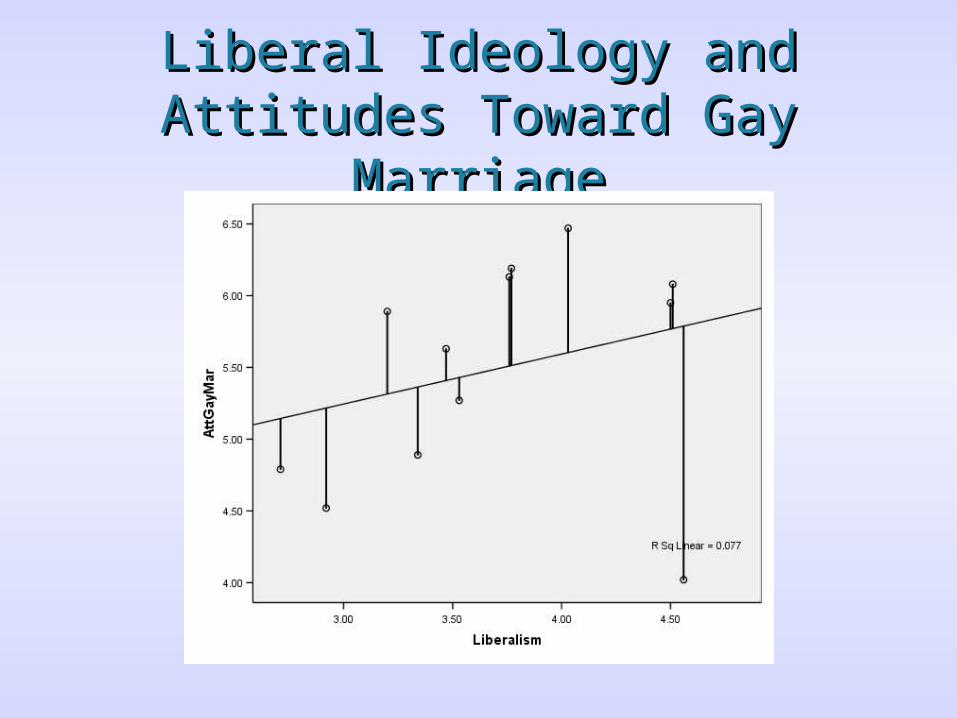
Liberal Ideology and Attitudes Liberal Ideology and Attitudes Toward Gay MarriageToward Gay Marriage
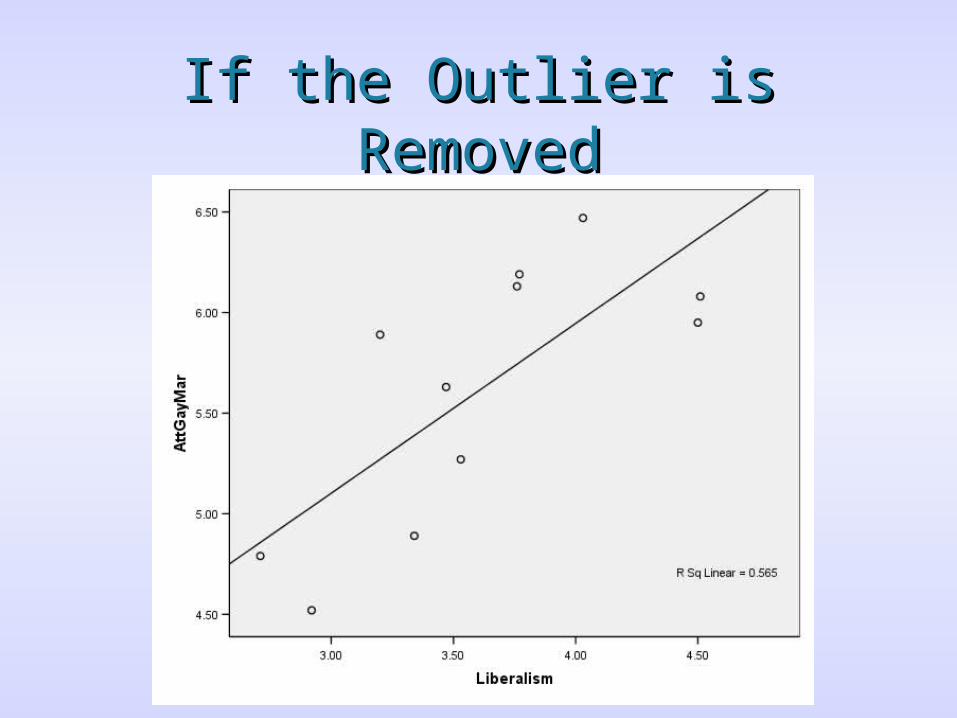
If the Outlier is RemovedIf the Outlier is Removed
Testing the Significance of a Testing the Significance of a CorrelationCorrelation
Follows the logic of null hypothesis testing.Follows the logic of null hypothesis testing. The null assumes that the correlation between the The null assumes that the correlation between the
two variables is zero in the population.two variables is zero in the population.
We want to test the probability of this hypothesis We want to test the probability of this hypothesis given the level of correlation we found in a sample.given the level of correlation we found in a sample.
Remember, even if the correlation is zero in the Remember, even if the correlation is zero in the population, it will not be zero in every sample population, it will not be zero in every sample drawn from the population due to sampling error.drawn from the population due to sampling error.
0
Testing the Significance of a Testing the Significance of a CorrelationCorrelation
Once we have an estimate of r, we turn to Once we have an estimate of r, we turn to the correlation table of critical values.the correlation table of critical values.
The degrees of freedom are N=2 when The degrees of freedom are N=2 when predicting one variable from another.predicting one variable from another. N=number of observations in the sample.N=number of observations in the sample.
We select an alpha level and then We select an alpha level and then determine if we can reject the null.determine if we can reject the null. What we are doing is comparing the size of the What we are doing is comparing the size of the
obtained correlation to the standard error of obtained correlation to the standard error of correlation coefficients.correlation coefficients.
Time for an example.Time for an example.


