2‑1 L EARNING O BJECTIVES LO1 Describe information conveyed by the financial statements. (p. 2-3) LO2 Explain and illustrate linkages among the four financial statements. (p. 2-20) LO3 Illustrate use of the financial statement effects template to summarize accounting transactions. (p. 2-22) Introducing Financial Statements and Transaction Analysis Module 2 APPLE The Financial Times reported in August of 1980 that: Apple Computer, the fast growing Californian manufacturer of small computers for the consumer, business and educational markets, is planning to go public later this year. [It] is the largest private manufacturer in the U.S. of small computers. Founded about five years ago as a small workshop business, it has become the second largest manufacturer of small com- puters, after the Radio Shack division of the Tandy company. On December 12, 1980, Apple had its initial public offering at a price of $22. During the next 24 years (through fiscal 2004), Apple reported cumulative income of $3.8 billion on $128.5 billion in sales, a 3% net profit margin, and its market capitalization (share price 3 common shares outstanding) was just over $15 million at the end of fiscal 2004. However, for its 2012 fiscal year alone, Apple reported income of $41.7 billion on sales of $156.5 billion, which represented a 26.6% net profit margin. In fact, over the past decade, Apple reported cumulative income of $103.2 billion on sales of $482.1 billion, which is a 21.4% profit margin. Its market capitalization at the end of fiscal 2012 was $627 billion, greater than Google, IBM, Microsoft, Oracle, Cisco, and Intel. Apple’s meteoric rise over that decade is the result of a number of iconic product introductions: iPod and iTunes in 2001, iPhone in 2007, and iPad in 2010. The rise in the mar- ket value of Apple stock has mirrored its product successes. However, 2012 saw a pullback in stock price as cash and other liquid nonproductive assets began to pile up; some saw Apple as a giant ship without a rudder. Information in financial statements helps us assess a company’s financial strength and judge the performance of managers and the company as a whole. This module defines and explains the components of each financial statement: the balance sheet, the income statement, the statement of cash flows, and the statement of stockhold- ers’ equity. We begin with a preview of Apple’s financial condition and performance through a review of its financial statements. Apple’s balance sheet is quite liquid due to a solid record of generating operating cash flow. Apple ended its 2012 year with $121 billion of cash and marketable investments. 2009 2010 2011 2012 2013 $700 $600 $500 $400 $300 $200 $100 $0 $800 Apple Stock Price
Transcript
2‑1
Learning Objectives
LO1 Describe information conveyed by the financial statements. (p. 2-3)
LO2 Explain and illustrate linkages among the four financial statements. (p. 2-20)
LO3 Illustrate use of the financial statement effects template to summarize accounting transactions. (p. 2-22)
Introducing Financial Statements and Transaction Analysis
M o d u l e
2appLe
The Financial Times reported in August of 1980 that:
Apple Computer, the fast growing Californian manufacturer of small computers for the consumer, business and educational markets, is planning to go public later this year. [It] is the largest private manufacturer in the U.S. of small computers. Founded about five years ago as a small workshop business, it has become the second largest manufacturer of small com-puters, after the Radio Shack division of the Tandy company.
On December 12, 1980, Apple had its initial public offering at a price of $22. During the next 24 years (through fiscal 2004), Apple reported cumulative income of $3.8 billion on $128.5 billion in sales, a 3% net profit margin, and its market capitalization (share price 3 common shares outstanding) was just over $15 million at the end of fiscal 2004. However, for its 2012 fiscal year alone, Apple reported income of $41.7 billion on sales of $156.5 billion, which represented a 26.6% net profit margin. In fact, over the past decade, Apple reported cumulative income of $103.2 billion on sales of $482.1 billion, which is a 21.4% profit margin. Its market capitalization at the end of fiscal 2012 was $627 billion, greater than google, IBM, Microsoft, oracle, Cisco, and Intel. Apple’s meteoric rise over that decade is the result of a number of iconic product introductions: iPod and iTunes in 2001, iPhone in 2007, and iPad in 2010. The rise in the mar-ket value of Apple stock has mirrored its product successes.
However, 2012 saw a pullback in stock price as cash and other liquid nonproductive assets began to pile up; some saw Apple as a giant ship without a rudder.
Information in financial statements helps us assess a company’s financial strength and judge the performance of managers and the company as a whole. This module defines and explains the components of each financial statement: the balance sheet, the income statement, the statement of cash flows, and the statement of stockhold-ers’ equity. We begin with a preview of Apple’s financial condition and performance through a review of its financial statements.
Apple’s balance sheet is quite liquid due to a solid record of generating operating cash flow. Apple ended its 2012 year with $121 billion of cash and marketable investments.
2009 2010 2011 2012 2013
$700$600$500$400$300$200$100
$0
$800
Apple Stock Price
2‑2
Cou
rtes
y of
Get
ty i
mag
es
Liquidity is important for companies like Apple that must react quickly to opportunities and changing market condi-tions. Like other technology companies, much of Apple’s production is subcontracted. Consequently, Apple’s property, plant and equipment make up only 9% of its assets.
On the financing side of its balance sheet, two-thirds of Apple’s resources come from owner financing: from com-mon stock sold to shareholders and from past profits that have been reinvested in the business. Technology compa-nies such as Apple, which have uncertain product life-cycles and highly volatile cash flows, strive to avoid high debt levels that might cause financial problems in a business downturn. Apple’s nonowner financing consists of low-cost credit from suppliers (accounts payable) and unpaid over-head expenses (accrued liabilities).
Consider Apple’s income statement: driven by the pop-ularity and high profit margins of iPods and iPhones, Apple recently reported over $55 billion of operating income. This is impressive given that Apple spends over $3 billion on research and development and runs expensive advertising campaigns.
Yet, companies cannot live by profits alone. It is cash that pays bills. Profits and cash flow reflect two different concepts, each providing a different perspective on com-pany performance. Apple generated over $50 billion of cash flow from operating activities, and invested most of this
cash flow in marketable securities. We review Apple’s cash flows in this module.
In March 2012, Apple announced that it would pay a dividend for the first time since 1995 and paid out $2.5 bil-lion in dividends during the year. The company did not sell any additional stock to the public during the year: newly issued common stock relates primarily to executive stock options. These capital transactions are reported in the state-ment of stockholders’ equity.
While it is important to understand what is reported in each of the four financial statements, it is also important to know what is not reported. Apple’s many intangible assets create a barrier to competition that allows it to earn above-average profits. This represents a valuable resource to Apple, but it is not always reported as an asset on Apple’s balance sheet. Consider another example. Apple’s software engineers write code and create software that will generate profits for Apple in the future. While this represents a valu-able resource to Apple, it is not reported on the balance sheet because Apple expenses the software engineers’ salaries when the code is written. We discuss these and other issues relating to asset recognition and measurement in this module.
Sources: Apple 10-K; Apple Annual Report; Financial Times, 1980; Fortune, 2012.
This module explains further the details of financial statements and how those statements articulate (relate to each other). Transaction analysis and accounting adjustments conclude the module.
BALANCE SHEETThe balance sheet is divided into three sections: assets, liabilities, and stockholders’ equity. it provides information about the resources available to management and the claims against those resources by creditors and stockholders. The balance sheet reports the assets, liabilities, and equity at a point in time. Balance sheet accounts are called “permanent accounts” in that they carry over from period to period; that is, the ending balance from one period becomes the beginning balance for the next.
Balance Sheet and the Flow of CostsCompanies incur costs to acquire resources that will be used in operations. every cost creates either an im-mediate or a future economic benefit. Determining when the company will realize the benefit from a cost is paramount. When a cost creates an immediate benefit, such as gasoline used in delivery vehicles, the company records the cost in the income statement as an expense. When a cost creates a future economic benefit, such as inventory to be resold or equipment to be later used for manufacturing, the company records the cost on the balance sheet as an asset. indeed, the definition of an asset is “a future economic benefit.” An asset remains on the company’s balance sheet until it is used up. When an asset is used up, the company realizes the economic benefit from the asset; that is, there is no future economic benefit left so there is no asset left. Then, the asset’s cost is transferred from the balance sheet to the income statement where it is labeled an expense. This is why purchased assets are sometimes referred to as future expenses.
Companies expense certain costs, such as advertising, as they are incurred because even though the costs will likely bring future economic benefits, the related asset cannot be reliably measured. ex-hibit 2.1 illustrates how costs flow from the balance sheet to the income statement.
EXHIBIT 2.1 Flow of Costs
Balance Sheet IncomeStatementAssets
Liabilities
EquityAssets
used upCosts notcapitalized
Revenues
Expenses
Income
Costscapitalized
$ Costs
LO1 Describe information conveyed by the financial statements.
MODULE ORGANIzATION Introducing Financial statements and Transaction Analysis
Financial statements
■ Balance Sheet
■ Income Statement
■ Statement of Stockholders’ Equity
■ Statement of Cash Flows
Articulation of Financial statements
■ Retained Earnings Reconciliation
■ Financial Statement Linkages
Transaction Analysis
■ Recording Transactions
■ Accounting Adjustments
■ Constructing Financial Statements
2‑3 Module 2 | Introducing Financial Statements and Transaction Analysis
All costs are either held on the balance sheet or are transferred to the income statement. When costs are recorded on the balance sheet (referred to as capitalized), assets are reported and expenses are deferred to a later period. Once the company receives benefits from the assets, the related costs are transferred from the balance sheet to the income statement. At that point, assets are reduced and expenses are recorded in the current period. Tracking the flow of costs from the balance sheet to the income state-ment is an important part of accounting. GAAP allows companies some flexibility in transferring costs. As such, there is potential for abuse, especially when managers confront pressures to achieve income targets.
Corporate scandals involving WorldCom and Enron regrettably illustrate improper cost transfers designed to achieve higher profit levels. neither company transferred costs from the balance sheet to the income statement as quickly as they should have. This had the effect of overstating assets on the balance sheet and net income on the income statement. in subsequent litigation, the seC and the Justice Department contended that these companies intentionally overstated net income to boost stock prices. A number of senior executives from both enron and WorldCom were sentenced to lengthy jail terms as a result of their criminal actions.
What does GAAP advise about the transfer of costs? Asset costs should transfer to the income state-ment when the asset no longer has any future economic benefit (which is when it no longer meets the defi-nition of an asset). For example, when inventories are purchased or manufactured, their cost is recorded on the balance sheet as an asset called inventories. When inventories are sold, they no longer have an economic benefit to the company and their cost is transferred to the income statement in an expense called cost of goods sold. Cost of goods sold represents the cost of inventories sold during that period. This ex-pense is recognized in the same period as the revenue generated from the sale. As another example, con-sider equipment costs. When a company acquires equipment, the cost of the equipment is recorded on the balance sheet in an asset called equipment (often included in the general category of property, plant, and equipment, or PPe). When equipment is used in operations, a portion of the acquisition cost is transferred to the income statement to match against the sales the equipment helped generate. To illustrate, if an asset costs $100,000, and 10% of it is used up this period in operating activities, then $10,000 of the asset’s cost is transferred from the balance sheet to the income statement. This process is called depreciation and the expense related to this transfer of costs is called depreciation expense.
AssetsCompanies acquire assets to yield a return for their shareholders. Assets are expected to produce eco-nomic benefits in the form of revenues, either directly, such as with inventory, or indirectly, such as with a manufacturing plant that produces inventories for sale. To create stockholder value, assets must yield income that is in excess of the cost of the funds used to acquire the assets.
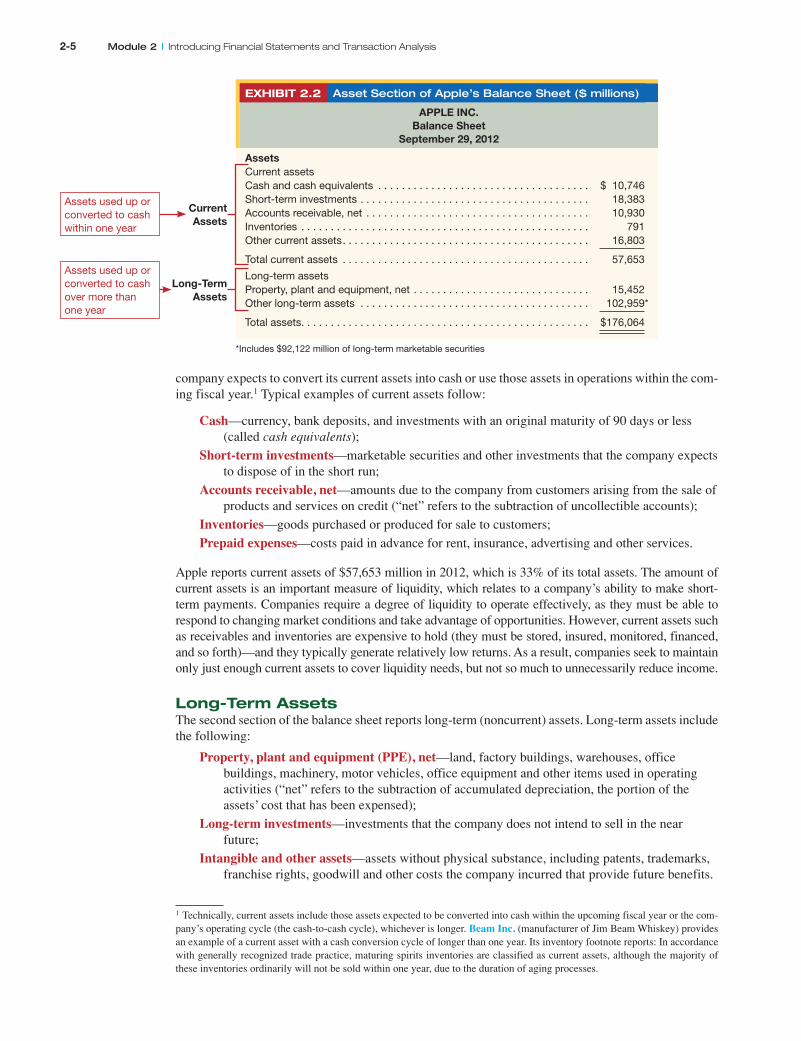
The asset section of the Apple balance sheet is shown in exhibit 2.2. Apple reports $176,064 million of total assets as of september 29, 2012, its year-end. Amounts reported on the balance sheet are at a point in time—that is, the close of business on the day of the report. An asset must possess two characteristics to be reported on the balance sheet:
1. it must be owned (or controlled) by the company.
2. it must confer expected future economic benefits that result from a past transaction or event.
The first requirement, owning or controlling an asset, implies that a company has legal title to the asset, such as the title to property, or has the unrestricted right to use the asset, such as a lease on the property. The second requirement implies that a company expects to realize a benefit from the asset. Benefits can be cash inflows from the sale of an asset or from sales of products produced by the asset. Benefits also can refer to the receipt of other assets such as an account receivable from a credit sale. Or, benefits can arise from future services the company will receive, such as prepaying for a year-long insurance policy. This require-ment also implies that we cannot record an asset such as a brand name without a transaction to acquire it.
Current AssetsThe balance sheet lists assets in order of decreasing liquidity, which refers to the ease of converting noncash assets into cash. The most liquid assets are called current assets and they are listed first. A
Module 2 | Introducing Financial Statements and Transaction Analysis 2‑4
company expects to convert its current assets into cash or use those assets in operations within the com-ing fiscal year.1 Typical examples of current assets follow:
Cash—currency, bank deposits, and investments with an original maturity of 90 days or less (called cash equivalents);
Short-term investments—marketable securities and other investments that the company expects to dispose of in the short run;
Accounts receivable, net—amounts due to the company from customers arising from the sale of products and services on credit (“net” refers to the subtraction of uncollectible accounts);
Inventories—goods purchased or produced for sale to customers;
Prepaid expenses—costs paid in advance for rent, insurance, advertising and other services.
Apple reports current assets of $57,653 million in 2012, which is 33% of its total assets. The amount of current assets is an important measure of liquidity, which relates to a company’s ability to make short-term payments. Companies require a degree of liquidity to operate effectively, as they must be able to respond to changing market conditions and take advantage of opportunities. however, current assets such as receivables and inventories are expensive to hold (they must be stored, insured, monitored, financed, and so forth)—and they typically generate relatively low returns. As a result, companies seek to maintain only just enough current assets to cover liquidity needs, but not so much to unnecessarily reduce income.
Long-Term AssetsThe second section of the balance sheet reports long-term (noncurrent) assets. long-term assets include the following:
Property, plant and equipment (PPE), net—land, factory buildings, warehouses, office buildings, machinery, motor vehicles, office equipment and other items used in operating activities (“net” refers to the subtraction of accumulated depreciation, the portion of the assets’ cost that has been expensed);
Long-term investments—investments that the company does not intend to sell in the near future;
Intangible and other assets—assets without physical substance, including patents, trademarks, franchise rights, goodwill and other costs the company incurred that provide future benefits.
1 Technically, current assets include those assets expected to be converted into cash within the upcoming fiscal year or the com-pany’s operating cycle (the cash-to-cash cycle), whichever is longer. Beam Inc. (manufacturer of Jim Beam Whiskey) provides an example of a current asset with a cash conversion cycle of longer than one year. its inventory footnote reports: in accordance with generally recognized trade practice, maturing spirits inventories are classified as current assets, although the majority of these inventories ordinarily will not be sold within one year, due to the duration of aging processes.
EXHIBIT 2.2 Asset Section of Apple’s Balance Sheet ($ millions)
*Includes $92,122 million of long-term marketable securities
Current Assets
Assets used up or converted to cash within one year
Assets used up or converted to cash over more than one year
Long‑Term Assets
2‑5 Module 2 | Introducing Financial Statements and Transaction Analysis
long-term assets are not expected to be converted into cash for some time and are, therefore, listed after current assets.
Measuring AssetsMost assets are reported at their original acquisition costs, or historical costs, and not at their current market values. The concept of historical costs is not without controversy. The controversy arises be-cause of the trade-off between the relevance of current market values for many business decisions and the reliability of historical cost measures.
To illustrate, imagine we are financial analysts and want to determine the value of a company. The company’s value equals the value of its assets less the value of its liabilities. Current market values of company assets (and liabilities) are more informative and relevant to our analysis than are historical costs. But how can we determine market values? For some assets, like marketable securities, values are readily obtained from online quotes or from sources such as The Wall Street Journal. For other assets like property, plant, and equipment, their market values are far more subjective and difficult to estimate. it would be easier for us, as analysts, if companies reported credible market values on their balance sheet. however, allowing companies to report estimates of asset market values would intro-duce potential bias into financial reporting. Consequently, companies continue to report historical costs because the loss in reliability from using subjective market values on the balance sheet is considered to be greater than the loss in relevance from using historical costs.
it is important to realize that balance sheets only include items that can be reliably measured. if a company cannot assign a monetary amount to an asset with relative certainty, it does not recognize an asset on the balance sheet. This means that there are, typically, considerable “assets” that are not reflected on a balance sheet. For example, the well-known apple image is absent from Apple’s balance sheet. This image is called an “unrecognized intangible asset.” Both requirements for an asset are met: Apple owns the brand and it expects to realize future benefits from the logo. The problem is reliably measuring the expected future benefits to be derived from the image. intangible assets such as the Coke bottle silhouette, the iPod brandname, and the nike swoosh also are not on their companies’ respective balance sheets. Companies only report intangible assets on the balance sheet when the assets are pur-chased. Any internally created intangible assets are not reported on a balance sheet. A sizable amount of resources is, therefore, potentially omitted from companies’ balance sheets.
excluded intangible assets often relate to knowledge-based (intellectual) assets, such as a strong management team, a well-designed supply chain, or superior technology. Although these intangible assets confer a competitive advantage to the company, and yield above-normal income (and clear eco-nomic benefits to those companies), they cannot be reliably measured. This is one reason why compa-nies in knowledge-based industries are so difficult to analyze and value.
Presumably, however, companies’ market values reflect these excluded intangible assets. This can yield a large difference between the market value and the book (reported) value of a company’s eq-uity. This is illustrated in the following ratios of market value to book value (averages from fiscal 2012 year-ends): Apple is 5.3 (computed as $626,550/$118,210) and Target is 2.4 (computed as [645.294 3 $61.15]/$16,558). These market-to-book values (ratios) are greater for companies with large knowledge-based assets that are not reported on the balance sheet, but are reflected in company market value (such as with Apple). Companies such as Target have fewer of these assets. hence, their balance sheets usually reflect a greater portion of company value.
Liabilities and Equityliabilities and stockholders’ equity represent the sources of capital the company uses to finance the acquisition of assets. in general, liabilities represent a company’s future economic sacrifices. liabilities are borrowed funds such as accounts payable and obligations to lenders. They can be interest-bearing or non-interest-bearing.
equity represents capital that has been invested by the stockholders, either directly via the pur-chase of stock, or indirectly in the form of retained earnings that reflect earnings that are reinvested in the business and not paid out as dividends.
The liabilities and stockholders’ equity sections of the Apple balance sheet are reproduced in ex-hibit 2.3. Apple reports $57,854 million of total liabilities and $118,210 million of stockholders’ equity as of its 2012 year-end.
Module 2 | Introducing Financial Statements and Transaction Analysis 2‑6
EXHIBIT 2.3 Liabilities and Equity Sections of Apple’s Balance Sheet ($ millions)
Why would Apple obtain capital from both borrowed funds and stockholders? Why not just one or the other? The answer lies in their relative costs and the contractual agreements that Apple has with each.
Creditors have the first claim on the assets of the company. As a result, their position is not as risky and, accordingly, their expected return on investment is less than that required by stockholders. Also, interest is tax deductible whereas dividends are not. This makes debt a less expensive source of capital than equity. so, then, why should a company not finance itself entirely with borrowed funds? The rea-son is that borrowed funds entail contractual obligations to repay the principal and interest on the debt. if a company cannot make these payments when they come due, creditors can force the company into bankruptcy and potentially put the company out of business. stockholders, in contrast, cannot require repurchase of their stock, or even the payment of dividends. Thus, companies take on a level of debt that they can comfortably repay at reasonable interest costs. The remaining balance required to fund business activities is financed with more costly equity capital.
Current LiabilitiesThe balance sheet lists liabilities in order of maturity. Obligations that must be settled within one year are called current liabilities. examples of common current liabilities follow:
Accounts payable—amounts owed to suppliers for goods and services purchased on credit.
Accrued liabilities—obligations for expenses that have been incurred but not yet paid; examples are accrued wages payable (wages earned by employees but not yet paid), accrued interest payable (interest that is owing but has not been paid), and accrued income taxes (taxes due).
Unearned revenues—obligations created when the company accepts payment in advance for goods or services it will deliver in the future; also called advances from customers, customer deposits, or deferred revenues.
Short-term notes payable—short-term debt payable to banks or other creditors.
Current maturities of long-term debt—principal portion of long-term debt that is due to be paid within one year.
Apple reports current liabilities of $38,542 million on its 2012 balance sheet. Accounts payable arise when one company purchases goods or services from another company.
Typically, sellers offer credit terms when selling to other companies, rather than expecting cash on
Liabilities
Liabilities requiring payment within one year
Liabilities not requiring payment within one year
stockholders’ Equity
2‑7 Module 2 | Introducing Financial Statements and Transaction Analysis
delivery. The seller records an account receivable and the buyer records an account payable. Apple re-ports accounts payable of $21,175 million as of the balance sheet date. Accounts payable are relatively uncomplicated liabilities. A transaction occurs (inventory purchase), a bill is sent, and the amount owed is reported on the balance sheet as a liability.
Apple’s accrued liabilities total $17,367 million. Accrued liabilities refer to incomplete trans-actions. For example, employees work and earn wages, but usually are not paid until later, such as several days after the period-end. Wages must be reported as expense in the period that employees earn them because those wages payable are obligations of the company and a liability (wages pay-able) must be set up on the balance sheet. This is an accrual. Other common accruals include the recording of liabilities such as rent and utilities payable, taxes payable, and interest payable on bor-rowings. All of these accruals involve recognition of expense in the income statement and a liability on the balance sheet.
Net working capital, or simply working capital, reflects the difference between current assets and current liabilities and is defined as follows:
Net working capital 5 Current assets 2 Current liabilities
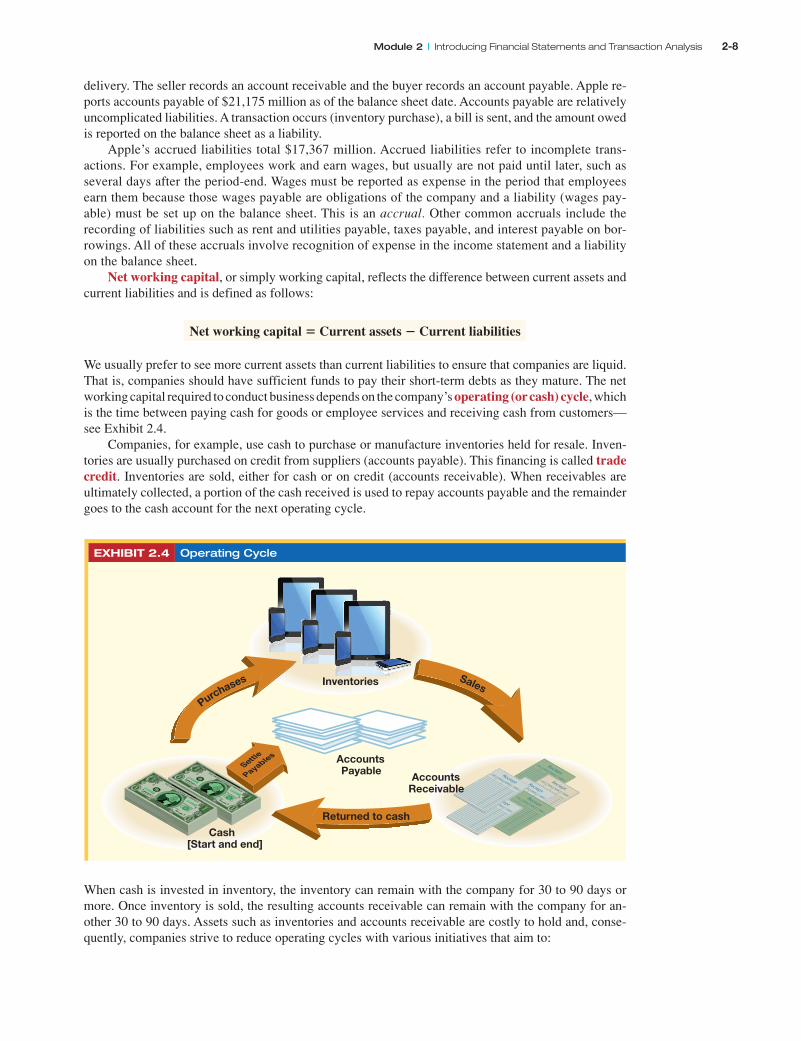
We usually prefer to see more current assets than current liabilities to ensure that companies are liquid. That is, companies should have sufficient funds to pay their short-term debts as they mature. The net working capital required to conduct business depends on the company’s operating (or cash) cycle, which is the time between paying cash for goods or employee services and receiving cash from customers— see exhibit 2.4.
Companies, for example, use cash to purchase or manufacture inventories held for resale. inven-tories are usually purchased on credit from suppliers (accounts payable). This financing is called trade credit. inventories are sold, either for cash or on credit (accounts receivable). When receivables are ultimately collected, a portion of the cash received is used to repay accounts payable and the remainder goes to the cash account for the next operating cycle.
EXHIBIT 2.4 Operating Cycle
Cash[Start and end]
Inventories
Accounts Payable
Purchases
Returned to cash
Sales
AccountsReceivable
When cash is invested in inventory, the inventory can remain with the company for 30 to 90 days or more. Once inventory is sold, the resulting accounts receivable can remain with the company for an-other 30 to 90 days. Assets such as inventories and accounts receivable are costly to hold and, conse-quently, companies strive to reduce operating cycles with various initiatives that aim to:
Module 2 | Introducing Financial Statements and Transaction Analysis 2‑8
■ Decrease accounts receivable by better collection procedures
■ reduce inventory levels by improved production systems and management
■ increase trade credit to minimize the cash invested in inventories
Analysts often use the “cash conversion cycle” to evaluate company liquidity. The cash conversion cycle is the number of days the company has its cash tied up in receivables and inventories, less the number of days of trade credit provided by company suppliers.
Noncurrent LiabilitiesNoncurrent liabilities are obligations due after one year. examples of noncurrent liabilities follow:
Long-term debt—amounts borrowed from creditors that are scheduled to be repaid more than one year in the future; any portion of long-term debt that is due within one year is reclassified as a current liability called current maturities of long-term debt. long-term debt includes bonds, mortgages, and other long-term loans.
Other long-term liabilities—various obligations, such as pension liabilities and long-term tax liabilities, that will be settled a year or more into the future.
Apple reports $19,312 million of noncurrent liabilities. As is typical of high-tech companies, Apple has no long-term debt. instead, all of its noncurrent liabilities relate to deferred revenue and deferred taxes. Deferred (unearned) revenue arises when a company receives cash in advance of providing a good or service.
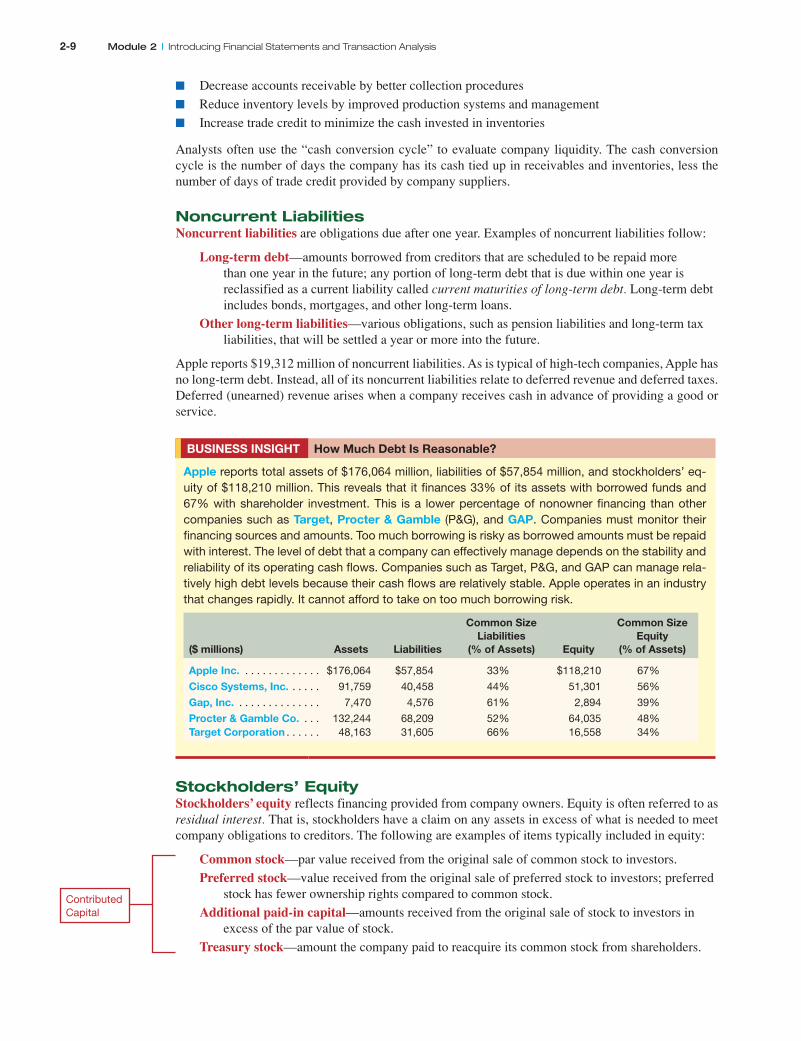
BusInEss InsIgHT How Much Debt Is Reasonable?
Apple reports total assets of $176,064 million, liabilities of $57,854 million, and stockholders’ eq-uity of $118,210 million. This reveals that it finances 33% of its assets with borrowed funds and 67% with shareholder investment. This is a lower percentage of nonowner financing than other companies such as Target, Procter & gamble (P&G), and gAP. Companies must monitor their financing sources and amounts. Too much borrowing is risky as borrowed amounts must be repaid with interest. The level of debt that a company can effectively manage depends on the stability and reliability of its operating cash flows. Companies such as Target, P&G, and GAP can manage rela-tively high debt levels because their cash flows are relatively stable. Apple operates in an industry that changes rapidly. It cannot afford to take on too much borrowing risk.
($ millions)
Assets
Liabilities
Common size Liabilities
(% of Assets)
Equity
Common size Equity
(% of Assets)
Apple Inc. . . . . . . . . . . . . . $176,064 $57,854 33% $118,210 67%
Stockholders’ EquityStockholders’ equity reflects financing provided from company owners. equity is often referred to as residual interest. That is, stockholders have a claim on any assets in excess of what is needed to meet company obligations to creditors. The following are examples of items typically included in equity:
Common stock—par value received from the original sale of common stock to investors.
Preferred stock—value received from the original sale of preferred stock to investors; preferred stock has fewer ownership rights compared to common stock.
Additional paid-in capital—amounts received from the original sale of stock to investors in excess of the par value of stock.
Treasury stock—amount the company paid to reacquire its common stock from shareholders.
Contributed Capital
2‑9 Module 2 | Introducing Financial Statements and Transaction Analysis
Retained earnings—accumulated net income (profit) that has not been distributed to stockholders as dividends.
Accumulated other comprehensive income or loss—accumulated changes in asset and liability fair values that are not reported in the income statement.
The equity section of a balance sheet consists of two basic components: contributed capital and earned capital. Contributed capital is the net funding that a company received from issuing and reacquiring its equity shares; that is, the funds received from issuing shares less any funds paid to repurchase such shares. Apple reports $118,210 million in total stockholders’ equity. its contributed capital is $16,422 million.
Apple’s common stock is “no par” (see exhibit 2.3). This means that Apple records all of its contrib-uted capital in the common stock account and records no additional paid-in capital. Apple’s stockholders (via its board of directors) have authorized it to issue up to 1.8 billion shares of common stock. To date, it has sold (issued) 939,208,000 shares for total proceeds of $16,422 million, or $17.48 per share, on aver-age. Apple has repurchased no shares of stock to date.
Earned capital is the cumulative net income (loss) that has been retained by the company (not paid out to stockholders as dividends). Apple’s earned capital (titled retained earnings) totals $101,289 million as of its 2012 year-end. its other equity accounts total $499 million.
AnALysIs InsIgHT Common size Balance sheet
One tool for analyzing a company’s balance sheet is the common size balance sheet. This is a balance sheet where each item is recast as a percent of total assets. It is called common size because each item is scaled by a common denominator. Common sizing the balance sheet enables us to perform the following types of analyses:
■ Compare a company’s balance sheets across two or more years. Companies provide side-by-side balance sheets for two years and the Form 10-K often includes an 11-year history of key balance sheet accounts. If the company has grown or shrunk in size over time, compar-ing dollars (or other currency) masks shifts in relative size of balance sheet items. Percent-ages reveal a more accurate picture.
■ Compare two or more companies’ balance sheets. The common sizing eliminates size differ-ences among companies—we can compare a small firm to a large firm because each asset, liability, and equity account is expressed in percentage terms. The other benefit is that com-mon sizing is unit free so we can compare companies that report in different currencies.
■ Compare balance sheets to an industry average or some other benchmark. The percentages create a common basis for comparison and this can help assess a particular company’s financial position relative to others in the same industry.
Retained EarningsThere is an important relation for retained earnings that reconciles its beginning balance and its ending balance as follows:
Beginning retained earnings
1 Net income (or 2 net loss)
2 Dividends
5 Ending retained earnings
This is a useful relation to remember. Apple’s retained earnings increases (or decreases) each year by the amount of its reported net income (loss) minus its dividends. (There are other items that can impact retained earnings that we discuss in later modules.) After we explain the income statement, we will revisit this relation and show how retained earnings link the balance sheet and income statement.
Book Value vs Market Value stockholders’ equity is the “value” of the company determined by GAAP and is commonly referred to as the company’s book value. This value is different from a compa-ny’s market value (market capitalization or market cap), which is computed by multiplying the number of outstanding common shares by the company’s stock price. We can compute Apple’s market cap by
Earned Capital
Module 2 | Introducing Financial Statements and Transaction Analysis 2‑10
multiplying its outstanding shares at september 29, 2012, (939,208,000 shares) by its stock price on that date ($667.10), which equals $626.55 billion. This is considerably larger than its book value of equity on that date of $118.2 billion. Book value and market value can differ for several reasons, mostly related to the following:
■ GAAP generally reports assets and liabilities at historical costs, whereas the market attempts to estimate fair market values.
■ GAAP excludes resources that cannot be reliably measured (due to the absence of a past transac-tion or event) such as talented management, employee morale, recent innovations and successful marketing, whereas the market attempts to value these.
■ GAAP does not consider market differences in which companies operate, such as competitive conditions and expected changes, whereas the market attempts to factor in these differences in determining value.
■ GAAP does not usually report expected future performance, whereas the market attempts to pre-dict and value future performance.
Presently for u.s. companies, book value is, on average, about two-thirds of market value (yielding a 1.5 market-to-book ratio). This means that the market has drawn on information in addition to that provided in the balance sheet and income statement in valuing companies’ stock. A major part of this information is in financial statement notes, but not all. it is important to understand that, eventually, all factors determining company market value are reflected in financial statements and book value. Assets are eventually sold and liabilities are settled. Moreover, talented management, employee morale, technological innovations, and successful marketing are eventually recognized in reported profit. The difference between book value and market value is one of timing.
BusInEss InsIgHT Apple’s Market and Book values
Apple’s market value has historically exceeded its book value of equity (see graph below). Much of Apple’s market value derives from intangible assets, such as brand equity, that are not fully reflected on its balance sheet, and from favorable expectations of future financial performance (particularly in recent years). Apple has incurred many costs, such as R&D, advertising, and promotion, that will probably yield future economic benefits. However, Apple expensed these costs (did not capitalize them as assets) because their fu-ture benefits were uncertain and, therefore, could not be reliably measured. Companies capitalize intangible assets only when those assets are purchased, and not when they are internally devel-oped. Consequently, Apple’s bal-ance sheet and the balance sheets of many knowledge-based com-panies are, arguably, less informa-tive about company value.
REsEARCH InsIgHT Market‑to‑Book Ratio
The market-to-book ratio, also called price-to-book, refers to a company’s market value divided by its book (equity) value—it is also computed as stock price per share divided by book value per share. Re-search shows that the market-to-book ratio exhibits considerable variability over time. Specifically, over the past few decades, the median (50th percentile) market-to-book ratio was less than 1.0 during the mid-1970s, over 2.0 during the mid-1990s, and often between 1.0 and 2.0 during the 1960s and 1980s.
$0
$100
$200
$300
$400
$500
$600
$700
20122011201020092008
$ pe
r sha
re
Apple’s Market and Book Value
Book ValueMarket Value
2‑11 Module 2 | Introducing Financial Statements and Transaction Analysis
INCOME STATEMENTThe income statement reports revenues earned during a period, the expenses incurred to produce those revenues, and the resulting net income or loss. The general structure of the income statement follows:
Revenues
2 Cost of goods sold
Gross profit (also titled, Gross margin)
2 Operating expenses
Operating profit (also titled, Operating income)
2 Nonoperating expenses (1 Nonoperating revenues)
2 Tax expense
Income from continuing operations
1/2 Nonrecurring items, net of tax
5 Net income
2 Net income attributable to noncontrolling interest
5 Net income attributable to ‘parent’ stockholders
Apple’s income statement from its 2012 10-K is shown in exhibit 2.5. Apple reports net income of $41,733 million on sales of $156,508 million. This means that about $0.27 of each dollar of sales is brought down to the bottom line, computed as $41,733 million divided by $156,508 million. Apple’s net income margin is higher than that of the average publicly-traded company, which reports about $0.06 in profit for each sales dollar. The remaining $0.73 of each sales dollar for Apple (computed as $1 minus $0.27) is consumed by costs incurred to generate sales. These costs include production costs (cost of sales), wages, advertising, research and development, equipment costs (such as depreciation), and taxes.
To analyze an income statement we must understand some terminology. Revenues (sales) are increases in net assets (assets less liabilities) as a result of ordinary operating activities. Expenses are decreases in net assets used to generate revenues, including costs of sales, operating costs like wages and advertising (usually titled selling, general, and administrative expenses or sG&A), and nonoper-ating costs like interest on debt. The difference between revenues and expenses is net income when revenues exceed expenses, or net loss when expenses exceed revenues. The terms income, profit, and earnings are used interchangeably (as are revenues and sales).
Module 2 | Introducing Financial Statements and Transaction Analysis 2‑12
Operating expenses are the usual and customary costs that a company incurs to support its operating activities. Those include cost of goods sold, selling expenses, depreciation expense, and research and development expense. not all of these expenses require a cash outlay; for example, depreciation expense is a noncash expense, as are many liabilities such as wages payable, that rec-ognize the expense in advance of cash payment. Nonoperating expenses relate to the company’s financing and investing activities, and include interest expense, interest or dividend income, and gains and losses from the sale of securities. Business decision makers and analysts usually seg-regate operating and nonoperating activities as they offer different insights into company perfor-mance and condition.
MAnAgERIAL DECIsIon you Are the securities Analyst
You are analyzing the performance of a company that hired a new CEO during the current year. The current year’s income statement includes an expense labeled “asset write-offs.” Write-offs repre-sent the accelerated transfer of costs from the balance sheet to the income statement. Are you concerned about the legitimacy of these expenses? Why or why not? [Answer, p. 2-35]
Recognition of Revenues and ExpensesAn important consideration in preparing the income statement is when to recognize revenues and expenses. For many revenues and expenses, the decision is easy. When a customer purchases grocer-ies, pays with a check, and walks out of the store with the groceries, we know that the sale is made and revenue should be recognized. Or, when companies receive and pay an electric bill with a check, they have clearly incurred an expense that should be recognized.
however, should Apple recognize revenue when it sells iPods to a retailer that does not have to pay Apple for 60 days? should Apple recognize an expense for employees who work this week but will not be paid until the first of next month? The answer to both of these questions is yes.
Two fundamental principles guide recognition of revenues and expenses:
Revenue Recognition Principle—recognize revenues when earned.
Expense Recognition (Matching) Principle—recognize expenses when incurred.
These two principles are the foundation of accrual accounting, which is the accounting system used to prepare all GAAP-based financial statements. The general approach is this: first, recognize revenues in the time period they are earned; then, record all expenses incurred to generate those revenues during that same time period (this is called matching expenses to revenues). net income is then correctly reported for that period.
recognizing revenues when earned does not necessarily imply the receipt of cash. revenue is earned when the company has done everything that it is supposed to do. This means that a sale of goods on credit would qualify for recognition as long as the revenues are earned. likewise, com-panies recognize an expense when it is incurred, even if no cash is paid. For example, companies recognize as expenses the wages earned by employees, even though they will not be paid until the next pay period. The company records an expense but pays no cash; instead, it records an accrued liability for the wages payable.
Accrual accounting requires estimates and assumptions. examples include estimating how much revenue has been earned on a long-term contract, the amount of accounts receivable that will not be collected, the degree to which equipment has been “used up,” the cleanup costs that a company must eventually pay for environmental liabilities, and numerous other estimates. All of these estimates and assumptions affect both reported net income and the balance sheet. Judgments affect all financial statements. This is an important by-product of accrual accounting. We discuss these estimates and assumptions, and their effects on financial statements, throughout the book.
Alert The FASB has released a preliminary draft of a proposal to restructure finan-cial statements to, among other things, better dis-tinguish operating and nonoperating activities.
2‑13 Module 2 | Introducing Financial Statements and Transaction Analysis
AnALysIs InsIgHT Common size Income statement
Analysts typically prepare common size income statements as a starting point for their analysis; each income statement item is expressed as a percent of net sales. As with the common size balance sheet, a common size income statement facilitates the same three types of comparisons: one company across years (called time-series analysis), many companies across one year (called cross-sectional analysis), and to a benchmark such as an industry average. Common size analysis is also referred to as “vertical analysis” because the percentages in the column on the income statement add up vertically to 100% of total sales (the top-line number on the income state-ment). A common size balance sheet adds up vertically to 100% of total assets (the last number on the balance sheet).
MAnAgERIAL DECIsIon you Are the operations Manager
You are the operations manager on a new consumer product that was launched this period with very successful sales. The Chief Financial Officer (CFO) asks you to prepare an estimate of warranty costs to charge against those sales. Why does the CFO desire a warranty cost estimate? What is-sues must you address in arriving at such an estimate? [Answer, p. 2-35]
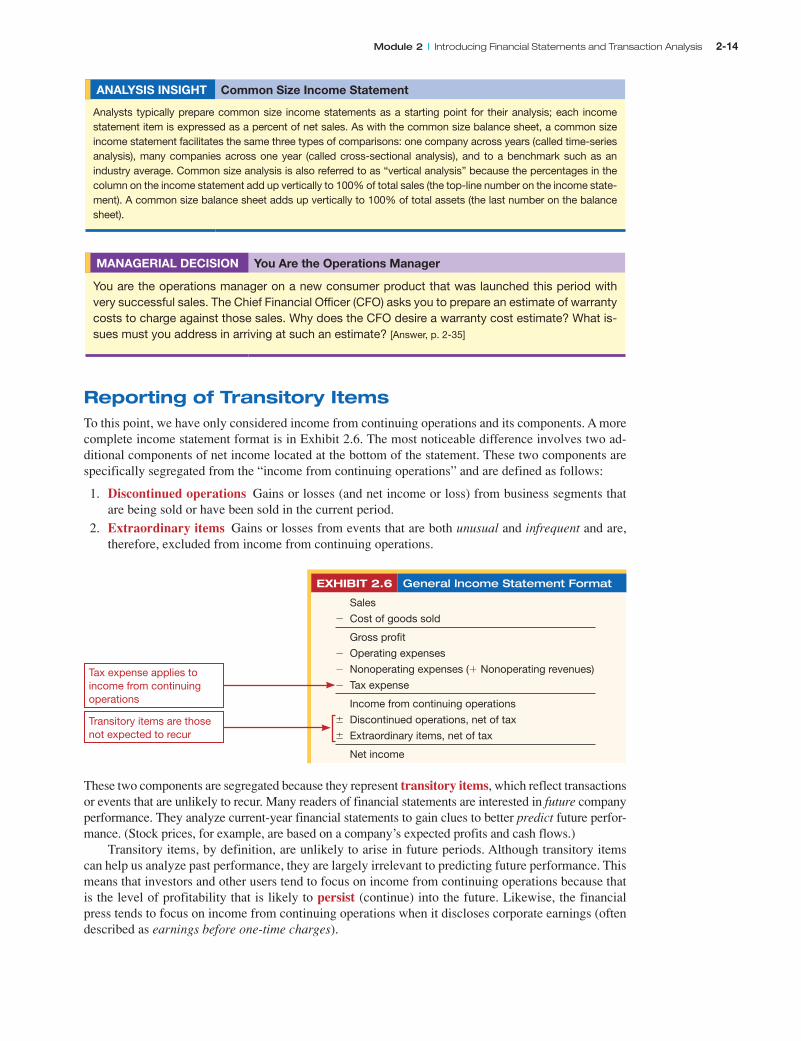
Reporting of Transitory ItemsTo this point, we have only considered income from continuing operations and its components. A more complete income statement format is in exhibit 2.6. The most noticeable difference involves two ad-ditional components of net income located at the bottom of the statement. These two components are specifically segregated from the “income from continuing operations” and are defined as follows:
1. Discontinued operations Gains or losses (and net income or loss) from business segments that are being sold or have been sold in the current period.
2. Extraordinary items Gains or losses from events that are both unusual and infrequent and are, therefore, excluded from income from continuing operations.
EXHIBIT 2.6 General Income Statement Format
Sales
2 Cost of goods sold
Gross profit
2 Operating expenses
2 Nonoperating expenses (1 Nonoperating revenues)
2 Tax expense
Income from continuing operations
6 Discontinued operations, net of tax
6 Extraordinary items, net of tax
Net income
These two components are segregated because they represent transitory items, which reflect transactions or events that are unlikely to recur. Many readers of financial statements are interested in future company performance. They analyze current-year financial statements to gain clues to better predict future perfor-mance. (stock prices, for example, are based on a company’s expected profits and cash flows.)
Transitory items, by definition, are unlikely to arise in future periods. Although transitory items can help us analyze past performance, they are largely irrelevant to predicting future performance. This means that investors and other users tend to focus on income from continuing operations because that is the level of profitability that is likely to persist (continue) into the future. likewise, the financial press tends to focus on income from continuing operations when it discloses corporate earnings (often described as earnings before one-time charges).
Tax expense applies to income from continuing operations
Transitory items are those not expected to recur
Module 2 | Introducing Financial Statements and Transaction Analysis 2‑14
AnALysIs InsIgHT Discontinued operations
The “discontinued operations” line that we sometimes see on the income statement consists of two parts: (1) the income or loss from the discontinued operation (usually a subsidiary company that is sold) for the portion of the current year prior to sale, and (2) the gain or loss on the sale of the discontinued operation. The latter is computed as the difference between the sales price and the balance sheet value of the discontinued operation at the date it was sold. For example, if a company sells a subsidiary that is reported on the balance sheet at $100 for a sales price of $125, it reports a gain on sale of $25. However, if it was sold at a sales price of $90 a $10 loss on sale is reported. This is just like we would compute the gain or loss on the sale of any asset; a subsidiary company is merely a collection of many assets and liabilities (we discuss gains and losses on the sale of subsidiary companies in Module 7). How should we treat the income or loss from the discontinued operation and the gain or loss on its sale when we analyze a company? The critical question is whether they represent operating or nonoperating activities. The case for “operating” rests on the assumption that the subsidiary has historically been treated as an operating asset and, therefore, any income, gain, or loss should also be treated as operating. The case for “nonoperating” rests on the assumption that the subsidiary ceases to be part of the company’s operations once the decision is made to dispose of it and, therefore, any income, gain, or loss should be treated as nonoperating. Most analysts side with the nonoperating treatment because it is consistent with the motivation for their analyses: to forecast fu-ture operating performance for equity and debt valuation. We adopt this view too: our chief aim is to identify core operating income and cash flow that will persist into the future. Including results from discontinued operations in the financial analysis could mask core operating income and lead to inaccurate estimates of future operating income and cash flow. The important point is that results from discontinued operations will not recur in the future as those assets are gone and their earning power has ceased. We return to this analysis in Module 4.
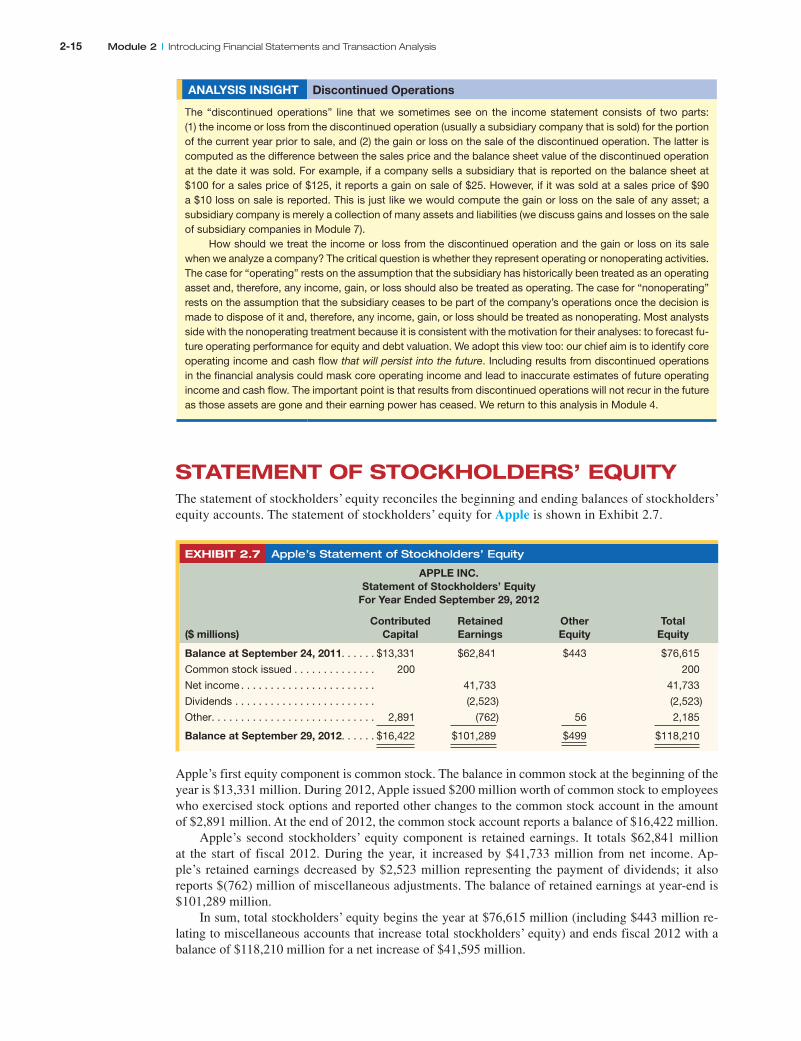
STATEMENT OF STOCkHOLDERS’ EQUITYThe statement of stockholders’ equity reconciles the beginning and ending balances of stockholders’ equity accounts. The statement of stockholders’ equity for Apple is shown in exhibit 2.7.
EXHIBIT 2.7 Apple’s Statement of Stockholders’ Equity
APPLE InC. statement of stockholders’ Equity
For year Ended september 29, 2012
Contributed Retained other Total ($ millions) Capital Earnings Equity Equity
Balance at september 24, 2011. . . . . . $13,331 $62,841 $443 $76,615
Apple’s first equity component is common stock. The balance in common stock at the beginning of the year is $13,331 million. During 2012, Apple issued $200 million worth of common stock to employees who exercised stock options and reported other changes to the common stock account in the amount of $2,891 million. At the end of 2012, the common stock account reports a balance of $16,422 million.
Apple’s second stockholders’ equity component is retained earnings. it totals $62,841 million at the start of fiscal 2012. During the year, it increased by $41,733 million from net income. Ap-ple’s retained earnings decreased by $2,523 million representing the payment of dividends; it also reports $(762) million of miscellaneous adjustments. The balance of retained earnings at year-end is $101,289 million.
in sum, total stockholders’ equity begins the year at $76,615 million (including $443 million re-lating to miscellaneous accounts that increase total stockholders’ equity) and ends fiscal 2012 with a balance of $118,210 million for a net increase of $41,595 million.
2‑15 Module 2 | Introducing Financial Statements and Transaction Analysis
IFRs InsIgHT Balance sheet and Income statement under IFRs
U.S. GAAP and IFRS require a similar set of financial statements with similar formats. Both stan-dards require current and long-term classifications for assets and liabilities, and both recognize revenues when earned and expenses when incurred. Although differences between U.S. GAAP and IFRS do exist at the “detailed level,” there are at least three broader differences worth mention:
■ GAAP makes no formal prescription for the balance sheet and the income statement; how-ever, the SEC does prescribe the types of accounts and number of years that should be disclosed per Reg. S-X. Reg. S-X requires three years of comparative income statements whereas IFRS requires only two.
■ GAAP requires the reporting of extraordinary items as a separate category of the income statement if they are unusual and infrequent; IFRS has no extraordinary item category.
■ For items that are either unusual or infrequent, but not both, GAAP requires separate presen-tation in the income statement as a component of earnings from continuing operations; IFRS also requires disclosure of these items, but allows for such disclosure in footnotes to financial statements as an alternative to the income statement.
STATEMENT OF CASH FLOwSThe balance sheet and income statement are prepared using accrual accounting, in which revenues are recognized when earned and expenses when incurred. This means that companies can report income even though no cash is received. Cash shortages—due to unexpected cash outlays or when customers refuse to or cannot pay—can create economic hardships for companies and even cause their demise.
To assess cash flows, we must assess a company’s cash management. Obligations to employees, creditors, and others are usually settled with cash. illiquid companies (those lacking cash) are at risk of failure. Given the importance of cash management, companies must report a statement of cash flows in addition to the balance sheet, income statement, and statement of equity.
The income statement provides information about the economic viability of the company’s products and services. it tells us whether the company can sell its products and services at prices that cover its costs and provide a reasonable return to lenders and stockholders. On the other hand, the statement of cash flows provides information about the company’s ability to generate cash from those same transactions. it tells us from what sources the company has generated its cash (so we can evaluate whether those sources are persistent or transitory) and what it has done with the cash it generated.
Statement Format and Data SourcesThe statement of cash flows is formatted to report cash inflows and cash outflows by the three primary business activities:
■ Cash flows from operating activities Cash flows from the company’s transactions and events that relate to its operations.
■ Cash flows from investing activities Cash flows from acquisitions and divestitures of investments and long-term assets.
■ Cash flows from financing activities Cash flows from issuances of and payments toward borrow-ings and equity.
The combined cash flows from these three sections yield the net change in cash for the period. The three sections of the statement of cash flows relate to the income statement and to different parts of the balance sheet. These relations are highlighted in the following table:
Module 2 | Introducing Financial Statements and Transaction Analysis 2‑16
Cash flow section
Information from income statement
Information from balance sheet
Net cash flows from operating activities. . . .
Revenues
2 Expenses
5 net income
Current operating assets
Long-term operating and all nonoperating assets
Current operating liabilities
Long-term operating and all nonoperating liabilities
Equity
Net cash flows from investing activities . . . .
Revenues
2 Expenses
5 Net income
Current operating assets
Long‑term operating and all nonoperating assets
Current operating liabilities
Long-term operating and all nonoperating liabilities
Equity
Net cash flows from financing activities . . . .
Revenues
2 Expenses
5 Net income
Current operating assets
Long-term operating and all nonoperating assets
Current operating liabilities
Long‑term operating and all nonoperating liabilities
Equity
specifically, the three sections draw generally on the following information:
■ Net cash flows from operating activities relate to the income statement and to the current asset and current liabilities sections of the balance sheet.
■ Net cash flows from investing activities relate to the long-term assets section of the balance sheet.
■ Net cash flows from financing activities relate to the long-term liabilities and stockholders’ eq-uity sections of the balance sheet.
These relations do not hold exactly, but they provide us a useful way to visualize the construction of the statement of cash flows.
in analyzing the statement of cash flows, we should not necessarily conclude that the company is better off if cash increases and worse off if cash decreases. it is not the change in cash as reported on the year-end balance sheet that is most important, but the reasons behind the change. For example, what are the sources of cash inflows? Are these sources transitory? Are these sources mainly from operating activities? To what uses have cash inflows been put? such questions and answers are key to properly using the statement of cash flows.
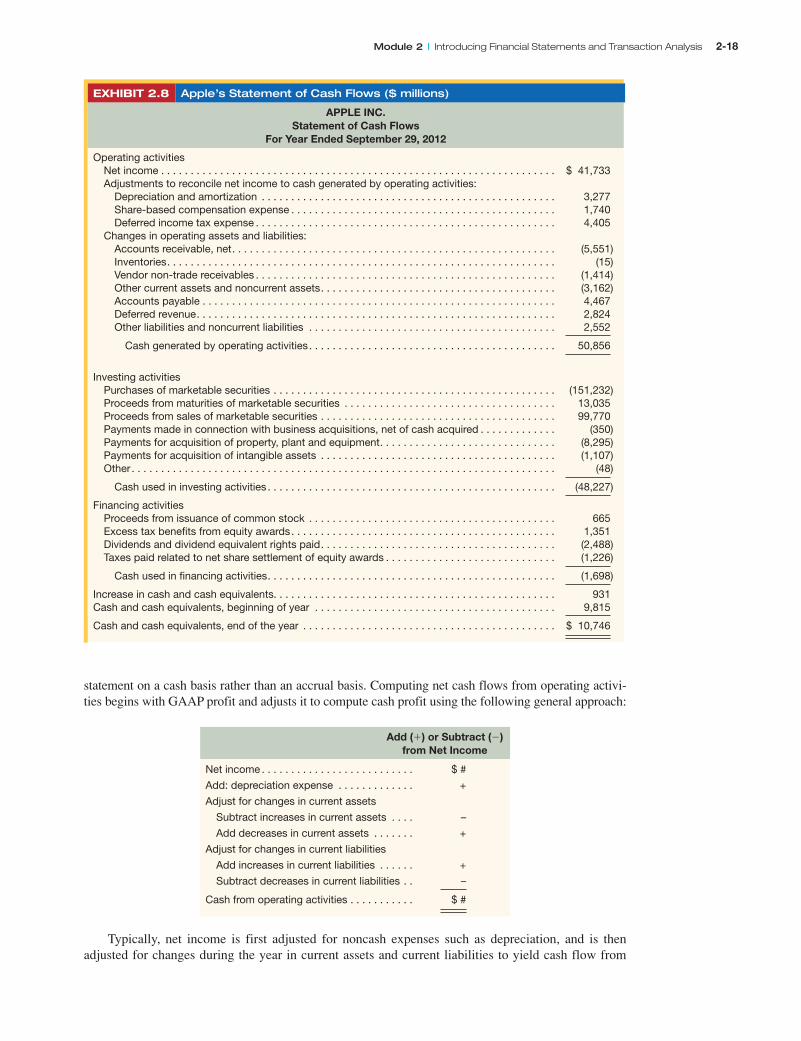
exhibit 2.8 shows Apple’s statement of cash flows. Apple reported $50,856 million in net cash in-flows from operating activities in 2012. This is substantially greater than its net income of $41,733 mil-lion. The operating activities section of the statement of cash flows reconciles the difference between net income and operating cash flow. The difference is due to the add-back of depreciation, a noncash expense in the income statement, and other noncash expenses, together with year-over-year changes in operating assets and liabilities.
Apple reports a net cash outflow of $48,227 million for investing activities, mainly for investments in marketable securities. Apple also used $1,698 million for financing activities, mainly for the pay-ment of dividends.
Overall, Apple’s cash flow picture is strong. it is generating cash from operating activities and the sale of stock to employees, and is investing excess cash in marketable securities to ensure future liquidity.
Cash Flow Computationsit is sometimes difficult to understand why certain accounts are added to and subtracted from net in-come to yield net cash flows from operating activities. it often takes more than one pass through this section to grasp how this part of the cash flow statement is constructed.
A key to understanding these computations is to remember that under accrual accounting, revenues are recognized when earned and expenses when incurred. This recognition policy does not necessarily co-incide with the receipt or payment of cash. The top line (net income) of the operating section of the state-ment of cash flows represents net (accrual) income under GAAP. The bottom line (net cash flows from operating activities) is the cash profit the company would have reported had it constructed its income
2‑17 Module 2 | Introducing Financial Statements and Transaction Analysis
statement on a cash basis rather than an accrual basis. Computing net cash flows from operating activi-ties begins with GAAP profit and adjusts it to compute cash profit using the following general approach:
Add increases in current liabilities . . . . . . +
Subtract decreases in current liabilities . . – Cash from operating activities . . . . . . . . . . . $ #
Typically, net income is first adjusted for noncash expenses such as depreciation, and is then adjusted for changes during the year in current assets and current liabilities to yield cash flow from
EXHIBIT 2.8 Apple’s Statement of Cash Flows ($ millions)
Module 2 | Introducing Financial Statements and Transaction Analysis 2‑18
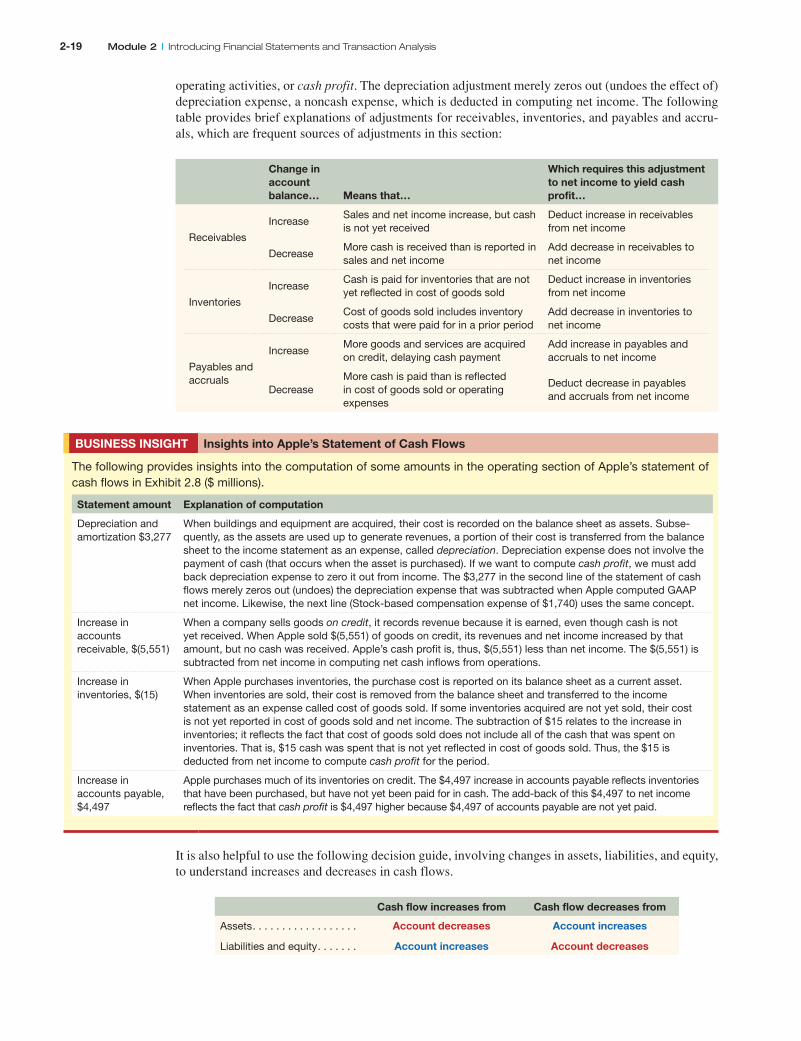
operating activities, or cash profit. The depreciation adjustment merely zeros out (undoes the effect of) depreciation expense, a noncash expense, which is deducted in computing net income. The following table provides brief explanations of adjustments for receivables, inventories, and payables and accru-als, which are frequent sources of adjustments in this section:
Change in account balance…
Means that…
Which requires this adjustment to net income to yield cash profit…
Receivables
IncreaseSales and net income increase, but cash is not yet received
Deduct increase in receivables from net income
DecreaseMore cash is received than is reported in sales and net income
Add decrease in receivables to net income
Inventories
IncreaseCash is paid for inventories that are not yet reflected in cost of goods sold
Deduct increase in inventories from net income
DecreaseCost of goods sold includes inventory costs that were paid for in a prior period
Add decrease in inventories to net income
Payables and accruals
IncreaseMore goods and services are acquired on credit, delaying cash payment
Add increase in payables and accruals to net income
DecreaseMore cash is paid than is reflected in cost of goods sold or operating expenses
Deduct decrease in payables and accruals from net income
BusInEss InsIgHT Insights into Apple’s statement of Cash Flows
The following provides insights into the computation of some amounts in the operating section of Apple’s statement of cash flows in Exhibit 2.8 ($ millions).
statement amount Explanation of computation
Depreciation and amortization $3,277
When buildings and equipment are acquired, their cost is recorded on the balance sheet as assets. Subse-quently, as the assets are used up to generate revenues, a portion of their cost is transferred from the balance sheet to the income statement as an expense, called depreciation. Depreciation expense does not involve the payment of cash (that occurs when the asset is purchased). If we want to compute cash profit, we must add back depreciation expense to zero it out from income. The $3,277 in the second line of the statement of cash flows merely zeros out (undoes) the depreciation expense that was subtracted when Apple computed GAAP net income. Likewise, the next line (Stock-based compensation expense of $1,740) uses the same concept.
Increase in accounts receivable, $(5,551)
When a company sells goods on credit, it records revenue because it is earned, even though cash is not yet received. When Apple sold $(5,551) of goods on credit, its revenues and net income increased by that amount, but no cash was received. Apple’s cash profit is, thus, $(5,551) less than net income. The $(5,551) is subtracted from net income in computing net cash inflows from operations.
Increase in inventories, $(15)
When Apple purchases inventories, the purchase cost is reported on its balance sheet as a current asset. When inventories are sold, their cost is removed from the balance sheet and transferred to the income statement as an expense called cost of goods sold. If some inventories acquired are not yet sold, their cost is not yet reported in cost of goods sold and net income. The subtraction of $15 relates to the increase in inventories; it reflects the fact that cost of goods sold does not include all of the cash that was spent on inventories. That is, $15 cash was spent that is not yet reflected in cost of goods sold. Thus, the $15 is deducted from net income to compute cash profit for the period.
Increase in accounts payable, $4,497
Apple purchases much of its inventories on credit. The $4,497 increase in accounts payable reflects inventories that have been purchased, but have not yet been paid for in cash. The add-back of this $4,497 to net income reflects the fact that cash profit is $4,497 higher because $4,497 of accounts payable are not yet paid.
it is also helpful to use the following decision guide, involving changes in assets, liabilities, and equity, to understand increases and decreases in cash flows.
2‑19 Module 2 | Introducing Financial Statements and Transaction Analysis
The preceding table applies to all sections of the statement of cash flows. To determine if a change in each asset and liability account creates a cash inflow or outflow, examine the change and apply the decision rules from the table. For example, in the investing section, cash decreases when PPe assets increase. in the financing section, borrowing from a bank increases cash. Module 3 and Appendix B near the end of the book describe the preparation of the statement of cash flows in detail.
sometimes the cash flow effect of an item reported in the statement of cash flows does not agree with the difference in the balance sheet accounts that we observe. This can be due to several factors. One common factor is when a company uses its own stock to acquire another entity. There is no cash effect from a stock acquisition and, hence, it is not reported in the statement of cash flows. Yet, the company does increase its assets and liabilities when it adds the acquired company’s assets and liabili-ties to its balance sheet.
Knowledge of how companies record cash inflows and outflows helps us better understand the statement of cash flows. Determining how changes in asset and liability accounts affect cash provides an analytic tool and offers greater insight into managing a business. For instance, reducing the levels of receivables and inventories increases cash. similarly, increasing the levels of accounts payable and accrued liabilities increases cash. Managing cash balances by managing other accounts is called work-ing capital management, which is important for all companies.
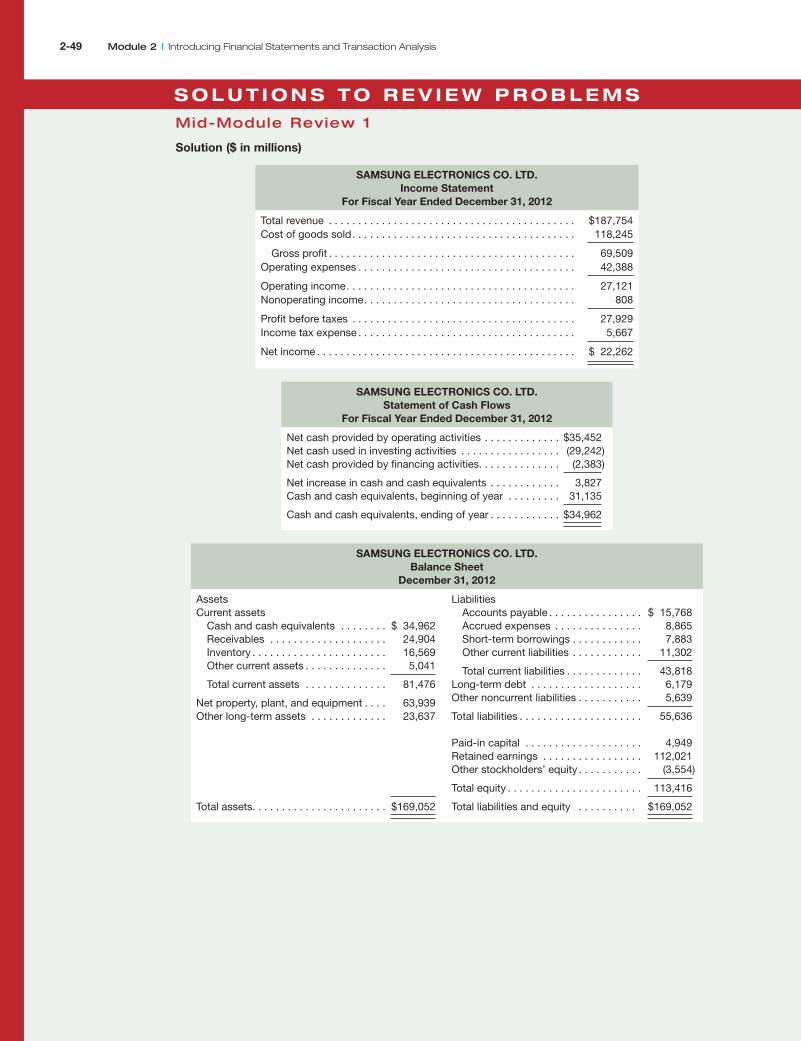
M I D - M O D U L E R E V I E w 1
Following are account balances ($ millions equivalent of Korean Won) for Samsung Electronics Co. Ltd. using these data, prepare samsung’s income statement and statement of cash flows for the fiscal year ended December 31, 2012. Prepare its balance sheet dated December 31, 2012.
ARTICULATION OF FINANCIAL STATEMENTSThe four financial statements are linked with each other and linked across time. This section demon-strates the linkages (articulation) of financial statements using Apple.
Retained Earnings ReconciliationThe balance sheet and income statement are linked via retained earnings. recall that retained earnings is updated each period as follows:
Beginning retained earnings6 Net income (loss)2 Dividends
5 Ending retained earnings
retained earnings reflect cumulative income that has not yet been distributed to shareholders. exhibit 2.9 shows Apple’s retained earnings reconciliation for 2012.
LO2 Explain and illustrate linkages among the four financial statements.
Module 2 | Introducing Financial Statements and Transaction Analysis 2‑20
This reconciliation of retained earnings links the balance sheet and income statement. in the absence of transactions with stockholders—such as stock issuances and repurchases, and
dividend payments—the change in stockholders’ equity equals income or loss for the period. The in-come statement, thus, measures the change in company value as measured by GAAP. This is not neces-sarily company value as measured by the market. Of course, all value-relevant items eventually find their way into the income statement. so, from a long-term perspective, the income statement does measure change in company value. This is why stock prices react to reported income and to analysts’ expectations about future income.
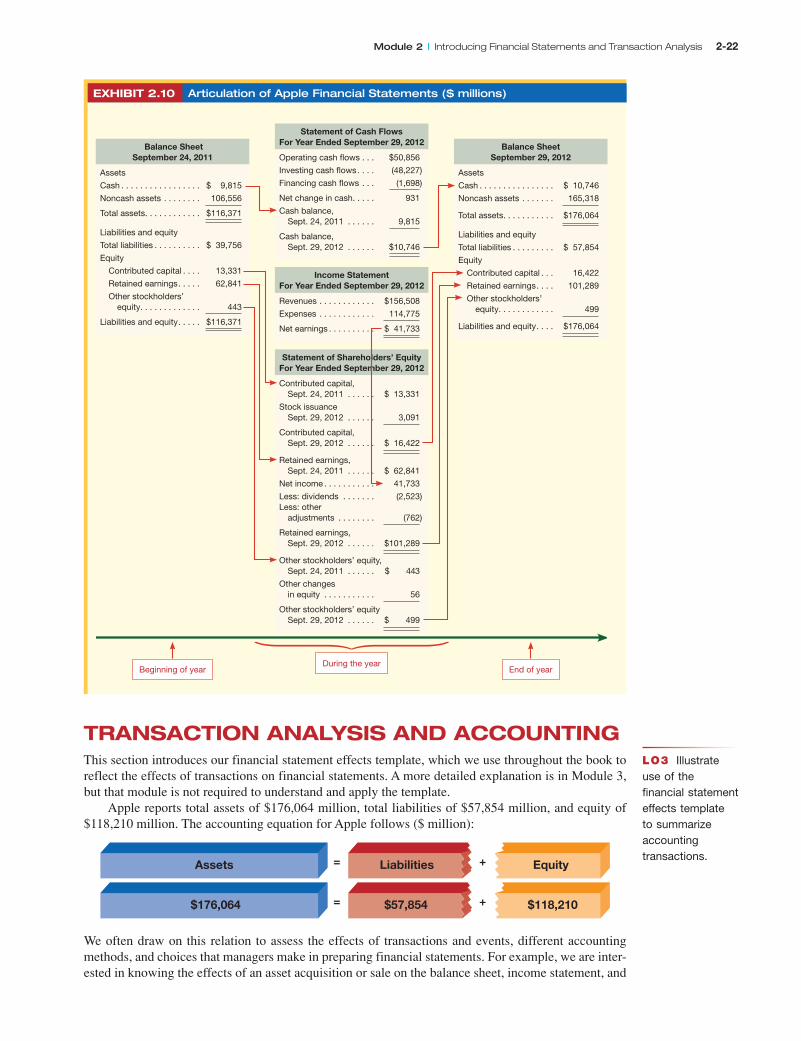
Financial Statement Linkageslinkages of the four financial statements is shown in exhibit 2.10. Apple begins fiscal 2012 with assets of $116,371 million, consisting of cash of $9,815 million and noncash assets of $106,556 mil-lion. These investments are financed with $39,756 million from nonowners and $76,615 million from stockholders. The owner financing consists of contributed capital of $13,331 million, retained earnings of $62,841 million, and other stockholders’ equity of $443 million.
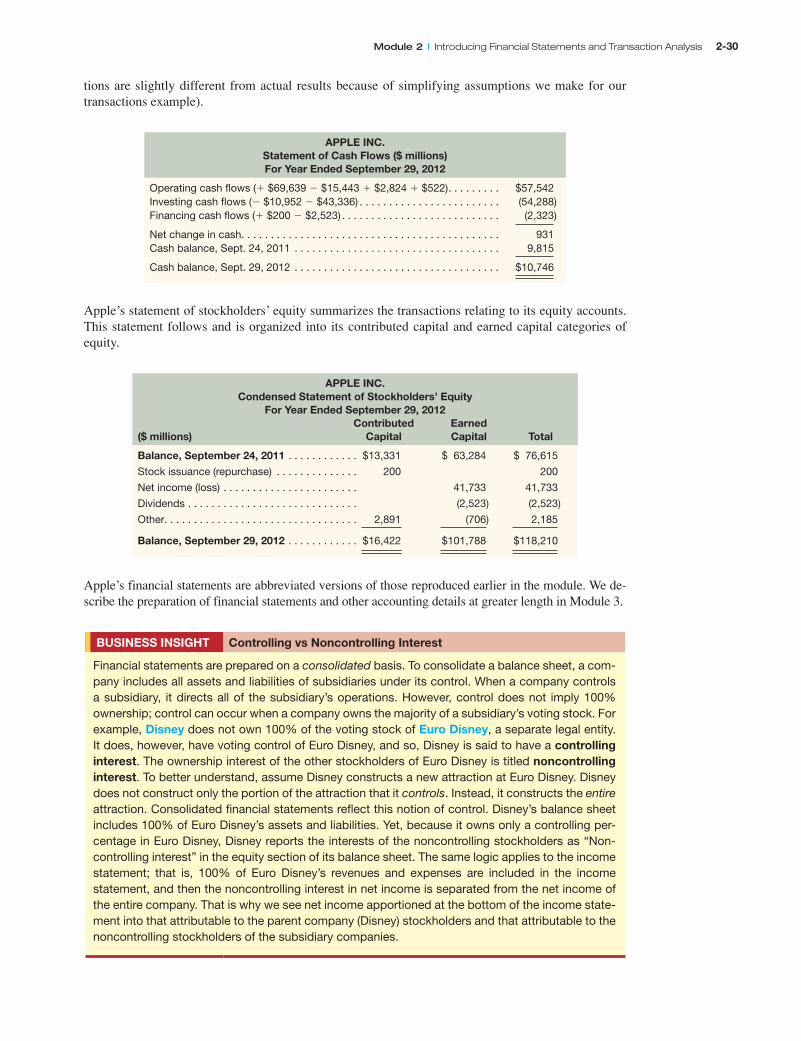
exhibit 2.10 shows balance sheets at the beginning and end of Apple’s fiscal year on the left and right columns, respectively. The middle column reflects operating activities for 2012. The statement of cash flows explains how operating, investing, and financing activities increase the cash balance by $931 million from $9,815 million at the beginning of the year to $10,746 million at year-end. The end-ing balance in cash is reported in the year-end balance sheet on the right.
Apple’s $41,733 million net income reported on the income statement is also carried over to the statement of stockholders’ equity. Apple’s retained earnings increases by the amount of its net income and decreases by dividend payments of $2,523 million (other adjustments reduce retained earnings by $762 million).
M I D - M O D U L E R E V I E w 2
refer to information in Mid-Module review 1; assume that Samsung Electronics Co. Ltd. reports the following balances for the prior year balance sheet and current year income statement ($ in millions). Prepare the articulation of samsung’s financial statements from fiscal years 2011 and 2012 following the format of exhibit 2.10.
Balance sheet, December 31, 2011 Income statement, For year Ended December 31, 2012
TRANSACTION ANALYSIS AND ACCOUNTING This section introduces our financial statement effects template, which we use throughout the book to reflect the effects of transactions on financial statements. A more detailed explanation is in Module 3, but that module is not required to understand and apply the template.
Apple reports total assets of $176,064 million, total liabilities of $57,854 million, and equity of $118,210 million. The accounting equation for Apple follows ($ million):
Assets Liabilities= + Equity
$176,064 $57,854= + $118,210
We often draw on this relation to assess the effects of transactions and events, different accounting methods, and choices that managers make in preparing financial statements. For example, we are inter-ested in knowing the effects of an asset acquisition or sale on the balance sheet, income statement, and
LO3 Illustrate use of the financial statement effects template to summarize accounting transactions.
Module 2 | Introducing Financial Statements and Transaction Analysis 2‑22
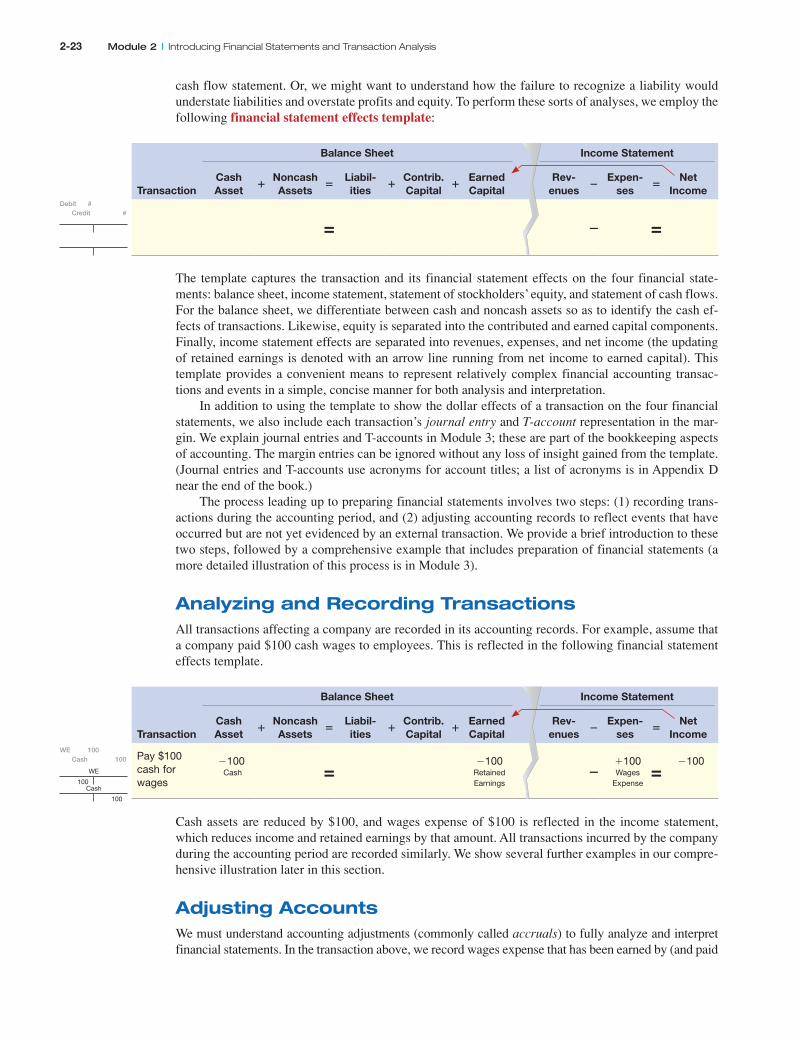
cash flow statement. Or, we might want to understand how the failure to recognize a liability would understate liabilities and overstate profits and equity. To perform these sorts of analyses, we employ the following financial statement effects template:
Balance sheet Income statement
TransactionCash Asset
1noncash Assets
5Liabil‑ ities
1Contrib. Capital
1Earned Capital
Rev‑ enues
2Expen‑
ses5
net Income
= 2 =
The template captures the transaction and its financial statement effects on the four financial state-ments: balance sheet, income statement, statement of stockholders’ equity, and statement of cash flows. For the balance sheet, we differentiate between cash and noncash assets so as to identify the cash ef-fects of transactions. likewise, equity is separated into the contributed and earned capital components. Finally, income statement effects are separated into revenues, expenses, and net income (the updating of retained earnings is denoted with an arrow line running from net income to earned capital). This template provides a convenient means to represent relatively complex financial accounting transac-tions and events in a simple, concise manner for both analysis and interpretation.
in addition to using the template to show the dollar effects of a transaction on the four financial statements, we also include each transaction’s journal entry and T-account representation in the mar-gin. We explain journal entries and T-accounts in Module 3; these are part of the bookkeeping aspects of accounting. The margin entries can be ignored without any loss of insight gained from the template. (Journal entries and T-accounts use acronyms for account titles; a list of acronyms is in Appendix D near the end of the book.)
The process leading up to preparing financial statements involves two steps: (1) recording trans-actions during the accounting period, and (2) adjusting accounting records to reflect events that have occurred but are not yet evidenced by an external transaction. We provide a brief introduction to these two steps, followed by a comprehensive example that includes preparation of financial statements (a more detailed illustration of this process is in Module 3).
Analyzing and Recording TransactionsAll transactions affecting a company are recorded in its accounting records. For example, assume that a company paid $100 cash wages to employees. This is reflected in the following financial statement effects template.
Balance sheet Income statement
TransactionCash Asset
1noncash Assets
5Liabil‑ ities
1Contrib. Capital
1Earned Capital
Rev‑ enues
2Expen‑
ses5
net Income
Pay $100 cash for wages
2100 Cash =
2100Retained Earnings
21100Wages
Expense=
2100
Cash assets are reduced by $100, and wages expense of $100 is reflected in the income statement, which reduces income and retained earnings by that amount. All transactions incurred by the company during the accounting period are recorded similarly. We show several further examples in our compre-hensive illustration later in this section.
Adjusting AccountsWe must understand accounting adjustments (commonly called accruals) to fully analyze and interpret financial statements. in the transaction above, we record wages expense that has been earned by (and paid
Debit # Credit #
WE 100 Cash 100
Cash
100
WE
100
2‑23 Module 2 | Introducing Financial Statements and Transaction Analysis
to) employees during the period. What if the employees were not paid for wages earned at period-end? should the expense still be recorded? The answer is yes. All expenses incurred to generate, directly or indirectly, the revenues reported in the period must be recorded. This is the case even if those expenses are still unpaid at period-end. Failure to recognize wages expense would overstate net income for the period because wages have been earned and should be reported as expense in this period. Also, failure to record those wages at period-end would understate liabilities. Thus, neither the income statement nor the balance sheet would be accurate. Adjustments are, therefore, necessary to accurately portray financial condition and performance of a company.
There are four types of adjustments, which are illustrated in the following graphic. The two adjust-ments on the left relate to the receipt or payment of cash before revenue or expense is recognized. The two on the right relate to the receipt or payment of cash after revenue or expense is recognized.
PrepaidExpense
UnearnedRevenues
AccruedExpenses
AccruedRevenue
Cash is paid or received after expenses or
revenues are recognized
Cash is paid or receivedbefore expenses or
revenues are recognized
Adjustments
One of two types of accounts arise when cash is received or paid before recognition of revenue or expense.
Prepaid expenses Prepaid expenses reflect advance cash payments that will ultimately become expenses; an example is the payment of radio advertising that will not be aired until sometime in the future.
Unearned revenues unearned revenues reflect cash received from customers before any services or goods are provided; an example is cash received from patrons for tickets to an upcoming concert.
To illustrate the adjustment required with prepaid expenses, assume that Apple pays $3,000 cash at the be-ginning of this year to rent office space, and that this allows Apple to use the space for the current year and two additional years. When paid, the prepaid rent is an asset for Apple (it now controls the space, which is expected to provide future benefits for its business). At the end of the first year, one-third of the Prepaid rent asset is used up. Apple, therefore, removes that portion from its balance sheet and recognizes it as an expense in the income statement. The beginning-year payment and year-end expensing of the rental asset are recorded as follows:
Balance sheet Income statement
TransactionCash Asset
1noncash Assets
5Liabil‑ ities
1Contrib. Capital
1Earned Capital
Rev‑ enues
2Expen‑
ses5
net Income
a. Beginning- year $3,000 cash pay-ment in advance for 3-year rent
23,000Cash
13,000Prepaid
Rent= 2 =
b. Recogni-tion of 1-year rent expense of $1,000
21,000Prepaid
Rent=
21,000Retained Earnings
211,000
Rent Expense
=21,000
To illustrate unearned revenues, assume that Apple receives $5,000 cash in advance of providing ser-vices to a client. That amount is initially recorded as a liability for services owed the client. later, when
Cash
3,000
PPRNT
3,000
PPRNT 3,000 Cash 3,000
PPRNT
1,000
RNTE
1,000
RNTE 1,000 PPRNT 1,000
Module 2 | Introducing Financial Statements and Transaction Analysis 2‑24
Apple provides the services, it can recognize that revenue since it is now earned. The receipt of cash and subsequent recognition of revenue are recorded as follows:
Balance sheet Income statement
TransactionCash Asset
1noncash Assets
5Liabil‑ ities
1Contrib. Capital
1Earned Capital
Rev‑ enues
2Expen‑
ses5
net Income
a. Receive $5,000 cash in advance for future services
15,000Cash =
15,000Unearned Revenue
2 =
b. Recog-nition of $5,000 ser-vices revenue earned
=25,000Unearned Revenue
15,000Retained Earnings
15,000Revenue 2 =
15,000
One of two types of accounts arise when cash is received or paid after recognition of revenue or expense.
Accrued expenses Accrued expenses are expenses incurred and recognized on the income statement, even though they are not yet paid in cash; an example is wages owed to employees who performed work but who have not yet been paid.
Accrued revenues Accrued revenues are revenues earned and recognized on the income statement, even though cash is not yet received; examples include accounts receivable and revenue earned under a long-term contract.
To illustrate accrued expenses, assume that $100 of wages earned by Apple employees this period is paid the following period. The period-end adjustment, and subsequent payment the following period, are both reflected in the following template.
Balance sheet Income statement
TransactionCash Asset
1noncash Assets
5Liabil‑ ities
1Contrib. Capital
1Earned Capital
Rev‑ enues
2Expen‑
ses5
net Income
Period 1: Accrue $100 wages ex-pense and liability
=1100Wages Payable
2100Retained Earnings
21100Wages
Expense=
2100
Period 2: Pay $100 cash for wages
2100Cash =
2100Wages Payable
2 =
Wages expense is recorded in period 1’s income statement because it is incurred by the company and earned by employees in that period. Also, a liability is recorded in period 1 reflecting the company’s obligation to make payment to employees. in period 2, the wages are paid, which means that both cash and the liability are reduced.
To illustrate the accrual of revenues, assume that Apple is performing work under a long-term contract that allows it to bill the customer periodically as work is performed. At the end of the current period, it determines that it has earned $100,000 per contract. The accrual of this revenue and its sub-sequent collection are recorded as follows ($ 000s):
UR
5,000
Cash
5,000
Cash 5,000 UR 5,000
REV
5,000
UR
5,000
UR 5,000 REV 5,000
WE
100WP
100
WE 100 WP 100
WP
100Cash
100
WP 100 Cash 100
2‑25 Module 2 | Introducing Financial Statements and Transaction Analysis
Balance sheet Income statement
TransactionCash Asset
1noncash Assets
5Liabil‑ ities
1Contrib. Capital
1Earned Capital
Rev‑ enues
2Expen‑
ses5
net Income
a. Accrual of $100 of earned revenue
1100Accounts
Receivable=
1100Retained Earnings
1100Revenue 2 =
1100
b. Collection of account receivable
1100Cash
2100Accounts
Receivable= 2 =
Companies make these sort of adjustments to more accurately and completely report their financial performance and condition. each of these adjustments is made by company managers and accountants based on the review of financial statements and information suggesting that adjustments are necessary to properly reflect financial condition and performance.
Constructing Financial StatementsWe can prepare each of the four financial statements directly from our financial statement effects tem-plate. The balance sheet and income statement accounts, and their respective balances, can be read off the bottom row that totals the transactions and adjustments recorded during the period. The statement of cash flows and statement of stockholders’ equity are represented by the cash column and the contrib-uted and earned capital columns, respectively.
Illustration: Recording Transactions, Adjusting Accounts, and Preparing StatementsThis section provides a comprehensive illustration that uses the financial statement effects template with a number of transactions related to Apple’s 2012 financial statements shown earlier. These summary transactions are described in the far left column of the following template. each column is summed to arrive at the balance sheet and income statement totals that tie to Apple’s statements. Detailed explana-tions for each transaction are provided after the template. Then, we use the information in the template to construct Apple’s financial statements ($ in millions).
* Apple reports investment income as an “addback” to other expenses.
AR 156,508 Sales 156,508
AR
156,508Sales
156,508COGS 87,846 INV 87,846
COGS
87,846INV
87,846
Cash 69,639AP 81,318 AR 150,957
Cash
69,639AP
81,318AR
150,957
OE 15,443 Cash 15,443
OE
15,443Cash
15,443
OE 2,167 ACC 2,167
OE
2,167ACC
2,167
Cash 2,824 UR 2,824
Cash
2,824UR
2,824
TE 6,564 DTL 6,564
TE
6,564DTL
6,564
MS 43,336 Cash 43,336
MS
45,993Cash
45,993
DE 3,277 PPE, net 3,277
DE
3,277PPE, net
3,277Cash 522 EI 522
Cash
522EI
522
Noncash asset 2,185 APIC 2,891 AOCI 706
Noncash asset
2,185APIC
2,891AOCI
706
RE 2,523 Cash 2,523
RE
2,523Cash
2,523
2‑27 Module 2 | Introducing Financial Statements and Transaction Analysis
Transaction Explanation Apple begins fiscal year 2012 with $116,371 million in total assets, con-sisting of $9,815 million of cash and $106,556 million of noncash assets. it also reports $39,756 mil-lion of liabilities and $76,615 million of stockholders’ equity ($13,331 million of contributed capital and $63,284 million of earned capital, which includes other equity for this exhibit). During the year, fourteen summary transactions occur that are described below.
1. Owner Financing. Companies raise funds from two sources: investing from stockholders and borrowing from creditors. Transaction 1 reflects issuance of common stock for $200 million in connection with employee stock options and other incentive compensation plans. Cash is increased by that amount, as is contributed capital. stock issuance (as well as its repurchase and any dividends paid to stockholders) does not impact income. Companies cannot record profit by trading in their own stock.
2. Purchase PPE. Apple acquires $8,295 million of property, plant and equipment (PPe) for cash. noncash assets increase by the $8,295 million (PPe), and cash decreases by the same amount. PPe is initially reported on the balance sheet at the cost Apple paid to acquire it. When plant and equipment are used, a portion of the purchase cost is transferred from the balance sheet to the income statement as an expense called depreciation. Accounting for depreciation of Apple’s PPe is shown in Transaction 11. The purchase of PPe is not an expense. The expense arises as the PPe assets are used.
3. Purchase inventories on credit. Companies commonly acquire inventories from suppliers on credit (also called on account). The phrase “on credit” means that the purchase has not yet been paid for. A purchaser is typically allowed 30 days or more during which to make payment. When acquired in this manner, noncash assets (inventories) increase by the $87,861 million cost of the acquired inventory, and a liability (accounts payable) increases to reflect the amount owed to the supplier.2 Although inventories (iPods, iPhones, and iPads, for example) normally carry a retail selling price that is higher than cost, this eventual profit is not recognized until inventories are sold.
4. Sell inventories on credit. Apple subsequently sells inventories that cost $87,846 million for a retail selling price of $156,508 million on credit. The phrase “on credit” means that Apple has not yet received cash for the selling price; cash receipt is expected in the future. (We assume all sales are on credit for simplification; in reality, a portion of sales is for cash.) The sale of inven-tories is recorded in two parts: the revenue part and the expense part. First, the sale is recorded by an increase in both revenues and noncash assets (accounts receivable). revenues increase net income which, in turn, increases earned capital (via retained earnings). second, the cost of inventories sold is removed from the balance sheet (Apple no longer owns those assets), and is transferred to the income statement as an expense, called cost of goods sold, which decreases both net income and earned capital by $87,846 (again, via retained earnings).
5. Collect receivables and settle payables. Apple receives $150,957 million cash from the collec-tion of its accounts receivable, thus reducing noncash assets (accounts receivable) by that amount. Apple uses these proceeds to pay off $81,318 of its liabilities accounts payable. Collecting accounts receivable does not yield revenue; instead, revenue is recognized when earned (see Transaction 4). Thus, recognizing revenue when earned does not necessarily yield immediate cash increase.
6. Pay cash for operating expenses, including taxes. Apple pays $15,443 million cash for operating expenses, including taxes. This payment increases expenses, and reduces net income (and earned capital). expenses are recognized when incurred, regardless of when they are paid. expenses are paid in this transaction. Transaction 7 is a case where expenses are recognized before being paid.
7. Accrue expenses. Accrued expenses, also called accrued liabilities, relate to expenses that are incurred but not yet paid. For example, employees often work near the end of a period but are not paid until the next period. The company must record wages expense even though employees have not yet been paid in cash. The rationale is that expenses must be recorded in the period in-
2 Companies do not report the purchase cost of inventories. We infer the purchases from balance sheet and income statement information using the following formula: Beginning inventory (prior year ending balance sheet amount) 1 Purchases 2 ending inventory (from the current balance sheet) 5 Cost of goods sold (from the income statement). using the amounts from exhibits 2.2 and 2.5, we solve for Purchases (in $ millions): $776 1 Purchases 2 $791 5 $87,846, yielding Purchases of $87,861. We discuss this formula and other matters relating to inventories in Module 6.
Module 2 | Introducing Financial Statements and Transaction Analysis 2‑28
curred to report the correct income for the period. in this transaction, Apple accrues $2,167 mil-lion of expenses, which reduces net income (and earned capital). Apple simultaneously records a $2,167 million increase in liabilities for its obligation to make future payment. This transaction is an accounting adjustment, or accrual.
8. Increase in unearned revenue. revenues are recognized when they are earned, regardless of when cash is received. Apple sometimes receives cash in advance of delivering the product or performing the service. in this example, Apple has received $2,824 million of cash and has not yet provided the product or service. We, therefore, record the increase in cash and also record an increase in a liability called unearned (or deferred) revenue, which represents Apple’s obligation to deliver the product or service. When the product or service is ultimately delivered, Apple will reduce the liability and recognize an increase in revenue and income.
9. Increase in deferred tax liabilities. Apple accrues another expense in this example. similar to Transaction 7, Apple calculates that it will incur a future tax liability in the amount of $6,564 million. it increases liabilities by that amount and recognizes a corresponding expense (tax ex-pense in this case), thus reducing net income by that amount.
10. Purchase noncash assets. Apple uses $45,993 million of its excess cash to purchase market-able securities and other assets as an investment. Thus, noncash assets increase. This is a com-mon use of excess cash, especially for high-tech companies that desire added liquidity to take advantage of opportunities in a rapidly changing industry.
11. Record depreciation. Transaction 11 is another accounting adjustment. in this case, Apple recognizes that a portion of its plant and equipment is “used up” while generating revenues. Thus, it records a portion of the PPe cost as an expense during the period. in this case, $3,277 million of PPe cost is removed from the balance sheet and transferred to the income statement as depreciation expense. net income (and earned capital) are reduced by $3,277 million.
12. Record investment income. Apple recognizes $522 of investment income in Transaction 12. Profit increases by this same amount, resulting in an increase in retained earnings.
13. Accumulated Other Comprehensive Income (AOCI). Transaction 13 is a miscellaneous ad-justment to noncash assets and an earned capital account called accumulated other compre-hensive income (AOCi), which is distinct from retained earnings. We discuss this account in Module 9.
14. Record payment of dividends. Apple declared and paid $2,523 million of dividends during the year. This is recognized as a decrease in cash and a decrease in retained earnings. The payment of dividends is not an expense, but rather a distribution of assets to stockholders. it is recognized as a direct reduction of retained earnings and is not reflected in Apple’s income statement.
We can use the column totals from the financial statement effects template to prepare Apple’s financial statements (in condensed form). We derive Apple’s 2012 balance sheet and income statement from the template as follows ($ millions).
We can summarize Apple’s cash transactions from the cash column of the template. The cash column of the financial effects template reveals that cash increases by $931 million during the year from $9,815 million to $10,746 million; see the following statement. items that contribute to this net increase are identified by the cash entries in that column (the subtotals for operating, investing, and financing sec-
2‑29 Module 2 | Introducing Financial Statements and Transaction Analysis
tions are slightly different from actual results because of simplifying assumptions we make for our transactions example).
APPLE InC. statement of Cash Flows ($ millions) For year Ended september 29, 2012
Apple’s statement of stockholders’ equity summarizes the transactions relating to its equity accounts. This statement follows and is organized into its contributed capital and earned capital categories of equity.
APPLE InC. Condensed statement of stockholders’ Equity
For year Ended september 29, 2012 Contributed Earned ($ millions) Capital Capital Total
Apple’s financial statements are abbreviated versions of those reproduced earlier in the module. We de-scribe the preparation of financial statements and other accounting details at greater length in Module 3.
BusInEss InsIgHT Controlling vs noncontrolling Interest
Financial statements are prepared on a consolidated basis. To consolidate a balance sheet, a com-pany includes all assets and liabilities of subsidiaries under its control. When a company controls a subsidiary, it directs all of the subsidiary’s operations. However, control does not imply 100% ownership; control can occur when a company owns the majority of a subsidiary’s voting stock. For example, Disney does not own 100% of the voting stock of Euro Disney, a separate legal entity. It does, however, have voting control of Euro Disney, and so, Disney is said to have a controlling interest. The ownership interest of the other stockholders of Euro Disney is titled noncontrolling interest. To better understand, assume Disney constructs a new attraction at Euro Disney. Disney does not construct only the portion of the attraction that it controls. Instead, it constructs the entire attraction. Consolidated financial statements reflect this notion of control. Disney’s balance sheet includes 100% of Euro Disney’s assets and liabilities. Yet, because it owns only a controlling per-centage in Euro Disney, Disney reports the interests of the noncontrolling stockholders as “Non-controlling interest” in the equity section of its balance sheet. The same logic applies to the income statement; that is, 100% of Euro Disney’s revenues and expenses are included in the income statement, and then the noncontrolling interest in net income is separated from the net income of the entire company. That is why we see net income apportioned at the bottom of the income state-ment into that attributable to the parent company (Disney) stockholders and that attributable to the noncontrolling stockholders of the subsidiary companies.
Module 2 | Introducing Financial Statements and Transaction Analysis 2‑30
M O D U L E - E N D R E V I E w
At December 31, 2012, assume that the condensed balance sheet of LG Display Co., Ltd. (LPL), one of Apple’s suppliers, shows the following.
Total assets. . . . . . . . . . . . . . . $350,000 Total liabilities and equity . . . . $350,000
Assume the following summary transactions occur during 2013.
1. Purchase inventory of $80,000 on credit. 2. Pay employees $10,000 cash for wages earned this year. 3. sell inventory costing $40,000 for $70,000 on credit. 4. Collect $15,000 cash from the accounts receivable in transaction 3. 5. Pay $35,000 cash toward the accounts payable in transaction 1. 6. Purchase advertising for $25,000 cash that will air next year. 7. employees earn $5,000 in wages that will not be paid until next year. 8. record $3,000 depreciation on equipment.
GLOBAL ACCOUNTINGBoth GAAP and iFrs use accrual accounting to prepare financial statements. Although there are vastly more similarities than differences, we highlight below a few of the more notable differences for finan-cial statements.
Balance Sheet The most visible difference is that many iFrs-based balance sheets are presented in reverse order of liquidity. The least liquid asset, usually goodwill, is listed first and the most liquid asset, cash, is last. The same inverse liquidity order applies to liabilities. There are also several detailed presen-tation and measurement differences that we explain in other modules. As one example, for GAAP-based balance sheets, bank overdrafts are often netted against cash balances. iFrs does not permit this netting on the balance sheet. however, the iFrs statement of cash flows does net the cash balance with any bank overdrafts and, thus, the cash balance on the statement of cash flows might not match the cash amount on the balance sheet.
Income Statement The most visible difference is that GAAP requires three years’ data on the income statement whereas iFrs requires only two. Another difference is that GAAP income statements clas-sify expenses by function and must separately report cost of goods sold, whereas iFrs permits expense classification by function (cost of sales, selling and administrative, etc.) or by type (raw materials, labor, depreciation, etc.). This means, for example, that under iFrs, there is no requirement to report a cost of sales figure. Another difference is that no item can be classified as extraordinary under iFrs. still another is that for items either unusual or infrequent, but not both, GAAP requires separate presentation in the income statement as a component of earnings from continuing operations. iFrs also requires disclosure of these items, but permits disclosure in notes to financial statements.
Statement of Cash Flows One of the more apparent differences between GAAP and iFrs is that a GAAP-based statement of cash flows classifies interest expense, interest revenue, and dividend revenue as operating cash flows, and dividends paid as financing cash flows. iFrs allows firms to choose from between the following two options:
1. Classify interest expense, dividends paid, interest revenue, and dividend revenue as operating cash flows, or
2. Classify interest expense and dividends paid as financing cash flows, and interest revenue and divi-dend revenue as investing cash flows.
2‑31 Module 2 | Introducing Financial Statements and Transaction Analysis
A P P E N D I X 2 A : Additional Information SourcesThe four financial statements are only a part of the information available to financial statement users. Additional information, from a variety of sources, provides useful insight into company operating activities and future pros-pects. This section highlights additional information sources.
Form 10-k Companies with publicly traded securities must file a detailed annual report and discussion of their business activi-ties in their Form 10-K with the seC (quarterly reports are filed on Form 10-Q). Many of the disclosures in the 10-K are mandated by law and include the following general categories: item 1, Business; item 1A, Risk Factors; item 2, Properties; item 3, Legal Proceedings; item 4, Submission of Matters to a Vote of Security Holders; item 5, Market for Registrant’s Common Equity and Related Stockholder Matters; item 6, Selected Financial Data; item 7, Management’s Discussion and Analysis of Financial Condition and Results of Operations; item 7A, Quantita-tive and Qualitative Disclosures About Market Risk; item 8, Financial Statements and Supplementary Data; item 9, Changes in and Disagreements With Accountants on Accounting and Financial Disclosure; item 9A, Controls and Procedures; item 10, Directors, Executive Officers and Corporate Governance; item 11, Executive Compen-sation; item 12, Security Ownership of Certain Beneficial Owners and Management and Related Stockholder Matters; item 13, Certain Relationships and Related Transactions, and Director Independence; item 14, Principal Accountant Fees and Services.
Description of the Business (Item 1)Companies must provide a general description of their business, including their principal products and services, the source and availability of required raw materials, all patents, trademarks, licenses, and important related agree-ments, seasonality of the business, any dependence upon a single customer, competitive conditions, including particular markets in which the company competes, the product offerings in those markets, and the status of its competitive environment. Companies must also provide a description of their overall strategy. Apple’s partial disclosure follows:
The Company is committed to bringing the best user experience to its customers through its innovative hardware, software, peripherals, and services. The Company’s business strategy leverages its unique ability to design and develop its own operating systems, hardware, application software, and services to provide its customers new products and solutions with superior ease-of-use, seamless integration, and innovative design. The Company believes continual investment in research and development, marketing and advertising is critical to the development and sale of innovative products and technologies. As part of its strategy, the Company continues to expand its platform for the discovery and delivery of third-party digital content and applications through the iTunes Store . . . The Company’s strategy also includes ex-panding its distribution network to effectively reach more customers and provide them with a high-quality sales and post-sales support experience.
Management’s Discussion and Analysis of Financial Condition and Results of Operations (Item 7) The management discussion and analysis (MD&A) section of the 10-K contains valuable insight into the compa-ny’s results of operations. in addition to an executive overview of company status and its recent operating results, the MD&A section includes information relating to its critical accounting policies and estimates used in prepar-ing its financial statements, a detailed discussion of its sales activity, year-over-year comparisons of operating activities, analysis of gross margin, operating expenses, taxes, and off-balance-sheet and contractual obligations, assessment of factors that affect future results and financial condition. item 7A reports quantitative and qualitative
Required a. record transactions 1 through 8 using the financial statement effects template. b. Prepare the income statement and balance sheet for 2013. c. show linkage(s) between the income statement and the balance sheet.
The solution is on page 2-50.
Module 2 | Introducing Financial Statements and Transaction Analysis 2‑32
disclosures about market risk. For example, Apple makes the following disclosure relating to its Mac operating system and its iPods, iPhones, iPads and other products.
The markets for the Company’s products and services are highly competitive and the Company is con-fronted by aggressive competition in all areas of its business. These markets are characterized by fre-quent product introductions and rapid technological advances that have substantially increased the ca-pabilities and use of mobile communication and media devices, personal computers, and other digital electronic devices. The Company’s competitors who sell mobile devices and personal computers based on other operating systems have aggressively cut prices and lowered their product margins to gain or maintain market share. The Company’s financial condition and operating results can be adversely affect-ed by these and other industry-wide downward pressures on gross margins. Principal competitive factors important to the Company include price, product features, relative price/performance, product quality and reliability, design innovation, a strong third-party software and peripherals ecosystem, marketing and distribution capability, service and support, and corporate reputation.
Schedule II — Valuation and Qualifying Accountsin addition to the 10-K sections described above, rule 12-09 of regulation s-X requires companies to report ad-ditional information about certain balance sheet accounts. That information explains reserves and allowances that the company establishes to reflect expected losses or uncollectible amounts. (We discuss these accounts in depth in Module 6.) Many companies comply with this requirement by including the required information in notes to financial statements or as additional information at the end of the Form 10-K. Following is a typical disclosure from Cisco, Inc., in its 2012 10-K:
Balance at end of fiscal year . . . . . . . . . . . . . . . . . . . . . . . . . . . . . $247 $122 $207
Cisco provides information relating to its reserves for anticipated losses on its lease, loan, and accounts receiv-able. Companies often provide similar analysis on estimated sales returns and deferred tax accounts. Our objective in reviewing these accounts is to determine if they are reasonable in amount and, if not, the extent to which our estimate of core operating income differs from that reported in the company’s income statement. We discuss this analysis in Module 6.
Form 20-F and Form 40-Fnon-u.s. companies that are publicly traded in the u.s. also file annual reports with the seC. These foreign com-panies must furnish, within four months after the fiscal year end, the same audited financial statements required on Form 10-K. The filing, labeled Form 20-F, requires financial statements prepared according to u.s. GAAP or iFrs. if the company uses accounting standards other than GAAP or iFrs, Form 20-F must discuss major differ-ences between the accounting principles used and GAAP. The company must provide a table that reconciles net income as reported to u.s. GAAP net income. in addition, each balance sheet item and cash flow measure that differs from u.s. GAAP, must be reconciled. Canadian companies file their annual reports, prepared under iFrs, using Form 40-F.
Form 8-kAnother useful report that is required by the seC and is publicly available is the Form 8-K. This form must be filed within four business days of any of the following events:
2‑33 Module 2 | Introducing Financial Statements and Transaction Analysis
■ entry into or termination of a material definitive agreement (including petition for bankruptcy)
■ exit from a line of business or impairment of assets
■ Change in the company’s certified public accounting firm
■ Change in control of the company
■ Departure of the company’s executive officers
■ Changes in the company’s articles of incorporation or bylaws
Outsiders typically use Form 8-K to monitor for material adverse changes in the company.
Analyst Reports sell-side analysts provide their clients with objective analyses of company operating activities. Frequently, these reports include a discussion of the competitive environment for each of the company’s principal product lines, strengths and weaknesses of the company, and an investment recommendation, including financial analysis and a stock price target. For example, Credit Suisse provides the following in its March 2013 report to clients on Apple:
08 March 2013Americas/United States
Equity ResearchIT Hardware
Apple Inc (AAPL)
COMMENT
Confi dent Long Term outlook ■ growth drivers remain intact. We hosted a call with Peter Oppenheimer, and
found his tone confi dent, yet realistic. While the company did not disclose anythingmaterial on near term fundamentals, there are several longer term growht driversthat exist for Apple. We believe at current levels the stock is discounting an overlypessimistic scenario for the long term. We relterate out OP rating and $600 PT.
■ iPhone may not be as saturated as you think. Quoting IDC data the companynoted that 45% of smartphones are now above the $400 price point; while growthmay be stronger at the low end, the company still believes the hight end of thesmartphone market will grow. Management noted Apple’s ecosystem and lowerchurn will help drive iPhone platform growth. This fi ts with our own thesis initiallydiscussed in Smartphones – High-end going higher that the high-end of thesmartphone market is growing to unprecedented leveles. Manageement confi rmedthe ability to add carriers over time, and the reasons for the slower pace of carrieradditions last year was the ramp up period of the iPhone 5. From our perspective,Apple canadd an additional 65mn units through carrier expansion alone.
■ Three levers for geographic expansion. 1) China has grown to $23bn in salesand Apple only has 11 stores in China; with an increased presence in major citiesgoing forward, the company admits it is only “scratching the surface” of thisopportunity. 2) As Apple opens its fi rst retail store in Turkey, this year taking itsretail presence to 15 countries, it is also increasing its focus on Brazil and Russiaas well as India later down the line. 3) New fi nancing terms could make Apple’sproducts more afforadable to consumers. Based on our thesis if Apple addressesEMs from a distribution perspective, it could drive an incremental $90bn in salesand $21 of EPS by 2015.
Rating ouTPERFoRM*Price(07 Mar 13, US$) 430.40Target price (US$) 600.001
52-week price range 702.10-420.05Market cap. (US$ m) 404,170.56 *Stock ratings are relative to the coverage universe in each analyst’s or each team’s respective sector.1Target price is for 12 months.
Credit Servicesseveral firms including Standard & Poor’s (StandardAndPoors.com), Moody’s Investors Service (Moodys.com), and Fitch Ratings (FitchRatings.com) provide credit analysis that assists potential lenders, investors, em-ployees, and other users in evaluating a company’s creditworthiness and future financial viability. Credit analysis is a specialized field of analysis, quite different from the equity analysis illustrated here. These firms issue credit ratings on publicly issued bonds as well as on firms’ commercial paper.
Module 2 | Introducing Financial Statements and Transaction Analysis 2‑34
Data ServicesA number of companies supply financial statement data in easy-to-download spreadsheet formats. Thomson Reuters Corporation (ThomsonReuters.com) provides a wealth of information to its database subscribers, in-cluding the widely quoted First Call summary of analysts’ earnings forecasts. standard & Poor’s provides finan-cial data for all publicly traded companies in its Compustat database. This database reports a plethora of individual data items for all publicly traded companies or for any specified subset of companies. These data are useful for performing statistical analysis and making comparisons across companies or within industries. Finally, Capital IQ (CapitalIQ.com), a division of standard & Poor’s, provides “as presented” financial data that conform to published financial statements as well as additional statistical data and analysis.
G U I D A N C E A N S w E R S
MAnAgERIAL DECIsIon you Are the securities Analyst
Of special concern is the possibility that the new CEO is shifting costs to the current period in lieu of recording them in future periods. Evidence suggests that such behavior occurs when a new management team takes con-trol. The reasoning is that the new management can blame poor current period performance on prior manage-ment and, at the same time, rid the balance sheet (and the new management team) of costs that would normally be expensed in future periods.
MAnAgERIAL DECIsIon you Are the operations Manager
The CFO desires a warranty cost estimate that corresponds to the sales generated from the new product. To ar-rive at such an estimate, you must estimate the expected number and types of deficiencies in your product and the costs to repair each deficiency per the warranty provisions. This is often a difficult task for product engineers because it forces them to focus on product failures and associated costs.
Superscript A denotes assignments based on Appendix 2A.
D I S C U S S I O N Q U E S T I O N SQ2-1. The balance sheet consists of assets, liabilities, and equity. Define each category and provide two
examples of accounts reported within each category.
Q2-2. explain how we account for a cost that creates an immediate benefit versus a cost that creates a future benefit.
Q2-3. GAAP is based on the concept of accrual accounting. Define and describe accrual accounting.
Q2-4. Analysts attempt to identify transitory items in an income statement. Define transitory items. What is the purpose of identifying transitory items?
Q2-5. What is the statement of stockholders’ equity? What useful information does it contain?
Q2-6. What is the statement of cash flows? What useful information does it contain?
Q2-7. Define and explain the concept of financial statement articulation. What insight comes from understanding articulation?
Q2-8. Describe the flow of costs for the purchase of a machine. At what point do such costs become expenses? Why is it necessary to record the expenses related to the machine in the same period as the revenues it produces?
Q2-9. What are the two essential characteristics of an asset?
Q2-10. What does the concept of liquidity refer to? explain.
Q2-11. What does the term current denote when referring to assets?
Q2-12. Assets are recorded at historical costs even though current market values might, arguably, be more relevant to financial statement readers. Describe the reasoning behind historical cost usage.
Q2-13. identify three intangible assets that are likely to be excluded from the balance sheet because they cannot be reliably measured.
Q2-14. identify three intangible assets that are recorded on the balance sheet.
Q2-15. What are accrued liabilities? Provide an example.
2‑35 Module 2 | Introducing Financial Statements and Transaction Analysis
Q2-16. Define net working capital. explain how increasing the amount of trade credit can reduce the net working capital for a company.
Q2-17. What is the difference between company book value and market value? explain why these two amounts differ.
Q2-18. The financial statement effects template includes an arrow line running from net income to earned capital. What does this arrow line denote?
Assignments with the logo in the margin are available in . See the Preface of the book for details.
M I N I E X E R C I S E SM2-19. Identifying and Classifying Financial Statement Items (LO1)
For each of the following items, indicate whether they would be reported in the balance sheet (B) or income statement (i).
a. net income d. Accumulated depreciation g. interest expense b. retained earnings e. Wages expense h. interest payable c. Depreciation expense f. Wages payable i. sales
M2-20. Identifying and Classifying Financial Statement Items (LO1)For each of the following items, indicate whether they would be reported in the balance sheet (B) or income statement (i).
a. Machinery e. Common stock i. Taxes expense b. supplies expense f. Factory buildings j. Cost of goods sold c. inventories g. receivables k. long-term debt d. sales h. Taxes payable l. Treasury stock
M2-21. Computing and Comparing Income and Cash Flow Measures (LO1)Penno Corporation recorded service revenues of $200,000 in 2013, of which $170,000 were on credit and $30,000 were for cash. Moreover, of the $170,000 credit sales for 2013, Penno collected $20,000 cash on those receivables before year-end 2013. The company also paid $25,000 cash for 2013 wages. its employees also earned another $15,000 in wages for 2013, which were not yet paid at year-end 2013. (a) Compute the company’s net income for 2013. (b) how much net cash inflow or outflow did the company generate in 2013? explain why Penno’s net income and net cash flow differ.
M2-22. Assigning Accounts to Sections of the Balance Sheet (LO1)identify each of the following accounts as a component of assets (A), liabilities (l), or equity (e).
a. Cash and cash equivalents e. long-term debt b. Wages payable f. retained earnings c. Common stock g. Additional paid-in capital d. equipment h. Taxes payable
M2-23. Determining Missing Information Using the Accounting Equation (LO1)use your knowledge of accounting relations to complete the following table for Boatsman Company.
2012 2013
Beginning retained earnings. . . . . $189,089 $ ?
Net income (loss) . . . . . . . . . . . . . ? 48,192
M2-24. Reconciling Retained Earnings (LO1)Following is financial information from Johnson & Johnson for the year ended December 30, 2012. Prepare the retained earnings reconciliation for Johnson & Johnson for the year ended December 30, 2012 ($ millions).
Module 2 | Introducing Financial Statements and Transaction Analysis 2‑36
M2-25. Analyzing Transactions to Compute Net Income (LO1)Wasley Corp., a start-up company, provided services that were acceptable to its customers and billed those customers for $350,000 in 2012. however, Wasley collected only $280,000 cash in 2012, and the remaining $70,000 was collected in 2013. Wasley employees earned $225,000 in 2012 wages that were not paid until the first week of 2013. how much net income does Wasley report for 2012? For 2013 (assuming no additional transactions)?
M2-26. Analyzing Transactions Using the Financial Statement Effects Template (LO3)report the effects for each of the following transactions using the financial statement effects template.
a. issue stock for $1,000 cash. b. Purchase inventory for $500 cash. c. sell inventory in transaction b for $3,000 on credit. d. receive $2,000 cash toward transaction c receivable.
E X E R C I S E SE2-27. Constructing Financial Statements from Account Data (LO1)
Barth Company reports the following year-end account balances at December 31, 2013. Prepare the 2013 income statement and the balance sheet as of December 31, 2013.
E2-28. Constructing Financial Statements from Transaction Data (LO1)Baiman Corporation commences operations at the beginning of January. it provides its services on credit and bills its customers $40,000 for January sales. its employees also earn January wages of $12,000 that are not paid until the first of February. Complete the following statements for the month-end of January.
Income statement
Sales. . . . . . . . . . . . . . . . . . . $
Wages expense . . . . . . . . . .
Net income (loss) . . . . . . . . . $
Balance sheet
Cash . . . . . . . . . . . . . . . . . . . $
Accounts receivable . . . . . . .
Total assets. . . . . . . . . . . . . . $
Wages payable . . . . . . . . . . . $
Retained earnings . . . . . . . .
Total liabilities and equity . . . $
E2-29. Analyzing and Reporting Financial Statement Effects of Transactions (LO3)M.e. Carter launched a professional services firm on March 1. The firm will prepare financial statements at each month-end. in March (its first month), Carter executed the following transactions. Prepare an income statement for Carter Company for the month of March.
a. Carter (owner) invested in the company, $100,000 cash and $20,000 in property and equipment. The company issued common stock to Carter.
b. The company paid $3,200 cash for rent of office furnishings and facilities for March. c. The company performed services for clients and immediately received $4,000 cash earned. d. The company performed services for clients and sent a bill for $24,000 with payment due within 60
days. e. The company compensated an office employee with $4,800 cash as salary for March. f. The company received $10,000 cash as partial payment on the amount owed from clients in
transaction d. g. The company paid $935 cash in dividends to Carter (owner).
2‑37 Module 2 | Introducing Financial Statements and Transaction Analysis
E2-30. Analyzing Transactions Using the Financial Statement Effects Template (LO3)enter the effects of each of the transactions a through g from exercise 2-29 using the financial statement effects template shown in the module.
E2-31. Identifying and Classifying Balance Sheet and Income Statement Accounts (LO1)Following are selected accounts for Staples, Inc., for the fiscal year ended February 2, 2013.
a. indicate whether each account appears on the balance sheet (B) or income statement (i). b. using the following data, compute total assets and total expenses. c. Compute net profit margin (net income/sales) and total liabilities-to-equity ratio (total liabilities/
E2-32. Identifying and Classifying Balance Sheet and Income Statement Accounts (LO1)Following are selected accounts for Target Corporation, for the fiscal year ended February 2, 2013.
a. indicate whether each account appears on the balance sheet (B) or income statement (i). b. using the following data, compute total assets and total expenses. c. Compute net profit margin (net income/sales) and total liabilities-to-equity ratio (total liabilities/
E2-33. Comparing Income Statements and Balance Sheets of Competitors (LO1)Following are selected income statement and balance sheet data from two retailers: Abercrombie & Fitch (clothing retailer in the high-end market) and TJX Companies (clothing retailer in the value-priced market), for the fiscal year ended February 2, 2013.
a. express each income statement amount as a percentage of sales. Comment on any differences observed between these two companies, especially as they relate to their respective business models.
b. express each balance sheet amount as a percentage of total assets. Comment on any differences observed between these two companies, especially as they relate to their respective business models.
c. Which company has a higher proportion of stockholders’ equity (and a lower proportion of debt)? What do the ratios tell us about relative riskiness of the two companies?
E2-34. Comparing Income Statements and Balance Sheets of Competitors (LO1)Following are selected income statement and balance sheet data from two computer competitors: Apple and Dell, for the fiscal years ended september 29, 2012 and February 1, 2013, respectively.
Total liabilities and equity . . . . . . . . $176,064 $47,540
a. express each income statement amount as a percentage of sales. Comment on any differences observed between the two companies, especially as they relate to their respective business models. (Hint: Apple’s gross profit as a percentage of sales is considerably higher than Dell’s. What aspect of Apple’s business do we believe is driving its profitability?)
b. express each balance sheet amount as a percentage of total assets. Comment on any differences observed between the two companies. Apple has chosen to structure itself with a higher proportion of equity (and a lower proportion of debt) than Dell. how does this capital structure decision affect our evaluation of the relative riskiness of these two companies?
E2-35. Comparing Income Statements and Balance Sheets of Competitors (LO1)Following are selected income statement and balance sheet data for two communications companies: Comcast and Verizon, for the year ended December 31, 2012.
Apple Inc. (AAPL)
Dell (DELL)
Comcast (CMCsA)
verizon (vz)
2‑39 Module 2 | Introducing Financial Statements and Transaction Analysis
a. express each income statement amount as a percentage of sales. Comment on any differences observed between the two companies.
b. express each balance sheet amount as a percentage of total assets. Comment on any differences observed between the two companies, especially as they relate to their respective business models.
c. Both Verizon and Comcast have chosen a capital structure with a higher proportion of liabilities than equity. how does this capital structure decision affect our evaluation of the riskiness of these two companies? Take into consideration the large level of capital expenditures that each must make to remain competitive.
E2-36. Comparing Financial Information Across Industries (LO1)use the data and computations required in parts a and b of exercises e2-33 and e2-34 to compare TJX Companies and Apple Inc.
a. Compare gross profit and net income as a percentage of sales for these two companies. how might differences in their respective business models explain the differences observed?
b. Compare sales versus total assets. What do observed differences indicate about the relative capital intensity of these two industries?
c. Which company has the higher percentage of total liabilities to stockholders’ equity? What do these ratios imply about the relative riskiness of these two companies?
d. Compare the ratio of net income to stockholders’ equity for these two companies. Which business model appears to yield higher returns on stockholder investment? using answers to parts a through c above, identify the factors that appear to drive the ratio of net income to stockholders’ equity.
E2-37. Analyzing Transactions Using the Financial Statement Effects Template (LO3)record the effect of each of the following transactions for hora Company using the financial statement effects template.
a. Wages of $500 are earned by employees but not yet paid. b. $2,000 of inventory is purchased on credit. c. inventory purchased in transaction b is sold for $4,000 on credit. d. Collected $3,000 cash from transaction c. e. equipment is acquired for $5,000 cash. f. recorded $1,000 depreciation expense on equipment from transaction e. g. Paid $10,000 cash toward a note payable that came due. h. Paid $2,000 cash for interest on borrowings.
P R O B L E M SP2-38. Constructing and Analyzing Balance Sheet Amounts from Incomplete Data (LO1)
selected balance sheet amounts for 3M Company, a manufacturer of consumer and business products, for three recent years follow.
TJx Companies (TJx)
Apple Inc. (AAPL)
3M Company (MMM)
Module 2 | Introducing Financial Statements and Transaction Analysis 2‑40
Required a. Compute the missing balance sheet amounts for each of the three years shown. b. What types of accounts would we expect to be included in current assets? in long-term assets?
P2-39. Analyzing Transactions Using the Financial Statement Effects Template (LO3)sefcik Company began operations on the first of October. Following are the transactions for its first month of business.
1. s. sefcik launched sefcik Company and invested $50,000 into the business in exchange for common stock. The company also borrowed $100,000 from a local bank.
2. sefcik Co. purchased equipment for $95,000 cash and purchased inventory of $40,000 on credit (the company still owes its suppliers for the inventory at month-end).
3. sefcik Co. sold inventory costing $30,000 for $50,000 cash. 4. sefcik Co. paid $12,000 cash for wages owed employees for October work. 5. sefcik Co. paid interest on the bank loan of $1,000 cash. 6. sefcik Co. recorded $500 of depreciation expense related to its equipment. 7. sefcik Co. paid a dividend of $2,000 cash.
Required a. record the effects of each transaction using the financial statement effects template. b. Prepare the income statement and balance sheet at the end of October.
P2-40. Analyzing Transactions Using the Financial Statement Effects Template (LO3)Following are selected transactions of Mogg Company. record the effects of each using the financial statement effects template.
1. shareholders contribute $10,000 cash to the business in exchange for common stock. 2. employees earn $500 in wages that have not been paid at period-end. 3. inventory of $3,000 is purchased on credit. 4. The inventory purchased in transaction 3 is sold for $4,500 on credit. 5. The company collected the $4,500 owed to it per transaction 4. 6. equipment is purchased for $5,000 cash. 7. Depreciation of $1,000 is recorded on the equipment from transaction 6. 8. The supplies account had a $3,800 balance at the beginning of this period; a physical count at
period-end shows that $800 of supplies are still available. no supplies were purchased during this period.
9. The company paid $12,000 cash toward the principal on a note payable; also, $500 cash is paid to cover this note’s interest expense for the period.
10. The company received $8,000 cash in advance for services to be delivered next period.
P2-41. Comparing Operating Characteristics Across Industries (LO1)Following are selected income statement and balance sheet data for companies in different industries.
Required a. Compute the following ratios for each company. 1. Gross profit/sales 2. net income/sales 3. net income/stockholders’ equity 4. liabilities/stockholders’ equity
Target Corp. (TgT)
nike (nkE)
Harley‑Davidson (Hog)
Cisco systems (CsCo)
2‑41 Module 2 | Introducing Financial Statements and Transaction Analysis
b. Comment on any differences among the companies’ gross profit to sales ratios and net income as a percentage of sales. Do differences in the companies’ business models explain the differences observed?
c. Which company reports the highest ratio of net income to equity? suggest one or more reasons for this result.
d. Which company has financed itself with the highest percentage of liabilities to equity? suggest one or more reasons why this company can take on such debt levels.
P2-42. Comparing Cash Flows Across Retailers (LO1)Following are selected accounts from the income statement and the statement of cash flows for several retailers, for their fiscal years ended in 2013.
Required a. Compute the ratio of net income to sales for each company. rank the companies on the basis of this
ratio. Do their respective business models give insight into these differences? b. Compute net cash flows from operating activities as a percentage of sales. rank the companies on
the basis of this ratio. Does this ranking coincide with the ratio rankings from part a? suggest one or more reasons for any differences you observe.
c. Compute net cash flows from investing activities as a percentage of sales. rank the companies on the basis of this ratio. Does this ranking coincide with the ratio rankings from part a? suggest one or more reasons for any differences you observe.
d. All of these companies report negative cash flows from financing activities. What does it mean for a company to have net cash outflow from financing?
P2-43. Interpreting the Statement of Cash Flows (LO1)Following is the statement of cash flows for Wal-Mart Stores, Inc.
WAL‑MART sToREs, InC. statement of Cash Flows
For year Ended January 31, 2013 ($ millions)
Cash flows from operating activities Income from continuing operations . . . . . . . . . . . . . . . . . . . . . . . . . . . . . . . . . . . . . . . . . . . . . . . . . 17,756 Adjustments to reconcile income from continuing operations to net cash provided by
Required a. Why does Wal-Mart add back depreciation to compute net cash flows from operating activities? b. explain why the increase in receivables and inventories is reported as a cash outflow. Why do
accounts payable and accrued liabilities provide a source of cash? c. Wal-Mart reports that it invested $12,898 million in property and equipment. is this an appropriate
type of expenditure for Wal-Mart to make? What relation should expenditures for PPe assets have with depreciation expense?
d. Wal-Mart indicates that it paid $7,600 million to repurchase its common stock in fiscal 2013 and, in addition, paid dividends of $5,361 million. Thus, Wal-Mart paid $12,961 million of cash to its stockholders during the year. how do we evaluate that use of cash relative to other possible uses for Wal-Mart’s cash?
e. Provide an overall assessment of Wal-Mart’s cash flows for 2013. in the analysis, consider the sources and uses of cash.
P2-44. Interpreting the Statement of Cash Flows (LO1)Following is the statement of cash flows for Verizon.
Required a. Why does Verizon add back depreciation to compute net cash flows from operating activities?
What does the size of the depreciation add-back indicate about the relative capital intensity of this industry?
b. Verizon reports that it invested $16,175 million in property and equipment. These expenditures are necessitated by market pressures as the company faces stiff competition from other communications companies, such as Comcast. Where in the 10-K might we find additional information about these capital expenditures to ascertain whether Verizon is addressing the company’s most pressing needs? What relation might we expect between the size of these capital expenditures and the amount of depreciation expense reported?
c. Verizon’s statement of cash flows indicates that the company paid $6,403 million in debt payments. What problem does Verizon’s high debt load pose for its ability to maintain the level of capital expenditures necessary to remain competitive in its industry?
d. During the year, Verizon paid dividends of $5,230 million but did not repay a sizeable portion of its debt. how do dividend payments differ from debt payments? Why would Verizon continue to pay dividends in light of cash demands for needed capital expenditures and debt repayments?
e. Provide an overall assessment of Verizon’s cash flows for 2012. in the analysis, consider the sources and uses of cash.
P2-45. Analyzing Transactions Using the Financial Statement Effects Template (LO3)On March 1, s. Penman (owner) launched AniFoods, inc., an organic foods retailing company. Following are the transactions for its first month of business.
1. s. Penman (owner) contributed $100,000 cash to the company in return for common stock. Penman also lent the company $55,000. This $55,000 note is due one year hence.
2. The company purchased equipment in the amount of $50,000, paying $10,000 cash and signing a note payable to the equipment manufacturer for the remaining balance.
3. The company purchased inventory for $80,000 cash in March. 4. The company had March sales of $100,000 of which $60,000 was for cash and $40,000 on credit.
Total cost of goods sold for its March sales was $70,000. 5. The company purchased future advertising time from a local radio station for $10,000 cash. 6. During March, $7,500 worth of radio spots purchased in transaction 5 are aired. The remaining
spots will be aired in April. 7. employee wages earned and paid during March total $17,000 cash. 8. Prior to disclosing the financial statements, the company recognized that employees had earned an
additional $1,000 in wages that will be paid in the next period. 9. The company recorded $2,000 of depreciation for March relating to its equipment.
Required a. record the effect of each transaction using the financial statement effects template. b. Prepare a March income statement and a balance sheet as of the end of March for AniFoods, inc.
P2-46. Analyzing Transactions Using the Financial Statement Effects Template (LO3)hanlon Advertising Company began the current month with the following balance sheet.
continued from prior page
Module 2 | Introducing Financial Statements and Transaction Analysis 2‑44
Following are summary transactions that occurred during the current month.
1. The company purchased supplies for $5,000 cash; none were used this month. 2. services of $2,500 were performed this month on credit. 3. services were performed for $10,000 cash this month. 4. The company purchased advertising for $8,000 cash; the ads will run next month. 5. The company received $1,200 cash as partial payment on accounts receivable from transaction 2. 6. The company paid $3,400 cash toward the accounts payable balance reported at the beginning of
the month. 7. Paid $3,500 cash toward this month’s wages expenses. 8. The company declared and paid dividends of $500 cash.
Required a. record the effects of each transaction using the financial statement effects template. b. Prepare the income statement for this month and the balance sheet as of month-end.
P2-47. Reconciling and Computing Operating Cash Flows from Net Income (LO1)Petroni Company reports the following selected results for its current calendar year.
Required a. Prepare the operating section only of Petroni Company’s statement of cash flows for the year. b. Does the positive sign on depreciation expense indicate that the company is generating cash by
recording depreciation? explain. c. explain why the increase in accounts receivable is a use of cash in the statement of cash flows. d. explain why the decrease in prepaid expense is a source of cash in the statement of cash flows.
P2-48. Analyzing Transactions Using the Financial Statement Effects Template (LO3)Werner realty Company began the month with the following balance sheet.
Following are summary transactions that occurred during the current month.
1. The company purchased $6,000 of supplies on credit. 2. The company received $8,000 cash from a new customer for services to be performed next month. 3. The company paid $6,000 cash to cover office rent for two months (the current month and the next). 4. The company billed clients for $25,000 of work performed. 5. The company paid employees $6,000 cash for work performed. 6. The company collected $25,000 cash from accounts receivable in transaction 4. 7. The company recorded $4,000 depreciation on its equipment. 8. At month-end, $2,000 of supplies purchased in transaction 1 are still available; no supplies were
available when the month began.
Required a. record the effects of each transaction using the financial statement effects template. b. Prepare the income statement for this month and the balance sheet as of month-end.
2‑45 Module 2 | Introducing Financial Statements and Transaction Analysis
I F R S A P P L I C AT I O N SI2-49. Comparing Income Statements and Balance Sheets of Competitors (LO1)
Following are selected income statement and balance sheet data from two european grocery chain companies: Tesco PLC (uK) and Ahold (The netherlands).
Required a. Prepare a common-sized income statement. To do this, express each income statement amount as a
percent of sales. Comment on any differences observed between the two companies. Ahold’s gross profit percentage of sales is considerably higher than Tesco’s. What might explain this difference?
b. Prepare a common-sized balance sheet. To do this, express each balance sheet amount as a percent of total assets. Comment on any differences observed between the two companies.
c. Ahold has chosen to structure itself with a higher proportion of equity (and a lower proportion of debt) than Tesco. how does this capital structure decision affect your assessment of the relative riskiness of these two companies?
I2-50. Interpreting the Statement of Cash Flows (LO1)
Following is the statement of cash flows for AstraZeneca, a multinational pharmaceutical conglomerate, headquartered in london, uK. The company uses iFrs for its financials and provides a conversion to u.s. $ as a convenience to investors.
net increase/(decrease) in cash and cash equivalents in the period . . . . . . . . . . . . $ 166 Cash and cash equivalents at the beginning of the period . . . . . . . . . . . . . . . . . . . . . . . 7,434 Exchange rate effects. . . . . . . . . . . . . . . . . . . . . . . . . . . . . . . . . . . . . . . . . . . . . . . . . . . . (4)
Cash and cash equivalents at the end of the period. . . . . . . . . . . . . . . . . . . . . . . . . . $ 7,596
Required a. Why does AstraZeneca add back depreciation to compute net cash flows from operating activities? b. explain why the decrease in trade and other receivables is reported as a cash inflow and the
increase in inventories is reported as a cash outflow. explain why trade and other payables and provisions are shown as a use of cash.
c. AstraZeneca reports that it invested $672 million in property and equipment. is this an appropriate type of expenditure for AstraZeneca to make? What relation should expenditures for PPe assets have with depreciation expense?
d. AstraZeneca indicates that it paid dividends of $3,665 million. how do we evaluate that use of cash relative to other possible uses for AstraZeneca’s cash?
e. Provide an overall assessment of AstraZeneca’s cash flows for 2012. in the analysis, consider the sources and uses of cash.
M A N A G E M E N T A P P L I C AT I O N SMA2-51. Understanding the Company Operating Cycle and Management Strategy (LO1)
Consider the operating cycle as depicted in exhibit 2.4, to answer the following questions.
a. Why might a company want to reduce its cash conversion cycle? (Hint: Consider the financial statement implications of reducing the cash conversion cycle.)
b. how might a company reduce its cash conversion cycle? c. examine and discuss the potential impacts on customers and suppliers of taking the actions
identified in part b.
continued from prior page
2‑47 Module 2 | Introducing Financial Statements and Transaction Analysis
MA2-52. Ethics and Governance : Understanding Revenue Recognition and Expense Recording (LO1)revenue should be recognized when it is earned and expense when incurred. Given some lack of specificity in these terms, companies have some latitude when applying GAAP to determine the timing and amount of revenues and expenses. A few companies use this latitude to manage reported earnings. some have argued that it is not necessarily bad for companies to manage earnings in that, by doing so, management (1) can better provide investors and creditors with reported earnings that are closer to “core” earnings (that is, management purges earnings of components deemed irrelevant or distracting so that share prices better reflect company performance); and (2) can present the company in the best light, which benefits both shareholders and employees—a Machiavellian argument that “the end justifies the means.”
a. is it good that GAAP is written as broadly as it is? explain. What are the pros and cons of defining accounting terms more strictly?
b. Assess (both pro and con) the Machiavellian argument above that defends managing earnings.
O N G O I N G P R O j E C T(This ongoing project began in Module 1 and continues through most of the book; even if previous segments were not completed, the requirements are still applicable to any business analysis.) The goal of this module’s project is to perform vertical analysis of the balance sheet and income statement, assess cash flows, and determine market capitalization.
1. Balance Sheet Analysis. Prepare a common size balance sheet. To facilitate this, obtain the balance sheet in a spreadsheet such as excel. Check with the sec.gov Website as many companies file their financials in spreadsheet form; look for the “interactive Data” link on the search results page. Compare the two vertical analyses and look for major differences over time and between the companies. some questions to consider:
2. Income Statement Analysis. Prepare a common size income statement. express each item on the income statement as a percent of total sales or revenue. Do this for all years on the income statement. Compare the vertical analyses and look for major differences over time and between the companies. Do any patterns emerge? some questions to consider:
3. Statement of Cash Flows Analysis. Determine the size and direction (cash source or use) of cash flows from operations, investing, and financing. One goal is to understand each company’s pattern of cash flows and to form an opinion about the general strength of their cash flows. some questions to consider:
times sum one or more line items on this statement to determine total net debt activity.) • Didthecompanyissuenewstock?• Didthecompanypaydividends?
4. Market Capitalization. Determine the market capitalization at the most recent year-end for each company. We should be able to determine the number of shares outstanding from the balance sheet. recall that shares outstanding is total shares issued less any treasury shares. We can obtain the year-end stock price from an investment Website such as seeking Alpha or Yahoo Finance. Compare market cap to the book value (total equity) of the company. Calculate and compare the companies’ market-to-book ratios.
Module 2 | Introducing Financial Statements and Transaction Analysis 2‑48
c. The linkage between the income statement and the balance sheet is retained earnings. each period, the retained earnings account is updated for net income less dividends paid. For this period, that updating follows.
Lg DIsPLAy Co., LTD. (LPL)Retained Earnings Reconciliation