+ All Categories
Home > Documents > Introducing Housing Finance in Emerging Markets Global Findings & Outlook for Turkey

Introducing Housing Finance in Emerging Markets Global Findings & Outlook for Turkey

Date post: 19-Mar-2016
Category:
Upload: brigid
View: 79 times
Download: 0 times
Share this document with a friend
Description:
Introducing Housing Finance in Emerging Markets Global Findings & Outlook for Turkey. IFC & Dunya Housing Finance Conference December 3-4, 2007 Istanbul Hans-Joachim Dübel Finpolconsult .de , Berlin. The expanding world of emerging market housing finance. - PowerPoint PPT Presentation
15
1 Introducing Housing Finance in Emerging Markets Global Findings & Outlook for Turkey IFC & Dunya Housing Finance Conference December 3-4, 2007 Istanbul Hans-Joachim Dübel Finpolconsult.de, Berlin
Transcript

1

Introducing Housing Finance in Emerging Markets

Global Findings & Outlook for Turkey

IFC & Dunya Housing Finance Conference December 3-4, 2007

Istanbul

Hans-Joachim DübelFinpolconsult.de, Berlin

2Sources: World Bank, Finpolconsult.

0%

5%

10%

15%

20%

25%

30%

35%

40%

Malays

ia

South Africa

Thailan

dKorea Chile

Mexico

Brazil

Colombia

Estonia

ChinaCze

ch

Poland

Hungary

Indonesia

India

Turke

y

Russia

Ukraine

2000

2005

LatecomerEarly birds

3

Macroeconomic crisis› Indexed instruments may not

help› Crowding out by gov

High real interest rates › Legal reform backlog› Weak institutions› Directed credit systems

(subsidies/regulations) Volatile funding sources

› International bank financing, rather than long-term portfolio/direct investment

› Immature domestic capital markets

Successful reforms ~ 95-05

0100020003000400050006000700080009000

10000

0% 5% 10% 15%Housing Loan to GDP Ratio

Real

Per

Cap

ita G

DP

Mexico Colombia

Brazil Chile

Housing loan to GDP and per capita GDP trajectories in Latin American markets

Sources: World Bank, Finpolconsult.

4

Market rates, not directed rationing)

Sufficient domestic savings volume (Asia)

Credible savings instruments› Long-term bonds› Long-term

deposits Credible

intermediaries

Real interest rates and housing loan to GDP ratio ~ 2005

Sources: World Bank, IMF, Finpolconsult.

5

With stabilization, competition, transparency› Maturities, LTVs increase› Shortening time scale.

LTV increase through› Bank self-insurance› Mortgage insurers› Contract savings/

piggybacks Maturity increase through

› Capital markets› Intermediary ALM

Public policy role?› Interest deduction raises

leverage› Rather proper regulation

Loan maturities and loan-to-value ratios in selected emerging markets

Sources: Merrill Lynch, Finpolconsult.

6

Liquidity Chile, Malaysia with long-term

bond market strategies Mexico hitting liquidity wall (as

earlier Spain), introduces covered bonds

Risk management Still imperfect, e.g. Spain swaps

fixed-rate cedulas back to floating-rate loans (Basel II deficiencies)

Ideally incentives for fixed-rate lending as low credit risk product

40%

60%

80%

100%

120%

140%

160%

180%

1990

1991

1992

1993

1994

1995

1996

1997

1998

1999

2000

2001

2002

2003

2004

2005

2006

ChileMalaysiaThailandMexicoBrazil

Ratio of private sector loans to liquid liabilities in selected emerging markets

Sources: IMF, Finpolconsult.

7

Commercial banks with access barriers, institutional constraints› Some charter competition by

finance companies Diversify from commercial

bank/ developer origination› Finance companies› Brokers› Correspondents

Requires regulation/consumer protection framework› Minimum standards for

mortgage origination› Minimum risk management

quality

0%

5%

10%

15%

20%

25%

30%

35%

India

Mexico

Poland

ChileKorea

Thailan

d

Ukraine

South Africa

Colombia

Share of non-bank, non-insurance distribution in emerging markets ~2005

Sources: Merrill Lynch, Finpolconsult.

8

Per capita GDP and housing loan to GDP ratio ~ 2005

Sources: World Bank, Finpolconsult.

9

Supporting factors:› Growth› Migration› Urbanization› Upgrading› Cohabitation

/household division

Repetition of US debacle unlikely in EMs

Household consumption to GDP ratio and housing loan to GDP ratio ~2005

Sources: United Nations, World Bank, Finpolconsult.

10

Causes for lending/price cycles

Fixed exchange rate policies attract investors with risk amnesia (Thailand, Mexico).

Lobbyist pressure to reduce lending/bond market standards, tax deductions

Conflict of interest between intermediaries and consumers/investors (US), esp. re house prices.

Severe distortions in urban land and housing markets limiting supply.

16%

24%

32%

40%

0% 5% 10% 15% 20%Housing Loan to GDP Ratio

Gro

ss F

ixed

Inve

stm

ent t

o G

DP

Rat

io

20051987

Investment and housing lending in Thailand 1987-2005

Sources: United Nations, World Bank, Finpolconsult.

11

Housing finance permanently reduces funding costs› initial house price increase.› production signal to developer

industry sets virtuous cycle in motion.

Distinct from price cycle › caused by fluctuations in

interest rates › change in mortgage

instrument (fixed-float). Emerging market experience

is divided: › Initial adjustment (Mumbai)› Bubbles (Shanghai, Kiev)› Bubbles occur without housing

finance (Moscow)

Mumbai property prices and house price income relation 1995-2005

Source: Parekh.

12

0

2

4

6

8

10

12

14

1991

1992

1993

1994

1995

1996

1997

1998

1999

2000

2001

2002

Hou

se-p

rice-

to-m

inim

um s

alar

y ra

tio

Middle income housingEconomic housingSocial housing

Access to developer finance Developer focus on lower-

middle income segments› Crisis often related to

overbuilding in high-income › Mexico, Malaysia low-income

industries with public stimulus › Thailand (Brazil upcoming)

market solutions. Pitfalls:

› Mass housing loan/production subsidies may cause misallocation (vacancies, defaults)

› Mass housing planning/agency problems (land hoarding)

Mexico – house price to minimum salary ratio in different market segments

Source: BBVA.

13

0%

5%

10%

15%

20%

25%

2005

2006

2007

2008

2009

2010

2011

2012

2013

2014

2015

Mor

tgag

es a

s %

of G

DP

Turkey Scenario ATurkey Scenario BGreece 1992-2002Italy 1992-2002

Growth, demand pressure, supply constraints drive prices, lending volumes.

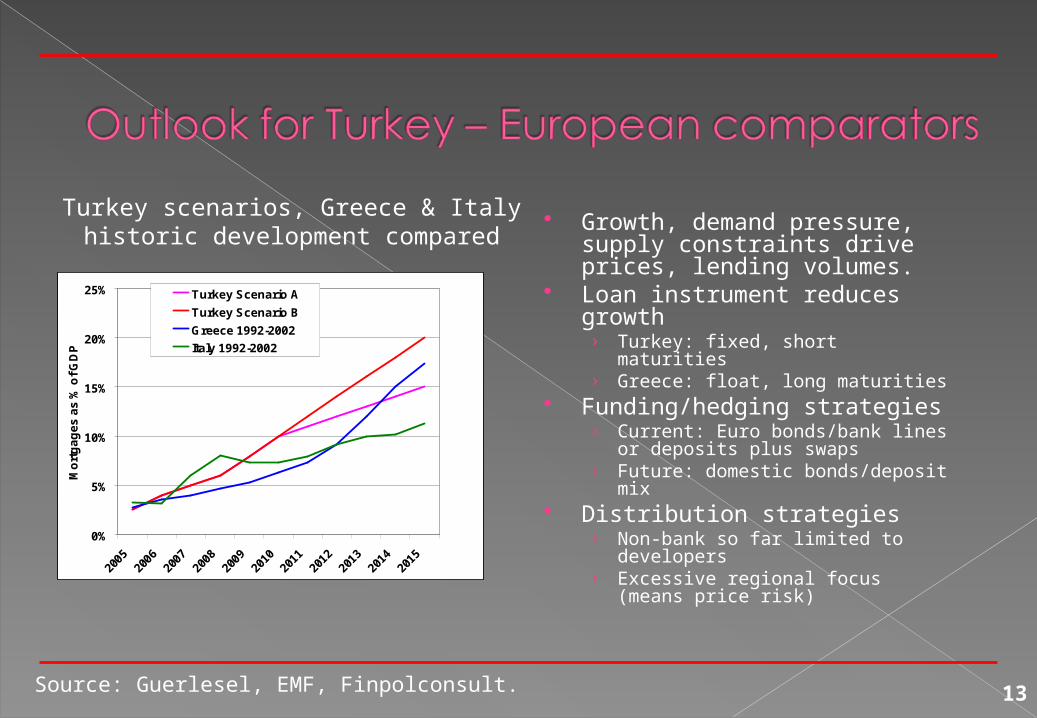
Loan instrument reduces growth› Turkey: fixed, short maturities› Greece: float, long maturities

Funding/hedging strategies› Current: Euro bonds/bank lines

or deposits plus swaps› Future: domestic bonds/deposit

mix Distribution strategies

› Non-bank so far limited to developers

› Excessive regional focus (means price risk)

Turkey scenarios, Greece & Italy historic development compared

Source: Guerlesel, EMF, Finpolconsult.

14

Lending/demand-side policies Develop local bond markets, reduce dependence on foreign lending,

swaps Avoid subsidization of mortgages, rather reduction of transactions costs

and macro/banking sector stability Strengthen public risk monitoringInvestment/supply-side policies Zoning/infrastructure policies responsive to demand Liberalize land market, reform of mass housing policy framework Unauthorized housing issue, building standards

15

Hans-Joachim (Achim) Dübel

Finpolconsult.de

[email protected]

www.finpolconsult.de


Recommended