Introducing LexTALE: A quick and valid Lexical Test for Advanced Learners of English Kristin Lemhöfer & Mirjam Broersma Published online: 5 September 2011 # The Author(s) 2011. This article is published with open access at Springerlink.com Abstract The increasing number of experimental studies on second language (L2) processing, frequently with English as the L2, calls for a practical and valid measure of English vocabulary knowledge and proficiency. In a large-scale study with Dutch and Korean speakers of L2 English, we tested whether LexTALE, a 5-min vocabulary test, is a valid predictor of English vocabulary knowledge and, possibly, even of general English proficiency. Further- more, the validity of LexTALE was compared with that of self-ratings of proficiency, a measure frequently used by L2 researchers. The results showed the following in both speaker groups: (1) LexTALE was a good predictor of English vocabulary knowledge; 2) it also correlated substantially with a measure of general English proficiency; and 3) LexTALE was generally superior to self-ratings in its predictions. LexTALE, but not self-ratings, also correlated highly with previous experimental data on two word recognition paradigms. The test can be carried out on or downloaded from www.lextale.com. Keywords English vocabulary test . Self-ratings of proficiency . Second language Introduction In recent years, cognitive scientists have become increas- ingly interested in how bilingual speakers process words, phrases, and sentences in their second language (L2). In psycholinguistic studies involving L2 speakers, however, a problem arises that is virtually absent in monolingual research—namely, the enormous variability of the partic- ipants’ proficiency levels and, in particular, of levels of vocabulary size, even within learner groups exposed to relatively homogeneous learning conditions. Such differ- ences are important because many, if not all, processes within the L2 system have been found to change funda- mentally—quantitatively, but also qualitatively—with variable levels of proficiency. For instance, on the neuro- cognitive level, neuroimaging and ERP studies have demonstrated that the patterns of brain activation of highly proficient L2 speakers very much resemble those of native speakers, while those of less proficient speakers do not (for reviews, see Abutalebi, 2008; Kotz, 2009). Within the field of word processing in L2, the focus of the present study, different patterns of effects have been observed for high- versus low-proficient speakers in translation production and recognition (Prior, MacWhinney, & Kroll, 2007; Talamas, Kroll, & Dufour, 1999), spoken word processing (Blumenfeld & Marian, 2007), and phonological processes in word reading (Haigh & Jared, 2007; Jared & Kroll, 2001). Given the central role of proficiency— or vocabulary knowledge, in the case of single word processing—in L2 research, it is alarming how little consensus there is on how to measure it. Most bilingual studies within experimental psychology rely on participants’ self-ratings of proficiency and language background questionnaires as the only source of proficiency information. In contrast, those researchers that do attempt to measure L2 aptitude more objectively are K. Lemhöfer Radboud University Nijmegen, Nijmegen, The Netherlands M. Broersma Max Planck Institute for Psycholinguistics, Nijmegen, The Netherlands K. Lemhöfer (*) Donders Institute for Brain, Cognition, and Behaviour - Centre for Cognition, Radboud University Nijmegen, P.O. Box 9104, 6500 HE Nijmegen, The Netherlands e-mail: [email protected]Behav Res (2012) 44:325–343 DOI 10.3758/s13428-011-0146-0
Transcript
Introducing LexTALE: A quick and valid LexicalTest for Advanced Learners of English
Kristin Lemhöfer & Mirjam Broersma
Published online: 5 September 2011# The Author(s) 2011. This article is published with open access at Springerlink.com
Abstract The increasing number of experimental studieson second language (L2) processing, frequently withEnglish as the L2, calls for a practical and valid measureof English vocabulary knowledge and proficiency. In alarge-scale study with Dutch and Korean speakers of L2English, we tested whether LexTALE, a 5-min vocabularytest, is a valid predictor of English vocabulary knowledgeand, possibly, even of general English proficiency. Further-more, the validity of LexTALE was compared with that ofself-ratings of proficiency, a measure frequently used by L2researchers. The results showed the following in bothspeaker groups: (1) LexTALE was a good predictor ofEnglish vocabulary knowledge; 2) it also correlatedsubstantially with a measure of general English proficiency;and 3) LexTALE was generally superior to self-ratings in itspredictions. LexTALE, but not self-ratings, also correlatedhighly with previous experimental data on two wordrecognition paradigms. The test can be carried out on ordownloaded from www.lextale.com.
Keywords English vocabulary test .
Self-ratings of proficiency . Second language
Introduction
In recent years, cognitive scientists have become increas-ingly interested in how bilingual speakers process words,phrases, and sentences in their second language (L2). Inpsycholinguistic studies involving L2 speakers, however, aproblem arises that is virtually absent in monolingualresearch—namely, the enormous variability of the partic-ipants’ proficiency levels and, in particular, of levels ofvocabulary size, even within learner groups exposed torelatively homogeneous learning conditions. Such differ-ences are important because many, if not all, processeswithin the L2 system have been found to change funda-mentally—quantitatively, but also qualitatively—withvariable levels of proficiency. For instance, on the neuro-cognitive level, neuroimaging and ERP studies havedemonstrated that the patterns of brain activation of highlyproficient L2 speakers very much resemble those of nativespeakers, while those of less proficient speakers do not (forreviews, see Abutalebi, 2008; Kotz, 2009). Within the fieldof word processing in L2, the focus of the present study,different patterns of effects have been observed for high-versus low-proficient speakers in translation production andrecognition (Prior, MacWhinney, & Kroll, 2007; Talamas,Kroll, & Dufour, 1999), spoken word processing (Blumenfeld& Marian, 2007), and phonological processes in word reading(Haigh & Jared, 2007; Jared & Kroll, 2001).
Given the central role of proficiency— or vocabularyknowledge, in the case of single word processing—in L2research, it is alarming how little consensus there is on howto measure it. Most bilingual studies within experimentalpsychology rely on participants’ self-ratings of proficiencyand language background questionnaires as the only sourceof proficiency information. In contrast, those researchersthat do attempt to measure L2 aptitude more objectively are
K. LemhöferRadboud University Nijmegen,Nijmegen, The Netherlands
M. BroersmaMax Planck Institute for Psycholinguistics,Nijmegen, The Netherlands
K. Lemhöfer (*)Donders Institute for Brain, Cognition, and Behaviour - Centre forCognition, Radboud University Nijmegen,P.O. Box 9104, 6500 HE Nijmegen, The Netherlandse-mail: [email protected]
Behav Res (2012) 44:325–343DOI 10.3758/s13428-011-0146-0
confronted with an enormous number of (commercial ornoncommercial) tests, subtests, and measures, most ofwhich have never been adapted or validated for theexperimental situation. To illustrate this scattered picture,Table 1 gives an overview of the measures used in allstudies concerned with adult L2 word processing in abroader sense, with English as L2, published in topexperimental psychology journals with an impact factor ofabove 2.0 (according to Web of Science) between 2009 andthe present.1
Table 1 shows that among the 18 listed studies, only 5used an objective aptitude test that was independent of theexperiment itself (marked in bold), but all of these fivemeasures were different from each other. The other 13studies, including 2 that explicitly aimed to study thepotentially modulating role of proficiency, relied on varyingversions of self-ratings and language background question-naires, the validity of which has only rarely been tested (foran exception, see Marian, Blumenfeld, & Kaushanskaya,2007). Apparently, the currently available tests are toocostly, impractical, unknown, or inaccessible for researchersto use, or it may be widely believed that biographicalreports and self-rated proficiency scores are sufficient tocapture differences in language aptitude. However, whetherthe latter is the case remains questionable (Delgado,Guerrero, Goggin, & Ellis, 1999; Lemmon & Goggin,1989); furthermore, the validity of self-ratings seems to beaffected by additional factors, such as whether they areacquired before or after further language tests or the mainexperiment (Delgado et al., 1999), a procedural detail thatis not standardized across psycholinguistic L2 experiments.
From this, it becomes clear that a practical and validapproach is needed to measure the relevant aspects ofproficiency in a quick and easy manner and, if possible, toreach some standardization across different research groups.This article focuses on the measurement of L2 vocabularyknowledge, which is especially relevant to the field ofsingle-word processing in bilinguals but is probably alsorelevant to most other domains of L2 processing. As such ameasure, for medium to highly proficient speakers of L2English, we are proposing a simple and short yes/novocabulary test called LexTALE (Lexical Test for AdvancedLearners of English). Since English is developing to be theworld’s primary lingua franca, it is probably also theworld’s most important L2, and a substantial part of L2studies are carried out with English as the target language(see also Table 1). Thus, while the need for comparable testmethods for a broader range of languages is undisputed, a
starting point will be to investigate whether such a shortyes/no vocabulary test is a valid measure of vocabularyknowledge in English.
LexTALE takes only 5 min to complete, is free andeasily implemented (on the Internet at www.lextale.com, asa lexical decision task in experimental software, or even onpaper), making it a practically feasible addition to anypsycholinguistic experiment. The target population of thetest is adult learners who started learning English at schoolat an age of about 10–12 years, which is standard in manycountries, and who continue to use English in daily life—for example, at a university or through the media. Suchhigh-proficient, but “unbalanced” bilinguals are the popu-lation of interest in many experimental bilingual studies(e.g., Broersma, 2010; de Groot, Borgwaldt, Bos, & vanden Eijnden, 2002; Lemhöfer et al., 2008; Ota, Hartsuiker,& Haywood, 2009). Given the large number of L2 studiesthat use self-ratings as the only measure (see Table 1), afurther important question will be how the validity of theLexTALE test compares with that of self-ratings.
Within the language testing literature, yes/no vocabularytests have been proposed as easy alternatives for multiple-choice tests (Meara & Buxton, 1987) or for studentplacement (Meara & Jones, 1988). Several studies havecompared the yes/no tests with the more widely usedVocabulary Levels Test (Nation, 1990), in which wordshave to be matched with their definitions. The results weremixed: For instance, Cameron (2002) did not find signif-icant correlations between the two test types, whileMochida and Harrington (2006) reported high correlationsof above .80. These conflicting results might be due todifferences regarding the level of proficiency of participantsor the specific item selection of the two tests.
Given the lack of a widely recognized, standard test forEnglish vocabulary knowledge that we could use as anexternal criterion to validate LexTALE and self-ratings, wewill assess word translation performance, both from L1 toL2 (English) and vice versa, as an external, highly face-valid (i.e., valid by common sense) criterion against whichLexTALE and self-ratings will be validated. Word transla-tion has occasionally been used as a proficiency criterion inL2 studies, either as a proficiency/vocabulary knowledgemeasure (Rossi, Gugler, Friederici, & Hahne, 2006) or,administered after the experiment and using the samestimuli, as an indicator of whether the stimuli in theexperiment were known to the participants (e.g., Brysbaert,van Dyck, & van de Poel, 1999; Midgley, Holcomb, &Grainger, 2009). While the latter certainly provides valu-able additional information on the data obtained in theprevious experiment, word translation is not very practicalas a standard measure of vocabulary: It requires a close andtime-consuming inspection of the responses to distinguishmere spelling and typing mistakes from real translation
1 Note. According to a search in ISI Web of Knowledge: Topic =word* AND Topic = (L2 OR “second language” OR nonnative ORbilingual*) AND Topic = English, field = psychology ANDPublication year > = 2009
errors, and which responses are counted as correct dependsto some extent on subjective judgment. Furthermore, aword that is easily translated into one language might behard to translate in another (e.g., because of severalpossible translations; Prior et al., 2007). In spite of theseshortcomings that make translation inappropriate for stan-dard vocabulary tests, we will use it in the present
experiment as criterion, first because of the lack of awidely recognized standardized test for vocabulary size,and second because the ability to translate a word probablyrepresents most closely what is generally understood byknowing a word in a foreign language.
Besides the translation task as the main criterion forvocabulary knowledge, we also included a more general
Table 1 Proficiency measures in studies on L2 (English) word processing in top experimental psychology journals since 2009, with objectivemeasures printed in bold
Article Topic Task “Proficiency” Measure
Canseco-Gonzalez et al., (2010) cross-language competition inauditory lexical access, roleof age of L2 acquisition
visual world paradigm “phone screening,” languagebackground questionnaire
Chambers and Cooke, (2009) lexical competition in L2 speechcomprehension, role ofproficiency
visual world paradigm language background questionnaireand self-ratings of proficiency
Dijkstra, Miwa, Brummelhuis,Sappeli, and Baayen, (2010)
visual word recognition of cognates lexical decision, languagedecision, progressivedemasking
language background questionnaire
Elston-Güttler and Gunter,(2009)
processing of interlingualhomographs, role ofproficiency
sentence reading(incl. ERPs)
language background questionnaireand self-ratings of proficiency
FitzPatrick and Indefrey, (2010) lexical competition in L2 speechcomprehension
sentence listening(incl. ERPs)
50 items of Oxford Placement Testand LexTALE
Fontes and Schwartz, (2010) cross-language influence onrepresentation of homonyms
sentence generation language background questionnaireand self-ratings
Leonard et al., (2010) spatiotemporal dynamics ofbilingual word processing
size judgment task onwords and pictures
self-ratings of proficiency
Libben and Titone, (2009) processing of interlingualhomographs and cognatesin sentences
sentence reading(incl. eye movementrecordings)
language background questionnaireand self-ratings of proficiency
Liu, Guo, and Peng, (2009) neural organization of L1and L2 production
L1 and L2 picture naming self-ratings of proficiency
Macizo, Bajo, andCruz Martin, (2010)
processing of interlingualhomographs
word relation judgments language background questionnaireand self-ratings of proficiency
Midgley, Holcomb, andGrainger, (2009)
time-course of form and meaningactivation during L2 wordrecognition
visual word identification(animal name detection)
language background questionnaireand self-ratings, L2-L1 translationof experimental items
Ota, Hartsuiker, andHaywood, (2009)
L2 recognition of near-homophones semantic relationshipjudgment
language background questionnaire
Palmer, van Hooff, andHaavelka, (2010) (Exp. 1)
word–concept mapping inbilingual memory
translation recognitionand ERPs
language background questionnaireand self-ratings of proficiency
van der Meij, Cuetos,Carreiras, and Barber, (2011)
language switching,role of proficiency
sentence reading(incl. ERPs)
in-house English aptitude test(60 multiple-choice questionson grammar and vocabulary)
Verhoef, Roelofs,and Chwilla, (2010)
language switching picture naming with languageswitching (incl. ERPs)
language background questionnaireand self-ratings of proficiency
White, Melhorn,and Mattys, (2010)
segmentation in speech processing lexical decision with cross-modal form priming
DIALANG test
Winskel, Radach, andLuksaneeyanawin, (2009)
effect of interword spacesin L1 and L2
sentence reading (incl. eyemovement recordings)
Word Comprehension Antonymsand Synonyms subtests of theWoodcock Reading MasteryTests–Revised
Zhou, Chen, Yang,and Dunlap, (2010)
homophone priming, roleof proficiency
naming, lexical decision Mix of TOEFL / Graduate RecordExamination (GRE) / Test forEnglish Majors (TEM) / CollegeEnglish Test 4 (CET4)
Behav Res (2012) 44:325–343 327
proficiency test of English to examine its relationship withLexTALE. While it seems unlikely that a brief vocabularytest like LexTALE can measure general English proficiencyaccurately, it is possible that it captures a part of it.Proficiency certainly entails many higher-order skills, butvocabulary knowledge should surely be a part of it too (see,e.g., Qian, 2002, and Stæhr, 2009, for the relationshipbetween vocabulary knowledge and reading or listeningcomprehension). In case of a significant relationshipbetween LexTALE and general proficiency level, LexTALEcould be used as a rough indication of proficiency when noother, more accurate measure is available, as is the case inmost psycholinguistic L2 experiments. Given the restric-tions of a one-session online study, we chose the QuickPlacement Test (2001; QPT) as a test for general proficiencylevel. As a commercial test, it has been validated on severalthousand students (Quick Placement Test, 2001) and is usedby universities and adult education institutions to assignstudents to English course levels or as an admissionrequirement for academic programs taught in English. It isalso occasionally used for proficiency assessment in L2studies (e.g., Hawkins et al., 2006); however, with a testduration of up to 45 min (15 min on average), and not beingfree, it is both too long and too costly to serve as a standardtool in psycholinguistic studies. Note that with the QPTbeing a mere placement test, it cannot be claimed that theQPT measures English proficiency with great accuracy, but itshould certainly provide an approximate estimate forproficiency.
We will investigate two issues: first, the relationshipbetween LexTALE and translation performance and, sec-ond, the relationship between LexTALE and scores on theQPT, in comparison with self-ratings of proficiency. Theseself-ratings were assessed separately for writing, reading,listening, and speaking proficiency, as many questionnairesdo. This part of this study, including LexTALE, wordtranslation, the QPT, and self-ratings, was carried out as anonline study with two populations with very different nativelanguage backgrounds—namely, participants in the Nether-lands and in Korea. Using a group of participants with verymixed first language (L1) backgrounds was not possiblebecause it would have made the use of a translation taskimpossible. However, we felt that the validity of LexTALEshould be assessed for more than only one specific speakergroup and, thereby, rule out that it “works” for oneparticular L1 only. If there are differences in the usefulnessof LexTALE for speakers of different L1s, these shouldemerge in the comparison of these two very distant speakergroups (for a similar reasoning, applied to the age-of-arrival–proficiency relation, see Hakuta, Bialystok, &Wiley, 2003).
In a second part of this study, we investigated how wellLexTALE predicts participants’ performance in two exper-
imental word recognition paradigms, again in comparisonwith self-ratings. Since LexTALE is especially tailored tothe needs of psycholinguistics experimenters, it should beclosely related to performance in word recognition tasksthat are typically used in experimental studies. To this end,we reanalyzed the data of two earlier studies, those ofLemhöfer and Dijkstra (2004) and Lemhöfer et al. (2008),in which both LexTALE and rating scores were collected.The first of these studies made use of the lexical decisiontask, while the latter employed a version of a visual wordidentification task, the progressive demasking (PDM)paradigm. The lexical decision task is both one of the mostwidely used tasks in psycholinguistics and the task that ismost similar to the procedure in LexTALE itself. The PDM,on the other hand, employs a very different method andmight tap into different processing levels than the LexTALEtest. The results will show whether LexTALE scores arecorrelated to participant performance in these two verydifferent experimental paradigms.
Method
Participants
Seventy-two native speakers of Dutch (58 female) and 87native speakers of Korean (31 female) participated in thisstudy for a small fee. The Dutch participants were recruitedfrom the participant pool of the Max Planck Institute forPsycholinguistics—for the greatest part, consisting ofstudents at Radboud University Nijmegen (the Nether-lands). The Korean participants were students at HanyangUniversity, Seoul (Korea).
We assumed that, due to the frequent exposure thatDutch students have to English (at school, at a university, inthe media, and in daily life) and the common Germanicroots of the two languages, proficiency in English would behigher in the Dutch than in the Korean sample. To obtaingroups as comparable as possible, we therefore selectedKorean participants on the basis of their TOEIC® (Test ofEnglish for International Communication™) scores, anEnglish comprehension test including reading and listeningcomprehension that is widely used in Korea. Koreanstudents with a self-reported TOEIC score of at least 750were recruited, which corresponds to the graduationrequirement for students of English at several leadinguniversities in Seoul. Furthermore, a score of 750 or abovecorresponds to the upper 23% of all TOEIC scores obtainedby Korean participants in 2007 (TOEIC newsletter, 2008).After participation, Korean participants were asked toprovide proof (i.e., certificates) of their self-reported scores.Seventy of the 87 participants did so, which is why we havereliable TOEIC scores only for that subset of the Korean
328 Behav Res (2012) 44:325–343
participant sample. The mean (self-reported as well asverified) TOEIC score of our participants was 887 (seeTable 2 for more details).
Participants were, on average, 21.9 (Dutch) and 23.2(Korean) years old and reported having grown up mono-lingually. Most had started learning English in elementaryor high school. Seven of the Dutch and 24 of the Koreanparticipants stated that they had started learning Englishbefore the start of English education at school. Furthercharacteristics of the two participant groups with respect tobackground in English, as reported in a language back-ground questionnaire, will be given in the Results section.
General procedure
The experiment was an online study that participantscarried out at home or on a public computer. We opted forthis form of study because it enabled us to test a muchlarger number of participants than when using a “conven-tional” experimental setting. The study consisted of fiveparts assessing different aspects of English skills (theLexTALE test, translation from L1 to L2, translation fromL2 to L1, the QPT, and self-ratings of English proficiency),which will be described separately in the followingsections. In a general instruction appearing on the screenbefore the test parts, participants were told that the aim ofthe study was to evaluate different sorts of tests and testitems in order to develop a new English test and that theyshould answer the questions conscientiously, even thoughthe level of difficulty might be quite high. All instructionsthroughout the experiment were given in the participants’native language (Dutch or Korean). Participants were giventhe choice as to whether they would like to receive theirpersonal scores and ranks relative to the other participantsafter data analysis. The five test parts and the items withineach test part were presented in the same order to allparticipants.
Part 1: LexTALE
Materials LexTALE consists of 60 items (40 words, 20nonwords) selected from the 240 items of an unpublishedvocabulary size test (called “10 K”) by P. Meara andcolleagues (Meara, 1996). Both the 10 K and our subset ofit contain twice as many words as nonwords. The reason forthis “unbalanced” proportion is that the words are so low infrequency that it is unlikely that any of the participants willknow them all (turning a considerable number of the worditems into subjective nonwords). To make the subjectiveproportions of words and nonwords more equal, a highernumber of words than nonwords is included.
The 60 out of 240 items were selected on the basis of apilot study with 18 Dutch participants from the same
population as that in the final experiment. These 18participants made a word/nonword decision on all 240items. Separately for words and nonwords, four categoriesof difficulty were formed, based on percentage of correctscores. For each item, the item–whole correlation (itemdiscrimination) was calculated, as an indicator of how wellan item discriminates good from poor total performance. Ofeach of the four difficulty categories, the 25% with thehighest item–whole correlations were selected for theLexTALE. This way, LexTALE is comparable in difficultywith the original 10 K but optimized with respect to thediscriminative power of the items.
The items of the LexTALE are between 4 and 12 letterslong (mean: 7.3). The 40 words have a mean frequency ofbetween 1 and 26 (mean: 6.4) occurrences per millionaccording to the CELEX database (Baayen, Piepenbrock, &Gulikers, 1995). Fifteen of the words are nouns, 12 areadjectives, 1 is a verb, 2 are verb participles, 2 are adverbs,and 8 can belong to two different syntactic classes (e.g.,both a verb and a noun, such as dispatch). The nonwordsare orthographically legal and pronounceable nonsensestrings created either by changing a number of letters inan existing word (e.g., proom) or by recombining existingmorphemes (e.g., rebondicate). None of the nonwords areexisting words in Dutch or Korean. All items are listed inAppendix A.
Procedure Participants received written instructions that theywere going to be shown a series of letter strings, some ofwhich were existing English words and some of which werenot. They were asked to indicate for each item whether it wasan existing English word or not, by pressing either the “y” key(for yes) or the “n” key (for no). In case of doubt, participantswere instructed to respond no. The instructions also explainedthat the task was not speeded and that the spelling of the itemswould be British.2 Finally, they asked participants explicitlynot to look the items up in a dictionary, because the datawould otherwise not be informative.
Items were presented one by one on the screen. Theorder of items was fixed, such that no more than five wordsor nonwords appeared in a row. On average, the LexTALEin our study took 3.5 min to complete (SD = 1.15 min).
Scoring There are several possible methods to score yes/notests. We employed three different ones. The first one is asimple percentage correct measure, but corrected for theunequal proportion of words and nonwords by averagingthe percentages correct for these two item types. This way, ayes bias (creating high error rates in the nonwords) wouldbe “penalized” in the same way as a no bias would (causing
2 There was only one item for which American and British spellingsdiffered (savoury).
Behav Res (2012) 44:325–343 329
high error rates for words), independently of the differentnumbers of words versus nonwords. We will call thismeasure % correctav (averaged % correct). The secondmeasure was ΔM, proposed by P. Meara as a scoringmethod for yes/no vocabulary tests (Meara, 1992). ΔM liesbetween 0 and 1 and is supposed to represent the proportionof words (within the given range of word frequency) that isknown by the participant. Guessing is corrected for by anadditional “penalty” for false alarms (i.e., nonwordsresponded to with yes) in the calculation of the score. Theformula for calculating ΔM is presented in Appendix B.The third scoring method called ISDT is supposed toovercome some shortcomings of ΔM and has beendeveloped by Huibregtse, Admiraal, and Meara (2002). Itis based on signal detection theory (SDT) and corrects forboth guessing and personal response style (e.g., bias towardyes or no responses). The formula for calculating ISDT canalso be found in Appendix B.
Part 2: L2 (English)–L1 (Dutch/Korean) translation
Materials Thirty English nouns3 were selected from thenumber-of-translations norms for English–Dutch by Toko-wicz, Kroll, de Groot, and van Hell (2002). Given that thepresent study aimed at assessing English skills in advancedspeakers, the usage of the norms enabled us to select wordswith an already established high level of translationdifficulty (for native speakers of Dutch, but probably alsofor speakers of other L1s). Only words with no more thanthree different translations according to the norms wereselected. To achieve a high level of difficulty, all items hadtranslation error rates (including omissions) of at least 50%in the Tokowicz et al. study. The mean error rate for ouritem set in Tokowicz et al. was 60.5% (SD = 17.2), themean number of different translations in the norms was1.13 (SD = 0.6), and the average frequency according to theCELEX database (Baayen et al., 1995) was 18.5 occur-rences per million (SD = 14.7). All items are listed inAppendix A.
Procedure Participants saw a new instruction on the screen,telling them that in each trial they would see an Englishword and that they were to type its translation (or one ofthem, if they knew several) in the designated field. Whenthey did not know the translation of an item, they wereinstructed to type a question mark. The next word appearedafter the participant had pressed the Enter button.
Scoring For scoring, the English–Dutch translations and alltranslations given in the Tokowicz et al. (2002) norms, aswell as those listed by the Van Dale English–Dutchdictionary (Martin et al., 1984), were counted as correctresponses. Furthermore, obvious spelling mistakes in theDutch responses, as judged by the first author, werecounted as correct as well (e.g., pijk instead of pijl ‘arrow’,with pijk not being a Dutch word and “k” and “l” beingadjacent letters on the keyboard).
For the Korean responses, all possible translations fromthe Sharp electronic dictionary, model PW-K300 (contain-ing the YBM-Sisa e4u English–Korean dictionary, theYBM-Sisa e4u Korean–English dictionary, and the OxfordAdvanced Learner's Dictionary) were counted as correct.Again, obvious spelling mistakes (i.e., when the responsedid not form a legal Korean word, and when it deviatedfrom one of the expected translations in only one letterfeature) were counted as correct. The final score of this testpart was the percentage of correct responses.
Part 3: L1 (Dutch/Korean)–L2 (English) translation
Materials Another 30 English nouns were selected fromthe Tokowicz et al. (2002) norms for this test part. Theirdominant Dutch translations according to the norms wereused as stimuli in the Dutch–English translation task. Allthese Dutch nouns had three or fewer different translations,as well as error rates of above 50% according to theTokowicz et al. norms. For the Korean–English translationtask, Korean translations of the 30 English nouns wereretrieved and translated back into English, using the above-mentioned dictionary. For each English noun, the Koreanword that was most likely to be translated into the intendedEnglish word and that shared most aspects of its meaningaccording to the dictionary was selected. The meantranslation error rate of the 30 Dutch nouns in the Tokowiczet al. data was 61.7% (SD = 13.9). Their mean frequencyaccording to the Dutch part of the CELEX database was23.3 occurrences per million (SD = 23.7); for the Koreanstimuli, there are no frequency counts or translation normsavailable. All items are listed in Appendix A.
Procedure Participants received a written instruction thatthey would now be asked to translate Dutch or Koreanwords into English. They were also told not to worry aboutspelling mistakes. The procedure was identical to that inPart 2. The mean duration of the complete translationsection (L1–L2 and L2–L1 translation) was 8.0 min (SD =2.9 min).
Scoring In analogy to Part 2, for scoring the Dutch–Englishtranslations, all translations given in the Tokowicz et al.
3 As is very common in English, some of the items were both nounsand verbs (e.g., soil) or nouns and adjectives (e.g., heathen), but allselected words were translated as nouns only in the Tokowicz et al.(2002) norms.
330 Behav Res (2012) 44:325–343
(2002) norms, as well as by the Van Dale Dutch–Englishdictionary (Martin et al., 1984), were counted as correctresponses. Similarly, all alternative English translations forthe Korean items, as listed in the dictionary, were regardedas correct. Again, obvious spelling mistakes and spellingsthat preserved the phonology of one of the target trans-lations (e.g., speach instead of speech) were consideredcorrect.
Part 4: Quick Placement Test (QPT)
Materials As a general, relatively quick English proficien-cy test suitable for online testing, we used the QPT (2001).This test, intended for student placement, can be used togroup learners in seven levels linked to the CommonEuropean Framework (CEF) for language levels, ranging
from beginner to upper advanced. It assesses reading skills,vocabulary, and grammar. The full test (parts 1 and 2) takesapproximately 15 min and consists of 60 multiple-choicequestions with increasing levels of difficulty, includingdiscrete multiple-choice questions and multiple-choicecloze questions (i.e., text passages with gaps that have tobe filled with one of three or four alternatives). Weadministered both part 1, intended for all learners, and part2, intended for advanced learners only. In part 2, thedifferences between the alternative responses are often verysubtle (e.g., mostly, chiefly, greatly, widely), making the testdifficult also for highly proficient speakers of English.Scores were obtained by calculating the percentage ofcorrect responses.
Procedure Participants received an instruction that in-formed them they would now receive multiple-choice
Table 2 Results of the individual test parts in the two participant groups
Dutch Participants Korean Participants
Test Part Variable Mean (SD) Range Mean (SD) Range
LexTALE Hit rate in % 68.1 (17.5) 25–100 72.9 (13.4) 27–100
Median of all four ratings 4.5 (1.2) 2–7 4.3 (1.2) 1–7
Mean of all four ratings* 4.8 (1.0) 2.8–7.0 4.4 (0.9) 2.3–6.5
Note. Variables with significant differences between Dutch and Korean participants, as revealed by two-tailed t-tests (p < .05), are marked with anasterisk.
QPT = Quick Placement Test, LBQ = language background questionnaire.a Available for a subset of 70 Korean participants only.
Behav Res (2012) 44:325–343 331
questions, which would be the last “test” part of the study.On average, it took participants 15.0 min to complete thistest part (SD = 5.6 min).
Part 5: Self-ratings and language background questionnaire
Materials In the final part of the study, participantsreceived questions on their history and experience withthe English language. The questions assessed since when,under which circumstances, and how intensively theparticipants used English and how experienced they werein different language domains (reading, speaking, etc.) intheir own view. The ratings of experience (“How muchreading/writing/speaking/listening experience do you havewith the English language?”) were to be given on a scalefrom 1 (very little experience) to 7 (very much experience).They were the measures we were interested in regardingtheir predictive power of proficiency; the other ratings weremeant to obtain a detailed picture of the circumstances ofthe participants’ language acquisition.
Procedure The questions appeared on the screen one byone in their native language. Some were open questions thatrequired a response to be typed in (e.g., How many years ofexperience do you have with the English language?); otherswere yes/no or rating questions for which responses weregiven in a pull-down menu. No general score wascalculated for this part of the study.
Results
Table 2 shows the results of the different test parts for thetwo participant groups. In Appendix C, a more detaileddescription of the score distribution of LexTALE in this andprevious studies is given.
Table 2 shows that, on average, the Dutch participantsscored significantly higher on the LexTALE (all threemeasures) and on the QPT than did the Korean participants.Furthermore, the Dutch group was younger and had feweryears of experience with English than did the Koreans.Dutch participants reported spending more time listening toEnglish radio or watching English TV but less time readingEnglish than did the Korean group. Finally, Dutch partic-ipants rated their reading experience significantly higherthan Korean participants did, which also resulted in highermean values of all four experience ratings.
To get an indication of test consistency across the twogroups, we calculated the item intercorrelations for each testpart (i.e., between the mean item performances for theDutch and Korean groups). Because of the different
response strategies in the two groups with respect toLexTALE that became apparent in the large difference infalse alarm rates (to be discussed later on), we calculatedthese item correlations for words and nonwords separately.The results for the LexTALE showed substantial correla-tions that were, furthermore, of almost equal size for wordsand nonwords (words, r = .77; nonwords, r = .76; both ps <.001). For the translation from English into the participants’L1, where identical stimuli were presented to both groups,the correlation was .79 (p < .001) and, thus, comparable tothat of the LexTALE part. For the translation into English(L1–L2), the test involved different stimuli in Dutch andKorean, with different sets of translation alternatives intoEnglish (e.g., the Korean word for grape can also meansidewalk or pavement, which is not the case for the Dutchtranslation of grape). Consequently, the correlation betweenthe groups was lower but still significant (r = .37, p < .05).In the QPT, the correlation of item error rates for Dutch andKorean participants was .72 (p < .001), again comparable toall other test parts where identical stimuli were presented.
Relations between the test parts
Before looking at the intercorrelations between the testparts, we report the split-half reliabilities of each test part,which represents an upper limit to the between-testscorrelations. Split-half reliabilities were calculated bydividing each test part into two halves, with alternatelyassigning consecutive items to the two test halves.4 Theresulting scores for the two test parts were then correlatedand corrected for their reduced length, using the Spearman–Brown formula (see Appendix B). Of course, this calcula-tion was not possible for self-ratings, where there was onlyone value per participant. The reliability values are shownin Table 3.
Table 3 shows that the split-half reliabilities are generallylarger for Dutch than for Korean participants. Consequently,lower intercorrelations between the different test parts are tobe expected for the Korean group.
The correlations between LexTALE and self-ratingsas predictors, on the one hand, and the translation, QPT,and TOEIC scores as criteria, on the other hand, areshown in Table 4. The correlation coefficients betweenLexTALE and the criteria are Pearson correlation coef-ficients; the ones involving ratings (which are ordinaldata) are Spearman’s rho coefficients. Besides the medianof all four ratings, which is the proper measure of centraltendency for ordinal data, we also calculated theirarithmetic mean, to see whether it would “work” better
4 For LexTALE, this alternating procedure was applied to words andnonwords, separately (i.e, every other word or nonword was assignedto the same group).
332 Behav Res (2012) 44:325–343
than the “rough” median, which can take only wholevalues (for a similar averaging procedure, see Chambers &Cooke, 2009). We treated this arithmetic mean rating as aninterval-level variable.
As can be seen from Table 4, for translation, there was afairly consistent picture for all three translation scores andboth participant groups: First, among the three scoringmeasures for the LexTALE test, the mean percentage correct(% correctav) had the highest correlations with translation.Second, among the four individual self-ratings, readingexperience had the highest correlation with translationperformance. Surprisingly, however, the “illegal” measure ofthe arithmetic mean of all four individual rating scores almost
always outperformed the other rating scores (including themedian) in terms of correlations. Therefore, we will includethis measure in all further calculations. Furthermore, in allcases but Dutch L1–L2 translation, the correlations betweenLexTALE and translation scores were higher than thosebetween the self-ratings and translation scores.
With respect to the measures of more general Englishaptitude, QPT and TOEIC, the correlations of self-ratingswith the QPT were comparable to those of LexTALE, withsome rating scores (especially mean rating) outperformingLexTALE. However, this was not the case for TOEIC, whichdid not significantly correlate with self-ratings, while itscorrelations with LexTALE were higher and significant. Thisdifferent pattern of correlations gives rise to the assumptionthat TOEIC might capture quite different aspects ofproficiency than does QPT. Indeed, the two measures wereonly moderately correlated, with r = .43 (p < .001).
Table 4 also shows that all correlations were lower for theKorean than for the Dutch group, a pattern that might (partly)be due to the lower split-half reliabilities reported in Table 3.
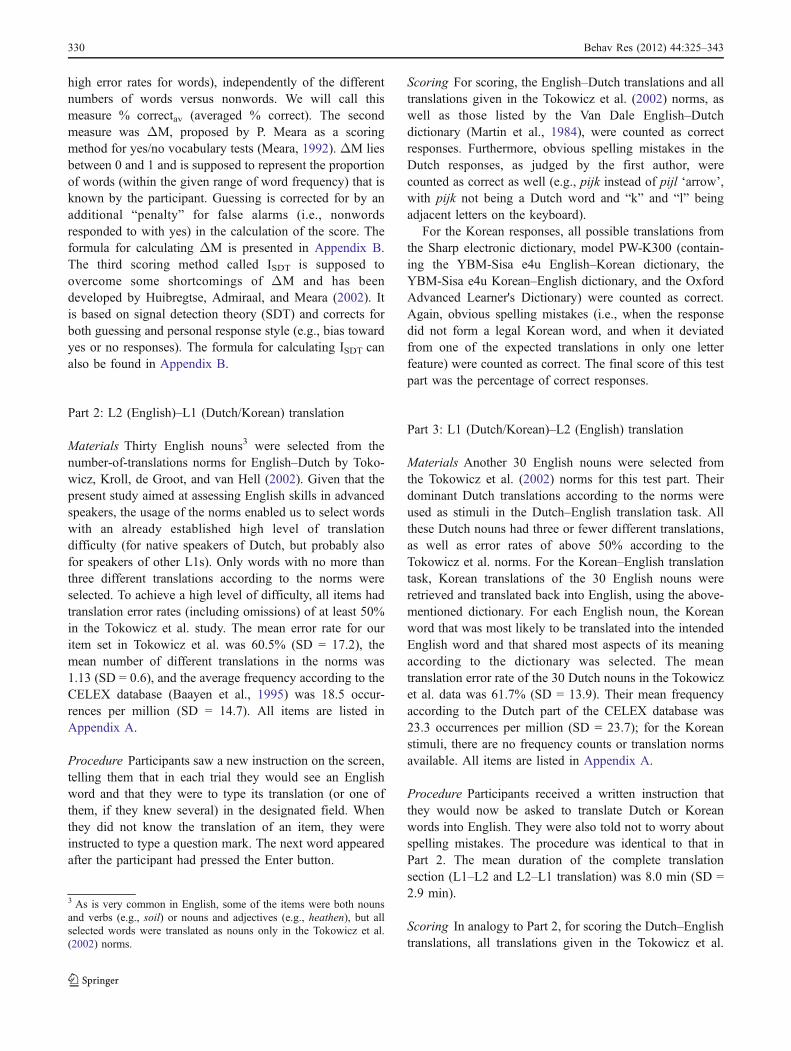
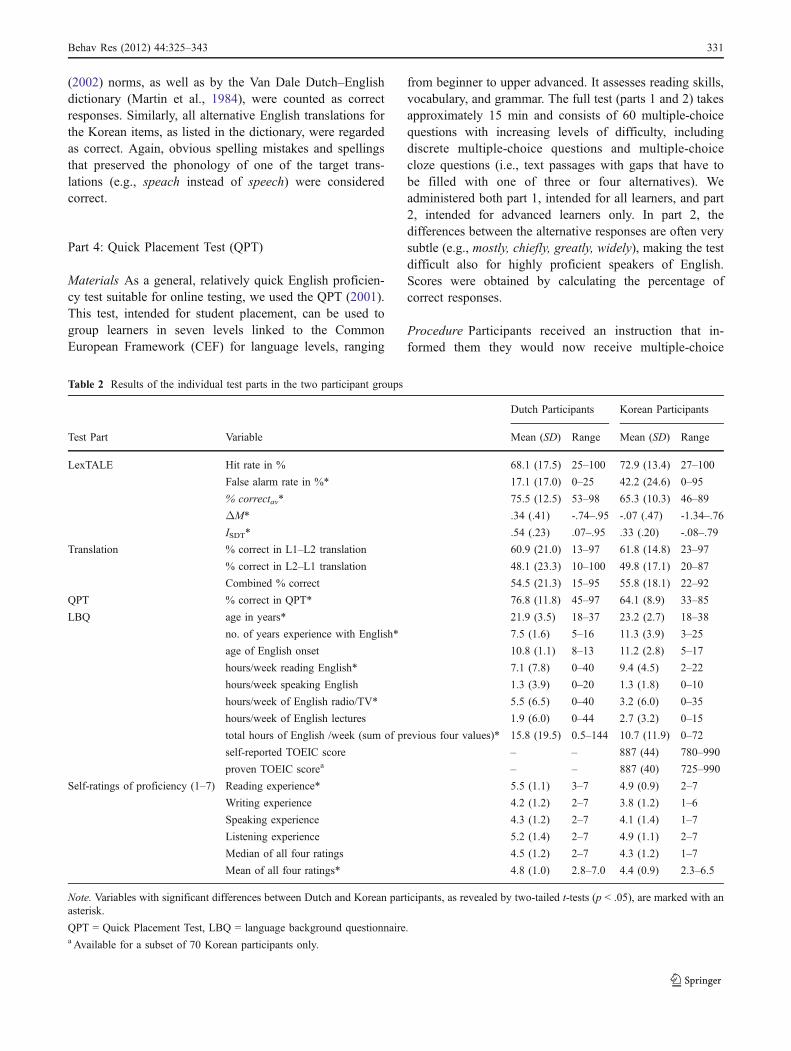
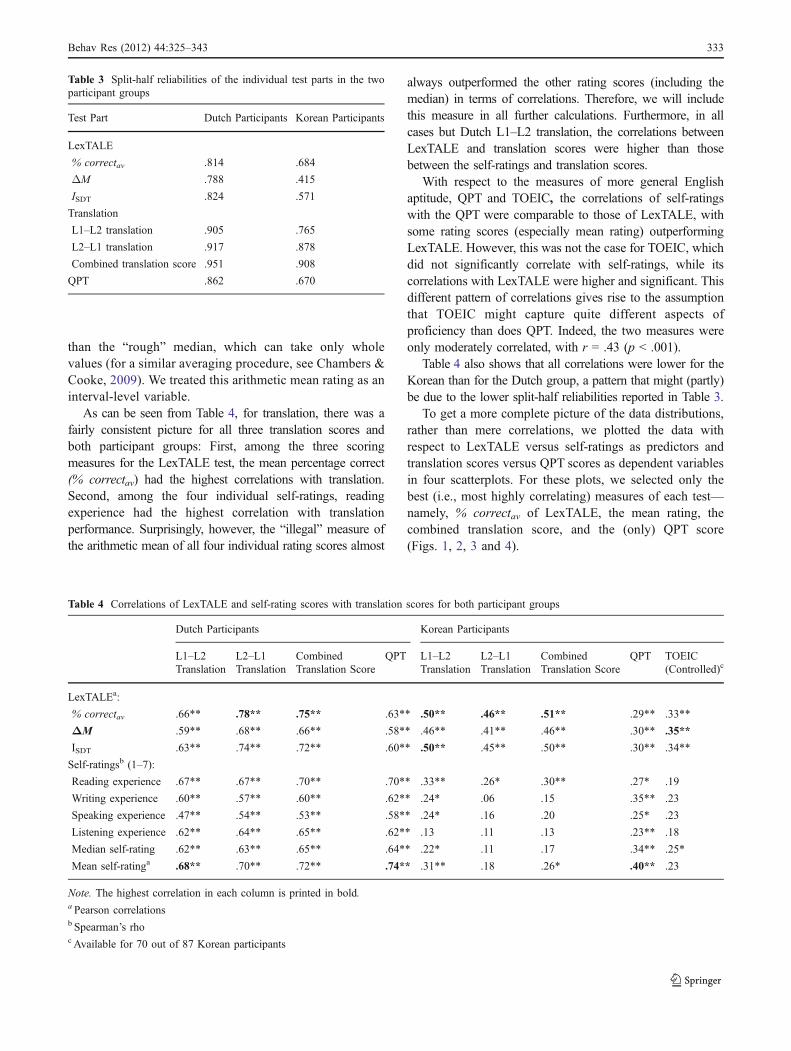
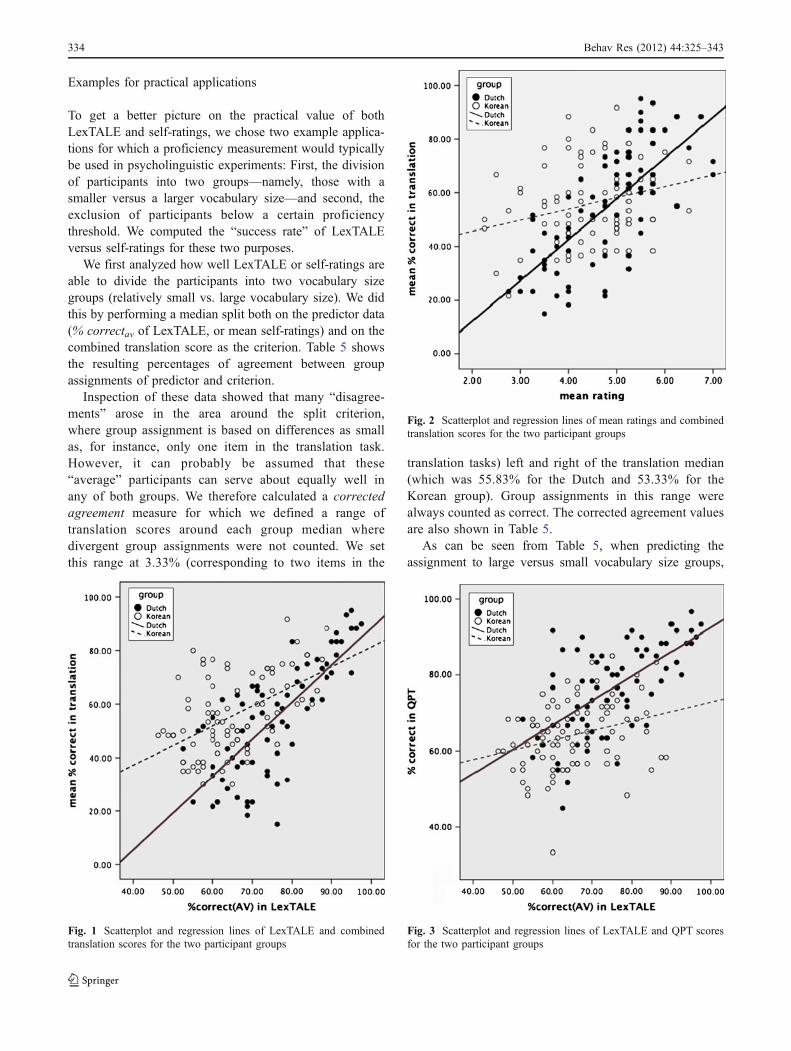
To get a more complete picture of the data distributions,rather than mere correlations, we plotted the data withrespect to LexTALE versus self-ratings as predictors andtranslation scores versus QPT scores as dependent variablesin four scatterplots. For these plots, we selected only thebest (i.e., most highly correlating) measures of each test—namely, % correctav of LexTALE, the mean rating, thecombined translation score, and the (only) QPT score(Figs. 1, 2, 3 and 4).
Table 3 Split-half reliabilities of the individual test parts in the twoparticipant groups
Test Part Dutch Participants Korean Participants
LexTALE
% correctav .814 .684
ΔM .788 .415
ISDT .824 .571
Translation
L1–L2 translation .905 .765
L2–L1 translation .917 .878
Combined translation score .951 .908
QPT .862 .670
Table 4 Correlations of LexTALE and self-rating scores with translation scores for both participant groups
Note. The highest correlation in each column is printed in bold.a Pearson correlationsb Spearman’s rhoc Available for 70 out of 87 Korean participants
Behav Res (2012) 44:325–343 333
Examples for practical applications
To get a better picture on the practical value of bothLexTALE and self-ratings, we chose two example applica-tions for which a proficiency measurement would typicallybe used in psycholinguistic experiments: First, the divisionof participants into two groups—namely, those with asmaller versus a larger vocabulary size—and second, theexclusion of participants below a certain proficiencythreshold. We computed the “success rate” of LexTALEversus self-ratings for these two purposes.
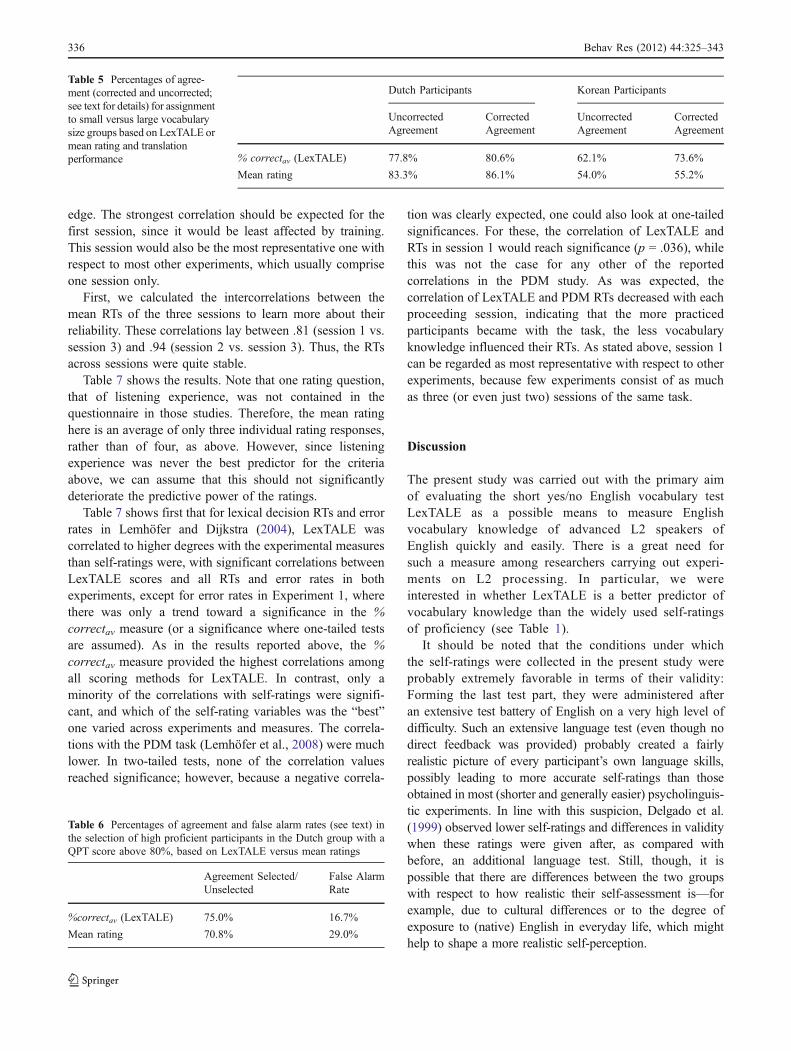
We first analyzed how well LexTALE or self-ratings areable to divide the participants into two vocabulary sizegroups (relatively small vs. large vocabulary size). We didthis by performing a median split both on the predictor data(% correctav of LexTALE, or mean self-ratings) and on thecombined translation score as the criterion. Table 5 showsthe resulting percentages of agreement between groupassignments of predictor and criterion.
Inspection of these data showed that many “disagree-ments” arose in the area around the split criterion,where group assignment is based on differences as smallas, for instance, only one item in the translation task.However, it can probably be assumed that these“average” participants can serve about equally well inany of both groups. We therefore calculated a correctedagreement measure for which we defined a range oftranslation scores around each group median wheredivergent group assignments were not counted. We setthis range at 3.33% (corresponding to two items in the
translation tasks) left and right of the translation median(which was 55.83% for the Dutch and 53.33% for theKorean group). Group assignments in this range werealways counted as correct. The corrected agreement valuesare also shown in Table 5.
As can be seen from Table 5, when predicting theassignment to large versus small vocabulary size groups,
Fig. 2 Scatterplot and regression lines of mean ratings and combinedtranslation scores for the two participant groups
Fig. 1 Scatterplot and regression lines of LexTALE and combinedtranslation scores for the two participant groups
Fig. 3 Scatterplot and regression lines of LexTALE and QPT scoresfor the two participant groups
334 Behav Res (2012) 44:325–343
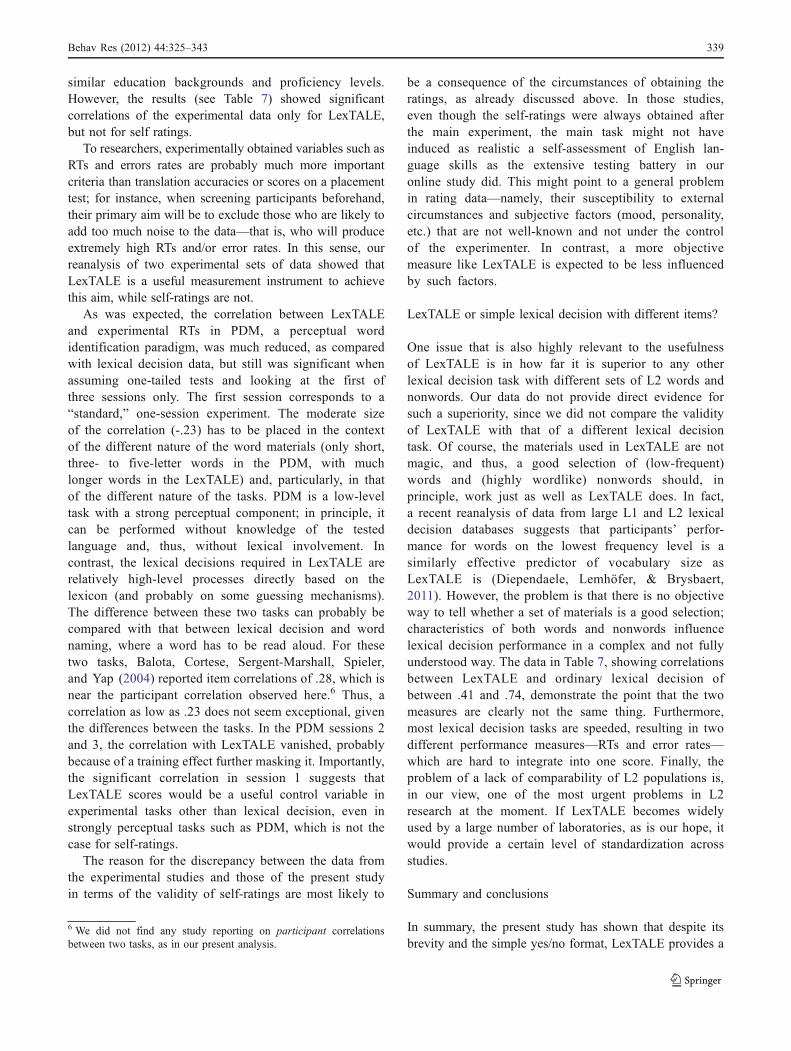
mean ratings worked better for Dutch participants, whereasLexTALE was the better predictor for the Korean group.The correction, in which agreement errors close to themedian (i.e., the split criterion) were not counted, mainlyaffected the LexTALE prediction of the Korean group.Generally, both LexTALE and mean rating median splitsoverlapped satisfactorily with translation groups for theDutch participants, with agreement rates above 80%.However, only LexTALE, but not mean ratings provided abetter-than-chance group split of Korean participants.
A second frequent motivation for using proficiencyestimates is the intention to include only participants abovea certain proficiency criterion—for example, because of thenoisy or heterogeneous nature of language processes atlower levels of L2 aptitude. For instance, researchers mightopt for a target group of advanced proficiency (CEF levelsC1 and C2—proficient users), which is also the core targetgroup of LexTALE. In the QPT, this corresponds to aminimum of 48 correctly answered items out of 60 (80%), arequirement which was met by 34 out of 72 Dutch and byonly 4 out of 87 Korean participants. Therefore, werestricted our analysis to the Dutch group.5 We analyzedwhether LexTALE or self-ratings can be used to exclude agroup of participants with QPT scores below this limit.
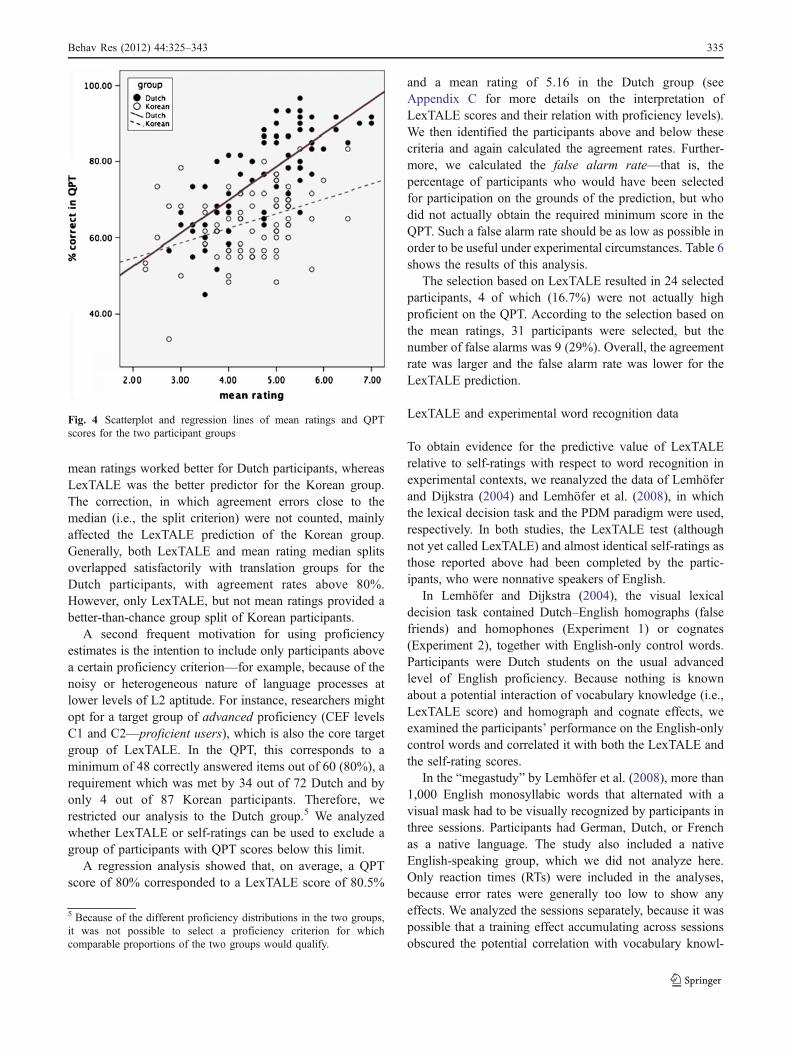
A regression analysis showed that, on average, a QPTscore of 80% corresponded to a LexTALE score of 80.5%
and a mean rating of 5.16 in the Dutch group (seeAppendix C for more details on the interpretation ofLexTALE scores and their relation with proficiency levels).We then identified the participants above and below thesecriteria and again calculated the agreement rates. Further-more, we calculated the false alarm rate—that is, thepercentage of participants who would have been selectedfor participation on the grounds of the prediction, but whodid not actually obtain the required minimum score in theQPT. Such a false alarm rate should be as low as possible inorder to be useful under experimental circumstances. Table 6shows the results of this analysis.
The selection based on LexTALE resulted in 24 selectedparticipants, 4 of which (16.7%) were not actually highproficient on the QPT. According to the selection based onthe mean ratings, 31 participants were selected, but thenumber of false alarms was 9 (29%). Overall, the agreementrate was larger and the false alarm rate was lower for theLexTALE prediction.
LexTALE and experimental word recognition data
To obtain evidence for the predictive value of LexTALErelative to self-ratings with respect to word recognition inexperimental contexts, we reanalyzed the data of Lemhöferand Dijkstra (2004) and Lemhöfer et al. (2008), in whichthe lexical decision task and the PDM paradigm were used,respectively. In both studies, the LexTALE test (althoughnot yet called LexTALE) and almost identical self-ratings asthose reported above had been completed by the partic-ipants, who were nonnative speakers of English.
In Lemhöfer and Dijkstra (2004), the visual lexicaldecision task contained Dutch–English homographs (falsefriends) and homophones (Experiment 1) or cognates(Experiment 2), together with English-only control words.Participants were Dutch students on the usual advancedlevel of English proficiency. Because nothing is knownabout a potential interaction of vocabulary knowledge (i.e.,LexTALE score) and homograph and cognate effects, weexamined the participants’ performance on the English-onlycontrol words and correlated it with both the LexTALE andthe self-rating scores.
In the “megastudy” by Lemhöfer et al. (2008), more than1,000 English monosyllabic words that alternated with avisual mask had to be visually recognized by participants inthree sessions. Participants had German, Dutch, or Frenchas a native language. The study also included a nativeEnglish-speaking group, which we did not analyze here.Only reaction times (RTs) were included in the analyses,because error rates were generally too low to show anyeffects. We analyzed the sessions separately, because it waspossible that a training effect accumulating across sessionsobscured the potential correlation with vocabulary knowl-
5 Because of the different proficiency distributions in the two groups,it was not possible to select a proficiency criterion for whichcomparable proportions of the two groups would qualify.
Fig. 4 Scatterplot and regression lines of mean ratings and QPTscores for the two participant groups
Behav Res (2012) 44:325–343 335
edge. The strongest correlation should be expected for thefirst session, since it would be least affected by training.This session would also be the most representative one withrespect to most other experiments, which usually compriseone session only.
First, we calculated the intercorrelations between themean RTs of the three sessions to learn more about theirreliability. These correlations lay between .81 (session 1 vs.session 3) and .94 (session 2 vs. session 3). Thus, the RTsacross sessions were quite stable.
Table 7 shows the results. Note that one rating question,that of listening experience, was not contained in thequestionnaire in those studies. Therefore, the mean ratinghere is an average of only three individual rating responses,rather than of four, as above. However, since listeningexperience was never the best predictor for the criteriaabove, we can assume that this should not significantlydeteriorate the predictive power of the ratings.
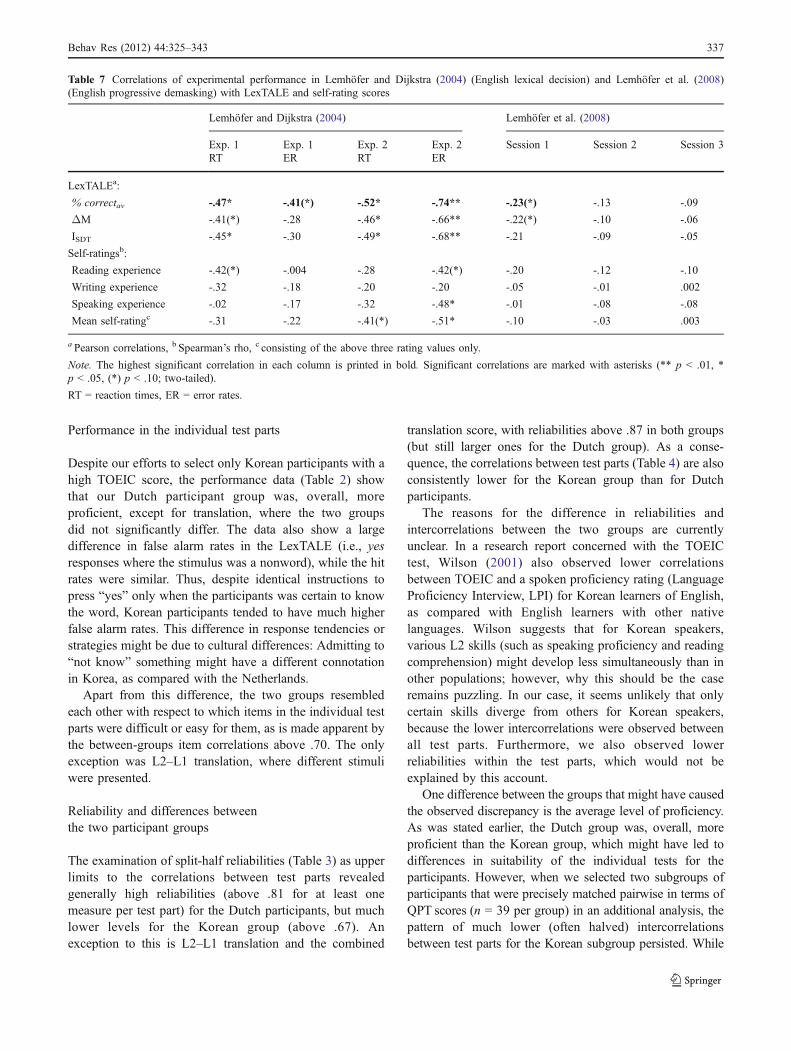
Table 7 shows first that for lexical decision RTs and errorrates in Lemhöfer and Dijkstra (2004), LexTALE wascorrelated to higher degrees with the experimental measuresthan self-ratings were, with significant correlations betweenLexTALE scores and all RTs and error rates in bothexperiments, except for error rates in Experiment 1, wherethere was only a trend toward a significance in the %correctav measure (or a significance where one-tailed testsare assumed). As in the results reported above, the %correctav measure provided the highest correlations amongall scoring methods for LexTALE. In contrast, only aminority of the correlations with self-ratings were signifi-cant, and which of the self-rating variables was the “best”one varied across experiments and measures. The correla-tions with the PDM task (Lemhöfer et al., 2008) were muchlower. In two-tailed tests, none of the correlation valuesreached significance; however, because a negative correla-
tion was clearly expected, one could also look at one-tailedsignificances. For these, the correlation of LexTALE andRTs in session 1 would reach significance (p = .036), whilethis was not the case for any other of the reportedcorrelations in the PDM study. As was expected, thecorrelation of LexTALE and PDM RTs decreased with eachproceeding session, indicating that the more practicedparticipants became with the task, the less vocabularyknowledge influenced their RTs. As stated above, session 1can be regarded as most representative with respect to otherexperiments, because few experiments consist of as muchas three (or even just two) sessions of the same task.
Discussion
The present study was carried out with the primary aimof evaluating the short yes/no English vocabulary testLexTALE as a possible means to measure Englishvocabulary knowledge of advanced L2 speakers ofEnglish quickly and easily. There is a great need forsuch a measure among researchers carrying out experi-ments on L2 processing. In particular, we wereinterested in whether LexTALE is a better predictor ofvocabulary knowledge than the widely used self-ratingsof proficiency (see Table 1).
It should be noted that the conditions under whichthe self-ratings were collected in the present study wereprobably extremely favorable in terms of their validity:Forming the last test part, they were administered afteran extensive test battery of English on a very high level ofdifficulty. Such an extensive language test (even though nodirect feedback was provided) probably created a fairlyrealistic picture of every participant’s own language skills,possibly leading to more accurate self-ratings than thoseobtained in most (shorter and generally easier) psycholinguis-tic experiments. In line with this suspicion, Delgado et al.(1999) observed lower self-ratings and differences in validitywhen these ratings were given after, as compared withbefore, an additional language test. Still, though, it ispossible that there are differences between the two groupswith respect to how realistic their self-assessment is—forexample, due to cultural differences or to the degree ofexposure to (native) English in everyday life, which mighthelp to shape a more realistic self-perception.
Table 5 Percentages of agree-ment (corrected and uncorrected;see text for details) for assignmentto small versus large vocabularysize groups based on LexTALE ormean rating and translationperformance
Table 6 Percentages of agreement and false alarm rates (see text) inthe selection of high proficient participants in the Dutch group with aQPT score above 80%, based on LexTALE versus mean ratings
Agreement Selected/Unselected
False AlarmRate
%correctav (LexTALE) 75.0% 16.7%
Mean rating 70.8% 29.0%
336 Behav Res (2012) 44:325–343
Performance in the individual test parts
Despite our efforts to select only Korean participants with ahigh TOEIC score, the performance data (Table 2) showthat our Dutch participant group was, overall, moreproficient, except for translation, where the two groupsdid not significantly differ. The data also show a largedifference in false alarm rates in the LexTALE (i.e., yesresponses where the stimulus was a nonword), while the hitrates were similar. Thus, despite identical instructions topress “yes” only when the participants was certain to knowthe word, Korean participants tended to have much higherfalse alarm rates. This difference in response tendencies orstrategies might be due to cultural differences: Admitting to“not know” something might have a different connotationin Korea, as compared with the Netherlands.
Apart from this difference, the two groups resembledeach other with respect to which items in the individual testparts were difficult or easy for them, as is made apparent bythe between-groups item correlations above .70. The onlyexception was L2–L1 translation, where different stimuliwere presented.
Reliability and differences betweenthe two participant groups
The examination of split-half reliabilities (Table 3) as upperlimits to the correlations between test parts revealedgenerally high reliabilities (above .81 for at least onemeasure per test part) for the Dutch participants, but muchlower levels for the Korean group (above .67). Anexception to this is L2–L1 translation and the combined
translation score, with reliabilities above .87 in both groups(but still larger ones for the Dutch group). As a conse-quence, the correlations between test parts (Table 4) are alsoconsistently lower for the Korean group than for Dutchparticipants.
The reasons for the difference in reliabilities andintercorrelations between the two groups are currentlyunclear. In a research report concerned with the TOEICtest, Wilson (2001) also observed lower correlationsbetween TOEIC and a spoken proficiency rating (LanguageProficiency Interview, LPI) for Korean learners of English,as compared with English learners with other nativelanguages. Wilson suggests that for Korean speakers,various L2 skills (such as speaking proficiency and readingcomprehension) might develop less simultaneously than inother populations; however, why this should be the caseremains puzzling. In our case, it seems unlikely that onlycertain skills diverge from others for Korean speakers,because the lower intercorrelations were observed betweenall test parts. Furthermore, we also observed lowerreliabilities within the test parts, which would not beexplained by this account.
One difference between the groups that might have causedthe observed discrepancy is the average level of proficiency.As was stated earlier, the Dutch group was, overall, moreproficient than the Korean group, which might have led todifferences in suitability of the individual tests for theparticipants. However, when we selected two subgroups ofparticipants that were precisely matched pairwise in terms ofQPT scores (n = 39 per group) in an additional analysis, thepattern of much lower (often halved) intercorrelationsbetween test parts for the Korean subgroup persisted. While
Table 7 Correlations of experimental performance in Lemhöfer and Dijkstra (2004) (English lexical decision) and Lemhöfer et al. (2008)(English progressive demasking) with LexTALE and self-rating scores
Lemhöfer and Dijkstra (2004) Lemhöfer et al. (2008)
Exp. 1 Exp. 1 Exp. 2 Exp. 2 Session 1 Session 2 Session 3RT ER RT ER
Mean self-ratingc -.31 -.22 -.41(*) -.51* -.10 -.03 .003
a Pearson correlations, b Spearman’s rho, c consisting of the above three rating values only.
Note. The highest significant correlation in each column is printed in bold. Significant correlations are marked with asterisks (** p < .01, *p < .05, (*) p < .10; two-tailed).
RT = reaction times, ER = error rates.
Behav Res (2012) 44:325–343 337
this additional analysis does not support the proficiency-based account, it is still possible that the effect of differencesin proficiency is more complicated than that and, therefore,influenced consistencies.
Thus, in general, these explanations remain speculative,and more research is needed to make sense of learnerdifferences like those found in the present data.
Comparing the validity of LexTALE and self-ratings
The general pattern in our data (Table 4) was that LexTALEscores correlated higher with vocabulary size (i.e., transla-tion performance) than the rating values did. Thus,LexTALE can be regarded as the generally better predictorfor vocabulary knowledge. However, for the Dutch group,we have to admit that the difference was smaller than wehad expected. In fact, the data show that when obtainedunder similar circumstances as in our study, the mean ratingand, to a lesser degree, the rating for reading experiencecan also be useful predictors of vocabulary knowledge.However, this did not hold for the Korean group, wherecorrelations of translation performance with % correctav ofLexTALE were still substantial (about .50), while thosewith self-ratings were much lower (about .30 and lower).Furthermore, in the Korean data set, the mean rating was nolonger the superior measure of the ratings, but thecorrelations with translation scores were best for readingexperience.
As to the question of whether the correlation levels weobserved for both LexTALE and self-ratings are sufficientto claim test validity, the old problem arises that there areno “hard” criteria to identify a given validity value assufficient. However, in practice, correlations above .50 areoften considered large, and those between .30 and .50 asmoderate, in reference to Cohen (1988). A comparison tovalidation studies of other language tests shows that thehighest criterion validities, even for official tests likeTOEFL or TOEIC, are usually about .75 (e.g., Fitzpatrick& Clenton, 2010; Sawaki & Nissan, 2009; Wilson, 2001;Xi, 2008). As compared with these studies, the correlationswe observed between LexTALE and translation perfor-mance in the Dutch group can be considered excellent, andthose with QPT still substantial. For the Korean group, thecorrelations with translation performance were moderate tolarge and in the mean range of what is observed in other testvalidation studies, and they were considerably superior tothose with self-ratings. Consequently, researchers of L2word processing in Koreans are better advised to collectLexTALE scores than self-ratings.
Still, to get a better impression of what the practicalvalue of LexTALE versus self-ratings might be, we“simulated” two practical applications to the experimentalsituations for which we developed LexTALE. The results
show a similar general picture as the previously reporteddata: For the Dutch group, the usefulness of LexTALE wascomparable to that of mean self-ratings. This was shownboth for splitting the participant group in two halves on thebasis of vocabulary size (i.e., with translation performanceas criterion) and for excluding participants below a certainproficiency criterion. In the first case, mean self-rating wasa slightly better predictor, while the reverse was true for thelatter. Generally, a percentage of about 80% of correctlyclassified participants for the translation median split is agood result and likely to be extremely useful to researchers.Similarly, LexTALE predicted well whether participantswould fall above a critical QPT score—namely, with 75%accuracy and a low false alarm rate (17%, or 4 out of 24participants). This is especially remarkable because we didnot really expect LexTALE to be a very accurate predictorof the QPT.
Again, the situation was different for the Korean group,for which we analyzed only the first application—that is,the split of participants into two halves. Here, onlyclassifications based on LexTALE produced an acceptableagreement rate, while those based on mean ratings wereclose to chance level.
The considerable differences between the Dutch and theKorean groups with respect to the predictive quality ofLexTALE versus self-ratings complicates the derivation ofpractical implications from the data. On the one hand, theDutch data seem to suggest that self-ratings, which are probablyeasier to obtain than LexTALE scores, are roughly comparablein their validity to LexTALE. This would mean that all thoseresearchers that use or have used them as the only proficiencyindicator (see Table 1) might not be too wrong after all. On theother hand, in a second group with a different L1 background,a different proficiency distribution, and generally more noisydata, this was not the case. For a participant population suchas the Korean group here, LexTALE generally was thesuperior and, often, the only useful measure. Thus, for newgroups to be tested in future studies—which might be hard toclassify as more “Dutch-like” or more “Korean-like” —weconclude that LexTALE is the “safer” measure of the two,certainly when it comes to predicting vocabulary size, but,possibly in combination with self-ratings, also in terms ofpredicting general aptitude levels.
Experimental data
Our final set of data, those from two previous experimentalstudies, confirms this conclusion. The participant groups inthese studies were presumably highly similar to the Dutchgroup here: Lemhöfer and Dijkstra (2004) drew fromexactly the same Dutch–English bilingual student popula-tion, and Lemhöfer et al. (2008) also used Dutch students,plus two groups of French and German participants with
338 Behav Res (2012) 44:325–343
similar education backgrounds and proficiency levels.However, the results (see Table 7) showed significantcorrelations of the experimental data only for LexTALE,but not for self ratings.
To researchers, experimentally obtained variables such asRTs and errors rates are probably much more importantcriteria than translation accuracies or scores on a placementtest; for instance, when screening participants beforehand,their primary aim will be to exclude those who are likely toadd too much noise to the data—that is, who will produceextremely high RTs and/or error rates. In this sense, ourreanalysis of two experimental sets of data showed thatLexTALE is a useful measurement instrument to achievethis aim, while self-ratings are not.
As was expected, the correlation between LexTALEand experimental RTs in PDM, a perceptual wordidentification paradigm, was much reduced, as comparedwith lexical decision data, but still was significant whenassuming one-tailed tests and looking at the first ofthree sessions only. The first session corresponds to a“standard,” one-session experiment. The moderate sizeof the correlation (-.23) has to be placed in the contextof the different nature of the word materials (only short,three- to five-letter words in the PDM, with muchlonger words in the LexTALE) and, particularly, in thatof the different nature of the tasks. PDM is a low-leveltask with a strong perceptual component; in principle, itcan be performed without knowledge of the testedlanguage and, thus, without lexical involvement. Incontrast, the lexical decisions required in LexTALE arerelatively high-level processes directly based on thelexicon (and probably on some guessing mechanisms).The difference between these two tasks can probably becompared with that between lexical decision and wordnaming, where a word has to be read aloud. For thesetwo tasks, Balota, Cortese, Sergent-Marshall, Spieler,and Yap (2004) reported item correlations of .28, which isnear the participant correlation observed here.6 Thus, acorrelation as low as .23 does not seem exceptional, giventhe differences between the tasks. In the PDM sessions 2and 3, the correlation with LexTALE vanished, probablybecause of a training effect further masking it. Importantly,the significant correlation in session 1 suggests thatLexTALE scores would be a useful control variable inexperimental tasks other than lexical decision, even instrongly perceptual tasks such as PDM, which is not thecase for self-ratings.
The reason for the discrepancy between the data fromthe experimental studies and those of the present studyin terms of the validity of self-ratings are most likely to
be a consequence of the circumstances of obtaining theratings, as already discussed above. In those studies,even though the self-ratings were always obtained afterthe main experiment, the main task might not haveinduced as realistic a self-assessment of English lan-guage skills as the extensive testing battery in ouronline study did. This might point to a general problemin rating data—namely, their susceptibility to externalcircumstances and subjective factors (mood, personality,etc.) that are not well-known and not under the controlof the experimenter. In contrast, a more objectivemeasure like LexTALE is expected to be less influencedby such factors.
LexTALE or simple lexical decision with different items?
One issue that is also highly relevant to the usefulnessof LexTALE is in how far it is superior to any otherlexical decision task with different sets of L2 words andnonwords. Our data do not provide direct evidence forsuch a superiority, since we did not compare the validityof LexTALE with that of a different lexical decisiontask. Of course, the materials used in LexTALE are notmagic, and thus, a good selection of (low-frequent)words and (highly wordlike) nonwords should, inprinciple, work just as well as LexTALE does. In fact,a recent reanalysis of data from large L1 and L2 lexicaldecision databases suggests that participants’ perfor-mance for words on the lowest frequency level is asimilarly effective predictor of vocabulary size asLexTALE is (Diependaele, Lemhöfer, & Brysbaert,2011). However, the problem is that there is no objectiveway to tell whether a set of materials is a good selection;characteristics of both words and nonwords influencelexical decision performance in a complex and not fullyunderstood way. The data in Table 7, showing correlationsbetween LexTALE and ordinary lexical decision ofbetween .41 and .74, demonstrate the point that the twomeasures are clearly not the same thing. Furthermore,most lexical decision tasks are speeded, resulting in twodifferent performance measures—RTs and error rates—which are hard to integrate into one score. Finally, theproblem of a lack of comparability of L2 populations is,in our view, one of the most urgent problems in L2research at the moment. If LexTALE becomes widelyused by a large number of laboratories, as is our hope, itwould provide a certain level of standardization acrossstudies.
Summary and conclusions
In summary, the present study has shown that despite itsbrevity and the simple yes/no format, LexTALE provides a
6 We did not find any study reporting on participant correlationsbetween two tasks, as in our present analysis.
Behav Res (2012) 44:325–343 339
useful and valid measure of English vocabulary knowledgeof medium- to high-proficient learners of English as asecond language. The correlations in the online study weresubstantial for two speaker groups with very distant L1s,even with one rather “noisy” group (the Korean partic-ipants). This suggests that this finding will probablygeneralize to most if not all other groups of advancedlearners of English with varying language backgrounds.This was not true for self-ratings, which showed goodlevels of validity for Dutch, but not for Korean participantsin the present study, and were poor predictors of experi-mental lexical decision and word identification data fromprevious studies. LexTALE is thus especially preferable toself-ratings in populations that are rather heterogeneous interms of L2 proficiency and possibly L1 background.
LexTALE can be downloaded, or carried out online, atwww.lextale.com. Besides the English version of LexTALE,there are also German and Dutch versions of LexTALE thatcan be found on the Web site. Although they are not yetvalidated or tested for their equivalence with the Englishversion, they were developed as parallel to the Englishversion as possible and might represent a valuable resourcefor investigators of Dutch or German as L2s. With respect tothe English version of LexTALE, the present study has shownthat it offers researchers a useful tool for the quick and validassessment of vocabulary knowledge in English as an L2.
Author Note Parts of this research were supported by twoindividual ‘Veni’ grants from the Netherlands Organisation forScientific Research (NWO), awarded separately to each of theauthors. We would like to thank Taehong Cho, director of theHanyang Phonetics and Psycholinguistics Laboratory at HanyangUniversity, Seoul, for facilitating the Korean data collection. Manythanks also to Jiyoun Choi for help constructing the Koreantranslation tasks, to Zhou Fang for setting up the Web-basedexperiments, to Sammie Tarenskeen for data processing, and toJelmer Wolterink for building www.lextale.com. We are alsograteful to Marc Brysbaert and Ana Schwartz for helpful commentson earlier versions of the manuscript.
Open Access This article is distributed under the terms of theCreative Commons Attribution Noncommercial License which per-mits any noncommercial use, distribution, and reproduction in anymedium, provided the original author(s) and source are credited.
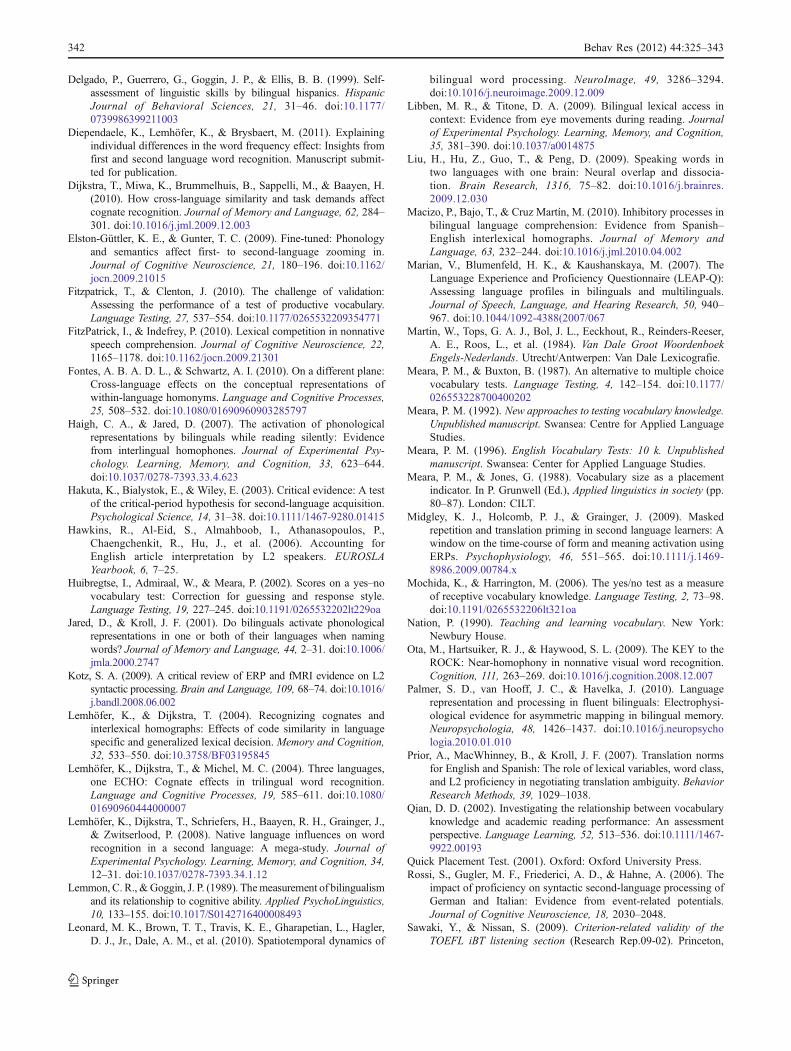
where h = proportion of correctly recognized words (hitrate), and f = proportion of incorrectly accepted nonwords(false alarm rate).
Spearman–Brown formula for calculating the split-halfreliability
r ¼ 2rxy1þ rxy
where rxy = correlation between the two test halves.
Appendix C Interpreting LexTALE scores
For the purpose of comparison or reference, we provide amore detailed description of the frequency distribution ofthe LexTALE scores obtained in this and three previousstudies (see Table 8). In particular, we consider our data onDutch–English bilinguals (n = 162) to be highly represen-tative of one of the standard populations in L2 research(Dutch college students with a high level of formaleducation and everyday exposure to English). Futurestudies can refer to these score distributions when compar-ing their participants with those of our studies in terms ofvocabulary knowledge.
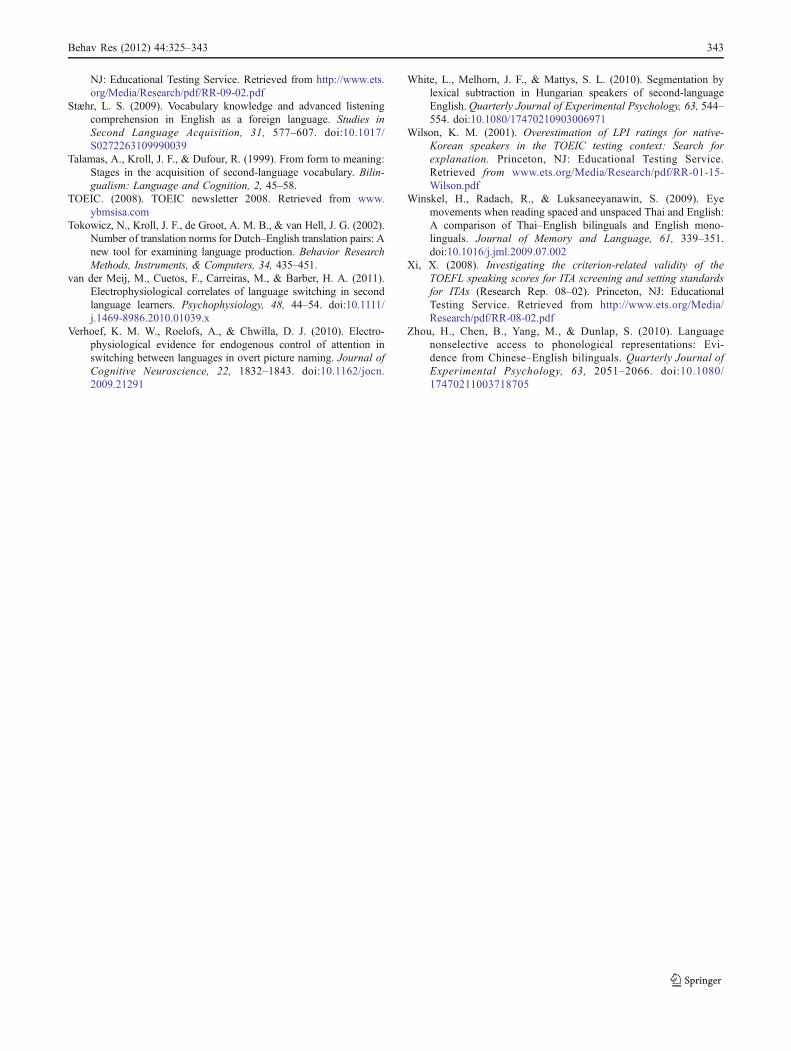
On the basis of the linear regression depicted in Fig. 3,we also calculated which ranges of LexTALE scores areassociated with which QPT score ranges and associatedCEF proficiency levels, as indicated in the QPT testdescription (Quick Placement Test, 2001). Because theprediction of QPT scores on the basis of LexTALE in theKorean group was not very accurate, we used only theDutch data for this calculation. It should be noted, however,that the ranges given below are rough estimates based onlimited data.
With this restriction, LexTALE can be used to discrim-inate between lower intermediate (or lower), upper inter-mediate, and advanced users (see Table 9).
References
Abutalebi, J. (2008). Neural aspects of second language representationand language control. Acta Psychologica, 128, 466–478.doi:10.1016/j.actpsy.2008.03.014
Baayen, R. H., Piepenbrock, R., & Gulikers, L. (1995). The CELEXLexical Database (Release 2) [CD-ROM]. Philadelphia, PA:University of Pennsylvania, Linguistic Data Consortium.
Balota, D. A., Cortese, M. J., Sergent-Marshall, S. D., Spieler, D. H., &Yap, M. J. (2004). Visual word recognition of single-syllable words.Journal of Experimental Psychology. General, 133, 283–316.
Blumenfeld, H., & Marian, V. (2007). Constraints on parallel activation inbilingual spoken language processing: Examining proficiency andlexical status using eye-tracking. Language and Cognitive Processes,22, 633–660. doi:10.1080/01690960601000746
Broersma, M. (2010). Perception of final fricative voicing: Native andnonnative listeners’ use of vowel duration. Journal of theAcoustical Society of America, 127, 1636–1644. doi:10.1121/1.3292996
Brysbaert, M., van Dyck, G., & van de Poel, M. (1999). Visual wordrecognition in bilinguals: Evidence from masked phonologicalpriming. Journal of Experimental Psychology. Human Perceptionand Performance, 25, 137–148.
Cameron, L. (2002). Measuring vocabulary size in English as anadditional language. Language Teaching Research, 6, 145–173.doi:10.1191/1362168802lr103oa
Canseco-Gonzalez, E., Brehm, L., Brick, C. A., Brown-Schmidt, S.,Fischer, K., & Wagner, K. (2010). Carpet or carcel: The effect ofage of acquisition and language mode on bilingual lexical access.Language and Cognitive Processes, 25, 669–705. doi:10.1080/01690960903474912
Chambers, C. G., & Cooke, H. (2009). Lexical competition duringsecond-language listening: Sentence context, but not proficiency,constrains interference from the native lexicon. Journal ofExperimental Psychology. Learning, Memory, and Cognition,35, 1029–1040. doi:10.1037/a0015901
Cohen, J. (1988). Statistical power analysis for the behavioralsciences (2nd ed.). Hillsdale, NJ: Erlbaum.
de Groot, A. M. B., Borgwaldt, S., Bos, M., & van den Eijnden, E.(2002). Lexical decision and word naming in bilinguals:Language effects and task effects. Journal of Memory andLanguage, 47, 91–124. doi:10.1006/jmla.2001.2840
Table 8 10th percentiles of frequency distributions of LexTALE %correctAV scores in this study and three previous studiesa
Percentile All Participants(n = 289)
DutchParticipants(n = 162)
Korean ParticipantsFrom This Study(n = 87)
10 58.75 64.13 52.50
20 63.75 68.75 56.25
30 68.75 73.75 58.75
40 73.75 76.25 61.25
50 76.25 78.75 63.75
60 80.00 81.25 66.25
70 82.50 83.88 70.75
80 87.50 88.00 75.00
90 91.25 92.50 81.25
aLemhöfer and Dijkstra (2004), Lemhöfer, Dijkstra, and Michel(2004), Lemhöfer et al. (2008)
Table 9 Relation between general English proficiency levels, asindicated by QPT scores, and LexTALE scores, based on the Dutchgroup in the present study
Delgado, P., Guerrero, G., Goggin, J. P., & Ellis, B. B. (1999). Self-assessment of linguistic skills by bilingual hispanics. HispanicJournal of Behavioral Sciences, 21, 31–46. doi:10.1177/0739986399211003
Diependaele, K., Lemhöfer, K., & Brysbaert, M. (2011). Explainingindividual differences in the word frequency effect: Insights fromfirst and second language word recognition. Manuscript submit-ted for publication.
Dijkstra, T., Miwa, K., Brummelhuis, B., Sappelli, M., & Baayen, H.(2010). How cross-language similarity and task demands affectcognate recognition. Journal of Memory and Language, 62, 284–301. doi:10.1016/j.jml.2009.12.003
Elston-Güttler, K. E., & Gunter, T. C. (2009). Fine-tuned: Phonologyand semantics affect first- to second-language zooming in.Journal of Cognitive Neuroscience, 21, 180–196. doi:10.1162/jocn.2009.21015
Fitzpatrick, T., & Clenton, J. (2010). The challenge of validation:Assessing the performance of a test of productive vocabulary.Language Testing, 27, 537–554. doi:10.1177/0265532209354771
FitzPatrick, I., & Indefrey, P. (2010). Lexical competition in nonnativespeech comprehension. Journal of Cognitive Neuroscience, 22,1165–1178. doi:10.1162/jocn.2009.21301
Fontes, A. B. A. D. L., & Schwartz, A. I. (2010). On a different plane:Cross-language effects on the conceptual representations ofwithin-language homonyms. Language and Cognitive Processes,25, 508–532. doi:10.1080/01690960903285797
Haigh, C. A., & Jared, D. (2007). The activation of phonologicalrepresentations by bilinguals while reading silently: Evidencefrom interlingual homophones. Journal of Experimental Psy-chology. Learning, Memory, and Cognition, 33, 623–644.doi:10.1037/0278-7393.33.4.623
Hakuta, K., Bialystok, E., & Wiley, E. (2003). Critical evidence: A testof the critical-period hypothesis for second-language acquisition.Psychological Science, 14, 31–38. doi:10.1111/1467-9280.01415
Hawkins, R., Al-Eid, S., Almahboob, I., Athanasopoulos, P.,Chaengchenkit, R., Hu, J., et al. (2006). Accounting forEnglish article interpretation by L2 speakers. EUROSLAYearbook, 6, 7–25.
Huibregtse, I., Admiraal, W., & Meara, P. (2002). Scores on a yes–novocabulary test: Correction for guessing and response style.Language Testing, 19, 227–245. doi:10.1191/0265532202lt229oa
Jared, D., & Kroll, J. F. (2001). Do bilinguals activate phonologicalrepresentations in one or both of their languages when namingwords? Journal of Memory and Language, 44, 2–31. doi:10.1006/jmla.2000.2747
Kotz, S. A. (2009). A critical review of ERP and fMRI evidence on L2syntactic processing. Brain and Language, 109, 68–74. doi:10.1016/j.bandl.2008.06.002
Lemhöfer, K., & Dijkstra, T. (2004). Recognizing cognates andinterlexical homographs: Effects of code similarity in languagespecific and generalized lexical decision. Memory and Cognition,32, 533–550. doi:10.3758/BF03195845
Lemhöfer, K., Dijkstra, T., & Michel, M. C. (2004). Three languages,one ECHO: Cognate effects in trilingual word recognition.Language and Cognitive Processes, 19, 585–611. doi:10.1080/01690960444000007
Lemhöfer, K., Dijkstra, T., Schriefers, H., Baayen, R. H., Grainger, J.,& Zwitserlood, P. (2008). Native language influences on wordrecognition in a second language: A mega-study. Journal ofExperimental Psychology. Learning, Memory, and Cognition, 34,12–31. doi:10.1037/0278-7393.34.1.12
Lemmon, C. R., &Goggin, J. P. (1989). Themeasurement of bilingualismand its relationship to cognitive ability. Applied PsychoLinguistics,10, 133–155. doi:10.1017/S0142716400008493
Leonard, M. K., Brown, T. T., Travis, K. E., Gharapetian, L., Hagler,D. J., Jr., Dale, A. M., et al. (2010). Spatiotemporal dynamics of
bilingual word processing. NeuroImage, 49, 3286–3294.doi:10.1016/j.neuroimage.2009.12.009
Libben, M. R., & Titone, D. A. (2009). Bilingual lexical access incontext: Evidence from eye movements during reading. Journalof Experimental Psychology. Learning, Memory, and Cognition,35, 381–390. doi:10.1037/a0014875
Liu, H., Hu, Z., Guo, T., & Peng, D. (2009). Speaking words intwo languages with one brain: Neural overlap and dissocia-tion. Brain Research, 1316, 75–82. doi:10.1016/j.brainres.2009.12.030
Macizo, P., Bajo, T., & Cruz Martín, M. (2010). Inhibitory processes inbilingual language comprehension: Evidence from Spanish–English interlexical homographs. Journal of Memory andLanguage, 63, 232–244. doi:10.1016/j.jml.2010.04.002
Marian, V., Blumenfeld, H. K., & Kaushanskaya, M. (2007). TheLanguage Experience and Proficiency Questionnaire (LEAP-Q):Assessing language profiles in bilinguals and multilinguals.Journal of Speech, Language, and Hearing Research, 50, 940–967. doi:10.1044/1092-4388(2007/067
Martin, W., Tops, G. A. J., Bol, J. L., Eeckhout, R., Reinders-Reeser,A. E., Roos, L., et al. (1984). Van Dale Groot WoordenboekEngels-Nederlands. Utrecht/Antwerpen: Van Dale Lexicografie.
Meara, P. M., & Buxton, B. (1987). An alternative to multiple choicevocabulary tests. Language Testing, 4, 142–154. doi:10.1177/026553228700400202
Meara, P. M. (1992). New approaches to testing vocabulary knowledge.Unpublished manuscript. Swansea: Centre for Applied LanguageStudies.
Meara, P. M. (1996). English Vocabulary Tests: 10 k. Unpublishedmanuscript. Swansea: Center for Applied Language Studies.
Meara, P. M., & Jones, G. (1988). Vocabulary size as a placementindicator. In P. Grunwell (Ed.), Applied linguistics in society (pp.80–87). London: CILT.
Midgley, K. J., Holcomb, P. J., & Grainger, J. (2009). Maskedrepetition and translation priming in second language learners: Awindow on the time-course of form and meaning activation usingERPs. Psychophysiology, 46, 551–565. doi:10.1111/j.1469-8986.2009.00784.x
Mochida, K., & Harrington, M. (2006). The yes/no test as a measureof receptive vocabulary knowledge. Language Testing, 2, 73–98.doi:10.1191/0265532206lt321oa
Nation, P. (1990). Teaching and learning vocabulary. New York:Newbury House.
Ota, M., Hartsuiker, R. J., & Haywood, S. L. (2009). The KEY to theROCK: Near-homophony in nonnative visual word recognition.Cognition, 111, 263–269. doi:10.1016/j.cognition.2008.12.007
Palmer, S. D., van Hooff, J. C., & Havelka, J. (2010). Languagerepresentation and processing in fluent bilinguals: Electrophysi-ological evidence for asymmetric mapping in bilingual memory.Neuropsychologia, 48, 1426–1437. doi:10.1016/j.neuropsychologia.2010.01.010
Prior, A., MacWhinney, B., & Kroll, J. F. (2007). Translation normsfor English and Spanish: The role of lexical variables, word class,and L2 proficiency in negotiating translation ambiguity. BehaviorResearch Methods, 39, 1029–1038.
Qian, D. D. (2002). Investigating the relationship between vocabularyknowledge and academic reading performance: An assessmentperspective. Language Learning, 52, 513–536. doi:10.1111/1467-9922.00193
Quick Placement Test. (2001). Oxford: Oxford University Press.Rossi, S., Gugler, M. F., Friederici, A. D., & Hahne, A. (2006). The
impact of proficiency on syntactic second-language processing ofGerman and Italian: Evidence from event-related potentials.Journal of Cognitive Neuroscience, 18, 2030–2048.
Sawaki, Y., & Nissan, S. (2009). Criterion-related validity of theTOEFL iBT listening section (Research Rep.09-02). Princeton,
NJ: Educational Testing Service. Retrieved from http://www.ets.org/Media/Research/pdf/RR-09-02.pdf
Stæhr, L. S. (2009). Vocabulary knowledge and advanced listeningcomprehension in English as a foreign language. Studies inSecond Language Acquisition, 31, 577–607. doi:10.1017/S0272263109990039
Talamas, A., Kroll, J. F., & Dufour, R. (1999). From form to meaning:Stages in the acquisition of second-language vocabulary. Bilin-gualism: Language and Cognition, 2, 45–58.
TOEIC. (2008). TOEIC newsletter 2008. Retrieved from www.ybmsisa.com
Tokowicz, N., Kroll, J. F., de Groot, A. M. B., & van Hell, J. G. (2002).Number of translation norms for Dutch–English translation pairs: Anew tool for examining language production. Behavior ResearchMethods, Instruments, & Computers, 34, 435–451.
van der Meij, M., Cuetos, F., Carreiras, M., & Barber, H. A. (2011).Electrophysiological correlates of language switching in secondlanguage learners. Psychophysiology, 48, 44–54. doi:10.1111/j.1469-8986.2010.01039.x
Verhoef, K. M. W., Roelofs, A., & Chwilla, D. J. (2010). Electro-physiological evidence for endogenous control of attention inswitching between languages in overt picture naming. Journal ofCognitive Neuroscience, 22, 1832–1843. doi:10.1162/jocn.2009.21291
White, L., Melhorn, J. F., & Mattys, S. L. (2010). Segmentation bylexical subtraction in Hungarian speakers of second-languageEnglish.Quarterly Journal of Experimental Psychology, 63, 544–554. doi:10.1080/17470210903006971
Wilson, K. M. (2001). Overestimation of LPI ratings for native-Korean speakers in the TOEIC testing context: Search forexplanation. Princeton, NJ: Educational Testing Service.Retrieved from www.ets.org/Media/Research/pdf/RR-01-15-Wilson.pdf
Winskel, H., Radach, R., & Luksaneeyanawin, S. (2009). Eyemovements when reading spaced and unspaced Thai and English:A comparison of Thai–English bilinguals and English mono-linguals. Journal of Memory and Language, 61, 339–351.doi:10.1016/j.jml.2009.07.002
Xi, X. (2008). Investigating the criterion-related validity of theTOEFL speaking scores for ITA screening and setting standardsfor ITAs (Research Rep. 08–02). Princeton, NJ: EducationalTesting Service. Retrieved from http://www.ets.org/Media/Research/pdf/RR-08-02.pdf
Zhou, H., Chen, B., Yang, M., & Dunlap, S. (2010). Languagenonselective access to phonological representations: Evi-dence from Chinese–English bilinguals. Quarterly Journal ofExperimental Psychology, 63, 2051–2066. doi:10.1080/17470211003718705