Page 1
EVA Dimensions 15 Watersedge Court Locust Valley, NY 11560 516.759.3711 www.evadimensions.com
Copyright © 2015 EVA Dimensions LLC. All rights reserved.
1
Introducing the Corporate Performance Index An Essential Fix for TSR
A white paper By Bennett Stewart, CEO, EVA Dimensions LLC
Page 2
EVA Dimensions 15 Watersedge Court Locust Valley, NY 11560 516.759.3711 www.evadimensions.com
Copyright © 2015 EVA Dimensions LLC. All rights reserved.
2
Table of Contents TSR Can Mislead……………………………………………………………………………………………………………………………….3
CPI Catches TSR’s Errors……………………………………………………………………………………………………………………4
How CPI Works…………………………………………………………………………………………………………………………………5
Case Study #1: Monster Beverage…………………………………………………………………………………………………….6
Case Study #2: Dean Foods……………………………………………………………………………………………………………..11
CPI Explains TSR….………………………………………………………………………………………………………………………….12
Case Study #3: Hershey vs. Tyson.……………………………………………………………………………………………..…..14
An Exception: Coca-Cola Consolidated.………………………………………………………………………….…………..…..17
Summing Up the CPI Score.…………………………………………………………………………………………………….………17
Page 3
EVA Dimensions 15 Watersedge Court Locust Valley, NY 11560 516.759.3711 www.evadimensions.com
Copyright © 2015 EVA Dimensions LLC. All rights reserved.
3
TSR Can Mislead
Total shareholder return is the reigning champ in the corporate governance arena. Use of TSR
has exploded since governance consultants ISS and Glass Lewis began applying it as a key variable in
developing “say on pay” proxy recommendations and in decisions to support or reject an activist’s
agenda. Today half the companies in the S&P 500 use TSR to determine incentive pay, up from fewer
than one in five a decade ago. Yet many firms and boards are dissatisfied with it, and are looking for an
alternative.
TSR almost always is more reliable than other popular performance metrics such as growth in
earnings or EPS. But even TSR can mislead, and it should not be the final word in any assessment of
corporate performance. TSR systematically overstates the performance of companies that simply have
recovered from temporary setbacks, and it unfairly and misleadingly penalizes stellar performers that
have slipped only slightly or have failed to live up to inflated expectations of investors.
Differences in leverage ratios also complicate matters. Companies with greater leverage tend to
show up at the top or bottom of the TSR league tables simply because changes in their underlying
business values are spread over a slimmer equity base, and not because they are performing
fundamentally better or worse than other, less-leveraged firms. TSR simply cannot be fairly compared
across industry peers that operate with different levels of debt, yet that comparison is invoked all the
time.
What’s more, research by Cornell University’s Institute for Compensation Studies and the Pearl
Meyer compensation consulting firm finds there is no correlation between the use of TSR in
compensation plans and subsequent company performance. That isn’t surprising, since TSR itself
provides no guidance at all as to how executives can improve it.
Page 4
EVA Dimensions 15 Watersedge Court Locust Valley, NY 11560 516.759.3711 www.evadimensions.com
Copyright © 2015 EVA Dimensions LLC. All rights reserved.
4
CPI Catches TSR’s Errors
A new measure called the Corporate Performance Index, or CPI, provides a needed complement
to TSR that greatly improves its reliability and also provides executives with a roadmap to improve
performance and shareholder returns. CPI, developed by EVA Dimensions, ranks companies in terms of
their growth trend in generating economic profits, the profitability and market value of their business
franchises, and how well positioned investors believe they are for future profit growth. It sums up each
company’s financial health as a percentile score compared to its industry group or a broad market index.
CPI rankings generally are aligned fairly closely with TSR readings, with about a 60%
correlation. In most cases, CPI helpfully adds to the credibility of the TSR verdict and the confidence
that boards and others can have in it. It also helps to demystify TSR by providing a window into the
underlying financial factors that determine it.
But CPI and TSR give materially different ratings for about 40% of the companies on the market,
and distant outliers exist in every industry. On one side, CPI highlights those that actually are
underperforming their peers despite seemingly impressive TSRs. Equally important, it sorts out false
negatives, showing that some firms with relatively low TSRs should be given the benefit of the doubt in
light of their long-term track records and high standing among peers.
Why do TSR and CPI sometimes deviate? The main reason is that the change-in-share-price
component of TSR (which swamps the contribution of dividends) is based entirely on changes in investor
forecasts of value from the beginning to the end of a period, rather than on whether the company
actually added or subtracted value by its operating performance during the period. Shareholder returns
cannot be ignored, of course. But it is dangerous, given all that rides on it, to base decisions about
performance on a single measure, even one as good as TSR. And it always is unwise to ignore the
underlying business performance that ultimately drives stock prices.
Another, subtler reason why shareholder returns are not the full story is that returns should be
weighted by the amount of shareholder value at risk, but in practice aren’t. If a company’s stock price
falls from $10 to $5, for example, then goes back to $10, the returns read -50%, then +100%. Even
though the value change is identical – its $5 down and $5 up – the returns are materially different in
magnitude. They differ because more or less value is going along for the ride, depending on the initial
valuation base. Creating value is what matters, and that is what managers should be paid to do. But as
far as telling that story is concerned, rates of return are inherently biased upwards for weak firms that
start off with depressed valuations, and it becomes systematically harder and harder for elite firm (like
Apple) to keep generating outstanding percentage returns on top of an ever larger valuation base.
Enter CPI, which reflects the value being created as it is being created, as the profits that
underpin the value are being produced. CPI also weighs underlying business performance without the
distortion of leverage. It also takes into account a company’s accumulated track record of performance
and its general standing in its peer group, not just whether it happened to rise or slip in recent periods.
Page 5
EVA Dimensions 15 Watersedge Court Locust Valley, NY 11560 516.759.3711 www.evadimensions.com
Copyright © 2015 EVA Dimensions LLC. All rights reserved.
5
How CPI Works
CPI uses a set of four measures to develop a comprehensive score of financial health from a
shareholder point of view. The measures are:
1. Wealth Creation and Franchise Value: the firm’s total market value premium or discount to
its book capital, stated per unit of sales (we call the valuation premium “MVA,” for market
value added)
2. Profitability: the firm’s true economic profit, expressed as a profit margin ratio of sales (the
term we use for economic profit is “EVA,” standing for economic value added; it is profit net
of a full cost-of-capital interest charge on the firm’s debt and equity capital)
3. Profitable Growth: the trend growth rate in the firm’s EVA profit over the most recent three
years
4. Strategic Position: the long-run growth in EVA profit that investors have factored into the
firm’s share price
The first two metrics are
snapshot statistics, reflecting the
firm’s profitability and market
valuation, while the latter two are
moving pictures, gauging actual
and expected profit trends. Two
are market-based, incorporating
investor perceptions and
expectations, and two reflect
actual performance in terms of
earning and increasing economic
profits. All the measures,
moreover, are in relation to the
firm’s total capital, its debt plus
equity. Because of that, they
capture the performance of the
business and aren’t affected by
financing ratios.
As you will see, EVA and MVA, measuring economic profit and owner wealth, are the two most
essential measures of corporate performance and value creation. All four of the ratio statistics in CPI
are variations on those two measures.
To reach CPI’s upper ranks, a firm has to score well on all four measures. It must first of all
preside over a valuable and profitable business franchise, one capable of generating high-quality profits,
and its stock must trade for a lofty premium to invested capital. The firm has to have generated an
exceptional growth trend in profits over the past three years and, to top it off, it must be so strategically
well positioned that investors believe its future profits will grow faster than those of its peers.
Page 6
EVA Dimensions 15 Watersedge Court Locust Valley, NY 11560 516.759.3711 www.evadimensions.com
Copyright © 2015 EVA Dimensions LLC. All rights reserved.
6
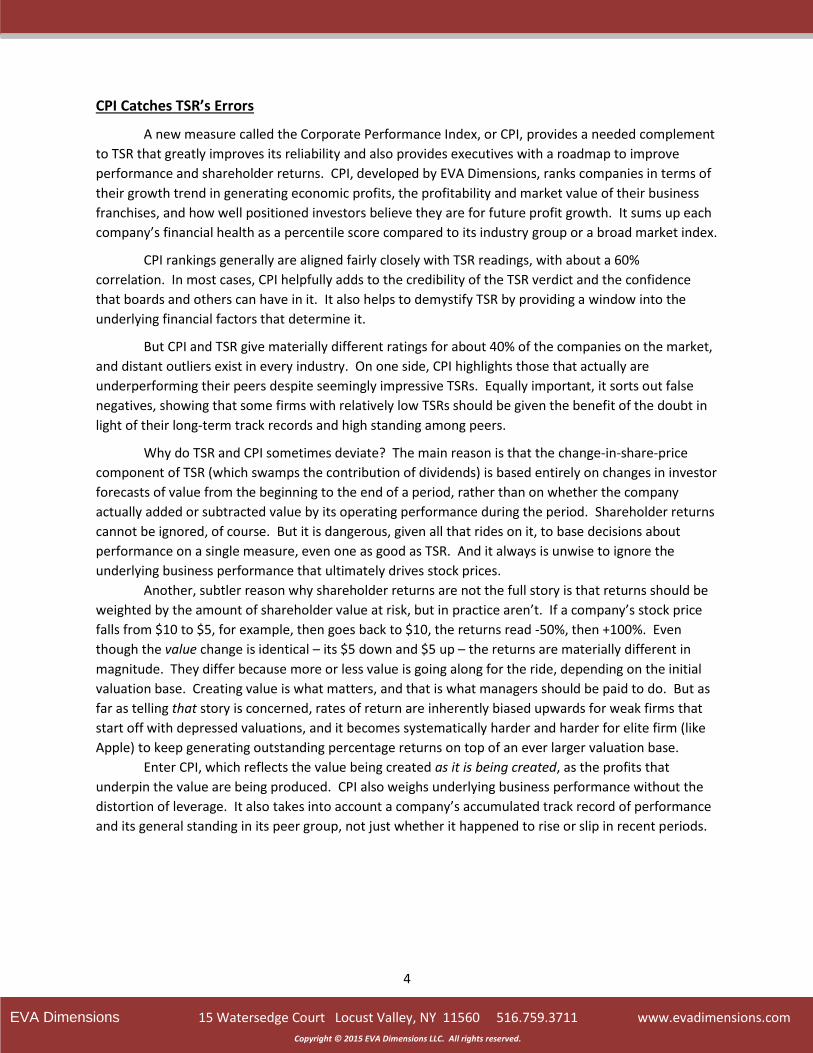
Case Study #1: Monster Beverage
Let’s look at Monster Beverage (MNST: NASDAQ), a prodigious wealth creator. It holds the top
CPI rating in the food and beverage industry, with good reason. The top chart in Exhibit 1 plots
Monster’s capital – the total debt and equity invested in its net business assets – as the miniscule blue
bar. The company’s overall market value, or enterprise value, net of excess cash, is the towering gray
bar. The difference between the two is what counts. That spread is MVA. It’s the difference between
money put into the business and value coming out of it, and as such it measures the wealth created for
the firm’s owners and, effectively, the firm’s franchise value, the value of the business above putting the
net business assets in a pile. Plotted as the blue bar in the lower chart, Monster’s MVA increased
dramatically over the years. It currently stands at $23.75 billion but was just $11.75 billion three years
back and little more than breakeven at the beginning of 2005.
Exhibit 1: Monster’s Economic Profit (EVA) and Wealth Creation (MVA)
Page 7
EVA Dimensions 15 Watersedge Court Locust Valley, NY 11560 516.759.3711 www.evadimensions.com
Copyright © 2015 EVA Dimensions LLC. All rights reserved.
7
Monster has created such enormous owner wealth and franchise value because it has been
phenomenally successful at generating and growing economic profits. The red line on the lower chart
traces Monster’s EVA profit – the profit above and beyond its full cost of capital. The most recent
reading through mid-2015 shows EVA at a four-quarter run rate of $443 million, compared to $322
million three years before. Like MVA, EVA has been positive and it has been growing at a robust rate.
The close correspondence between Monster’s MVA wealth premium and its EVA profit is no
accident. To see why, though, we need to take a slight detour to discuss the cost of capital that is
deducted from EVA. It is not a cash cost, like interest expense. Rather, it is an opportunity cost. It is the
rate of return that the company’s investors could otherwise expect to earn by purchasing a stock and
bond portfolio that matches the company’s risk profile. That return requirement starts with the interest
rate available on long-term government bonds, which is a couple of percent these days, plus a two-to-
ten percent premium to compensate for the cycles and risks in the firm’s business, less a discount for
using debt to finance the business because the interest expense is tax deductible. Stirred together,
most companies today have an overall weighted-average cost of capital of between 4 and 10 percent. It
is lower for regulated utilities and stable food companies, and higher for home builders and brokerage
firms and tech companies – as you would expect. The key point is that EVA is measured after deducting
that full cost of capital from the firm’s after-tax operating profits. EVA only starts to count profits after
all investors, including shareholders, have received a minimum acceptable return to compensate for risk
and as set by the market.
Even though the cost of capital is never fully deducted from accounting profits, it has real
consequences. If a firm is just covering it, and is just breaking even in an economic sense, then the firm
will tend to trade just for book value, or close to it. Why would investors ever pay a market premium
over book capital if the firm is unable to give them a premium return on their capital? Put simply, if EVA
is zero, then MVA should be zero, too.
The opposite is true as well. Investors will pay market-to-book premiums for companies that
can generate premium economic profits. They will bid up the share price to the point where they
expect to earn the cost of capital as a return on the elevated value that they are paying. And the more
EVA profits a firm is earning, and the more rapidly they are expected to increase, the more owner
wealth and MVA is created.
A specific corporate finance formula encapsulates this: a firm’s MVA wealth premium at any
point in time equals the present value of the EVA profits the market projects it will earn. And as a result,
changes in MVA tend to reflect the changes in the EVA profit that a firm produces over time.
The link is quite clear for Monster. Its MVA closely mirrored the movements in its EVA profit,
just as corporate finance theory predicts it should. Monster is no aberration. Research by EVA
Dimensions confirms that changes in MVA (i.e. the changes in owner wealth and in franchise value) are
more highly correlated with the changes in EVA, in economic profits, than with any of the conventional
financial statistics.
Now let’s look at how Monster does on the four CPI ratios, which, as we have said, are all
variations on EVA and MVA, for reasons that should now be more apparent. Start in Exhibit 2 with the
status quo measures. Monster’s EVA and MVA ratios are plotted as the blue lines in the two left-side
charts. The green and red lines trace the 90th and 50th percentile values among food and beverage
Page 8
EVA Dimensions 15 Watersedge Court Locust Valley, NY 11560 516.759.3711 www.evadimensions.com
Copyright © 2015 EVA Dimensions LLC. All rights reserved.
8
firms. Monster currently is producing almost $10 in owner wealth per $1 of sales (its MVA/Sales ratio is
near 1000%), while even the 90th percentile firm is far behind, with less than $3 of MVA per $1 of sales.
Exhibit 2: EVA and MVA, as a percent of sales
The EVA-to-sales ratio in the lower left chart gauges business model productivity. It brings
together pricing power, operating efficiency, and asset turns into a net profit margin score that is
inherently more comparable than others. Chip-maker Intel, for example, has a massive operating
margin, but because it ties up tons of risky capital in fabrication plants, its net EVA-to-sales profit margin
is much lower and a much fairer indication of the value of its business model. Its EVA Margin can also be
fairly compared with other companies, even unrelated ones like Wal-Mart Stores. The retailer operates
with a meager operating margin but compensates with hyper-rapid asset turns and much leaner capital
requirements, leaving EVA Margin as the common denominator between the two firms. It makes close
cousins of even distant relatives.
EVA Margin is especially useful for making comparisons within an industry group. Say one
competitor makes its products and another one farms out manufacturing. Operating margin
comparisons would be quite meaningless, but the firm’s EVA Margins would reveal which one netted
the most added value. On this score Monster is a winner. Its EVA Margin is an eye-popping 17.6% as
compared to just 8.6% for the 90th percentile firm in its industry (for reference, among S&P500
companies the median EVA Margin is 2.5%, the 75th percentile is 6%, and 90th percentile, 12%).
Page 9
EVA Dimensions 15 Watersedge Court Locust Valley, NY 11560 516.759.3711 www.evadimensions.com
Copyright © 2015 EVA Dimensions LLC. All rights reserved.
9
The blue bars in the charts on the right side of Exhibit 2 are the percentile scores for Monster
versus the food and beverage peer set. It has consistently scored in the upper decile, and more often
than not has been the top-rated firm on these two metrics.
The two other CPI components are plotted for Monster in Exhibit 3. The top graph is an EVA
growth statistic called EVA Momentum. In simplest form that is the change in EVA divided by sales in
the prior period. EVA Momentum is the only performance ratio where a bigger ratio value is always
better, because it gets bigger when EVA grows faster, and EVA is the real key to creating wealth and
driving TSR. As such, EVA Momentum receives the greatest weighting, at 40%, in the CPI score.
For CPI we use a special version called three-year trend Momentum. It’s computed by running a
regression line through the firm’s EVA profits over the trailing four years, and then dividing the slope of
the line by the average of sales in the first three periods. Since all four EVA points have a magnetic pull
on the line slope, the regression provides a more accurate reading on profit growth than a point-to-
point statistic. The median EVA Momentum among S&P500 companies runs at only 0.4% per annum the
75th percentile at 1.5%. Monster’s latest trend Momentum reading is 1.9%, which is especially
impressive since EVA profit growth is hard to come by among mature food and beverage companies.
Exhibit 3: EVA Momentum and Market-Implied Momentum
The last metric in the quartet is the forward-looking EVA growth rate that investors have baked
into the firm’s stock price, shown in the bottom chart in Exhibit 3. Recall that a firm’s market-to-book
premium, its MVA, equals the present value sum of its expected EVA profits. Since we can measure a
Page 10
EVA Dimensions 15 Watersedge Court Locust Valley, NY 11560 516.759.3711 www.evadimensions.com
Copyright © 2015 EVA Dimensions LLC. All rights reserved.
10
company’s current MVA and its current EVA profits, it is possible with a little math to derive the forecast
EVA trajectory required to justify the current share price. We call this statistic Market Implied
Momentum, or MIM. The higher it is, the more confidence investors are expressing that the company is
positioned for profitable growth over a strategic time frame.
The inclusion of the market’s forecast for EVA growth in CPI means that a company cannot score
well by puffing up short-term EVA to the detriment of long-run value. The CPI score, and this metric in
particular, rewards firms that invest in their futures and nurture new products, capabilities, brands and
business models, and that are aware of and deftly deflect risks that frighten investors and that might
snare less nimble firms.
Interestingly, and as plotted in the lower left chart of Exhibit 3, while Monster’s actual EVA
growth trend cooled in recent years, investors grew more confident about its future potential. One
reason is that Monster recently joined forces with Coca-Cola and became its global purveyor of power
drinks in a deal announced in August 2014 and closed in June 2015. Whereas investors were projecting
an EVA growth pace of just under 2% pre-announcement – essentially in line with the firm’s actual trend
Momentum – they are now projecting a phenomenal 4.5% a year growth rate for at least a decade, at
the 98th percentile in its industry.
Exhibit 4: Monster’s CPI Score Summary
The right-hand table in Exhibit 4 provides an at-a-glance status report. It displays Monster’s
sales and sales growth rates for the most recent year and over the past three years, along with its
current EVA and MVA values. More to the point, the table recapitulates the four key ratio metrics that
enter into the company’s current CPI score – its EVA and MVA Margins, and the actual three-year trend
for EVA Momentum and the market’s forecast for future Momentum. Put four home runs together and,
no surprise here, Monster is the top-rated CPI scorer in its industry. And, as is plotted in the left-hand
chart in Exhibit 4, Monster led the league with a perfect 100 score, or close to it, for most of the past
decade.
Monster’s TSR also has been very near the best in its industry. Its most recent three-year TSR,
for example, clocked in at the 86th percentile among its food and beverage brethren. The right-side grid
of Exhibit 5 plots the company’s current CPI score on the vertical axis against the three-year TSR
percentile rank versus peers on the horizontal axis (we focus on the three-year TSR because that period
Page 11
EVA Dimensions 15 Watersedge Court Locust Valley, NY 11560 516.759.3711 www.evadimensions.com
Copyright © 2015 EVA Dimensions LLC. All rights reserved.
11
is used to measure trend EVA Momentum in CPI, and because three years are long enough to be
strategic but short enough that the most recent returns are important). If the CPI score and TSR
percentile are close, the intersection on the grid will plot on or near the diagonal series of dots in Exhibit
5, which is the line along which the CPI score aligns with and confirms the TSR percentile. That’s where
Monster plots, at the upper right corner of the chart.
Exhibit 5: Monster’s TSR Percentile Rank versus CPI score
Page 12
EVA Dimensions 15 Watersedge Court Locust Valley, NY 11560 516.759.3711 www.evadimensions.com
Copyright © 2015 EVA Dimensions LLC. All rights reserved.
12
Case Study #2: Dean Foods
Dean Foods stands in stark contrast to Monster. It resides at the other end of the performance
spectrum. Its current CPI score is just 4, and its three-year TSR percentile rank is 8 (one-year TSR is
much higher, but that is incorporated in the three-year return). Once again, the intersecting dot plots
near the diagonal, but this time near the lower left corner. The CPI score is right in line with the firm’s
poor TSR showing, and for good and understandable reasons.
Exhibit 6: Dean Foods’ TSR Rank versus CPI Score
The summary statistics appearing in the right-side table of Exhibit 7 explain it: Dean Foods is
currently unprofitable compared to its cost of capital (EVA is negative), its EVA profits have been
trending down over the past three years, the stock trades at a discount to its economic book value (MVA
is negative), and investors are skeptical about the company achieving anything better than a modest
improvement in EVA going forward (the market’s Momentum forecast, or MIM, is just 0.11% per
annum). Dean plainly is a troubled company, but in ways that TSR never reveals.
Exhibit 7: Dean Foods’ CPI Score Summary
Page 13
EVA Dimensions 15 Watersedge Court Locust Valley, NY 11560 516.759.3711 www.evadimensions.com
Copyright © 2015 EVA Dimensions LLC. All rights reserved.
13
CPI Explains TSR
Monster and Dean Foods illustrate an important rule: Shareholder returns generally correlate
with CPI scores. The alignment for the Russell 3000 and S&P500 universe of companies is plotted in
Exhibit 8. To produce the charts, we divided all the companies in each index into ten equal-sized groups
according to their CPI scores, and then we identified the median TSR percentile score within each of
those decile groups. The plots of the ten connecting points show a high degree of correspondence, and
the slope, as expected, is positive. Simply put, the higher a company’s current CPI score, the higher it
will tend to rank in TSR versus its competitors over the prior one, three, and five years.
Exhibit 8: TSR Percentile versus CPI Score
Page 14
EVA Dimensions 15 Watersedge Court Locust Valley, NY 11560 516.759.3711 www.evadimensions.com
Copyright © 2015 EVA Dimensions LLC. All rights reserved.
14
The relationship is smoother and stronger across the entire Russell 3000 stock universe than for
the more narrowly defined set of S&P500 stocks. With a greater number of observations in the sample,
coincidental aberrations wash out and the underlying connection more clearly emerges.
In both charts, the dots don’t reach as high or low as they should at the tail ends. The 90th-100th
decile CPI scores, for example, correspond to only the 70th-80th decile TSR rank. That is also to be
expected. As was suggested at the outset, the very highest and lowest TSRs will tend to come from
firms that are more leveraged, or that start off with depressed market valuations, more than from firms
that have fundamentally performed very well or very poorly. The distortion in TSR weakens the
connection to CPI at the extremes.
In general, though, CPI confirms TSR, and effectively explains it. CPI suggests that to rise in TSR
rank, and answer governance critics, a company must sustain a track record of growing profits above the
cost of the capital resources used to produce the growth (which in turn is the key to producing and
increasing owner wealth). This is not just an assertion or an empirical observation. In a companion
article entitled, What Determines Total Shareholder Return, also by Bennett Stewart, a mathematical
derivation proves that TSR is determined by a firm’s EVA performance. Cash flow and capital gains are
shown to be merely the messengers that transmit the returns that actually come from earning and
increasing economic profits over time.
An implication is that boards would be wise to tie incentive pay to the growth in EVA profits, i.e.,
to EVA Momentum. With that in place, managers will naturally pursue obvious things that increase
profits, like exacting premium prices for products and services and intelligently cutting wasteful
costs. With EVA, though, they’ll look beyond the income statement and will consider the balance
sheet. They will seek ways to reduce the capital charge, such as by speeding asset turns and running
leaner, or outsourcing operations to better- equipped third parties. They’ll also want to protect EVA by
ensuring capital is allocated with discipline, with the conviction it will cover the full charge EVA imposes
– all of which help to increase the firm’s EVA profit margin. But besides constraining and managing
capital, they’ll look for ways to invest it, too. They will want to pour resources into all endeavors that
they believe will produce returns over the cost of capital. Unlike return on capital, or profit margin for
that matter, EVA is most decidedly a pro-profitable growth metric, with Monster a good example.
Besides taking actions that fall into these neat categories, EVA will guide managers though tricky
choices. Is it best to restrain price markups and emphasize lean operations in order to increase market
share and growth, or is it more valuable to invest and innovate, and drive higher margins, but at the cost
of tying up more capital and appealing to a smaller share of the market? Questions like those involve
complex tradeoffs that trip up most metrics. But the correct answer is always to choose the strategy
that produces the biggest stream of EVA over time, because that produces the most shareholder value.
Once managers establish a successful track record of growing EVA profits, they ring another bell.
They give investors the evidence they need to extrapolate even more growth in EVA, which tends to
raise the MIM statistic. In sum, when managers are paid to improve EVA Momentum, simple as that
seems, they are motivated to turn all of the gears that lead to an increase in a firm’s CPI score, in its
MVA, and ultimately, if not immediately, in its total shareholder return.
Page 15
EVA Dimensions 15 Watersedge Court Locust Valley, NY 11560 516.759.3711 www.evadimensions.com
Copyright © 2015 EVA Dimensions LLC. All rights reserved.
15
Case Study #3: Hershey vs. Tyson
CPI is valuable not only when it lines up with TSR. It’s also interesting when the verdicts
diverge, which is fairly common. Our study shows that CPI and TSR differ by more than 20 percentile
points for about 40% of all stocks, about equally divided on both sides. The outliers jump out when
companies are plotted on the CPI/TSR grid, as we have done with the food and beverage industry in
Exhibit 9. The upper left area that is bordered in blue contains companies that score materially higher
on CPI, meaning that TSR likely understates their performance, while the lower right red zone contains
companies with TSR ranks that likely overstate performance because they are significantly higher than
CPI. Let’s look at Hershey (HSY) in the blue zone and Tyson Foods (TSN) in the red zone as examples.
Exhibit 9: CPI Rating versus TSR Rank in the Food and Beverage Industry
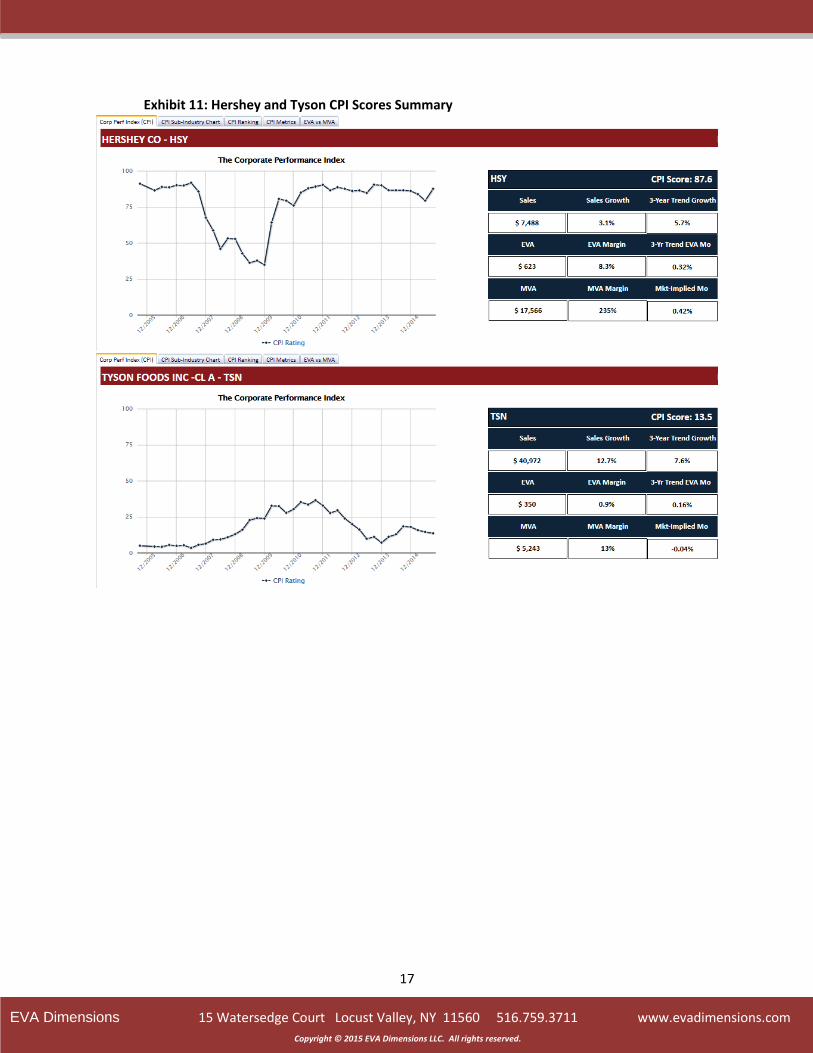
Hershey’s three-year TSR was 10.9%, which put it at just 12th percentile in its industry. But the
return is low chiefly because Hershey’s MVA was at a very high level three years back. It’s not that
Hershey performed poorly since then; rather, it just didn’t do as well as investors initially expected.
More important, and what CPI recognizes (as documented in Exhibit 10), Hershey still is a
handsomely profitable and highly valuable franchise. Its current EVA Margin is 8.3%, and its MVA
wealth premium stands at 235% of sales. Hershey also generated a perfectly respectable EVA growth
trend over the past three years despite a recent lull (Momentum averaged +0.32% a year); moreover, as
far as investors can tell, the company is positioned for material growth in EVA profits over the next
decade. Its forward-looking MIM rate is +0.42%, or slightly above its recent growth trend. Putting all
Page 16
EVA Dimensions 15 Watersedge Court Locust Valley, NY 11560 516.759.3711 www.evadimensions.com
Copyright © 2015 EVA Dimensions LLC. All rights reserved.
16
four measures together, Hershey’s CPI score is 88. Its 6th best out of 64 industry peers. Despite its weak
TSR showing, Hershey is in fact performing well and standing tall.
Exhibit 10: Hershey and Tyson Economic Profit (EVA) and Wealth Creation (MVA)
Tyson is just the opposite case. Its three-year TSR appears to be quite impressive at an average
of 28.1% a year, or 88th percentile among peers. Yet, as is evident from Exhibit 10, the return was an
aberration, so large only because Tyson’s value increased off a severely depressed MVA base. Tyson
outperformed expectations, but the expectations three years back were so low that the stock was
bound to produce an explosive return with even a relatively modest performance improvement.
The more penetrating insight, reported in the lower panel of Exhibit 11, is that Tyson’s vital
statistics are all still quite low: its EVA is barely positive, just 0.9% of sales (vs. 8.8% for Hershey); MVA,
too, is barely positive at 13% of sales; three-year trend EVA growth was 0.16%, or exactly half the pace
Hershey delivered; and most telling, the EVA growth implied by its stock price is -0.04% -- meaning that
investors don’t believe the current EVA is sustainable and think it is likely to dissipate with time. All told,
Tyson’s CPI score is just 14, or in the 47th rank out of the 64 food and beverage companies. CPI helpfully
shows that Tyson’s TSR is built on a shaky foundation, is unlikely to continue at anywhere near its
historic level, and that the company should by no means be given a pass by governance watchdogs and
activist investors.
Page 17
EVA Dimensions 15 Watersedge Court Locust Valley, NY 11560 516.759.3711 www.evadimensions.com
Copyright © 2015 EVA Dimensions LLC. All rights reserved.
17
Exhibit 11: Hershey and Tyson CPI Scores Summary
Page 18
EVA Dimensions 15 Watersedge Court Locust Valley, NY 11560 516.759.3711 www.evadimensions.com
Copyright © 2015 EVA Dimensions LLC. All rights reserved.
18
An Exception: Coca-Cola Consolidated
Does CPI always trump TSR? No, there are instances where TSR is the more valid measure and
where CPI is a lagging indicator. That tends to happen most often when EVA is temporarily depressed
by a major capital investment or acquisition program that has not fully ripened, or when a company’s
stock price has run far ahead of recent results in anticipation of greater profit growth ahead.
The one and only example in the food and beverage business is Coke Consolidated
(NASDAQ:COKE), the nation’s largest independent Coca-Cola bottler. Its three-year TSR averaged 43% a
year, or 93rd percentile, almost all of which was due to a phenomenal 160% return in the most recent
year alone. Yet Coke Consolidated’s CPI score is only 24. The company’s EVA Margin is an uninspiring
0.2%, and its EVA has recently trended down. There’s an explanation. Acquisitions that added about
15% to the capital base over the past two years have not been fully digested. The company also
announced a deal with The Coca-Cola Company that will expand its franchise territory significantly. The
company’s stock performance is not attributable to already achieved profits, but to the creation of new
EVA growth opportunities that should increase the CPI score down the road.
Summing Up the CPI Score
Even in the case of the rare exceptions like Coke Consolidated, an analysis that combines TSR
and CPI produces a more complete and reliable understanding of corporate performance than one can
get from either measure alone. Boards will want to consult CPI to uncover the financial factors that are
shaping TSR or that will shape it. There are times, too, when a board will want to use a strong CPI score
as a counterpoint to a weak TSR, to defend its pay practices or fend off unwarranted overtures from an
activist.
Governance watchdogs, too, are apt to find value in it. They will want to consult CPI to be sure
they are not hounding the wrong companies, and to spotlight others that need attention despite a
seemingly favorable TSR record. They will also want to cite the EVA statistics when confronting an
underperforming company. They’re far less subject to the vagaries of the market and much more
reflective of management’s ability to allocate, manage and redeploy capital resources effectively, which
after all, is the real aim of the corporate governance game.
CPI reports for individual companies and for more than 75 U.S. and global business sectors are
available in an easy to use on-line tool called CPI Express, which is updated daily for more than 20,000
global tickers. Contact EVA Dimensions for a demonstration or more information.
Post Script
A companion article, Why Is EVA and Not EPS Used in the CPI Score?, examines shortcomings in conventional metrics, and highlights with two cases, Amazon and Volkswagen, the significant advantages of using economic metrics over the accounting-based ones in rating corporate performance. Available upon request from EVA Dimensions.