+ All Categories
Home > Documents > Introducti Shilpa

Introducti Shilpa

Date post: 03-Jun-2018
Category:
Upload: sunanda-mimani
View: 225 times
Download: 0 times
Share this document with a friend
28
Working Capital Management. 1 INTRODUCTION :  One of the most important functions in day to day management of the firm is the management of working capital. Working capital is defined as the capital required for the day to day working of the firm. It is also referred to short term assets used in daily operations. These consist primarily of cash marketable securities, account receivable and inventories. Effective management of working capital requires effective planning and control. Working capital management is one of the functional areas of finance that covers financing the required volume from various sources of a reasonable cost of capital. It involves in maintaining adequacy of current assets as well as reducing the level of risk posed by current Liabilities. Once the level of working capital is fixed, a firm has to find out the sources of finance. In this project, attempt have been made to highlight the concept of working capital, the volume of working capital; various constituent of current assets to gross working capital i.e. total current assets and financing of gross working capital. There may be difference in approach in arrangement of chapterisation. However the scheme of study is planned as follows:   Working Capital   Conceptual Aspect.   Financing Working Capital.   Profile of the company (Reliance Industries Ltd.).   Methodology.   Case Study.   Conclusion. Bibliography. Acknowledgement
Transcript

8/12/2019 Introducti Shilpa

http://slidepdf.com/reader/full/introducti-shilpa 1/28

Working Capital Management.1

INTRODUCTION : 

One of the most important functions in day to day management of the firm is the

management of working capital. Working capital is defined as the capital

required for the day to day working of the firm. It is also referred to short term

assets used in daily operations. These consist primarily of cash marketable

securities, account receivable and inventories. Effective management of working

capital requires effective planning and control.

Working capital management is one of the functional areas of finance that

covers financing the required volume from various sources of a reasonable cost

of capital. It involves in maintaining adequacy of current assets as well as

reducing the level of risk posed by current Liabilities. Once the level of working

capital is fixed, a firm has to find out the sources of finance.

In this project, attempt have been made to highlight the concept of workingcapital, the volume of working capital; various constituent of current assets to

gross working capital i.e. total current assets and financing of gross working

capital.

There may be difference in approach in arrangement of chapterisation. However

the scheme of study is planned as follows:

–  Working Capital –  

Conceptual Aspect.

–  Financing Working Capital.

–  Profile of the company

(Reliance Industries Ltd.).

–  Methodology.

–  Case Study.

–  Conclusion.

Bibliography.

Acknowledgement

8/12/2019 Introducti Shilpa

http://slidepdf.com/reader/full/introducti-shilpa 2/28

8/12/2019 Introducti Shilpa

http://slidepdf.com/reader/full/introducti-shilpa 3/28

Working Capital Management.3

(a)   Value :

F rom the value point of view, Working Capital can be defined as :

1.  Broad Concept –  Gross Working Capital.

2. 

Narrow Concept –  Net Working Capital.

Gross Working Capital :

I t is the capital invested in total current asset of the firm.

Thus,

gross working capital = Current Assets.

Net Working Capital :

I t is the excess of Current Assets over Current Liability.Thus,

Net Working capital = Current Assets –  

Current Liability.

Notes :  

Current Assets:

T hose assets which can be easily converted into cash within a short period, say

an accounting year.

Current liability:

T hose liabilities which are usually paid within a short period, say an accounting

 year.

A positive working capital means that the company is able to payoff its short- 

term liabilities in time.

(b) Time :

F rom the point of view of time, the term working capital can be divided into two

categories viz., Permanent and Temporary.

8/12/2019 Introducti Shilpa

http://slidepdf.com/reader/full/introducti-shilpa 4/28

Working Capital Management.4

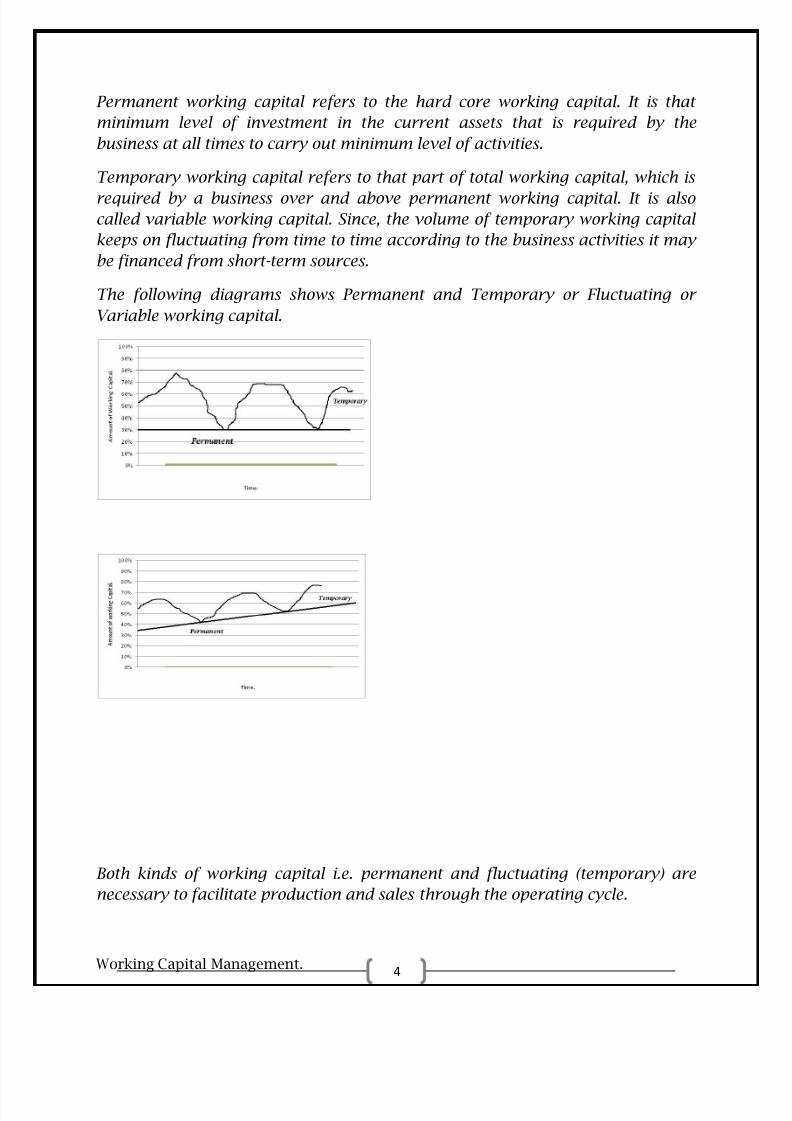
Permanent working capital refers to the hard core working capital. It is that

minimum level of investment in the current assets that is required by the

business at all times to carry out minimum level of activities.

Temporary working capital refers to that part of total working capital, which is

required by a business over and above permanent working capital. It is alsocalled variable working capital. Since, the volume of temporary working capital

keeps on fluctuating from time to time according to the business activities it may

be financed from short-term sources.

The following diagrams shows Permanent and Temporary or Fluctuating or

Variable working capital.

Both kinds of working capital i.e. permanent and fluctuating (temporary) are

necessary to facilitate production and sales through the operating cycle.

8/12/2019 Introducti Shilpa

http://slidepdf.com/reader/full/introducti-shilpa 5/28

Working Capital Management.5

Need for Working Capital : 

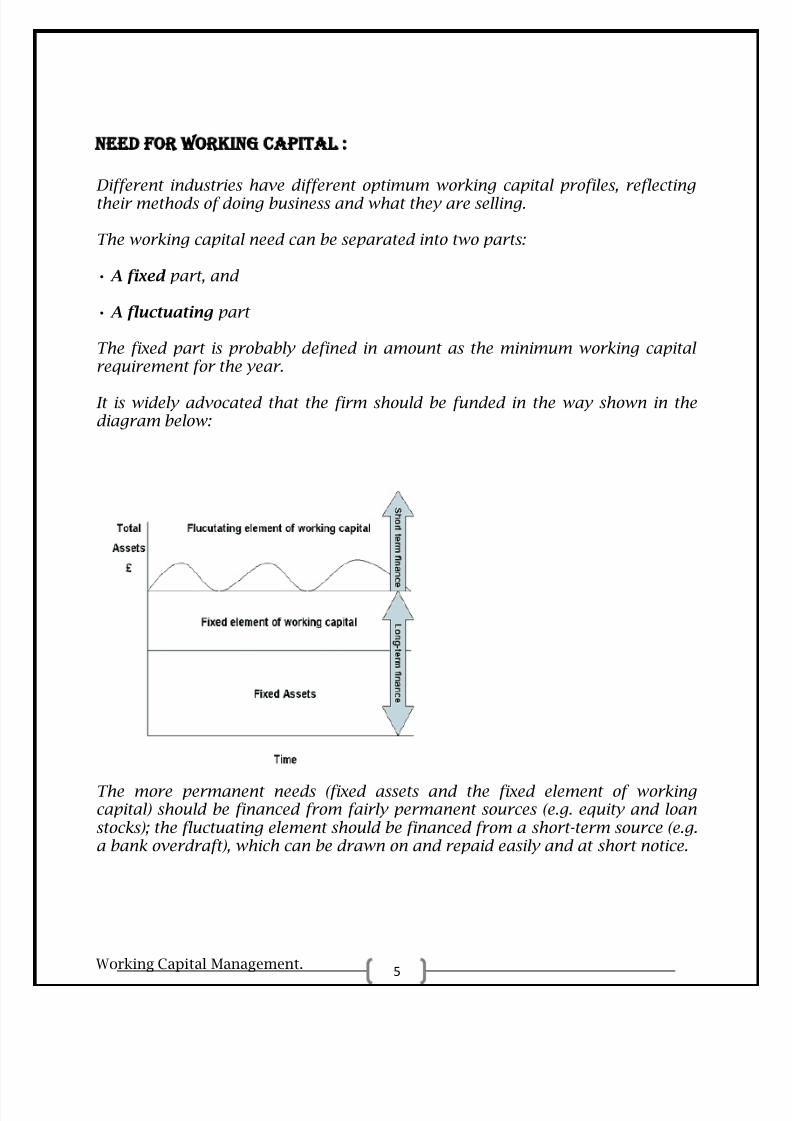
Different industries have different optimum working capital profiles, reflectingtheir methods of doing business and what they are selling.

The working capital need can be separated into two parts:

• A fixed  part, and

• A fluctuating part

The fixed part is probably defined in amount as the minimum working capitalrequirement for the year.

It is widely advocated that the firm should be funded in the way shown in thediagram below:

The more permanent needs (fixed assets and the fixed element of workingcapital) should be financed from fairly permanent sources (e.g. equity and loanstocks); the fluctuating element should be financed from a short-term source (e.g.a bank overdraft), which can be drawn on and repaid easily and at short notice.

8/12/2019 Introducti Shilpa

http://slidepdf.com/reader/full/introducti-shilpa 6/28

Working Capital Management.6

Major Considerations :

The major considerations in working capital management are :-

(i)   Profitability

(ii)   Liquidity(iii)   Structural Health

Profitability :

P rofitability is directly related to working capital. Higher the working capital, higher the

profitability.

Liquidity :

L iquidity is the ratio   between current ratio and quick ratio. To maintain profitability the

investment in working capital i.e. current assets has to be reduced.

Structural Health :

T he different components of working capital have to be balanced in a proper way. If not

balanced then in spite of current ratio and quick ratio indicating satisfactory financial position it

may not be as liquid as shown.

Thus, it is important that working capital policies should be such which ensures higher

profitability, proper liquidity and structural health of the organization.

Working Capital Cycle

Operating cycle = R+W+F+D-C

Where,

CASH

RAW MATERIAL,

LABOUR

OVERHEAD

W.I.PSTOCK

DEBTORS

8/12/2019 Introducti Shilpa

http://slidepdf.com/reader/full/introducti-shilpa 7/28

Working Capital Management.7

R = Raw material storage period.

W = Work – in– progress holding period.

F = Finished goods storage period.

D = Debtors collection period.

C = Credit period availed.

Volume of Working Capital : 

Working capital management is concerned with :-

a)   Maintaining adequate working capital.

AND

b)   Financing of the working capital.

Some of the factors which is needs to be considered while planning for working capitalrequirement are:-

  Cash  –   Identify the cash balance which allows for the business to meet day to day

expenses, but reduces cash holding costs.

  Inventories   –   Identify the level of inventory which allows for uninterrupted production

but reduces the investment in raw material.

  Debtors –   Identify the appropriate credit policy, i.e., credit terms which will attract

customers, such that any impact on cash flows and the cash conversion cycle will be offset

by increased revenue and hence Return on Capital (or vice versa).

  Short term finance   - Inventory is ideally financed by credit granted by the supplier;

dependent on the cash conversion cycle, it may however, necessary to utilize a bank loan

(or overdraft), or to “convert debtors to cash” through “factoring” in order to financeworking capital requirement.

  Nature of Business - Different nature of business will require different type of working

capital. Therefore need for working capital is different.

  Market and demand conditions -  For e.g. if an item demand far exceeds its production,

the working capital requirement would be less as investment in finished goods, inventory

would be very less.

  Technology & manufacturing policies-  For e.g. in some businesses the demand for goods

is seasonal, in that case a business may follow a policy for steady production through out

over the whole year or instead may choose policy of production only during the demand

season.

  Operating efficiency-   A company can reduce the working capital requirement byeliminating waste, improving coordination etc.

  Price level changes-  For e.g. rising prices necessitate the use of more funds for

maintaining an existing level of activity. For the same level of current assets, higher cash

outlays are required. Therefore the effect of rising prices is that a higher amount of

working capital is required.

8/12/2019 Introducti Shilpa

http://slidepdf.com/reader/full/introducti-shilpa 8/28

Working Capital Management.8

Financing Working Capital : 

F inancing working capital is a very important process in the working of a company. The

management of the company first have to bifurcates the working capital requirements between

the permanent working capital and temporary working capital.

The permanent working capital is always needed irrespective of sales fluctuations, hence it

should be financed by the long-term sources such as debt and equity. On the contrary the

temporary working capital may be financed by the short-term sources of finance.

Broadly speaking, the working capital finance may be classified between the two categories:

(i)   Spontaneous sources.

(ii)   Negotiable sources.

Spontaneous Sources:

S pontaneous sources of finance are those which naturally arise in the course of business

operations. Such as Trade credit, credit from employees, etc. Negotiated Sources:

N egotiated sources are those which have to be specifically negotiated with lenders say,

commercial banks, financial institutions, general public, etc.

Sources of Finance : 

T here are main sources of financing working capital they are:

1.  Spontaneous Sources of Finance.

2.  Inter-corporate loans and Deposits.

3.  Commercial Papers.

4.  Funds Generated from Operations.

5.  Public Deposits.

6.  Bills Discounting.

7.  Bill Rediscounting Scheme.

8.  Factoring.

9.  Finance from Banks. 

8/12/2019 Introducti Shilpa

http://slidepdf.com/reader/full/introducti-shilpa 9/28

Working Capital Management.9

1.  Spontaneous Sources of Finance :

(a)   Trade Credit:

A s outlined trade credit is a spontaneous source of finance which is normally extended to the

purchaser organization by the sellers or services providers. This source of financing working

capital is more important since it contributes to about one-third of the total short-term

requirements. The dependence on this source is higher due to lesser cost of finance as compared

with other sources. Trade credit is guaranteed when a company acquires supplies, merchandise

or materials and does not pay immediately. If a buyer is able to get the credit without completing

much formalities, it is termed as „open account trade credit.‟  

(b)   Bills Payable:

I n case of “Bills Payable” the purchaser will have to give in written promise to pay the amount of

the bill/invoice either on demand or at a fixed future date to the seller or the bearer of the note.

Due to its simplicity, easy availability and lesser explicit cost, the dependence on this source is

much more in a small or big organizations. Especially, for small enterprises this form of credit is

more helpful to smaller and medium enterprises. The amount of such financing depends on the

volume of purchases and the payment ti Inter-corporate Loans and Deposits : 

S ometime, organizations having surplus funds invest for short-term period with other

organizations. The rate of interest will be higher than the bank rate of interest and depending on

the financial soundness of the borrower company. This source of finance reduces dependence on

bank financing.

2. Commercial Papers :

C ommercial paper (CP) is an unsecured promissory note issued by a firm to raise funds for a

short period. This is an instrument that enables highly rated corporate borrowers for short-term

borrowings and provides an additional financial instrument to investors with a freely negotiable

interest rate. The maturity period ranges from minimum 7 days to less than 1 year.

3. Funds Generated from Operations : 

F unds generated from operations, during an accounting period, increase working capital by an

equivalent amount. The two main components of funds generated from operations are profit and

depreciation. Working capital will increase by the extent of funds generated from operations.

4. Public Deposits : 

D eposit from the public is one of the important source of finance particularly for well established

big companies with huge capital base for short and medium term.

8/12/2019 Introducti Shilpa

http://slidepdf.com/reader/full/introducti-shilpa 10/28

Working Capital Management.10

5. Bills Discounting : 

B ill discounting is recognized as an important short term financial instrument and it is widely

used method of short term financing. In a process of bill discounting, the supplier of goods draws

a bill of exchange with direction to the buyer to pay a certain amount of money after a certain

period, and gets its acceptance from the buyer or drawee of the bill.

6. Bill Rediscounting Scheme : 

T he bill rediscounting scheme was introduced by Reserve Bank of India with effect from 1 st  

November, 1970 in order to extend the use of the bill of exchange as an instrument for providing

credit. Under this scheme, all licensed scheduled banks are eligible to offer bills of exchange to

the Reserve Bank for rediscount.

7. Factoring : 

F actoring is a method of financing whereby a firm sells its trade debts at a discount to a financial

institution. Thus, factoring is a continuous arrangement between a financial institution, (namely

the factor) and a firm (namely the client) which sells goods and services to trade customers on

credit. As per this arrangement, the factor purchases the client‟s trade debts including accounts

receivables either with or without recourse to the client, and thus, exercises control over the credit

extended to the customers and administers the sales ledger of his client.

8. Finance from Banks : 

B anks today constitute the major suppliers of working capital credit to any business activity.

Reserve Bank of India has withdrawn the prescription, in regard to assessment of working

capital needs, based on the concept of Maximum Permissible Bank Finance, in April 1997. Banks

are now free to evolve, with the approval of their boards, methods for assessing the working

capital requirements of borrowers, within the prudential guidelines and exposure norms.

Profile of Reliance Industries Limited : 

History:

The Reliance Group, founded by Dhirubhai H. Ambani (1932-2002)  on 11th February 1966, isIndia's largest private sector enterprise, with businesses in the energy and materials value chain.Group's annual revenues are in excess of US$ 66 billion. The flagship company, RelianceIndustries Limited, is a Fortune Global 500 company and is the largest private sector company inIndia. Reliance Industries Limited (RIL) is a conglomerate with business in the energy andmaterials value chain.The Company operates in three segments: petrochemicals, refining and oil & gas.

The petrochemicals segment includes production and marketing operations of petrochemical

products. The refining segment includes production and marketing operations of the petroleum

8/12/2019 Introducti Shilpa

http://slidepdf.com/reader/full/introducti-shilpa 11/28

Working Capital Management.11

products. The oil and gas segment includes exploration, development and production of crude oil

and natural gas. It‟s others segment includes textile, retail business, special economic zone (SEZ)

development and telecom/broadband business.

Reliance Industries Limited is one of the largest publicly traded company in India by market

capitalization and is the second largest company in India by revenue after Indian Oil

Corporation. It is also India's largest private sector company by revenue and profit.

The company is ranked 99th on Fortune Global 500 list of the world's biggest corporations for

the year 2012. Backward vertical integration has been the cornerstone of the evolution and

growth of Reliance.

Starting with textiles in the late seventies, Reliance pursued a strategy of backward vertical

integration in polyester, fiber intermediates, plastics, petrochemicals, petroleum refining and oil

and gas exploration and production - to be fully integrated along the materials and energy value

chain.

Reliance enjoys global leadership in its businesses, being the largest polyester yarn and fiberproducer in the world and among the top five to ten producers in the world in majorpetrochemical products.

Major Group Companies are Reliance Industries Limited , including its subsidiaries and RelianceIndustrial Infrastructure Limited.

Businesses divisions: 

Major subsidiaries and associates

  Reliance Life Sciences  centers its profit-making ventures around medical, plant and

industrial biotechnology opportunities. Specifically, this company specializes inmanufacturing, branding, and marketing Reliance Industries' products inbiopharmaceuticals, pharmaceuticals, clinical research services, regenerative medicine,molecular medicine, novel therapeutics, biofuels, plant biotechnology, and industrialbiotechnology sectors of the medical business industry.

  Reliance Institute of Life Sciences  (RILS), established by Dhirubhai AmbaniFoundation, is an institution offering higher education in various fields of life sciences andrelated technologies.

  Reliance Logistics  (P) Limited is a single-window company selling transportation,distribution, warehousing, logistics, and supply chain-related products, supported by in- house state of the art telemetric and telemetry solutions.

  Reliance Clinical Research Services (RCRS), a contract research organization (CRO)and wholly owned subsidiary of Reliance Life Sciences, specializes in the clinical research

services industry. Its clients are primarily pharmaceutical, biotechnology, and medicaldevice companies.

  Reliance Solar, the solar energy subsidiary of Reliance, aims to produce and retail solarenergy systems primarily to remote and rural areas and to bring about a 'transformationin the quality of life'.

  Relicord is a stem-cell banking service owned by Reliance Industries.

  Infotel  Broadband is a broadband service provider which gained 4G licenses for

operating across India, now it is wholly owned by RIL for 48 billion ( US 873.6 million).

8/12/2019 Introducti Shilpa

http://slidepdf.com/reader/full/introducti-shilpa 12/28

Working Capital Management.12

  METHODOLOGY : 

T he selection of sample units are based on the annual report (Balance Sheet) of Reliance

Industries Ltd. Hence, it has its own limitations. The project is carried on, the basis of statistical

analysis mainly by Ratio-Analysis. It deals relatively with a few factors, but it provides the scope

by indicating extent, frequency, trends and association.

In this project, published data are analyzed by growing method. The selection and treatment of

each topic is based on my judgment of what is considered most significant, concise and simple,

effort has been made to present the project as clearly and simply as possible with resorting to the

more advanced technology.

The data‟s in the project are rounded up to one decimal place for better presentation of data‟s.

Due to which it may not present a true and fair view to the actual amount of the company.

CASE STUDY: 

Table 1: Statement of working Capital.

Particulars Amount (in Rs. Cr.)  

2009 2010 2011

CurrentAssets

Inventories

S. Debtors

Cash & Bank

Loans &

Advances

Fixed Deposit

Total Assets

26,981.6

11,660.2

362.4

10,517.6

13,100.3

29,825.4

17,441.9

604.6

17,320.6

26,530.3

35,955

18,424

889

24,573

38,709

62,622.1 91,722.8 1,18,550

8/12/2019 Introducti Shilpa

http://slidepdf.com/reader/full/introducti-shilpa 13/28

Working Capital Management.13

Current

Liabilities

Provisions

Total Liabilities

Working Capital

Changes in

Working Capital

48,018.7

3,565.4

61,400

4,563.5

66,244

4,258

51,584.1 65,963.5 70,502

11,038 25,759.3 48,048

14,721.3 37,010

The above table represents working capital of Reliance Industries Ltd. as on 2009, 2010, 2011.

Here the working capital of 2009 is taken as base and thus, the changes in working capital in

2010 is Rs. 14,721.3 and 2011 is Rs. 37,010.

The Bar Charts representing the share of Total Current Assets and total Current Liabilities in the

working capital of Reliance Industries Ltd. For the three years of study ( 2009, 2010, 2011). It

also represents the share of each items of Current Assets and Current Liabilities in it.

0%

20%

40%

60%

80%

100% Provisions

Current

Liabilities

Fixed

Deposits

Loans &

Advances

Cash &Bank


8/12/2019 Introducti Shilpa

http://slidepdf.com/reader/full/introducti-shilpa 14/28

Working Capital Management.14

Table 2: Current Ratio.

Particulars Amount (in Rs. Cr.)

2009 2010 2011

Total Current

Assets

Total Current

Liabilities

Current Ratio

62,622.1

51,584.1

91,722.8

65,963.5

1,18,550

70,502

1.21 1.39 1.68

The above table represents the Current Ratio of Reliance Industries Ltd. Which is 1.21 in 2009,

1.39 in 2010, 1.68 in 2011. The current ratio is good as it is more than 1. This represent that the

current assets are more than current liabilities and the company can pay its short term debts on

time. Current ratio is treated good when the ratio is 1:1. The Line chart representing the share of

current assets and current liabilities in current ratio for the year 2009, 2010, 2011. The x axis

shows the years of study and y axis shows the values.

0

2

4

6

8

2009 2010 2011

Current

Assets

Current

Liabilities

8/12/2019 Introducti Shilpa

http://slidepdf.com/reader/full/introducti-shilpa 15/28

Working Capital Management.15

Table 3: Inventory to Current Assets.

Particulars Amount (in Rs. Cr.)

2009 2010 2011

Inventories

Current Assets

Inventory to

Current Assets

26,981.6

62,622.1

29,825.3

91,722.8

35,955

1,18,550

43.1% 32.5% 30.3%

The above table represents the share of Inventories in Current Assets. The table clearly

represents that the share of Inventories in Current Assets is decreasing from 43.1% in 2009,

32.5% in 2010, 30.3% in 2011. The bar chart represents the trend of the share of Inventories in

Current Assets. Here, the y-axis represents the year of studies and the x-axis represents the

hypothetical values.

0 5

2009

2011

Inventories to Current

Assets

Inventories to

Current Assets

8/12/2019 Introducti Shilpa

http://slidepdf.com/reader/full/introducti-shilpa 16/28

Working Capital Management.16

Table 4: Debtors to Current Assets.

Particulars Amount (in Rs. Cr.)

2009 2010 2011S. Debtors

Current Assets

S. Debtors to

Current Assets

11,660.2

62,621.8

17,441.9

91,722.5

18,424

1,18,550

18.6% 19.01% 15.5%

The above table represents the share of Sundry Debtors in Current Assets. The table represents

the share of S. Debtors to Current Assets that is increased from 18.6% in 2009, to 19.01% in 2010

and then decreasing upto 15.5% in 2011.

The line chart represents the trend of Sundry Debtors in Reliance Industries Ltd. for the year

2009, 2010, 2011. The x-axis represents the years of study and the y-axis represents the

hypothetical values.

01

2

3

4

5

6

7

8

2009 2010 2011

Sundry Debtors

Sundry Debtors

8/12/2019 Introducti Shilpa

http://slidepdf.com/reader/full/introducti-shilpa 17/28

Working Capital Management.17

Table 5:Cash & Bank to Current Assets

Particulars Amount (in Rs. Cr.)

2009 2010 2011

Cash & Bank

Current Assets

Cash & Bank to

Current Assets

362.4

62,622.1

604.6

91,722.8

889

1,18,550

0.578% 0.659% 0.750%

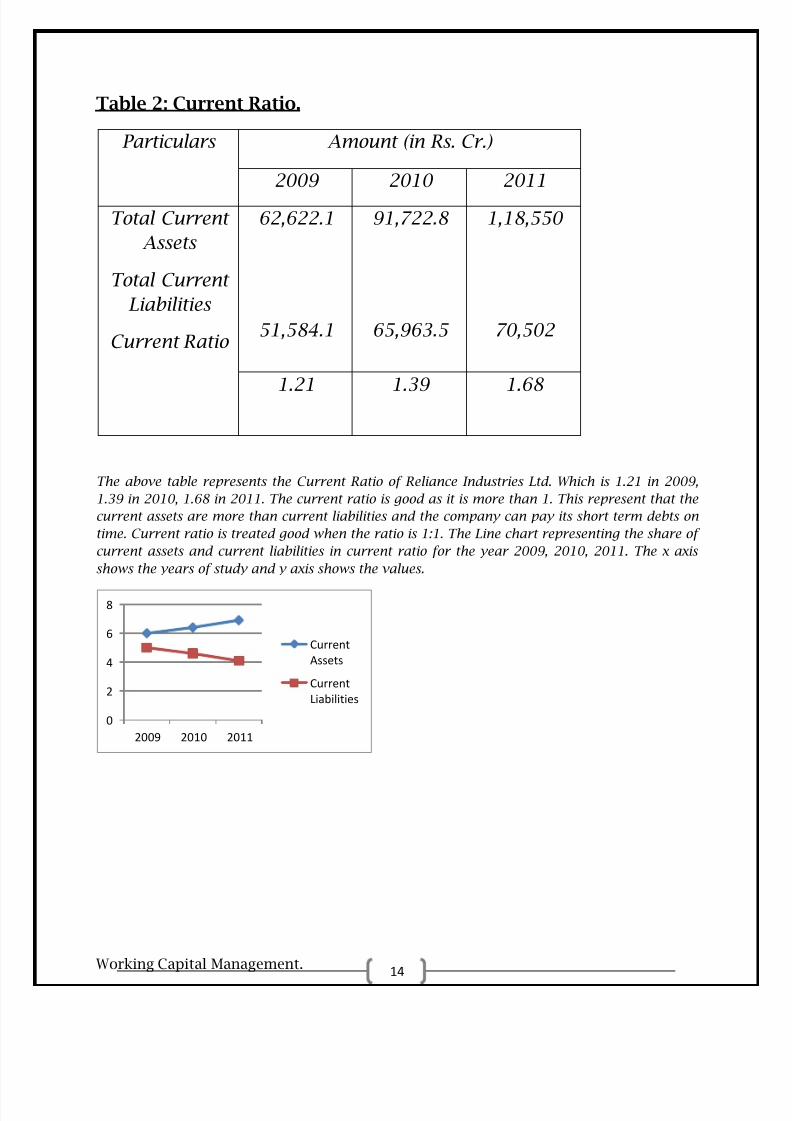
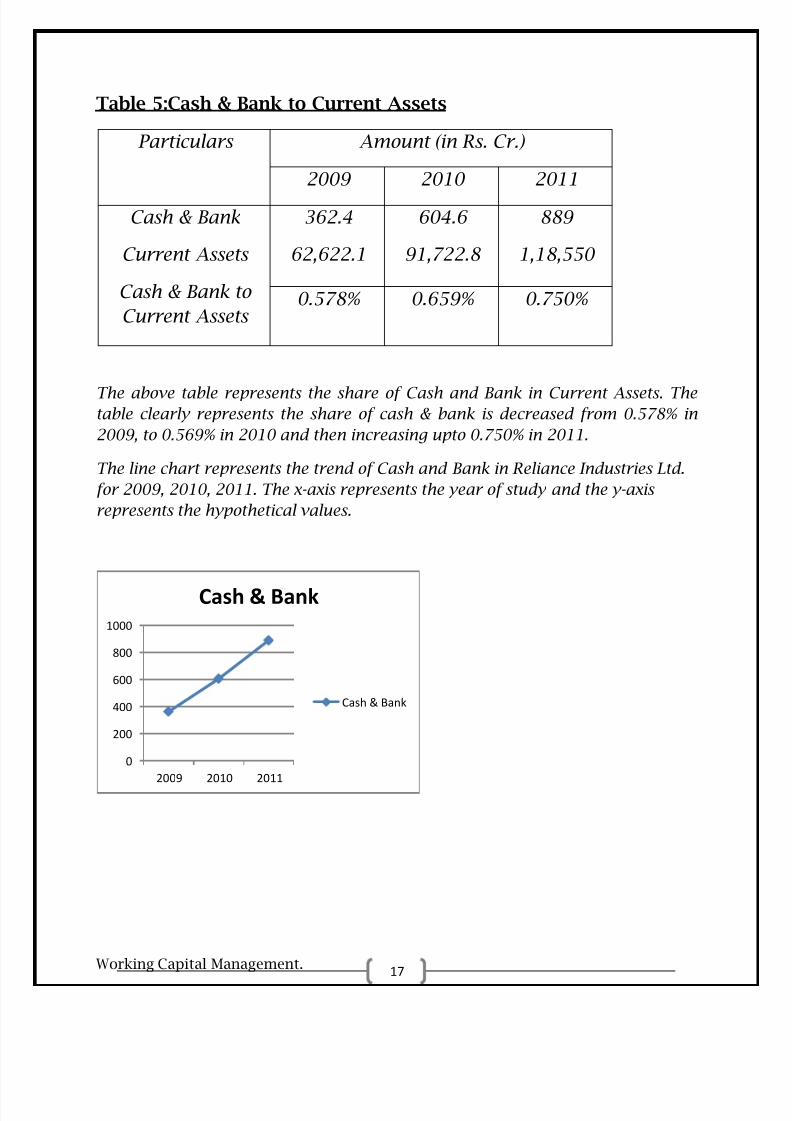
The above table represents the share of Cash and Bank in Current Assets. Thetable clearly represents the share of cash & bank is decreased from 0.578% in

2009, to 0.569% in 2010 and then increasing upto 0.750% in 2011.

The line chart represents the trend of Cash and Bank in Reliance Industries Ltd.

for 2009, 2010, 2011. The x-axis represents the year of study and the y-axis

represents the hypothetical values.

0

200

400

600

800

1000

2009 2010 2011

Cash & Bank

Cash & Bank

8/12/2019 Introducti Shilpa

http://slidepdf.com/reader/full/introducti-shilpa 18/28

Working Capital Management.18

Table 6: Loans & Advances to Current Assets. 

Particulars Amount (in Rs. Cr.)

2009 2010 2011

Loans & Adv.

Fixed Deposit

10,517.

6

13,100.

2

17,320.

6

26,530.

2

24,573

38,709

Total

Current

Assets

Total Loans

& Adv. to

Current

Assets

23,617.

8

62,622.

1

43,850.

8

91,722.

8

63,282

1,18,55 

0

37.7% 47.8% 53.4%

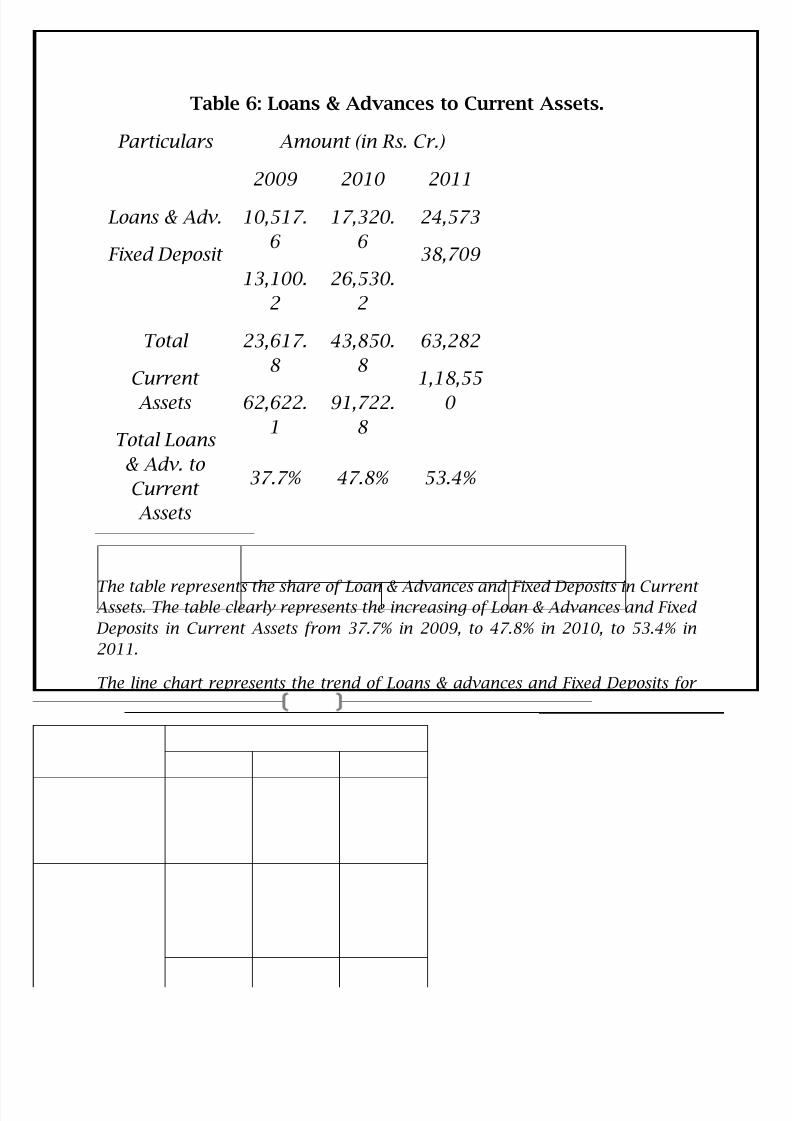
The table represents the share of Loan & Advances and Fixed Deposits in CurrentAssets. The table clearly represents the increasing of Loan & Advances and Fixed

Deposits in Current Assets from 37.7% in 2009, to 47.8% in 2010, to 53.4% in

2011.

The line chart represents the trend of Loans & advances and Fixed Deposits for

the year 2009, 2010, 2011 of Reliance Industries Ltd. The x-axis represents the

 years of study and y-axis represents hypothetical valueTable7:Statement of

Capital Employed 

Particulars Amount (in Rs. Cr.)

2009 2010 2011

8/12/2019 Introducti Shilpa

http://slidepdf.com/reader/full/introducti-shilpa 19/28

Working Capital Management.19

Net Fixed

Assets

Working

Capital

Capital

Employed

1,65,398.7

11,038

1,55,526

25,759

1,22,667

48,048

1,76,436.7 1,81,285 1,70,715

The above table represents the share of Fixed Assets including Capital Work-in-progress and

Working Capital in Capital Employed. The table clearly represents the share of Fixed Assets in

Capital Employed which is decreasing from Rs.1,65,398.7 in 2009, to Rs. 1,55,526 in 2010, to

Rs.1,22,667 in 2011. And the share of Working Capital which is increasing from Rs.11,038 in

2009, to Rs.25,759 in 2010, to Rs.48,048 in 2011.

The Bar chart is a graphical representation of the table above. Here, the x-axis represents capital

employed and y-axis represents hypothetical values.

Table 8: Working Capital as a percentage of Capital Employed.

Particulars Amount (in Rs. Cr.)

2009 2010 2011

0%

20%

40%

60%

80%

100% Working Capital

Fiexd Assets

(includingCapital Work-in

-progress)

8/12/2019 Introducti Shilpa

http://slidepdf.com/reader/full/introducti-shilpa 20/28

Working Capital Management.20

Working

Capital

Capital

Employed

Working

Capital to

Capital

Employed

11,038

1,76,436.7

25,759.3

1,81,285

48,048

1,70,715

6.26% 14.21% 28.15%

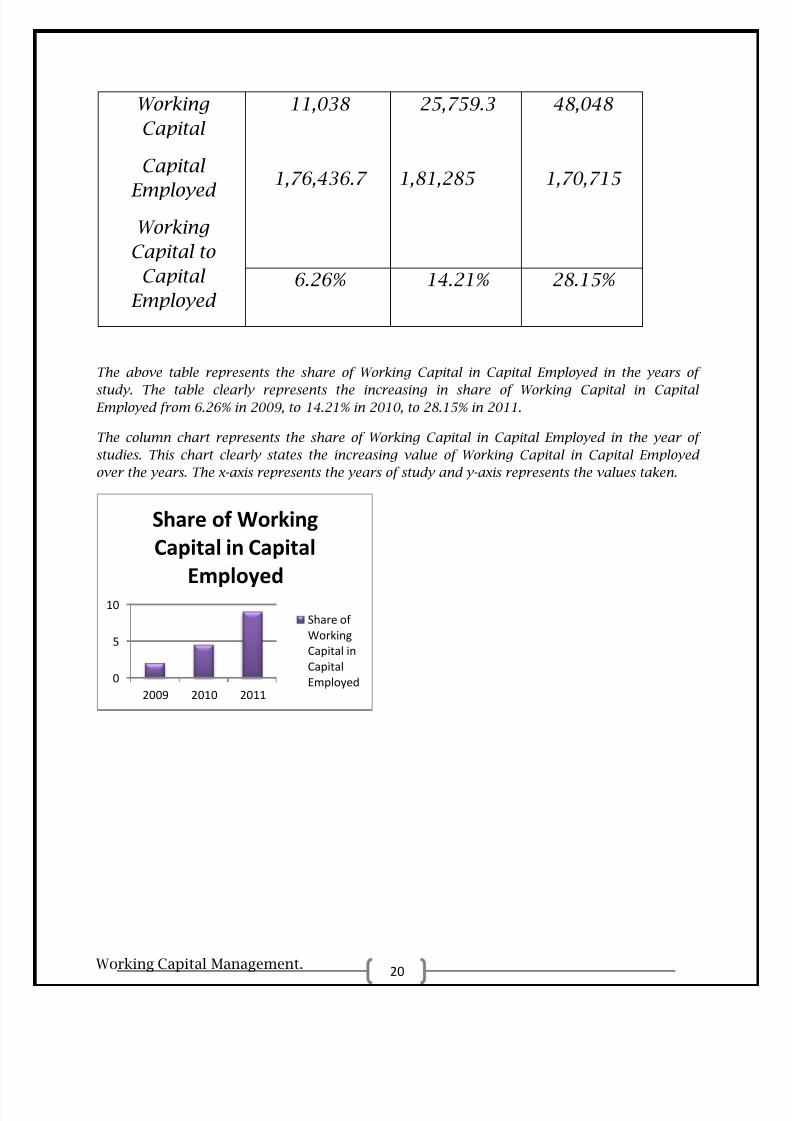
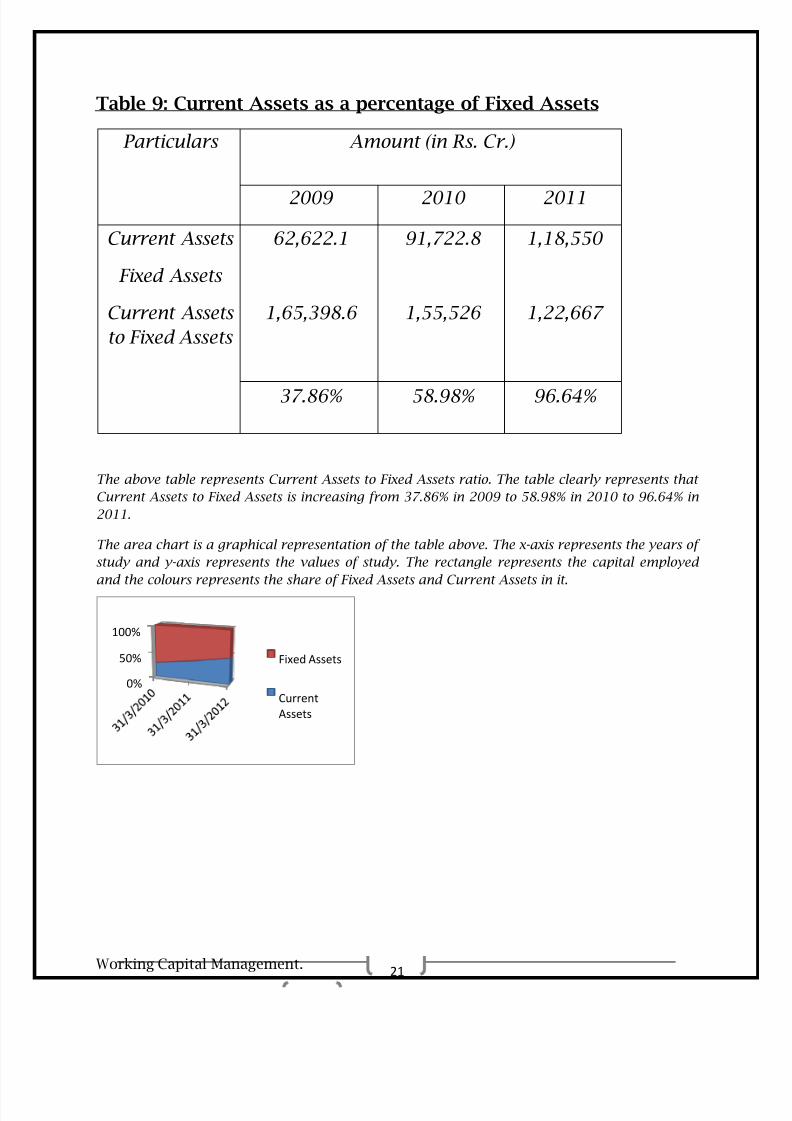
The above table represents the share of Working Capital in Capital Employed in the years of

study. The table clearly represents the increasing in share of Working Capital in CapitalEmployed from 6.26% in 2009, to 14.21% in 2010, to 28.15% in 2011.

The column chart represents the share of Working Capital in Capital Employed in the year of

studies. This chart clearly states the increasing value of Working Capital in Capital Employed

over the years. The x-axis represents the years of study and y-axis represents the values taken.

0

5

10

2009 2010 2011

Share of Working

Capital in Capital

Employed

Share of 

Working

Capital in

Capital

Employed

8/12/2019 Introducti Shilpa

http://slidepdf.com/reader/full/introducti-shilpa 21/28

Working Capital Management.21

Table 9: Current Assets as a percentage of Fixed Assets

Particulars Amount (in Rs. Cr.)

2009 2010 2011

Current Assets

Fixed Assets

Current Assets

to Fixed Assets

62,622.1

1,65,398.6

91,722.8

1,55,526

1,18,550

1,22,667

37.86% 58.98% 96.64%

The above table represents Current Assets to Fixed Assets ratio. The table clearly represents that

Current Assets to Fixed Assets is increasing from 37.86% in 2009 to 58.98% in 2010 to 96.64% in

2011.

The area chart is a graphical representation of the table above. The x-axis represents the years of

study and y-axis represents the values of study. The rectangle represents the capital employed

and the colours represents the share of Fixed Assets and Current Assets in it.

0%

50%

100%

Fixed Assets

Current

Assets

8/12/2019 Introducti Shilpa

http://slidepdf.com/reader/full/introducti-shilpa 22/28

Working Capital Management.22

Table 10: Current Liabilities to Current Assets. 

Particulars Amount (in Rs. Cr.)

2009 2010 2011

Current

Liabilities

Current Assets

Current

liabilities to

Current Assets

51,584.1

62,622.1

65,963.5

91,722.8

70,502

1,18,550

82.37% 71.92% 59.47%

The above table represents Current Liabilities to Current Assets in the years of study. The table

clearly represents that Current Liabilities to Current Assets are decreasing from 82.37% in 2009

to 71.92% in 2010 to 59.47% in 2011. This is a good scenario for the company as Current

Liabilities are decreasing as Compared to Current Assets over the years.

The area chart is a graphical representation of the table above. The x-axis shows the years of

study and the y-axis shows the value of study.

0%

20%

40%

60%

80%

100%

Current Assets

Current Liabilities

8/12/2019 Introducti Shilpa

http://slidepdf.com/reader/full/introducti-shilpa 23/28

Working Capital Management.23

Table 11: Share Capital to Current Assets.

Particulars Amount (in Rs. Cr.)

2009 2010 2011

Share Capital

Current Assets

Share Capital to

Current Assets

3,270.37

62,622.1

3,273.37

91,722.8

3,271.00

1,18,550

5.22% 3.57% 2.76%

The above table represents Share Capital to Current Assets in the year of study. The table clearly

represents that the share of Share Capital to Current Assets is decreasing from 5.22% in 2009, to

3.57% in 2010, to 2.76% in 2011.

The line chart is a graphical representation of the table above. The x-axis represents the years of

study and the y-axis represents the values of study.

0

5

10

2009 2010 2011

Share capital to Current

Assets Ratio.

Share capital

to Current

Assets Ratio.

8/12/2019 Introducti Shilpa

http://slidepdf.com/reader/full/introducti-shilpa 24/28

Working Capital Management.24

Table 12: Total Debt to Current Assets

Particulars Amount (in Rs. Cr.)

2009 2010 2011Secured

Loans

Unsecured

Loans

Total Debt

CurrentAssets

Debt to

Current

Assets

11,670.5

50,824.1

10,571.2

56,825.4

6,969.0

51,658.0

62,494.6

62,622.1

67,396.6

91,722.8

58,627

1,18,550

99.8% 73.5% 49.5%

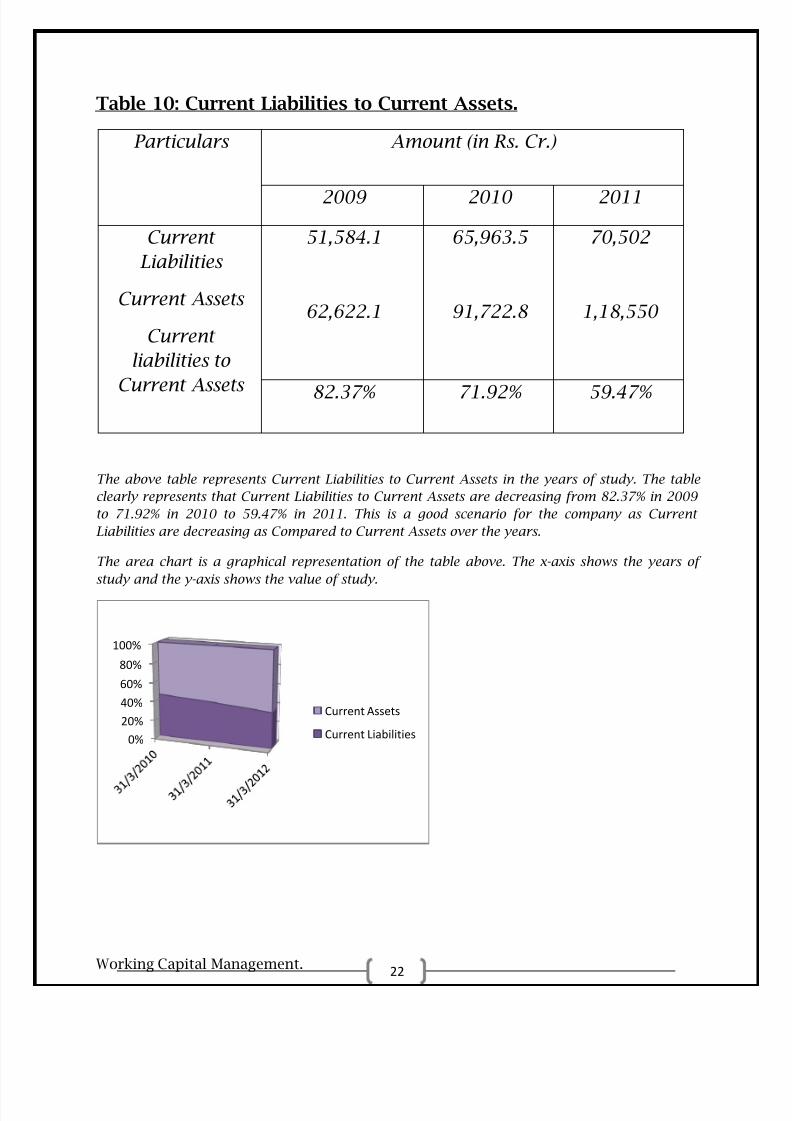
The above table represents the share of total debt i.e. Secured Loan and Unsecured Loan to

Current Assets of Reliance Industries Ltd. for the years of study. The table clearly represents thatTotal Debt to Current Assets is decreasing from 99.8% in 2009, to 73.55 in 2010, to 49.5% in

2012. This is a good scenario for the company as total debt of the company comprises of less

amount of its Current Assets.

The line chart is a graphical representation of the table. The x-axis represents the years of study

and the y-axis represents the values of study. The blue line represents secured debt of the

company, the red line represents the unsecured debt, and the green line represents the total debt

of the company. The chart also represents the trend followed through the years.

0

2

4

6

2009 2010 2011

Secured

Debt

Unsecured

Debt

Total Debt

8/12/2019 Introducti Shilpa

http://slidepdf.com/reader/full/introducti-shilpa 25/28

Working Capital Management.25

Conclusion : 

In earlier discussions, I have tried to assess the working capital of Reliance

Industries Ltd. For the year 2009, 2010, 2011, constituents of working capital

and financing working capital through different sources.

I, have taken only one company i.e. Reliance Industries Ltd. as sample unit and

number of study only three years i.e. 2009, 2010, 2011 because of time

constraints. In carrying on this project, I have taken help of the published annual

report of the company.

My findings do not reflect the general trend of the corporate section in regard to

working capital management.

This is a very small effort in management of working capital. This study will

provide ample scope to draw the trend of working capital of the corporate sector.

8/12/2019 Introducti Shilpa

http://slidepdf.com/reader/full/introducti-shilpa 26/28

Working Capital Management.26

Balance Sheet of Reliance

Industries------------------- in Rs. Cr. ------------------- 

Mar '12 Mar '11 Mar '1012 mth 12 mths 12 mths

Sources Of Funds

Total Share Capital 3,271.0 3,273.37 3,270.37Equity Share Capital 3,271.0 3,273.37 3,270.37Share Application Money 0.0 0.0 0.00Preference Share Capital 0.0 0.0 0.00Reserves 159,698.0 142,799.95 125,095.97Revaluation Reserves 3,127.0 5,467.0 8,804.27Net worth 166,096.0 151,540.32 137,170.61Secured Loans 6,969.0 10,571.21 11,670.50Unsecured Loans 51,658.0 56,825.47 50,824.19Total Debt 58,627.0 67,396.6 62,494.69Total Liabilities 224,723.0 218,937.0 199,665.30

Mar '12 Mar '11 Mar '1012 mth 12 mths 12 mths

Application Of FundsGross Block 209,552.0 221,251.97 215,864.71Less: Accum. Depreciation 91,770.0 78,545.5 62,604.82Net Block 117,782.0 142,706.47 153,259.89Capital Work in Progress 4,885.0 12,819.56 12,138.82Investments 54,008.0 37,651.54 23,228.62Inventories 35,955.0 29,825.3 26,981.62Sundry Debtors 18,424.0 17,441.94 11,660.21Cash and Bank Balance 889.0 604.57 362.36Total Current Assets 55,268.0 47,871.89 39,004.19Loans and Advances 24,573.0 17,320.6 10,517.57Fixed Deposits 38,709.0 26,530.29 13,100.29Total CA, Loans & Advances 118,550.0 91,722.7 62,622.05Deferred Credit 0.0 0.0 0.00Current Liabilities 66,244.0 61,399.87 48,018.65Provisions 4,258.0 4,563.4 3,565.43Total CL & Provisions 70,502.0 65,963.35 51,584.08Net Current Assets 48,048.0 25,759.43 11,037.97

Miscellaneous Expenses 0.0 0.0 0.00Total Assets 224,723.0 218,937.0 199,665.30Contingent Liabilities 45,831.0 41,825.13 25,531.21Book Value (Rs) 498.21 446.25 392.51

8/12/2019 Introducti Shilpa

http://slidepdf.com/reader/full/introducti-shilpa 27/28

Working Capital Management.27

Bibliography :

1. Google.com

2.  Cost Accounting and Financial Management by ICAI.

3.  Financial Policy & Management Accounting by B. Banerjee,PHI.

4. Ask.com

5. Wikipedia.com

6. Yahoo.com

7. Answer.com

8. Financial Management, by M.Y.

Khan & P.K. Jain.9. Financial Management by P.

Chandra.

10.  Financial Management by C.A.

Manish Raj Dhandharia.

8/12/2019 Introducti Shilpa

http://slidepdf.com/reader/full/introducti-shilpa 28/28

Acknowledgement :

I, am thankful to our Accounts teacher Mr. Niloy Gautam, head ofAccounts Department of college Syamaprsad College, to supervise me

and guide me through the project. This project would not have been

completed and presented as it is without his help and guidance.

I, also thank Calcutta University to provide us with such project work,

this project work has been a great learning experience for me. As I

have learned a lot about the topic carried out by me (Working Capital

Management) and also about the company selected by me (Reliance

Industries Limited) and its well fair in the actual world.


Recommended