Page 1
INTERNATIONAL JOURNAL OF PHARMACEUTICS & DRUG ANALYSIS
VOL.4 ISSUE 3, 2016; 147 – 152 ; http://ijpda.com; ISSN: 2348-8948
147
RESEARCH ARTICLE
DETERMINATION OF
ACITRETIN IN PHARMA-
CEUTICAL FORMULA-
TIONS BY HPLC METHOD
Devika Subramaniyan.G. 1*, Shaik yasmin, R.Swathi,
S.Amatul Azeem ,Ramesh petchi.R, M.Kiran kumar,
M.Purushothaman.
Department of Pharmaceutical Analysis and Quality As-
surance Vasavi Institute of Pharmaceutical Sciences, Affil-
iated to JNTUA, Kadapa-516247, Andhra Pradesh, India.
Date Received: 18th March 2016; Date Accepted: 28th March
2016 Date published: 31st March 2016
Email: [email protected]
Abstract: Acitretin is in a group of medicines called
retinoids. It is used in severe skin disorders like psoriasis
and it is official in USP. Psoriasis is a skin disease affecting
millions of person’s worldwide. A simple, precise and
rapid HPLC method was developed for the estimation of
Acitretin in pharmaceutical dosage forms. The method
was carried out on a Purospher BDSC18 col-
umn(250×4.6mmid, 5µm) column using a mixture of ace-
tic acid Buffer (pH adjusted to 4): methanol:
tetrahyrofuran [12:85:3]v/v/v as a mobile phase. The flow
rate was 1 ml/min and Ultra-violet detection was carried
out at 354 nm. Every part of determination was per-
formed at ambient column temperature. The retention
time was 4.313 min for Acitretin. The developed method
was validated for parameters like specificity, accuracy,
precision, robustness as per International Conference on
Harmonization guidelines. Linearity for Acitretin was in
the range of 30-180µg/ml and correlation coefficient was
found to be 0.999. The percentage recovery was found to
be in the limit of 98.9-99.8 %. Statistical analysis of the
results has been carried out revealing high accuracy and
good precision. Hence this method can be of use and val-
ue for the quality control department of pharmaceutical
companies manufacturing these formulations without any
interference due its sensitivity, simplicity and selectivity.
Key words: Acitretin, HPLC, Validation, ICH.
INTRODUCTION:
Acitretin (ACT) is in a group of medicines called
retinoids. It is used in severe skin disorders like psoriasis 1-2. Psoriasis is a skin disease affecting millions of person’s
worldwide. It is clinically categorized by erythematous,
rounded plaques and sharply demarcated papules cov-
ered by silvery micaceous scale, epidermal hyper prolif-
eration overlying immune mediated dermal
inflammation, leading to profound adverse effects on pa-
tient’s physical, social and mental wellbeing. Acitretin is
used to treat Darier's disease. Acitretin works by inhibit-
ing the excessive cell growth and keratinization seen in
psoriasis 3-4. It therefore reduces the thickening of the skin,
plaque formation and scaling. Oral Acitretin is currently
indicated for the treatment of severe psoriasis in adults,
but its use is limited by systemic side effects and terato-
genicity.
A literature survey reported that few publications are re-
ported for estimation of acitretin in pharmaceutical prep-
arations as well as in biological fluids by application of
spectroflourimetry and LCMS/MS 5-12. There is no HPLC
method was available for determination of acitretin with
faster elution time in pharmaceutical preparations (cap-
sules). Hence an attempt was made to develop and vali-
date a new, simple, precise, accurate and especially time
saving method which is suitable for quality control in the
pharmaceutical industry.
EXPERIMENTATION:
Apparatus:
• HPLC - LC 10 AT VP Shizmadzu
• pH meter- CYBER SCAN 510 (Elico)
• UV-Visible Spectrophotometer - UV-1700 (Shi-
madzu)
• Digital balance- (Sartorius)
• Sonicator- MODEL 2200MH (Shimadzu)
• Vacuum filter- MF-6126 (Millipore)
Materials and Reagents:
All chemicals and reagents used throughout the work
were of analytical grade. All other solvents used were of
HPLC grade. HPLC grade Milli Q water was used
throughout the experiment work. acitretin was received
as gift samples from Reddys Labs Hyderabad, India, re-
spectively. Acetic cap® capsules were purchased from
local market.
Mobile phase Preparation
The mobile phase was prepared by mixing in the ratio of
Page 2
Devika GS et al, Int J. Pharm. Drug. Anal, Vol: 4, Issue: 3, 2016; 147-152
Available online at http://ijpda.com
148
acetic acid Buffer (pH adjusted to 4): methanol:
tetrahyrofuran [12:85:3].v/v/v. Then this solution was fil-
tered through 0.45µ membrane filter and further the air
bubbles are removed by sonication.
Preparation of standard drug stock solutions
The standard stock solutions of ACT (1mg/ml) was pre-
pared by suitable dilutions.
Preparation of linearity solutions.
The linearity standard solutions were prepared from
standard stock solutions. Pipette out 0.3, 0.6, 0.9, 1.2,1 .5
ml from ACT stock solution and transfer in 10 ml stand-
ard volumetric flask and make up to10 ml with mobile
phase to acquire that the linearity concentrations of 30-
150 µg/ml of Acitretin. Then the samples were filtered by
a 0.45µm nylon membrane filter before injecting in to the
column.
Preparation of sample solution
Twenty capsules every single acetic cap® (Dr. Reddys),
containing 10 mg of ACT were accurately weighed and
find out their average weight. The powder equivalent to
10mg of ACT was taken in 100ml of standard volumetric
flask and extracted with 50 ml of methanol. The sample
was kept in an ultrasonic bath for 20 min and additional
diluted to 100ml by using mobile phase. Then this sam-
ple is filtered through 0.2micron membrane filter. From
this solution 5ml is dilute to10ml to get a final concentra-
tion of 50 µg/ml of ACT. All the solutions were protected
from light.
Assay standard solution preparation
A working standard solution having concentration of 50
µg/ml of ACT was prepared from the above standard
drug stock solution
Results and Discussion
Method Optimization
A number of trials were made to find out the ideal solvent
system (mobile phase) for eluting the drug. The trails car-
ried out by using mobile phase containing Methanol: wa-
ter (50:50), Methanol: water (70:30), methanol: acetonitrile:
water (30:30:40), methanol: acetonitrile: water (50:35:15).
These trails showed poor resolution. To improve the reso-
lution acetic acid buffer with ethanol system is used and
got better peak shapes and further more to improve the
resolution and reduce the tailing tetra hydrofuran also
introduced, after many trails finally filtered and degassed
the mixture of acetic acid buffer (pH adjusted to 4): meth-
anol: Tetrahyrofuran [12:85:3] v/v/v was designated as a
appropriate mobile phase and the detection was carried
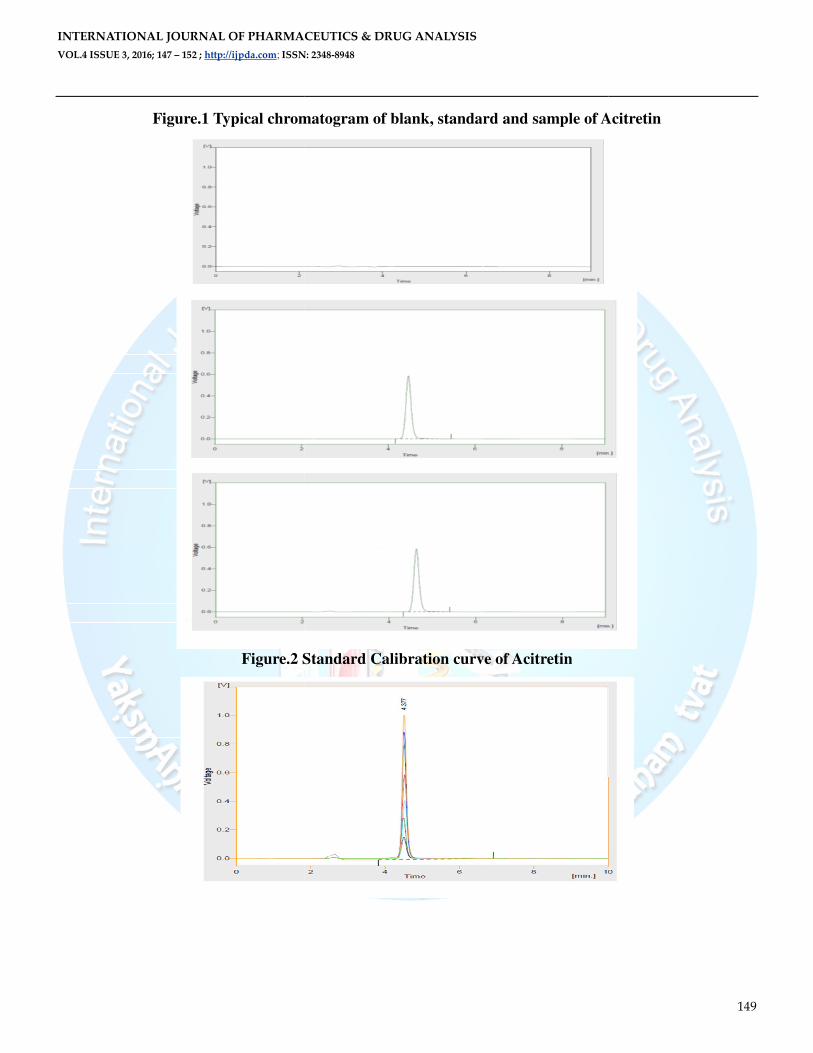
out at 354 nm. The obtained standard, sample and blank
chromatograms were reported in Figure1.
VALIDATION OF THE METHOD
The proposed method was validated according to the In-
ternational Conference on Harmonization (ICH) guide-
lines13.
Specificity:
The specificity of the proposed HPLC method was proved
by its ability to determine the Acitretin in its formulation
confirming that, there was no interference.
Linearity
To check linearity, standard graphs were built with six
concentration of Acetretin in the range of 30-150 µg/ml of
ACT were prepared in triplicates. The linearity was cal-
culated by least square regression method and results are
reported in Table.1and linearity overlain spectra are pre-
sented in Fig .2 and Calibration graph presented in Fig.3.
Table 1.Linearity data for Acitretin
Parameters Acitretin
Detection wavelength 354
Linearity range(µg/ml) 30-180
Regression equation Y=mx+C
(Slope(m))
452.36
Intercept(C) 766.05
Correlation coefficient 0.9994
Limit of Detection(µg/ml) 1
Limit of Quantification(µg/ml) 3
Limit of Detection and Limit of Quantification (sensitiv-
ity)
The limit if detection (LOD) was calculated from the line-
arity curve using the formula
LOD= 3.3Χ {Residual Standard deviation/Slope}.
The LOD for ACT was confirmed to be 1.0 µg/ml.
The Limit of quantification (LOQ) was calculated from the
linearity curve using the formula.
LOQ= 10Χ {Residual Standard deviation/Slope}
The LOQ for ACT was confirmed to be3.0 µg/ml
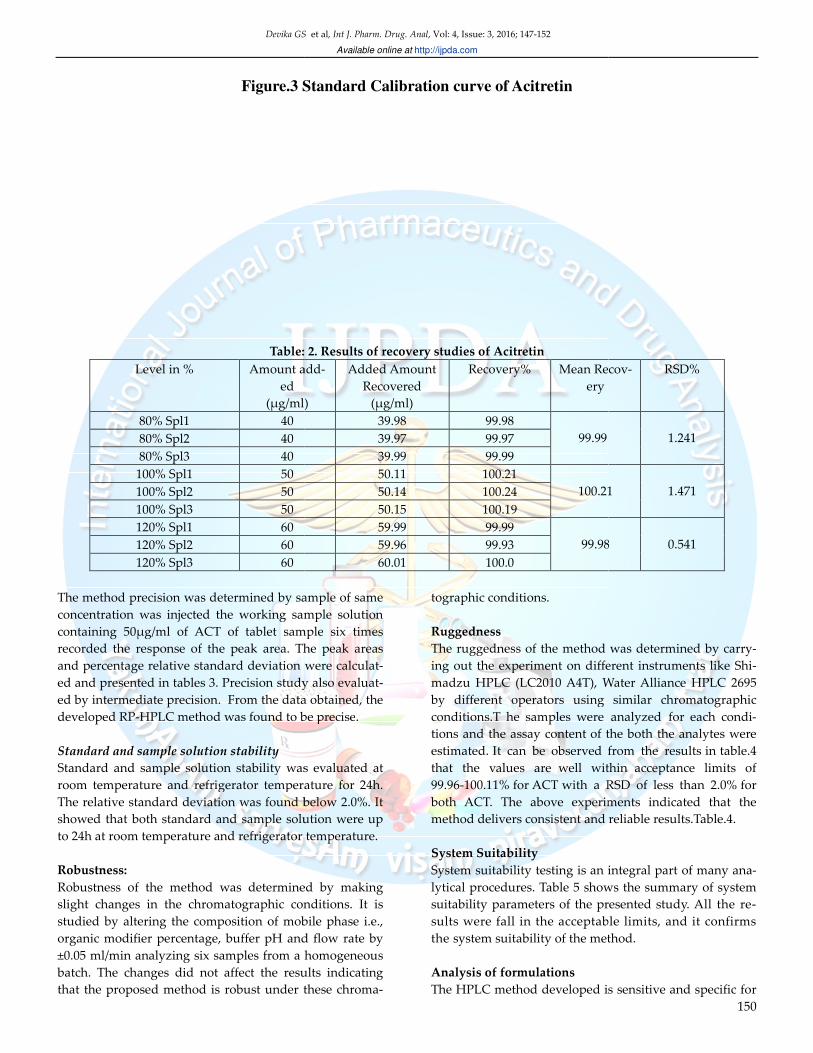
Accuracy:
It was performed by adding 80%, 100%, 120% of pure
standard drug of ACT to previously analyzed tablet pow-
der sample and mixtures were reanalyzed by the pro-
posed method. For every single concentration three sam-
ple sets were prepared and injected in duplicate and re-
sults were reported in Table.2 and it confirms the accura-
cy of the method .
Precision
Then system precision was determined by using working
standard ACT solution containing 50µg/ml of ACT was
injected 6 times and recorded the response of peak areas.
Page 3
INTERNATIONAL JOURNAL OF PHARMACEUTICS & DRUG
VOL.4 ISSUE 3, 2016; 147 – 152 ; http://ijpda.com; ISSN: 2348
Figure.1 Typical chromatogram of blank, standard and sample of
Figure.2 Standard Calibration curve of Acitretin
PHARMACEUTICS & DRUG ANALYSIS
ISSN: 2348-8948
.1 Typical chromatogram of blank, standard and sample of Aci
Standard Calibration curve of Acitretin
149
Acitretin
Page 4
Devika GS
Figure.3 Standard Calibration curve of Acitretin
Table: 2.
Level in % Amount ad
ed
(µg/ml)
80% Spl1 40
80% Spl2 40
80% Spl3 40
100% Spl1 50
100% Spl2 50
100% Spl3 50
120% Spl1 60
120% Spl2 60
120% Spl3 60
The method precision was determined by sample of same
concentration was injected the working sample solution
containing 50µg/ml of ACT of tablet sample
recorded the response of the peak area. The peak areas
and percentage relative standard deviation were calcula
ed and presented in tables 3. Precision study also evalua
ed by intermediate precision. From the data obt
developed RP-HPLC method was found to be precise
Standard and sample solution stability
Standard and sample solution stability was eva
room temperature and refrigerator temperature for 24h.
The relative standard deviation was found below 2.0%. It
showed that both standard and sample solu
to 24h at room temperature and refrigerator temperature.
Robustness:
Robustness of the method was determined by making
slight changes in the chromatographic conditions.
studied by altering the composition of mobile phase i.e.,
organic modifier percentage, buffer pH and flow rate
±0.05 ml/min analyzing six samples from a homogeneous
batch. The changes did not affect the results indicating
that the proposed method is robust under these chrom
S et al, Int J. Pharm. Drug. Anal, Vol: 4, Issue: 3, 2016; 147-152
Available online at http://ijpda.com
Standard Calibration curve of Acitretin
Table: 2. Results of recovery studies of Acitretin
Amount add-
(µg/ml)
Added Amount
Recovered
(µg/ml)
Recovery% Mean Re
ery
39.98 99.98
99.99 39.97 99.97
39.99 99.99
50.11 100.21
100.2150.14 100.24
50.15 100.19
59.99 99.99
99.9859.96 99.93
60.01 100.0
sion was determined by sample of same
ing sample solution
g/ml of ACT of tablet sample six times
The peak areas
tion were calculat-
Precision study also evaluat-
From the data obtained, the
HPLC method was found to be precise.
Standard and sample solution stability was evaluated at
frigerator temperature for 24h.
was found below 2.0%. It
ution were up
perature and refrigerator temperature.
Robustness of the method was determined by making
ic conditions. It is
tion of mobile phase i.e.,
centage, buffer pH and flow rate by
±0.05 ml/min analyzing six samples from a homogeneous
fect the results indicating
st under these chroma-
tographic conditions.
Ruggedness
The ruggedness of the method was d
ing out the experiment on different instruments like Sh
madzu HPLC (LC2010 A4T), Water Alliance HPLC 2695
by different operators using
conditions.T he samples were
tions and the assay content of the both the analytes were
estimated. It can be observed from
that the values are well within acceptance
99.96-100.11% for ACT with a RSD
both ACT. The above experiments indicated that the
method delivers consistent and reliable results.
System Suitability
System suitability testing is an integral part of many an
lytical procedures. Table 5 shows the summary of system
suitability parameters of the present
sults were fall in the acceptable limits, and it confirms
the system suitability of the method.
Analysis of formulations
The HPLC method developed is se
150
cov-
RSD%
1.241
100.21
1.471
99.98
0.541
The ruggedness of the method was determined by carry-
ing out the experiment on different instruments like Shi-
madzu HPLC (LC2010 A4T), Water Alliance HPLC 2695
by different operators using similar chromatographic
analyzed for each condi-
tent of the both the analytes were
from the results in table.4
within acceptance limits of
RSD of less than 2.0% for
ments indicated that the
sistent and reliable results.Table.4.
System suitability testing is an integral part of many ana-
shows the summary of system
rameters of the presented study. All the re-
sults were fall in the acceptable limits, and it confirms
system suitability of the method.
he HPLC method developed is sensitive and specific for
Page 5
INTERNATIONAL JOURNAL OF PHARMACEUTICS & DRUG ANALYSIS
VOL.4 ISSUE 3, 2016; 147 – 152 ; http://ijpda.com; ISSN: 2348-8948
151
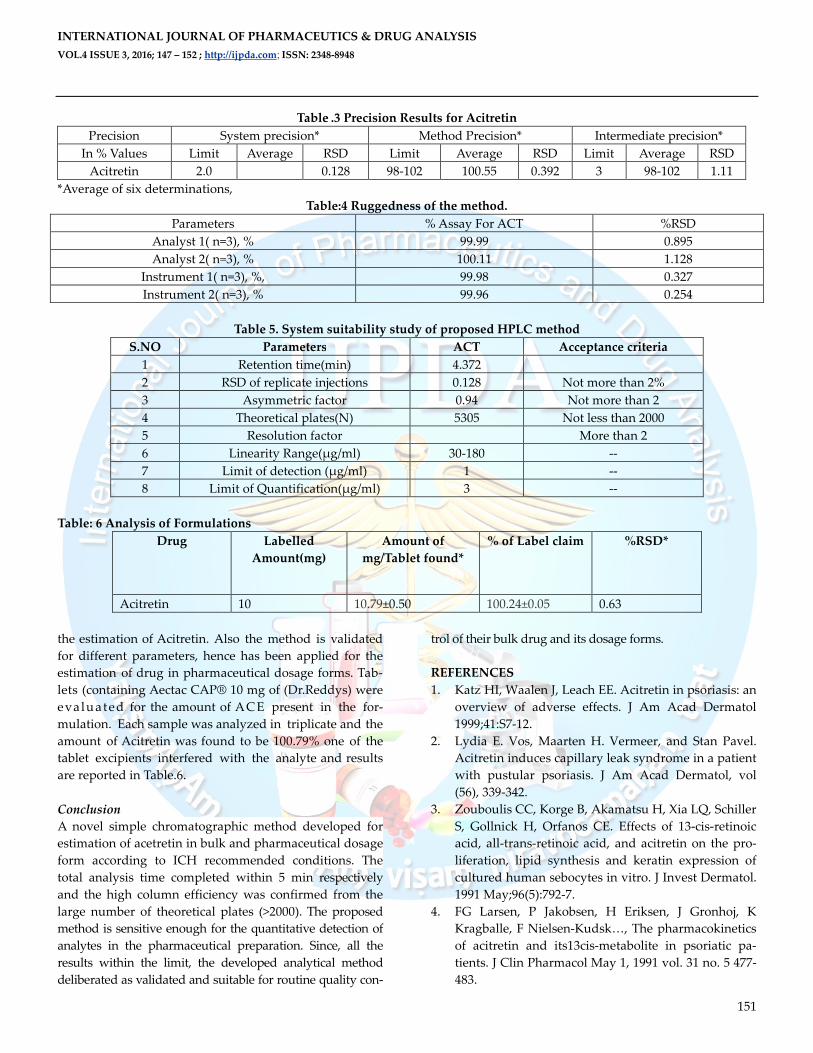
Table .3 Precision Results for Acitretin
Precision System precision* Method Precision* Intermediate precision*
In % Values Limit Average RSD Limit Average RSD Limit Average RSD
Acitretin 2.0 0.128 98-102 100.55 0.392 3 98-102 1.11
*Average of six determinations,
Table:4 Ruggedness of the method.
Parameters % Assay For ACT %RSD
Analyst 1( n=3), % 99.99 0.895
Analyst 2( n=3), % 100.11 1.128
Instrument 1( n=3), %, 99.98 0.327
Instrument 2( n=3), % 99.96 0.254
Table 5. System suitability study of proposed HPLC method
S.NO Parameters ACT Acceptance criteria
1 Retention time(min) 4.372
2 RSD of replicate injections 0.128 Not more than 2%
3 Asymmetric factor 0.94 Not more than 2
4 Theoretical plates(N) 5305 Not less than 2000
5 Resolution factor More than 2
6 Linearity Range(µg/ml) 30-180 --
7 Limit of detection (µg/ml) 1 --
8 Limit of Quantification(µg/ml) 3 --
Table: 6 Analysis of Formulations
Drug Labelled
Amount(mg)
Amount of
mg/Tablet found*
% of Label claim %RSD*
Acitretin 10 10.79±0.50 100.24±0.05 0.63
the estimation of Acitretin. Also the method is validated
for different parameters, hence has been applied for the
estimation of drug in pharmaceutical dosage forms. Tab-
lets (containing Aectac CAP® 10 mg of (Dr.Reddys) were
eva luated for the amount of AC E present in the for-
mulation. Each sample was analyzed in triplicate and the
amount of Acitretin was found to be 100.79% one of the
tablet excipients interfered with the analyte and results
are reported in Table.6.
Conclusion
A novel simple chromatographic method developed for
estimation of acetretin in bulk and pharmaceutical dosage
form according to ICH recommended conditions. The
total analysis time completed within 5 min respectively
and the high column efficiency was confirmed from the
large number of theoretical plates (>2000). The proposed
method is sensitive enough for the quantitative detection of
analytes in the pharmaceutical preparation. Since, all the
results within the limit, the developed analytical method
deliberated as validated and suitable for routine quality con-
trol of their bulk drug and its dosage forms.
REFERENCES
1. Katz HI, Waalen J, Leach EE. Acitretin in psoriasis: an
overview of adverse effects. J Am Acad Dermatol
1999;41:S7-12.
2. Lydia E. Vos, Maarten H. Vermeer, and Stan Pavel.
Acitretin induces capillary leak syndrome in a patient
with pustular psoriasis. J Am Acad Dermatol, vol
(56), 339-342.
3. Zouboulis CC, Korge B, Akamatsu H, Xia LQ, Schiller
S, Gollnick H, Orfanos CE. Effects of 13-cis-retinoic
acid, all-trans-retinoic acid, and acitretin on the pro-
liferation, lipid synthesis and keratin expression of
cultured human sebocytes in vitro. J Invest Dermatol.
1991 May;96(5):792-7.
4. FG Larsen, P Jakobsen, H Eriksen, J Gronhoj, K
Kragballe, F Nielsen-Kudsk…, The pharmacokinetics
of acitretin and its13cis-metabolite in psoriatic pa-
tients. J Clin Pharmacol May 1, 1991 vol. 31 no. 5 477-
483.
Page 6
Devika GS et al, Int J. Pharm. Drug. Anal, Vol: 4, Issue: 3, 2016; 147-152
Available online at http://ijpda.com
152
5. A.K. Sakhia, E. Lundanesa. etal., Quantitative deter-
mination of endogenous retinoids in mouse embryos
by high-performance liquid chromatography with
on-line solid-phase extraction, column switching and
electrochemical detection. Journal of Chromatog-
raphy A, 1998.828:451–460.
6. De Leenheer AP, etal., a high-performance liquid
chromatographic procedure for the simultaneous de-
termination of etretinate (Tigason), all-trans-acitretin
(Neotigason) and 13-cis-acitretin in human plas-
ma.1990.J Chromatogr. 2; 500:637-42.
7. Suber C, Laugeir JP, Gieger JM, Bun H, Durand A,
Mailbach HI. High performance liquid chromatog-
raphy of acitretin in plasma and its application to
pharmacokinetic study in human subject. Pharm Res
1992;9:1365-9.
8. Feng S, Zhang Y, Fan J. A spectrofluorimetric method
for the determina-tion of acitretin in pharmaceuticals.
Chem Pap. 2009;63:484-8.
9. Al-mallaha NR, Buna H, Duranda A. Rapid determi-
nation of acitretin or isotretinoin and their major me-
tabolites by high-performance liquid chromatog-
raphy. Anal Lett. 1988;21:1603-18.
10. Park HD, Kim HK, Chun MR, Kim JW, Kim DW, Lee
JH. A fully validated HPLC method for the simulta-
neous determination of acitretin and etretinate in
plasma and its application to a pharmacokinetic
study in healthy Korean subjects. Int J Clin Pharmacol
Ther 2009;47:476-82.
11. Fayer BE, Huselton CA, Garland WA, Liberato DJ….,
Quantification of acitretin in human plasma by
microbore liquid chromatography-negative chemical
ionization mass spectrometry. J Chromatogr. 1991 Jul
17;568(1):135-44.
12. Kumar A, Monif T, Khuroo A, Sasmal D, Goswami D,
Lahkar VK…., Stability-indicating validation of
acitretin and isoacitretin in human plasma by LC-ESI-
MS/MS bioanalytical method and its application to
pharmacokinetic analysis. Biomed Chromatogr. 2011
Jun;25(6):680-8.
13. The International Conference on Harmonization, Q2
(R1), Validation of Analytical Procedures, Text and
Methodology, 2005.