1 Evaluation of Surface-Ship Resistance and Propulsion Model-Scale Database for CFD Validation * Fred Stern and Joe Longo Iowa Institute of Hydraulic Research The University of Iowa Iowa City, IA 52242 Moustafa Abdel-Maksoud Schiffbau-Versuchsanstalt Potsdam GmbH Marquarter Chaussee 100 D-14469 Potsdam, Germany Toshio Suzuki Department of Naval Architecture and Ocean Engineering Faculty of Engineering Osaka University 2-1 Yamadaoka, Suita Osaka 565, Japan An evaluation is performed of the surface-ship model-scale database for computational fluid dynamics validation with regard to current status and future uses and requirements. The specific emphasis is on data of relevance to resistance and propulsion and validation of Reynolds-averaged Navier-Stokes codes. The data is evaluated relative to criteria developed for geometry and flow, physics, computational fluid dynamics validation, and full scale as well as past uses. Conclusions are made with regard to the available data and past uses and recommendations are provided for future uses of the available data and future data procurement. INTRODUCTION Rapid advancements in the development of computational fluid dynamics (CFD) and experimental fluid dynamics (EFD) provide the necessary tools for realisation of simulation based design. However, validation and calibration are also required, which creates the need to maintain a current evaluation of databases for CFD validation with regard to status and future uses and requirements. This is the goal of the present study with specific focus on the surface-ship model-scale database and on data of relevance to resistance and propulsion and validation of Reynolds-averaged Navier-Stokes (RANS) codes. This is a continuing effort and updates (Longo and Stern, 1996; ITTC, 1996) in preparation for the 22 nd International Towing Tank Conference (ITTC) and the Gothenburg 2000 CFD Workshop. The Gothenburg 2000 CFD Workshop will compare viscous CFD codes and data for cargo/container, combatant, and tanker hull forms with and without a free surface. A database evaluation was also done recently for aerospace applications (Marvin, 1995); however, the emphasis is more on building block experiments than practical geometries. The previous evaluations (Longo and Stern, 1996; ITTC, 1996) are updated by down selection and inclusion of both unbeknownst and newly acquired data. The down selection is based on the recommendations of (ITTC, 1996) for cargo/container [Hamburg Test Case (HTC)], combatant [David Taylor Model Basin (DTMB) model 5415 (5415)], and tanker [Ryuko-Maru (RM)] geometries which required that full-scale data and/or ship existed along with the Series 60 C B =.6 (S60) cargo/container and HSVA tanker geometries since the data and previous use are extensive. Unbeknownst data for a tanker (DAIOH) and newly acquired data for cargo/container (KCS) and tanker (KVLCC) geometries are also included since the data is extensive and holds promise for CFD validation. The data is organised in summary and detailed tables and evaluated using criteria developed for geometry and flow, physics, CFD validation, and full scale as well as past uses. Lastly, conclusions are made with • Proceedings 1 st Symposium on Marine Application of Computational Fluid Dynamics, 19-21 May 1998, McLean, VA
Transcript
1
Evaluation of Surface-Ship Resistance and Propulsion Model-Scale Database for CFD Validation*
Fred Stern and Joe LongoIowa Institute of Hydraulic Research
Toshio SuzukiDepartment of Naval Architecture and Ocean Engineering
Faculty of Engineering Osaka University2-1 Yamadaoka, Suita
Osaka 565, Japan
An evaluation is performed of the surface-ship model-scale database for computationalfluid dynamics validation with regard to current status and future uses and requirements.The specific emphasis is on data of relevance to resistance and propulsion andvalidation of Reynolds-averaged Navier-Stokes codes. The data is evaluated relative tocriteria developed for geometry and flow, physics, computational fluid dynamicsvalidation, and full scale as well as past uses. Conclusions are made with regard to theavailable data and past uses and recommendations are provided for future uses of theavailable data and future data procurement.
INTRODUCTION
Rapid advancements in the development of computational fluid dynamics (CFD) and experimental fluiddynamics (EFD) provide the necessary tools for realisation of simulation based design. However, validation andcalibration are also required, which creates the need to maintain a current evaluation of databases for CFD validationwith regard to status and future uses and requirements. This is the goal of the present study with specific focus onthe surface-ship model-scale database and on data of relevance to resistance and propulsion and validation ofReynolds-averaged Navier-Stokes (RANS) codes. This is a continuing effort and updates (Longo and Stern, 1996;ITTC, 1996) in preparation for the 22nd International Towing Tank Conference (ITTC) and the Gothenburg 2000CFD Workshop. The Gothenburg 2000 CFD Workshop will compare viscous CFD codes and data forcargo/container, combatant, and tanker hull forms with and without a free surface. A database evaluation was alsodone recently for aerospace applications (Marvin, 1995); however, the emphasis is more on building blockexperiments than practical geometries.
The previous evaluations (Longo and Stern, 1996; ITTC, 1996) are updated by down selection andinclusion of both unbeknownst and newly acquired data. The down selection is based on the recommendations of(ITTC, 1996) for cargo/container [Hamburg Test Case (HTC)], combatant [David Taylor Model Basin (DTMB)model 5415 (5415)], and tanker [Ryuko-Maru (RM)] geometries which required that full-scale data and/or shipexisted along with the Series 60 CB=.6 (S60) cargo/container and HSVA tanker geometries since the data andprevious use are extensive. Unbeknownst data for a tanker (DAIOH) and newly acquired data for cargo/container(KCS) and tanker (KVLCC) geometries are also included since the data is extensive and holds promise for CFDvalidation. The data is organised in summary and detailed tables and evaluated using criteria developed forgeometry and flow, physics, CFD validation, and full scale as well as past uses. Lastly, conclusions are made with
• Proceedings 1st Symposium on Marine Application of Computational Fluid Dynamics, 19-21 May 1998,
McLean, VA
2
regard to the available data and past uses and recommendations provided for future uses of the available data andfuture data procurement.
CRITERIA
In order to evaluate the data with regard to current status and future uses and requirements, criteria aredeveloped for geometry and flow, physics, CFD validation, and full scale.
Geometry and flowThe geometry is restricted to practical surface-ship model-scale hull forms with or without appendages
and/or propulsor. The facilities include towing tanks, circulating water channels, and wind tunnels.The flow is restricted to conditions of interest to resistance and propulsion in distinction from seakeeping
and manoeuvring. Many conditions are of interest, e.g., bare hull, appendages and/or propulsor, model size, hull-form variation, fixed or free model, tow point, turbulence stimulation, straight ahead calm water, ballast, restrictedwater, waves, yaw, double model, etc.
PhysicsMany physics are of interest encompassing design variables for resistance and propulsion (forces and
moments, sinkage and trim, wave profile, nominal wake, propulsion, etc.); geometry effects (model size, hull-formvariation, flow control device, etc.); facility/experimental method effects (fixed or free model, tow point, turbulencestimulation, facility bias, etc.); and a myriad of flow phenomena, e.g., Re effects and scaling, boundary layer andwake, stern flow, turbulence, vortex flow and separation, Fr effects, wave breaking, bow flow, transom flow,propeller-hull interaction, wave-boundary layer and wake interaction, etc. The list of measured variables includesforces and moments, sinkage and trim, self propulsion, surface pressure and shear stress, wave profiles andelevations, mean velocity and pressure, and turbulence (i.e., Reynolds stresses). Physics is referred to as multi-issue,comprehensive, or limited.
CFD validationThe process of CFD validation is generally accepted as providing an assessment of the credibility of a CFD
solution through comparisons with a benchmark usually provided by experimental data. Specific definition islacking as is generally the case for the overall process of CFD uncertainty assessment, as discussed more later inconjunction with the evaluation of past uses. For the present, suffice to say that the documentation, quality, andquantity of the data should be sufficient for validation of RANS CFD codes.
Documentation. The documentation of the data is measured by the level of the detailed reporting of thegeometry, conditions, and experimental methods; analysis of the data with regard to the physics of interest; andavailability/usability. Although many of the studies are motivated both for explication of the flow physics and CFDvalidation, the documentation varies considerably. A consensus is needed for documentation, including archivingand dissemination. Documentation is referred to as detailed, partial, or limited.
Quality. The quality of data (i.e., uncertainty assessment) is measured through rigorous application ofexperimental uncertainty assessment methodologies. Unfortunately, reporting of experimental uncertaintiescontinues to be a problem, including implementation procedures (e.g., simple repeat tests are often done in lieu ofcareful estimates for bias and precision limits) and documentation and presentation of results. This was one reasonfor the recent development of the AIAA Standard (AIAA Standard, 1995) for experimental uncertainty assessmentmethodology. The AIAA Standard (AIAA Standard, 1995) includes guidelines and examples for application of theexperimental uncertainty assessment methodology for wind-tunnel tests. Similar guidelines and examples areneeded for towing-tank tests. This will also provide values for expected uncertainties for towing-tank tests, whichare also needed. The detailed tables include values for the reported uncertainties, which are useful in providingestimates for expected uncertainties for towing-tank tests. Quality is referred to as rigorous, partial, or none.
Quantity. The quantity of data is measured with regard to resolution of the flow physics. For this purpose,the data should be sufficiently dense for evaluation of the dominant terms in the RANS, continuity, and auxiliary(turbulence model, etc.) equations and other variables of interest (e.g., vorticity) and the dominant terms in theirgoverning equations; however, equipment limitations and time and cost constraints are limiting factors such that thisis practicably impossible. Quantity is referred to as large mapping and dense, large mapping and coarse, partialmapping and dense, or partial mapping and coarse.
Full scale
3
Validation and calibration ultimately must be done at full scale; however, full-scale testing is largelyconfined to speed trials and very much complicated by environmental conditions. Furthermore, relatively few CFDstudies have included full-scale Re and/or environmental conditions. Thus, full-scale testing and CFD are beyondthe scope of the present evaluation. Nonetheless, geometries are preferred for which full-scale data and/or shipexist. The existence of full-scale data and/or ship is indicated in discussions and the available full-scale data isincluded along with the available model-scale data in the detailed tables. The facility for full-scale data is referredto as the sea.
EVALUATION
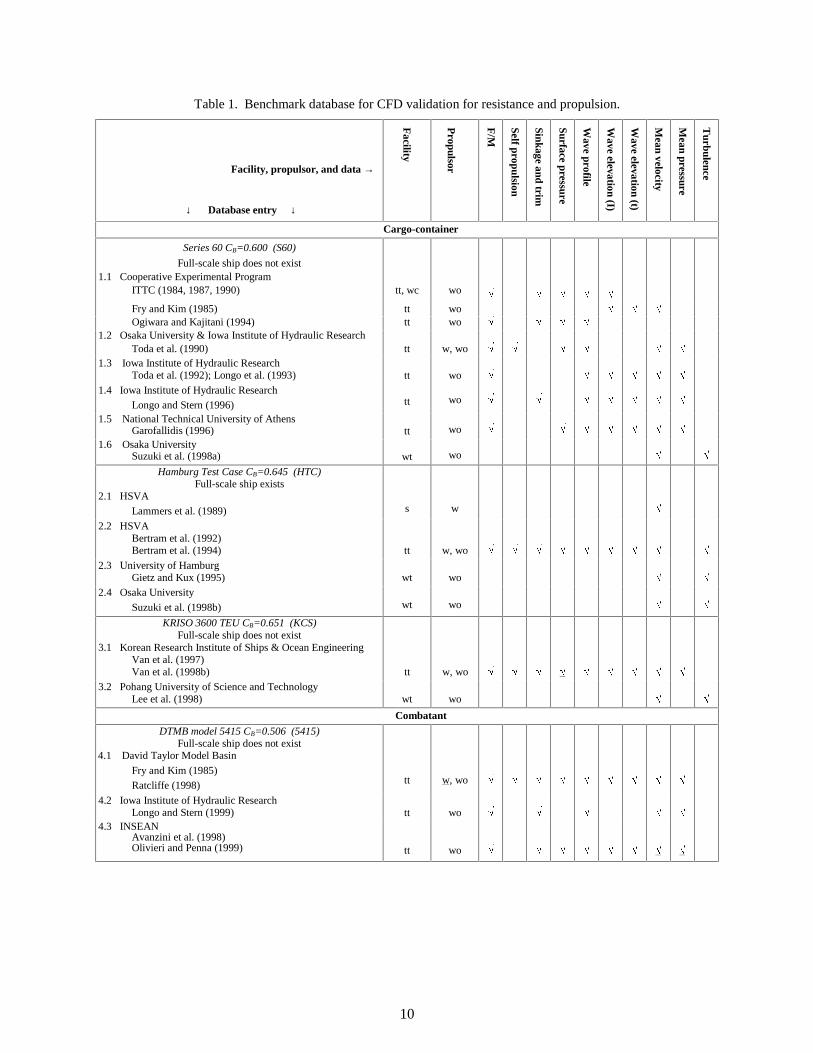
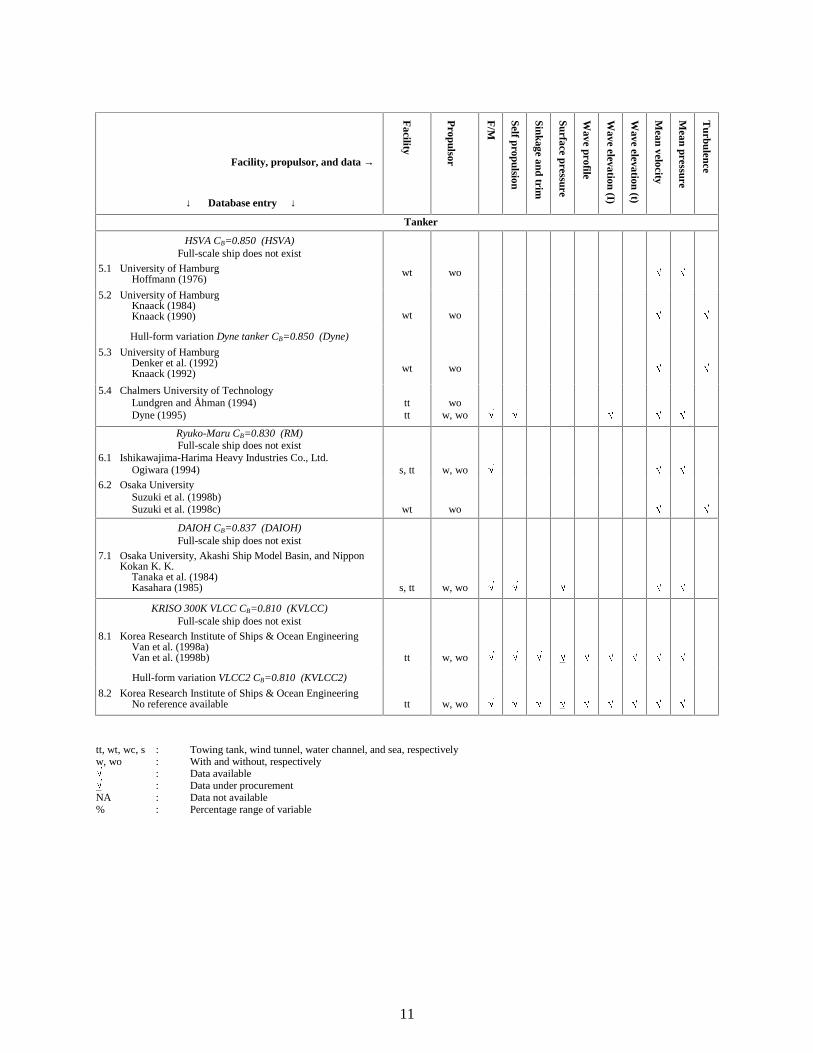
Table 1 provides a summary of the database and is organised by hull form: cargo/container (S60, HTC,KCS); combatant (5415); and tanker (HSVA, RM, DAIOH, KVLCC). There are a total of 23 studies and 37references: 6 studies for the S60 (ITTC, 1984; ITTC, 1987; ITTC, 1990; Fry and Kim, 1985; Ogiwara and Kajitani,1994; Toda et al., 1990; Toda et al., 1992; Longo et al., 1993, Longo and Stern, 1996; Garofallidis, 1996; Suzuki etal., 1998a); 4 studies for the HTC (Lammers et al., 1989; Bertram et al., 1992; Bertram et al., 1994, Gietz and Kux,1995; Suzuki et al., 1998b); 2 studies for the KCS (Van et al., 1997; Van et al., 1998b; Lee et al., 1998); 3 studiesfor 5415 (Fry and Kim, 1985; Ratcliffe, 1998; Longo and Stern, 1999; Avanzini et al., 1998; Olivieri and Penna,1999; Olivieri et al., 1998); 4 studies for the HSVA (Hoffmann, 1976; Knaack, 1984; Knaack, 1990, Denker et al.,1992; Knaack, 1992; Lundgren and Ahman, 1994; Dyne, 1995); 2 studies for the RM (Suzuki et al., 1998b;Ogiwara, 1994, Suzuki et al., 1998c); 2 studies for the DAIOH (Tanaka et al., 1984; Kasahara, 1985); and 2 studiesfor the KVLCC (Van et al., 1998a; Van et al., 1998b). The facility, propulsor condition, and list of measuredvariables are indicated.
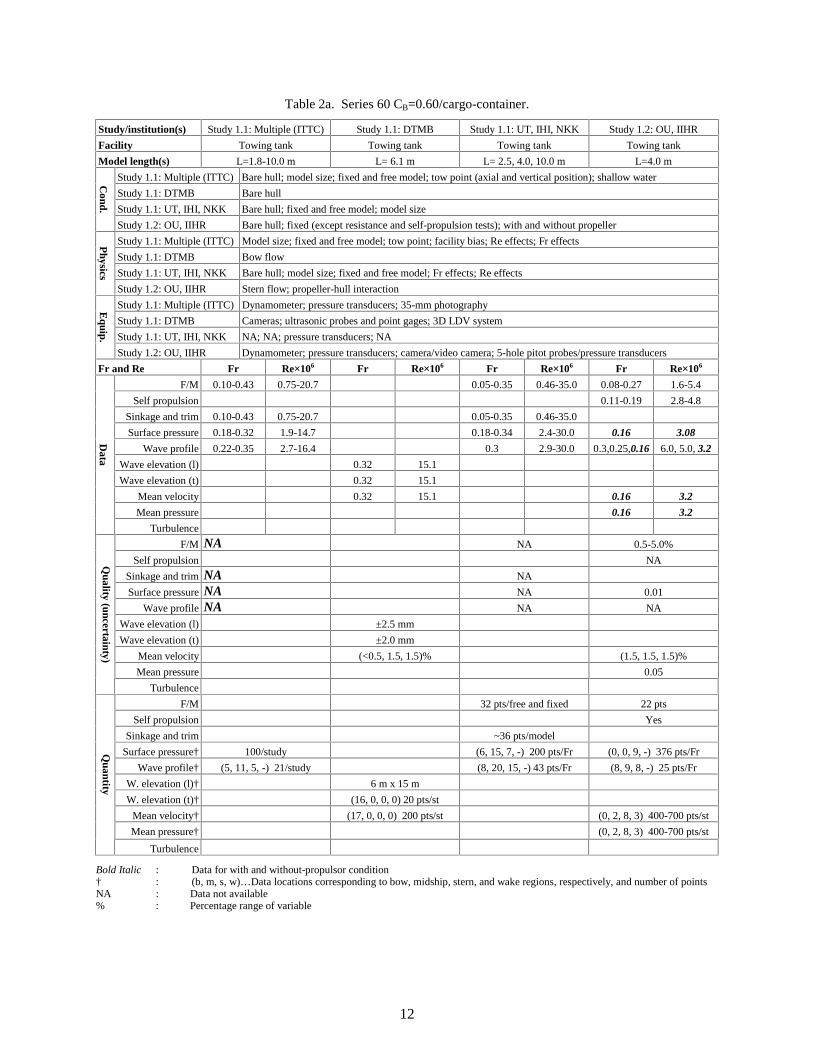
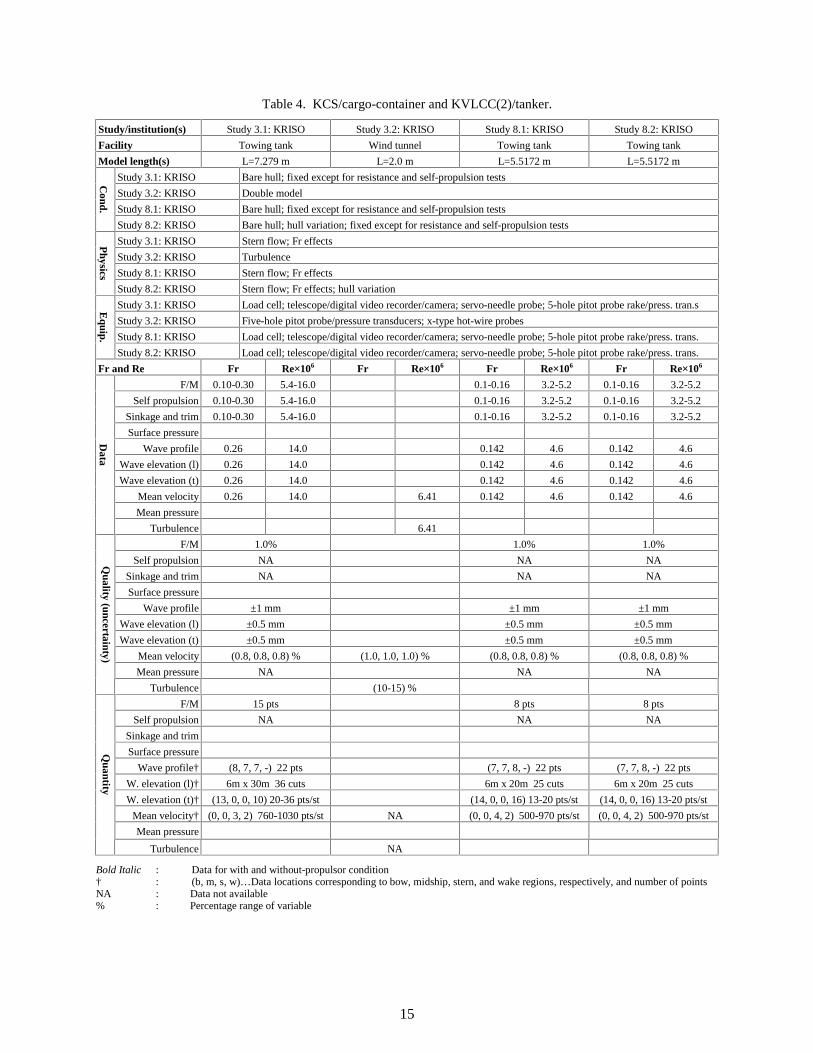
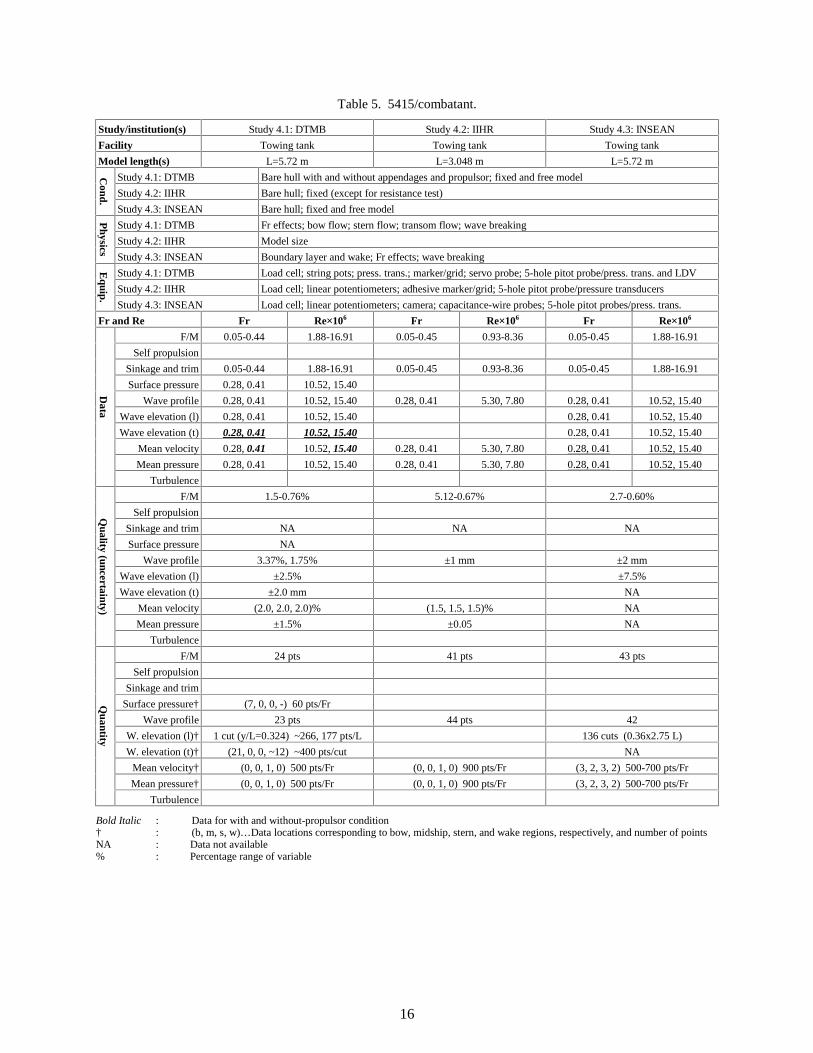
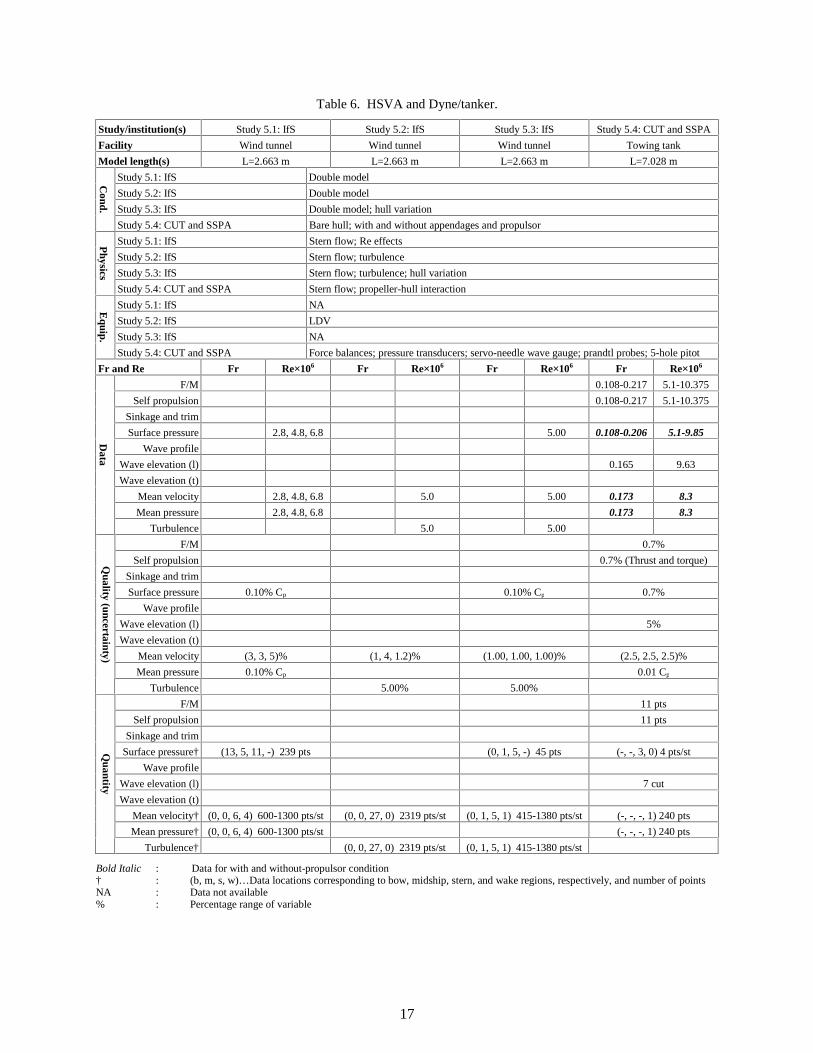
Tables 2-8 provide detailed tables for all the studies and data for S60, HTC, KCS and KVLCC, 5415,HSVA, RM, and DAIOH, respectively. Figures 1-8 provide body plans and bow and stern profiles andrepresentative results for each hull form (in the same order as the summary table 1).
The database for each hull form and geometry is evaluated based on the criteria. Subsequently, past usesare discussed.
CriteriaCargo/container. Data is available for 3 cargo/container geometries (S60, HTC, and KCS). There are 12
studies and 19 references.For the S60, there are 6 studies and 11 references (table 2 and figure 1). The S60 geometry was conceived
to provide systematic information on the design of lines for single-screw merchant ships ca. 1950 with clipper bowand cruiser stern. The parent form, CB=0.6, was designed based on considerations of then successful ship designs.A full account of the original methodical series is provided by (Todd, 1963). Since conception, the S60 has beenused for innumerable experimental studies and the data used extensively as a CFD benchmark. In particular, it wasone of the four hull forms [along with Wigley hull (idealised), ATHENA (combatant), and HSVA] selected for theCooperative Experimental Program (CEP) of the Resistance and Flow Committee of the 17, 18, and 19th ITTC(ITTC, 1984; ITTC, 1987; ITTC, 1990). Subsequent to the CEP, several extensive studies were performed. A widerange of conditions and physics have been investigated. The conditions include, bare hull with and withoutpropeller, model size, fixed and free model, tow point (axial position and height), shallow water, yaw, turbulencestimulation, and double model. The physics are multi-issue and include, model size, fixed and free model, towpoint, facility bias, turbulence stimulation, Re effects and scaling, Fr effects, bow flow, stern flow, propeller-hullinteraction, wave-boundary layer and wake interaction, vortex flow and separation, wave breaking, and turbulence.All studies have detailed documentation, including availability. The quality of data is only partial, except for thetwo most recent studies, which are rigorous. However, most of the data is of relatively small uncertainties. Thequantity of data for most studies is large mapping and dense, which is of relatively high density. No full-scale dataand/or ship exist.
For the HTC, there are 4 studies and 5 references (table 3 and figure 2). The HTC was conceived toprovide data for CFD validation for a relatively modern container ship ca. 1985 with a bulb bow and transom stern,including free-surface effects. Many conditions and physics have been investigated. The conditions include barehull with and without propeller, fixed (velocities, pressure, wave elevation) and free (resistance and propulsion)model, and double model. The physics are comprehensive and include stern flow, Fr effects, propeller-hullinteraction, and turbulence. The documentation is limited, although the data is available. The quality of data ispartial, except the most recent study, which is rigorous. The uncertainties are close to the smallest. The quantity ofdata is partial mapping and coarse, which is of relatively coarse density. Full-scale data and ship exist.
4
For KCS, there are 2 studies and 3 references (table 4 and figure 3). The KCS was conceived to providedata both for explication of flow physics and CFD validation for a modern container ship ca. 1997 with bulb bowand stern. Some of the data is under procurement (as indicated in the tables). The conditions include bare hull andfixed model. The physics are limited and include stern flow and Fr effects. The documentation is partial, althoughthe data is available. The quality is rigorous and the uncertainties are close to the smallest. The quantity is partialmapping and dense, which is of relatively high density. No full-scale data and/or ship exist.
Combatant. Data is available for 1 combatant geometry 5415 (table 5 and figure 4). There are 3 studiesand 5 references, which are currently being conducted under an international collaborative study on EFD/CFD anduncertainty assessment between Iowa Institute of Hydraulic Research (IIHR), Istituto Nazionale per Studi edEsperienze di Architettura Navale (INSEAN), and DTMB (Stern et al., 1998). 5415 was conceived as a preliminarydesign for a surface combatant ca. 1980 with a sonar dome bow and transom stern. About half the data is underprocurement (as indicated in the tables), but should be available by early 1999. Many conditions and physics havebeen investigated. The conditions include bare hull with and without appendages and/or propulsor, fixed and freemodel, and model size. The physics are comprehensive and include model size, facility bias, Re effects, boundarylayer and wake, stern flow, Fr effects, bow flow, transom flow, and wave breaking. All studies have detaileddocumentation, including availability. The quality of data is rigorous and of relatively small uncertainties. Thequantity of data is large mapping and dense, which is of relatively high density. No full-scale data and/or ship exist.
Tanker. Data is available for 4 tanker geometries (HSVA, RM, DAIOH, KVLCC). There are a total of 9studies and 14 references.
For HSVA, there are 4 studies and 7 references (table 6 and figure 5). The origins of the HSVA are notknown. It represents a full-form tanker ca. 1970 with elliptical bow and cruiser stern. As noted earlier, it was one ofthe four hull forms selected for the CEP, although only very limited data was obtained under this program incomparison to the S60. Subsequent to the CEP, several extensive studies were performed. Many conditions andphysics have been investigated. The conditions include bare hull with and without appendages and/or propulsor (forhull-form variation only), hull-form variation, and double model. The physics are comprehensive and include hull-form variation, Re effects, stern flow, turbulence, Fr effects, and propeller-hull interaction. The hull form variation(Dyne) has the same forebody lines as the HSVA, but more U-shaped stern sections in order to create stronger bilgevortices. The documentation is limited, except for the most recent study is detailed, although all the data isapparently available. The quality is partial and the uncertainties are close to the smallest. The quantity is partialmapping and dense, which is of relatively high density. No full-scale data and/or ship exist.
For RM, there are 2 studies and 3 references (table 7 and figure 6). The origins of the RM are not known.It represents a full-form tanker ca. 1970 with a bulb bow and cruiser stern. The conditions include double model.The physics include Re and scale effects, stern flow, and turbulence. The documentation is limited for the earlierstudy and detailed for the latter study, although all the data is apparently available. The quality is none for theearlier study and rigorous with relatively small uncertainties for the latter study. The quantity of data is partialmapping and coarse for the earlier study and partial mapping and dense for the latter study. Full- and intermediate-scale data are available. It is not known whether or not the full-scale ship remains in existence, but seems unlikely.
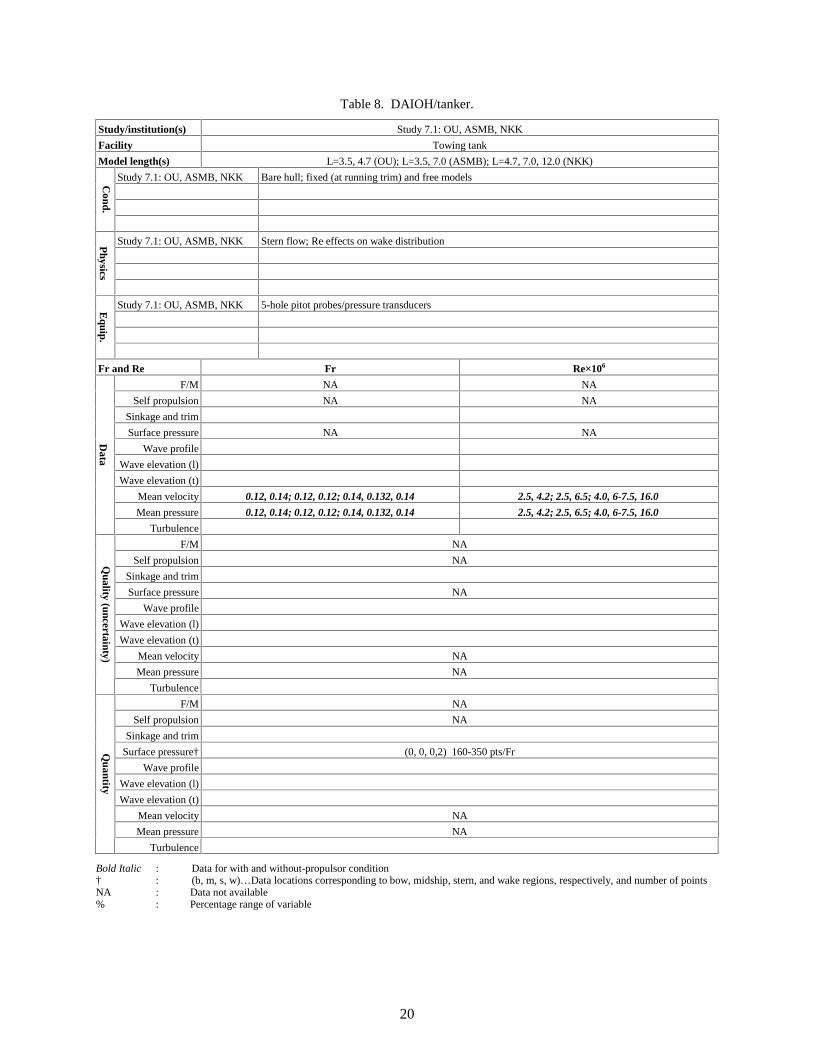
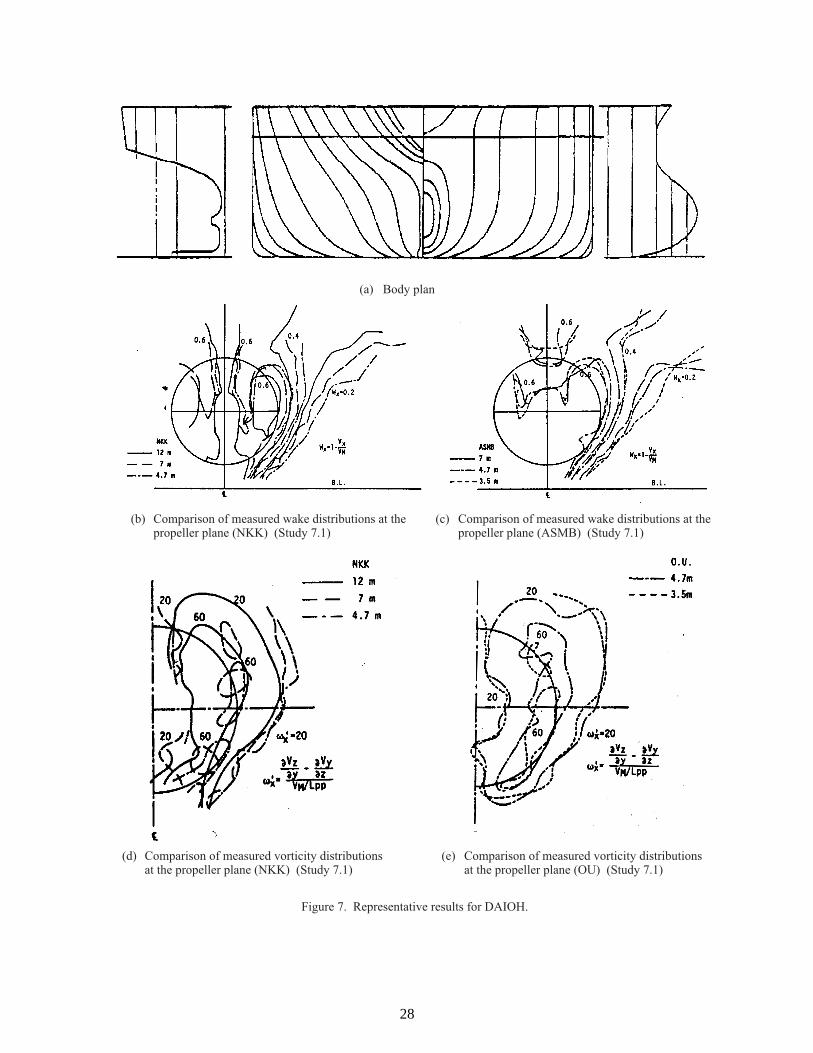
For DAIOH, there are 1 study and 2 references (table 8 and figure 7). DAIOH was conceived as anexperimental full form tanker ca. 1970 with a bulb bow and cruiser stern. The conditions include bare hull with andwithout propeller and model size. The physics include model size, Re and scale effect, stern flow, and propeller-hullinteraction. The documentation is limited, although all the data is apparently available. The quality is none and thequantity is partial mapping and dense. Full-scale data are available for resistance, propulsion, and manoeuvringperformance. It is not known whether or not the full-scale ship remains in existence, but seems unlikely.
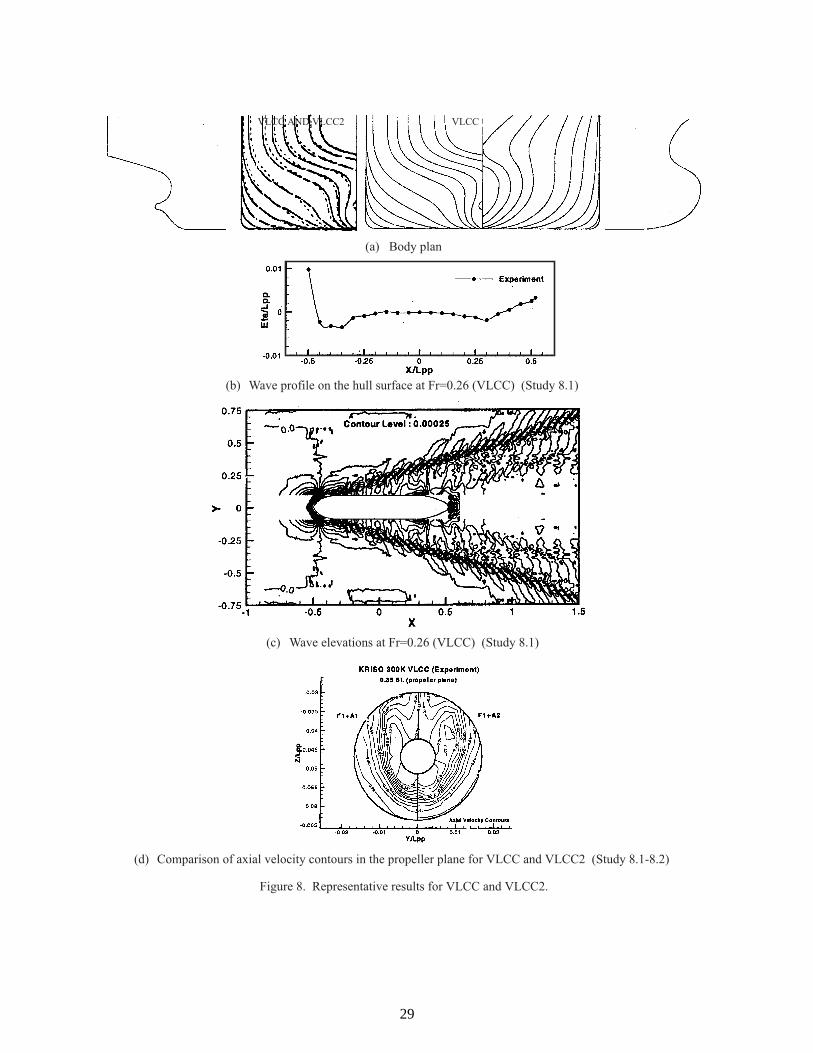
For KVLCC, there are 2 studies and 2 references (table 4 and figure 8). The KVLCC was conceived toprovide data both for explication of flow physics and CFD validation for a modern tanker ship ca. 1997 with bulbbow and stern. Some of the data is under procurement (as indicated in the tables). The conditions include bare hull,hull-form variation, and fixed model. The physics are limited and include hull-form variation, stern flow, and Freffects. The hull-form variation (KVLCC2) has the same forebody lines, but fuller afterbody lines, which createstronger bilge vortices. The documentation is partial, although the data is available. The quality is rigorous and theuncertainties are close to the smallest. The quantity is partial mapping and dense, which is of relatively highdensity. No full-scale data and/or ship exist.
Past usesComputational uncertainty assessment has been the subject of considerable recent discussion, e.g.,
(Coleman and Stern, 1997; Mehta, 1998); nonetheless, consensus is lacking such that currently there are norecommended practices for computational uncertainty assessment, much less standards and guidelines. Hopefully,
5
methods such as (Coleman and Stern, 1997), which are pragmatic in obtaining quantitative estimates for manysimulation uncertainties and include proper consideration to both the experimental and simulation uncertainties inperforming validation, will help in establishment of recommended practices for computational uncertaintyassessment.
The lack of recommended practices for computational uncertainty assessment makes evaluation of past usesdifficult; since, most studies are either lacking or deficient in this regard. This in turn makes discrimination ofresults difficult and moreover is confounded by user variability, which is significantly larger than for experiments.Past uses include partial and complete uses through individual studies and national and international workshops.
The individual studies are too numerous for detailed review, but well represented by recent Proceedings ofthe Office of Naval Research Symposium on Naval Hydrodynamics (Rood, 1996) and the International Conferenceon Numerical Ship Hydrodynamics (Patel and Stern, 1993). Most studies are for S60 and HSVA (and Wigley hull),i.e., the eldest hull forms. Calculations have been performed for many of the conditions and physics. Theconditions include bare hull with and without propulsor, model size, hull-form variation, fixed or free model,straight ahead calm water, waves, and yaw. The physics include design variables for resistance and propulsion(forces and moments, sinkage and trim, wave profile, nominal wake, and self propulsion), geometry effects (modelsize and hull-form variation), facility/experimental method effects (fixed or free model), and many flow phenomena,i.e., Re effects and scaling, boundary layer and wake, stern flow, turbulence, vortex flow and separation, Fr effects,bow flow, transom flow, propeller-hull interaction, and wave-boundary layer and wake interaction. Most studiesmake only partial vs. complete use of the data.
The national and international workshops include Ship Wave-Resistance Computations (Bai and McCarthy,1979; Mori, 1980; Noblesse and McCarthy, 1973), Ship Viscous Flow (Larsson, 1981; Larsson and Ohlsson, 1985;Larsson et al., 1991), Comparative Accuracy of Numerical Kelvin Wake Code Predictions–“Wake-Off”(Lindenmuth et al., 1991), and CFD Workshop Tokyo 1994 (CFD Workshop Tokyo 1994, 1994). The workshopson Ship Wave-Resistance Computations compared inviscid CFD methods and data for the Wigley hull, Inui hull S-201 (idealised), S60, ATHENA, and HSVA hull forms. The comparisons included wave resistance and wave profilewith focus on physics of Fr effects. The workshops on Ship Viscous Flow compared viscous CFD methods and datafor the SSPA model 720 (cargo/container) and HSVA/Dyne hull forms. The comparisons included axial velocitycontours and crossplane vectors for stations in the stern region with focus on physics of hull-form variation, sternflow, and turbulence. The workshop on Comparative Accuracy of Numerical Kelvin Wake Code Predictions–“Wake-Off” compared inviscid CFD methods and data for the QUAPAW (ocean tug) and 5415 hull forms. Thecomparisons included wave profiles and longitudinal elevations with focus on physics of Fr effects. The CFDWorkshop Tokyo 1994 compared inviscid and viscous CFD methods and data for the S60 and HSVA/Dyne hullforms. The comparisons included wave profiles, wave contours, surface pressure and streamlines, and axial velocitycontours and crossplane vectors for stations in the stern region with focus on physics of hull-form variation, Freffects, stern flow, and turbulence.
Although most uses of the data have been selective (i.e., partial vs. complete use of the data), they haveprovided useful assessments of the state-of-the-art of CFD for resistance and propulsion. Complete use of the dataenables a more thorough assessment. In general, the uncertainty assessments are deficient with regard todocumentation of the iterative and grid convergence.
CONCLUSIONS
Considerable model-scale data for surface-ship resistance and propulsion has been procured for explicationof flow physics and CFD validation as a continuing effort. The trend is towards more modern hull forms, but stillthe most extensive data is for the eldest hull forms.
Many conditions and physics have been investigated; nonetheless, there is a continuing need for additionalmodel-scale data to facilitate CFD code development both for modelling (e.g., turbulence, separation and vortices,free-surface boundary conditions, wave breaking, etc.) and numerical methods (e.g., unsteady flow). Suchdevelopments should remove the necessity of distinguishing between the traditional ship hydrodynamics fields ofstudy (i.e., resistance and propulsion, seakeeping, and manoeuvring) enabling extensions for motions, manoeuvring,and environmental conditions.
The documentation varies greatly and is often lacking both with regard to detailed reporting, analysis, andavailability/usability. Recommended practices are needed for archiving and dissemination of data.
The quality of the data is difficult to judge; since, most studies have not rigorously followed experimentaluncertainty assessment methodologies. There is a need to rigorously follow the current standard (AIAA Standard,
6
1995). Additionally, there is a need to establish guidelines, examples, and expected uncertainties for towing-tanktests.
The quantity of the data varies greatly, but is often of limited resolution (i.e., partial mapping and coarseand/or dense). There is a need for increased resolution, i.e., larger mappings and densities.
Very limited full-scale data for surface-ship resistance and propulsion has been procured. There is a needfor full-scale data to facilitate CFD code development for Re effects and scaling and full-scale simulations.
There is no reporting of the use of CFD in the design of the benchmark experiments.Most (if not all) of the data has been used for CFD validation either through individual studies or national
and international workshops; however, the validations are incomplete since most studies are either lacking ordeficient with regard to computational uncertainty assessment. Also, most studies make partial vs. complete use ofthe data. There is a continuing need to fully use the available data, including rigorous application of computationaluncertainty assessment methodologies.
RECOMMENDATIONS
There are 8 general recommendations.(1) Resources should be focused on extensive data procurement for modern hull forms.(2) The conditions and physics should be extended to facilitate CFD code developments for unsteady flow,
turbulence, wave breaking, and separation and vortices.(3) Detailed documentation should always be provided, including detailed reporting of the geometry, conditions,
and experimental methods; analysis of the data with regard to the physics of interest; and availability/usability.(4) The quality of data should be reported through rigorous application of current standards for experimental
uncertainty assessment methodology (AIAA Standard 1995).(5) The quantity of data should be sufficient for resolution of the flow physics of interest.(6) Full-scale tests should be planned and data procured to facilitate CFD code development for Re effects and
scaling and full-scale simulations.(7) CFD should be used complementarily in planning and guiding both model- and full-scale experiments.(8) The available data should be fully used, including rigorous application of computational uncertainty assessment
methodologies.There are 6 recommendations for the ITTC.
(1) The current database (table 1) should be adopted by the ITTC as recommended benchmarks for CFD validationfor Resistance and Propulsion.
(2) The Resistance Committee should provide recommended practices for archiving and dissemination ofbenchmark data.
(3) The Resistance Committee should provide guidelines for application of current standards for experimentaluncertainty assessment methodology (AIAA Standard, 1995) for towing-tank tests, including examples andexpected accuracies.
(4) The Resistance Committee should provide recommendations for full-scale experiments for CFD validation.(5) The Resistance Committee should provide full-scale estimates and uncertainties for resistance and propulsion
for the benchmarks selected for the Gothenburg 2000 Workshop to enable partial validation of full-scalesimulations.
(6) The Resistance Committee should provide recommended practices for CFD uncertainty assessment.There are 4 recommendations for the Gothenburg 2000 Workshop.
(1) The Gothenburg 2000 CFD Workshop should focus on validation of RANS codes for cargo/container,combatant, and tanker hull forms.
(2) The conditions and physics should focus on hull-form variation, boundary layer and wake, stern flow,turbulence, Fr effects, propeller-hull interaction, and full-scale simulations.
(3) Based on the currently available data, the HTC, 5415, and HSVA/Dyne are the recommended benchmarks.However, in the event that additional experiments are planned and data procured and be available by early 1999for the KCS and/or KVLCC/KVLCC2 for turbulence and propeller-hull interaction, then the KCS and/orKVLCC/KVLCC2 are the recommended benchmarks, instead of HTC and HSVA/Dyne, respectively.
(4) The participants and workshop comparisons/validations should follow CFD uncertainty assessmentmethodologies as recommended by the ITTC.
7
ACKNOWLEDGEMENTS
This research was done in conjunction with the 22nd ITTC Resistance and Flow Committee. The first twoauthors were partially supported by the Office of Naval Research under Grant N00014-96-1-0018 under theadministration of Dr. E. P. Rood.
REFERENCES
AIAA Standard, 1995, “Assessment of Wind Tunnel Data Uncertainty,” AIAA S-071-1995, Washington D.C.Avanzini, G., Benedetti, L., and Penna, R., 1998, “Experimental Evaluation of Ship Resistance for RANS Code
Validation,” ISOPE '98, Montreal, Canada, Maggio.Bai, K.J. and McCarthy, J.H., (editors), 1979, Proceedings of the Workshop on Ship Wave-Resistance Computations,
Vol. 1 and 2, DTNSRDC.Bertram, V., Chao, K.Y., Lammers, G., and Laudan J., 1994, “Experimental Validation Data of Free-Surface Flows
for Cargo Vessels,” Proceedings of CFD Workshop Tokyo 1994, 1994, Vol. 1, pp. 311-320.Bertram, V., Chao, K.Y., Lammers, G., and Laudan J., 1992, “Development and Verification of Numerical Methods
for Power Prediction,” HSVA Rept. 1579 (in German).CFD Workshop Tokyo 1994, 1994, Vol. 1 and 2, 1994, Ship Research Institute Ministry of Transport Ship & Ocean
Foundation.Coleman, H.W. and Stern, F., 1997, “Uncertainties and CFD Code Validation,” Journal of Fluids Engineering, Vol.
119, pp. 795-803.Denker, J., Knaack, T., and Kux, J., 1992, “Experimental and Numerical Investigations of HSVA-Tanker 2 Flow
Field,” Institute of Shipbuilding (IfS) Rept. 521, Uni. Hamburg.Dyne, G., 1995, “An Experimental Investigation of the Tanker Model “Dyne” in a Towing Tank,” Chalmers
University of Technology Rept. CHA/NAVR/-95/0036.Fry, D.J. and Kim, Y.H., 1985, “Bow Flow Field of Surface Ships,” Proceedings of the 15th ONR Symposium on
Naval Hydrodynamics, Hamburg, pp. 319-346.Garofallidis, D. A., 1996, “ Experimental and Numerical Investigation of the Flow around a Ship Model At Various
Froude Numbers Part II: Uncertainty Analysis for Measurements,” PhD Thesis, Dept. Of Naval Architectureand Marine Engineering, National Technical University of Athens.
Gietz, U. and Kux, J., 1995, “Flow Investigations on the Hamburg Test Case Model in the Wind Tunnel,” Instituteof Shipbuilding (Ifs) Rept. 550, Uni. Hamburg (in German).
Hoffmann, H.P., 1976, “Investigation of 3-Dimensional Turbulent Boundary Layer on a Ship Double Model inWind Tunnel,” Institute of Shipbuilding (IfS) Rept. 343, Uni. Hamburg (in German).
ITTC, 1984, “Report of the Resistance and Flow Committee,” 17th International Towing Tank Conference,Goteborg, Sweden, pp. 75-138.
ITTC, 1987, “Report of the Resistance and Flow Committee,” 18th International Towing Tank Conference, KobeJapan, pp. 47-95.
ITTC, 1990, “Report of the Resistance and Flow Committee,” 19th International Towing Tank Conference, Madrid,Spain, pp. 55-107.
ITTC, 1996 “Report of the Resistance and Flow Committee,” 21st International Towing Tank Conference,Trondheim, Norway, pp. 439-514.
Kasahara, Y., 1985, “An Experimental Investigation of the Scale Effect on Nominal and Effective WakeDistribution Using Geosim Models of Two Different Ships,” Proceedings 1st Osaka International Colloquiumon Ship Viscous Flow, Osaka, Japan, pp. 432-449.
Knaack, T., 1984, “Laser Doppler Velocimetry Measurements on a Ship Model in Wind Tunnel,” Institute ofShipbuilding (IfS) Rept. 439, Uni. Hamburg (in German).
Knaack, T., 1990, “LDV-Measurements of Reynolds-Stresses in Wake of a Ship Model in Wind Tunnel,” Instituteof Shipbuilding (IfS) Rept. 499, Uni. Hamburg (in German).
Knaack, T., 1992, “Investigation of Structure of Reynolds Tensor Fields in a Three-Dimensional Flow,” Institute ofShipbuilding (IfS) Rept. 527, Uni. Hamburg (in German).
Lammers, G., Laudan, J., and Strohrmann, H., 1989, “Correlation of Wake and Cavitation and their Consequences,”HSVA Rept. 1565 (in German).
Larsson, L. and Ohlsson, C.S., (editors), 1985, Proceedings Second International Symposium on Ship ViscousResistance, SSPA, Gothenburg, Sweden.
Larsson, L., Patel, V.C., and Dyne, G., (editors), 1991, Proceedings of 1990 SSPA-CHT-IIHR Workshop, FlowtechInternational AB, Research Report No. 2, Gothenburg, Sweden.
Lee, J., Lee, S.J., and Van, S.H., 1998, “Wind Tunnel Test on a Double Deck Shaped Ship Model,” 3rd InternationalConference on Hydrodynamics, Seoul, Korea.
Lindenmuth, W.T., Ratcliffe, T.J., and Reed, A.M., 1991, “Comparative Accuracy of Numerical Kelvin Wake CodePrediction - Wake-Off,” DTMB Rept. DTRC-91/004, David Taylor Research Center, Bethesda, MD.
Longo, J., Stern, F., and Toda, Y., 1993, “Mean-Flow Measurements in the Boundary Layer and Wake and WaveField of a Series 60 CB=0.60 Ship Model - Part 2: Scale Effects on Near-Field Wave Patterns and Comparisonswith Inviscid Theory,” Journal of Ship Research, Vol. 37, No. 1, pp. 16-24.
Longo, J. and Stern, F., 1996a, “Technical Note: Evaluation of Surface-Ship Resistance and Propulsion Model-ScaleDatabase for CFD Validation,” Journal of Ship Research, Vol. 40, No. 2, pp. 112-116.
Longo, J. and F. Stern, 1996b, “Yaw effects on model-scale ship flows,” Proceedings of the 21st ONR Symposiumon Naval Hydrodynamics, Trondheim, Norway, pp. 312-327.
Longo, J. and Stern, F., 1999, “Resistance, Sinkage and Trim, Wave Profile, and Nominal Wake and UncertaintyAssessment for DTMB Model 5512,” Proceedings 25th ATTC, Iowa City, IA.
Lundgren, H. and Ahman, M., G., 1994, “Experimentell och numerisk bestamning av vagmotstand for ett tankfartyg(Dyne tankern),” Chalmers University of Technology Rept. X-94/58 (in Swedish).
Marvin, J.G., 1995, “Dryden Lectureship in Research: Perspectives on Computational Fluid Dynamics Validation,”AIAA Journal, Vol. 33, No. 10, pp. 1778-1787.
Mori, K., (editor), 1980, Proceedings of the Continued Workshop on Ship Wave-Resistance Computations, Facultyof Engineering Hiroshima University.
Noblesse, F. and McCarthy, J.H., (editors), 1973, Proceedings of the Second DTNSRDC Workshop on Ship Wave-Resistance Computations, Vol. 1 and 2, DTMB.
Ogiwara, S., 1994, “Stern Flow Measurements for the Tanker 'Ryuko-Maru' in Model Scale, Intermediate Scale, andFull Scale Ships,” Proceedings of CFD Workshop Tokyo 1994, Vol. 1, pp. 341-349.
Ogiwara, S. and Kajitani, H., 1994, “Pressure Distribution on the Hull Surface of Series 60 (CB=0.60) Model,”Proceedings of CFD Workshop Tokyo, Vol. 1, pp. 350-358.
Olivieri, A. M. Penna, R., 1999, “Suncertainty Assessment in Wave Elevation Measurements,” ISOPE '99, Brest,France, (to be presented).
Patel, V.C. and Stern, F., 1993, Proceedings 6th International Conference on Numerical Ship Hydrodynamics,National Academy Press, Washington D.C., Iowa City, Iowa.
Ratcliffe, T., 1998, http://www50.dt.navy.mil/5415/.Rood, E. P. (editor), 1996, Proceedings 21st Symposium on Naval Hydrodynamics, National Academy Press,
Washington D.C., Trondheim, Norway.Stern, F., Longo, J., Penna, R., Avanzini, G., Benedetti, L., Olivieri, A., T. Ratcliffe, and H. Coleman 1998,
“International Collaboration on Steady-Flow Tests and Uncertainty Assessment for Ship Models DTMB 5415and 5512 and INSEAN 2340,” IIHR Rept. (in preparation).
Suzuki, H., Miyazaki, S., Suzuki, T., and Matsumura, K., 1998a, “Turbulence Measurements in Stern Flow Field ofTwo Ship Models,” Proceedings 3rd Osaka Colloquium on Advanced CFD Applications to Ship Flow and HullForm Design, Osaka, Japan.
Suzuki, H., Suzuki, T., and Miyazaki, S., 1998b, “Turbulence Measurements in Stern Flow Field of a Ship Model–Series 60, CB=0.60–,” Journal of Kansai Society of Naval Architects, No. 227, pp. 29-40 (in Japanese).
Suzuki, H., Suzuki, T., Miyazaki, S. and Matsumura, K., 1998c, “Turbulence Measurements in Stern Flow Field ofTwo Ship Models–Ryuko-Maru and Hamburg Test Case–,” Proceedings of the Kansai Society of NavalArchitects, No. 10, pp. 1-4.
Tanaka, I., Suzuki, T., Himeno, Y., Takahei, T., Tsuda, T., Sakao, M., Yamazaki, Y., Kasahara, Y., and Takagi, M.,1984, “Investigation of Scale Effects on Wake Distribution Using Geosim Models,” J. Kansai Soc. N.A., Japan,No. 192, pp. 103-120.
Toda, Y., Stern, F., Tanaka, I., and Patel, V.C., 1990, “Mean-Flow Measurements in the Boundary Layer and Wakeof a Series 60 CB=0.60 Model Ship With and Without Propeller,” Journal of Ship Research, Vol. 34, No. 4, pp.225-252.
Toda, Y., Stern, F., and Longo, J., 1992, “Mean-Flow Measurements in the Boundary Layer and Wake and WaveField of a Series 60 CB=0.60 Ship Model - Part 1: Froude Numbers 0.16 and 0.316,” Journal of Ship Research,Vol. 36, No. 4, pp. 360-377.
9
Todd, F.H., 1963, “Series 60 Methodical Experiments with Models of Single-Screw Merchant Ships,” David TaylorModel Basin Report 1712,.
Van, S.H., Yim, G.T., Kim, W.J., Kim, D.H., Yoon, H.S., and Eom, J.Y., 1997, “Measurement of Flows Around a3600TEU Container Ship Model,” Proceedings of the Annual Autumn Meeting, SNAK, Seoul, pp. 300-304 (inKorean).
Van, S.H., Kim W.J., Kim, D.H., Yim, G.T., Lee, C.J., and Eom, J.Y., 1998a, “Flow Measurement Around a 300KVLCC Model,” Proceedings of the Annual Spring Meeting, SNAK, Ulsan, pp. 185-188.
Van, S.H., Kim, W.J., Yim, G.T., Kim, D.H., and Lee, C.J., 1998b, “Experimental Investigation of the FlowCharacteristics Around Practical Hull Forms,” Proceedings 3rd Osaka Colloquium on Advanced CFDApplications to Ship Flow and Hull Form Design, Osaka, Japan.
10
Table 1. Benchmark database for CFD validation for resistance and propulsion.
Facility, propulsor, and data →
↓ Database entry ↓
Facility
Propulsor
F/M
Self propulsion
Sinkage and trim
Surface pressure
Wave profile
Wave elevation (I)
Wave elevation (t)
Mean velocity
Mean pressure
Turbulence
Cargo-container
Series 60 CB=0.600 (S60)
Full-scale ship does not exist1.1 Cooperative Experimental Program
ITTC (1984, 1987, 1990) tt, wc wo ¥ ¥ ¥ ¥ ¥
Fry and Kim (1985) tt wo ¥ ¥ ¥
Ogiwara and Kajitani (1994) tt wo ¥ ¥ ¥ ¥
1.2 Osaka University & Iowa Institute of Hydraulic ResearchToda et al. (1990) tt w, wo ¥ ¥ ¥ ¥ ¥ ¥
1.3 Iowa Institute of Hydraulic ResearchToda et al. (1992); Longo et al. (1993) tt wo ¥ ¥ ¥ ¥ ¥ ¥
1.4 Iowa Institute of Hydraulic ResearchLongo and Stern (1996) tt wo ¥ ¥ ¥ ¥ ¥ ¥ ¥
1.5 National Technical University of AthensGarofallidis (1996) tt wo ¥ ¥ ¥ ¥ ¥ ¥ ¥
1.6 Osaka UniversitySuzuki et al. (1998a) wt wo ¥ ¥
Hamburg Test Case CB=0.645 (HTC)Full-scale ship exists
2.1 HSVALammers et al. (1989) s w ¥
2.2 HSVABertram et al. (1992)Bertram et al. (1994) tt w, wo ¥ ¥ ¥ ¥ ¥ ¥ ¥ ¥ ¥
2.3 University of HamburgGietz and Kux (1995) wt wo ¥ ¥
2.4 Osaka University
Suzuki et al. (1998b) wt wo ¥ ¥
KRISO 3600 TEU CB=0.651 (KCS)Full-scale ship does not exist
3.1 Korean Research Institute of Ships & Ocean EngineeringVan et al. (1997)Van et al. (1998b) tt w, wo ¥ ¥ ¥ ¥ ¥ ¥ ¥ ¥ ¥
3.2 Pohang University of Science and TechnologyLee et al. (1998) wt wo ¥ ¥
Combatant
DTMB model 5415 CB=0.506 (5415)Full-scale ship does not exist
4.1 David Taylor Model Basin
Fry and Kim (1985)Ratcliffe (1998) tt w, wo ¥ ¥ ¥ ¥ ¥ ¥ ¥ ¥ ¥
4.2 Iowa Institute of Hydraulic ResearchLongo and Stern (1999) tt wo ¥ ¥ ¥ ¥ ¥
4.3 INSEANAvanzini et al. (1998)Olivieri and Penna (1999) tt wo ¥ ¥ ¥ ¥ ¥ ¥ ¥ ¥
11
Facility, propulsor, and data →
↓ Database entry ↓
Facility
Propulsor
F/M
Self propulsion
Sinkage and trim
Surface pressure
Wave profile
Wave elevation (I)
Wave elevation (t)
Mean velocity
Mean pressure
Turbulence
Tanker
HSVA CB=0.850 (HSVA)Full-scale ship does not exist
5.1 University of HamburgHoffmann (1976)
wt wo ¥ ¥
5.2 University of HamburgKnaack (1984)Knaack (1990) wt wo ¥ ¥
Hull-form variation Dyne tanker CB=0.850 (Dyne)
5.3 University of HamburgDenker et al. (1992)Knaack (1992) wt wo ¥ ¥
5.4 Chalmers University of TechnologyLundgren and Åhman (1994)Dyne (1995)
tttt
wow, wo ¥ ¥ ¥ ¥ ¥
Ryuko-Maru CB=0.830 (RM)Full-scale ship does not exist
6.1 Ishikawajima-Harima Heavy Industries Co., Ltd.Ogiwara (1994) s, tt w, wo ¥ ¥ ¥
6.2 Osaka UniversitySuzuki et al. (1998b)Suzuki et al. (1998c) wt wo ¥ ¥
DAIOH CB=0.837 (DAIOH)Full-scale ship does not exist
7.1 Osaka University, Akashi Ship Model Basin, and Nippon Kokan K. K.
Tanaka et al. (1984)Kasahara (1985) s, tt w, wo ¥ ¥ ¥ ¥ ¥
KRISO 300K VLCC CB=0.810 (KVLCC)Full-scale ship does not exist
8.1 Korea Research Institute of Ships & Ocean EngineeringVan et al. (1998a)Van et al. (1998b) tt w, wo ¥ ¥ ¥ ¥ ¥ ¥ ¥ ¥ ¥
Hull-form variation VLCC2 CB=0.810 (KVLCC2)
8.2 Korea Research Institute of Ships & Ocean EngineeringNo reference available tt w, wo ¥ ¥ ¥ ¥ ¥ ¥ ¥ ¥ ¥
tt, wt, wc, s : Towing tank, wind tunnel, water channel, and sea, respectivelyw, wo : With and without, respectively¥ : Data available¥ : Data under procurementNA : Data not available% : Percentage range of variable
12
Table 2a. Series 60 CB=0.60/cargo-container.
Study/institution(s) Study 1.1: Multiple (ITTC) Study 1.1: DTMB Study 1.1: UT, IHI, NKK Study 1.2: OU, IIHR
Facility Towing tank Towing tank Towing tank Towing tank
Model length(s) L=1.8-10.0 m L= 6.1 m L= 2.5, 4.0, 10.0 m L=4.0 m
Study 1.1: Multiple (ITTC) Bare hull; model size; fixed and free model; tow point (axial and vertical position); shallow water
Study 1.1: DTMB Bare hull
Study 1.1: UT, IHI, NKK Bare hull; fixed and free model; model size
Cond.
Study 1.2: OU, IIHR Bare hull; fixed (except resistance and self-propulsion tests); with and without propeller
Study 1.1: Multiple (ITTC) Model size; fixed and free model; tow point; facility bias; Re effects; Fr effects
Study 1.1: DTMB Bow flow
Study 1.1: UT, IHI, NKK Bare hull; model size; fixed and free model; Fr effects; Re effects
Physics
Study 1.2: OU, IIHR Stern flow; propeller-hull interaction
Study 1.1: Multiple (ITTC) Dynamometer; pressure transducers; 35-mm photography
Study 1.1: DTMB Cameras; ultrasonic probes and point gages; 3D LDV system
Study 1.1: UT, IHI, NKK NA; NA; pressure transducers; NA
Bold Italic : Data for with and without-propulsor condition† : (b, m, s, w)…Data locations corresponding to bow, midship, stern, and wake regions, respectively, and number of pointsNA : Data not available% : Percentage range of variable
13
Table 2b. Series 60 CB=0.60/cargo-container.
Study/institution(s) Study 1.3: IIHR Study 1.4: IIHR Study 1.5: NTUA Study 1.6: OU
Facility Towing tank Towing tank Towing tank Wind tunnel
Model length(s) L=3.048 m L=3.048 m L=3.048 m L=3.0 m
Study 1.3: IIHR Bare hull; fixed (except resistance tests)
Study 1.4: IIHR Bare hull; fixed (except forces, moment, sinkage, trim, and heel angle tests); yaw
Study 1.5: NTUA Bare hull; turbulence stimulation
Cond.
Study 1.6: OU Double model
Study 1.3: IIHR Boundary layer and wake; Fr effects; wave-boundary layer and wake interaction
Study 1.4: IIHR Boundary layer and wake; Fr effects; vortex flow and separation; wave breaking
Study 1.5: NTUA Boundary layer and wake; Fr effects; turbulence stimulation
Bold Italic : Data for with and without-propulsor condition† : (b, m, s, w)…Data locations corresponding to bow, midship, stern, and wake regions, respectively, and number of pointsNA : Data not available% : Percentage range of variable
14
Table 3. Hamburg Test Case/cargo-container.
Study/institution(s) Study 2.1: HSVA Study 2.2: HSVA Study 2.3: IfS Study 2.4: OU
Facility Sea Towing tank Wind tunnel Wind tunnel
Model length(s) L=157.7 m L=6.404 m L=2.69 m L=3.0 m
Study 2.1: HSVA Full scale
Study 2.2: HSVA Bare hull with and without propeller; fixed and free model
Study 2.3: IfS Double model
Cond.
Study 2.4: OU Double model
Study 2.1: HSVA Stern flow; Re effects and scaling
Study 2.2: HSVA Stern flow; Fr effects; propeller-hull interaction; Cth=0.617 and 1.248 for Fr=0.238 and 0.31, respectively
Study 2.3: IfS Stern flow; turbulence
Physics
Study 2.4: OU Stern flow; turbulence
Study 2.1: HSVA NA
Study 2.2: HSVA Load cell; manometer; 35-mm camera; resistance probes; 3D LDV system
Study 2.3: IfS NA
Equip.
Study 2.4: OU Triple-sensor hot wire system
Fr and Re Fr Re×106 Fr Re×106 Fr Re×106 Fr Re×106
F/M 0.024-0.275 1.18-13.6
Self propulsion 0.1-0.3 4.52-13.5
Sinkage and trim 0.0989-0.31 4.47-14.0
Surface pressure 0.207, 0.238,
0.31
9.35, 10.7,
14.0
5.0
Wave profile 0.2492 11.3
Wave elevation (l) 0.185, 0.207,
0.238, 0.28,
0.31
8.35, 9.35,
10.7, 12.6,
14.0
Wave elevation (t)
Mean velocity 0.2354 1635.41 0.238, 0.308 10.7, 13.9 5.0 3.7
Bold Italic : Data for with and without-propulsor condition† : (b, m, s, w)…Data locations corresponding to bow, midship, stern, and wake regions, respectively, and number of pointsNA : Data not available% : Percentage range of variable
15
Table 4. KCS/cargo-container and KVLCC(2)/tanker.
Study/institution(s) Study 3.1: KRISO Study 3.2: KRISO Study 8.1: KRISO Study 8.2: KRISO
Facility Towing tank Wind tunnel Towing tank Towing tank
Model length(s) L=7.279 m L=2.0 m L=5.5172 m L=5.5172 m
Study 3.1: KRISO Bare hull; fixed except for resistance and self-propulsion tests
Study 3.2: KRISO Double model
Study 8.1: KRISO Bare hull; fixed except for resistance and self-propulsion tests
Cond.
Study 8.2: KRISO Bare hull; hull variation; fixed except for resistance and self-propulsion tests
Study 3.1: KRISO Stern flow; Fr effects
Study 3.2: KRISO Turbulence
Study 8.1: KRISO Stern flow; Fr effects
Physics
Study 8.2: KRISO Stern flow; Fr effects; hull variation
Study 3.1: KRISO Load cell; telescope/digital video recorder/camera; servo-needle probe; 5-hole pitot probe rake/press. tran.s
Study 3.2: KRISO Five-hole pitot probe/pressure transducers; x-type hot-wire probes
Study 8.1: KRISO Load cell; telescope/digital video recorder/camera; servo-needle probe; 5-hole pitot probe rake/press. trans.
Equip.
Study 8.2: KRISO Load cell; telescope/digital video recorder/camera; servo-needle probe; 5-hole pitot probe rake/press. trans.
Bold Italic : Data for with and without-propulsor condition† : (b, m, s, w)…Data locations corresponding to bow, midship, stern, and wake regions, respectively, and number of pointsNA : Data not available% : Percentage range of variable
16
Table 5. 5415/combatant.
Study/institution(s) Study 4.1: DTMB Study 4.2: IIHR Study 4.3: INSEAN
Facility Towing tank Towing tank Towing tank
Model length(s) L=5.72 m L=3.048 m L=5.72 m
Study 4.1: DTMB Bare hull with and without appendages and propulsor; fixed and free model
Study 4.2: IIHR Bare hull; fixed (except for resistance test)
Bold Italic : Data for with and without-propulsor condition† : (b, m, s, w)…Data locations corresponding to bow, midship, stern, and wake regions, respectively, and number of pointsNA : Data not available% : Percentage range of variable
17
Table 6. HSVA and Dyne/tanker.
Study/institution(s) Study 5.1: IfS Study 5.2: IfS Study 5.3: IfS Study 5.4: CUT and SSPA
Facility Wind tunnel Wind tunnel Wind tunnel Towing tank
Model length(s) L=2.663 m L=2.663 m L=2.663 m L=7.028 m
Study 5.1: IfS Double model
Study 5.2: IfS Double model
Study 5.3: IfS Double model; hull variation
Cond.
Study 5.4: CUT and SSPA Bare hull; with and without appendages and propulsor
Study 5.1: IfS Stern flow; Re effects
Study 5.2: IfS Stern flow; turbulence
Study 5.3: IfS Stern flow; turbulence; hull variation
Physics
Study 5.4: CUT and SSPA Stern flow; propeller-hull interaction
Study 5.1: IfS NA
Study 5.2: IfS LDV
Study 5.3: IfS NA
Equip.
Study 5.4: CUT and SSPA Force balances; pressure transducers; servo-needle wave gauge; prandtl probes; 5-hole pitot
Bold Italic : Data for with and without-propulsor condition† : (b, m, s, w)…Data locations corresponding to bow, midship, stern, and wake regions, respectively, and number of pointsNA : Data not available% : Percentage range of variable
18
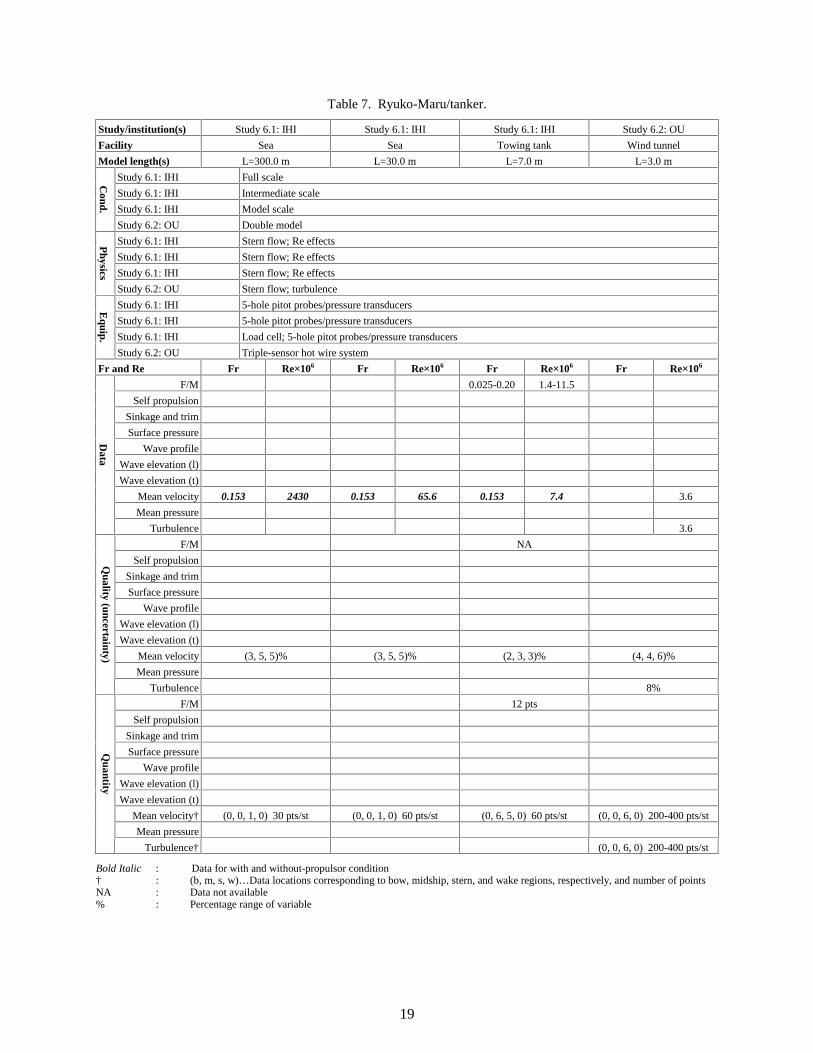
Table 7. Ryuko-Maru/tanker.
Study/institution(s) Study 6.1: IHI Study 6.1: IHI Study 6.1: IHI Study 6.2: OU
Facility Sea Sea Towing tank Wind tunnel
Model length(s) L=300.0 m L=30.0 m L=7.0 m L=3.0 m
Study 6.1: IHI Full scale
Study 6.1: IHI Intermediate scale
Study 6.1: IHI Model scale
Cond.
Study 6.2: OU Double model
Study 6.1: IHI Stern flow; Re effects
Study 6.1: IHI Stern flow; Re effects
Study 6.1: IHI Stern flow; Re effects
Physics
Study 6.2: OU Stern flow; turbulence
Study 6.1: IHI 5-hole pitot probes/pressure transducers
Study 6.1: IHI 5-hole pitot probes/pressure transducers
Study 6.1: IHI Load cell; 5-hole pitot probes/pressure transducers
Bold Italic : Data for with and without-propulsor condition† : (b, m, s, w)…Data locations corresponding to bow, midship, stern, and wake regions, respectively, and number of pointsNA : Data not available% : Percentage range of variable
19
Table 7. Ryuko-Maru/tanker.
Study/institution(s) Study 6.1: IHI Study 6.1: IHI Study 6.1: IHI Study 6.2: OU
Facility Sea Sea Towing tank Wind tunnel
Model length(s) L=300.0 m L=30.0 m L=7.0 m L=3.0 m
Study 6.1: IHI Full scale
Study 6.1: IHI Intermediate scale
Study 6.1: IHI Model scale
Cond.
Study 6.2: OU Double model
Study 6.1: IHI Stern flow; Re effects
Study 6.1: IHI Stern flow; Re effects
Study 6.1: IHI Stern flow; Re effects
Physics
Study 6.2: OU Stern flow; turbulence
Study 6.1: IHI 5-hole pitot probes/pressure transducers
Study 6.1: IHI 5-hole pitot probes/pressure transducers
Study 6.1: IHI Load cell; 5-hole pitot probes/pressure transducers
Bold Italic : Data for with and without-propulsor condition† : (b, m, s, w)…Data locations corresponding to bow, midship, stern, and wake regions, respectively, and number of pointsNA : Data not available% : Percentage range of variable
Bold Italic : Data for with and without-propulsor condition† : (b, m, s, w)…Data locations corresponding to bow, midship, stern, and wake regions, respectively, and number of pointsNA : Data not available% : Percentage range of variable
21
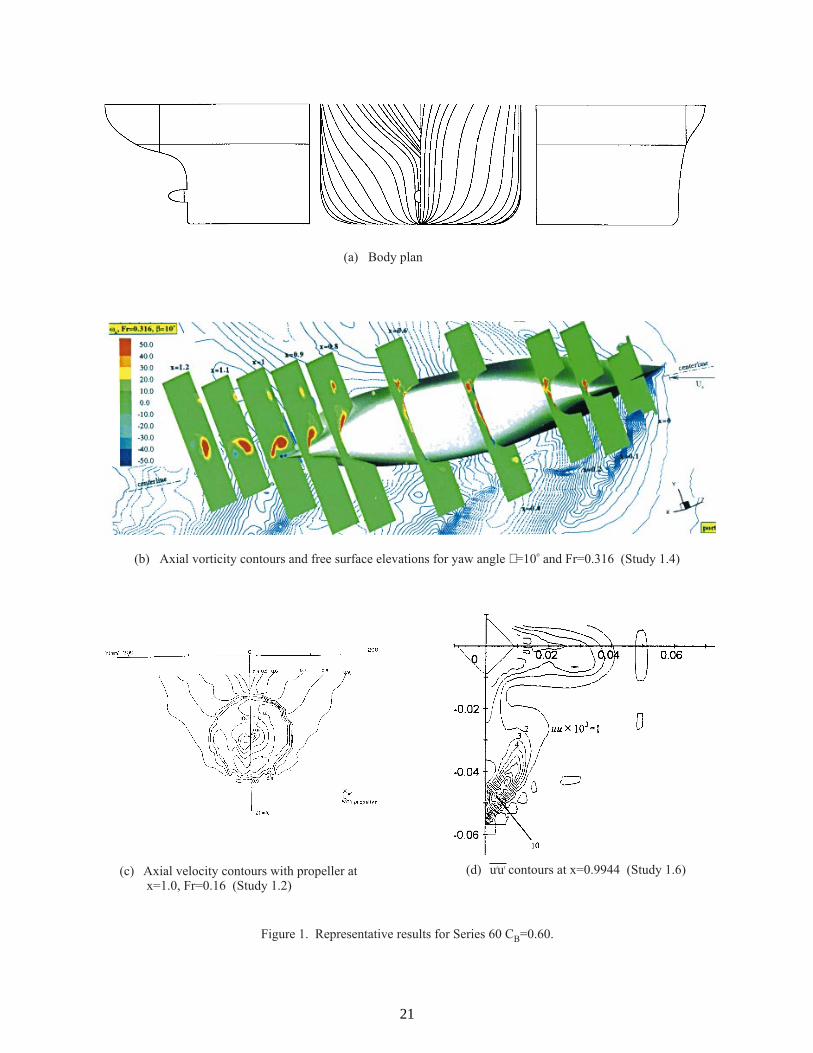
(a) Body plan
(b) Axial vorticity contours and free surface elevations for yaw angle =10 and Fr=0.316 (Study 1.4)b o
Figure 1. Representative results for Series 60 C =0.60.B
(c) Axial velocity contours with propeller atx=1.0, Fr=0.16 (Study 1.2)
(d) uu contours at x=0.9944 (Study 1.6)l l
22
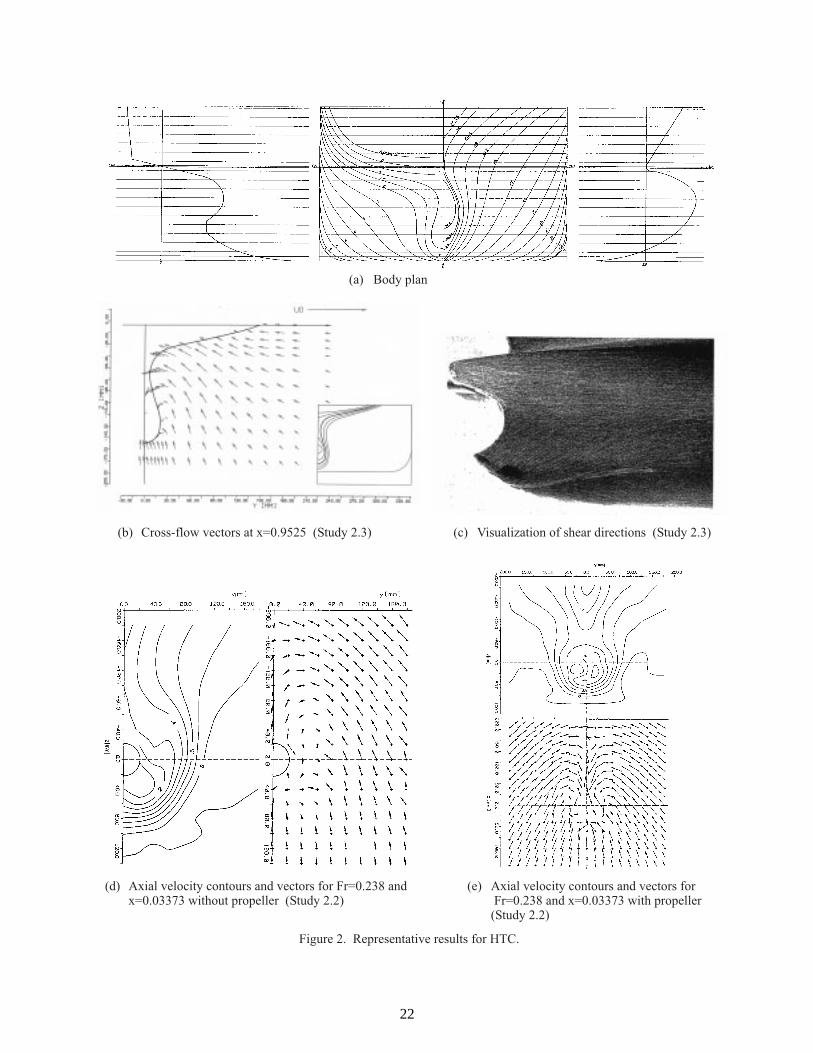
(a) Body plan
Figure 2. Representative results for HTC.
(d) Axial velocity contours and vectors for Fr=0.238 andx=0.03373 without propeller (Study 2.2)
(b) Cross-flow vectors at x=0.9525 (Study 2.3)
(e) Axial velocity contours and vectors forFr=0.238 and x=0.03373 with propeller(Study 2.2)
(c) Visualization of shear directions (Study 2.3)
23
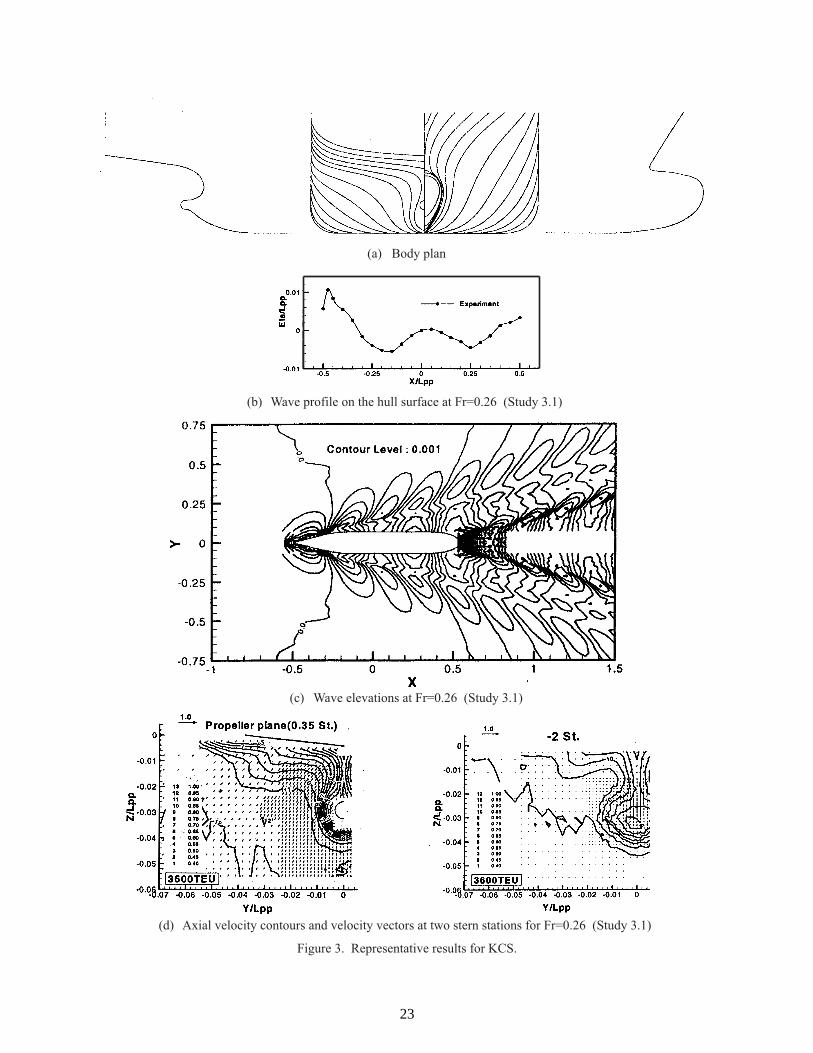
(a) Body plan
Figure 3. Representative results for KCS.
(d) Axial velocity contours and velocity vectors at two stern stations for Fr=0.26 (Study 3.1)
(b) Wave profile on the hull surface at Fr=0.26 (Study 3.1)
(c) Wave elevations at Fr=0.26 (Study 3.1)
24
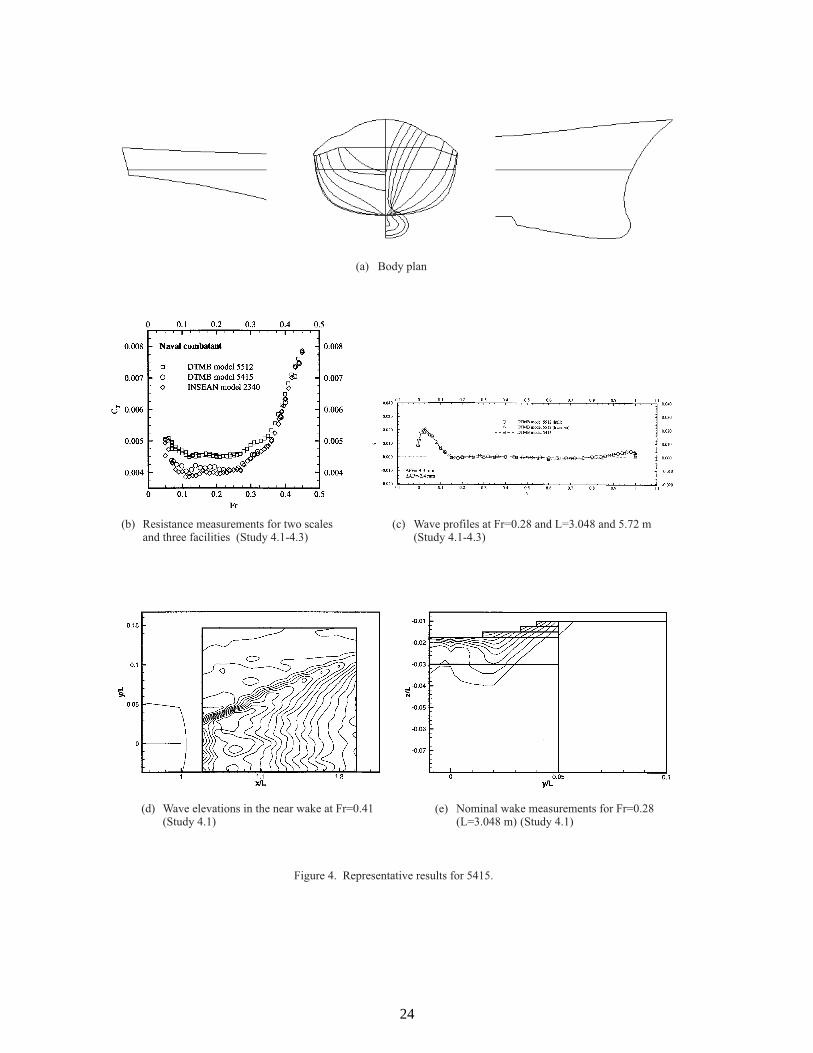
(b) Resistance measurements for two scalesand three facilities (Study 4.1-4.3)
(a) Body plan
Figure 4. Representative results for 5415.
(c) Wave profiles at Fr=0.28 and L=3.048 and 5.72 m(Study 4.1-4.3)
(d) Wave elevations in the near wake at Fr=0.41(Study 4.1)
(e) Nominal wake measurements for Fr=0.28(L=3.048 m) (Study 4.1)
25
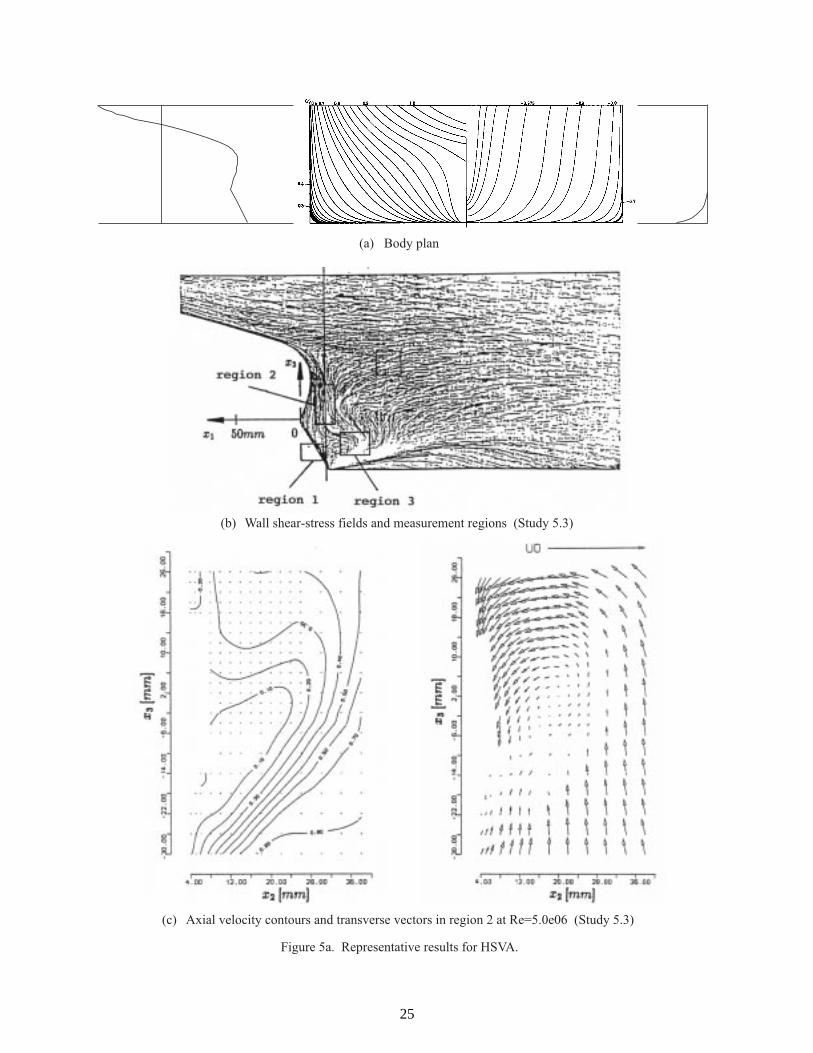
(a) Body plan
Figure 5a. Representative results for HSVA.
(c) Axial velocity contours and transverse vectors in region 2 at Re=5.0e06 (Study 5.3)
(b) Wall shear-stress fields and measurement regions (Study 5.3)
26
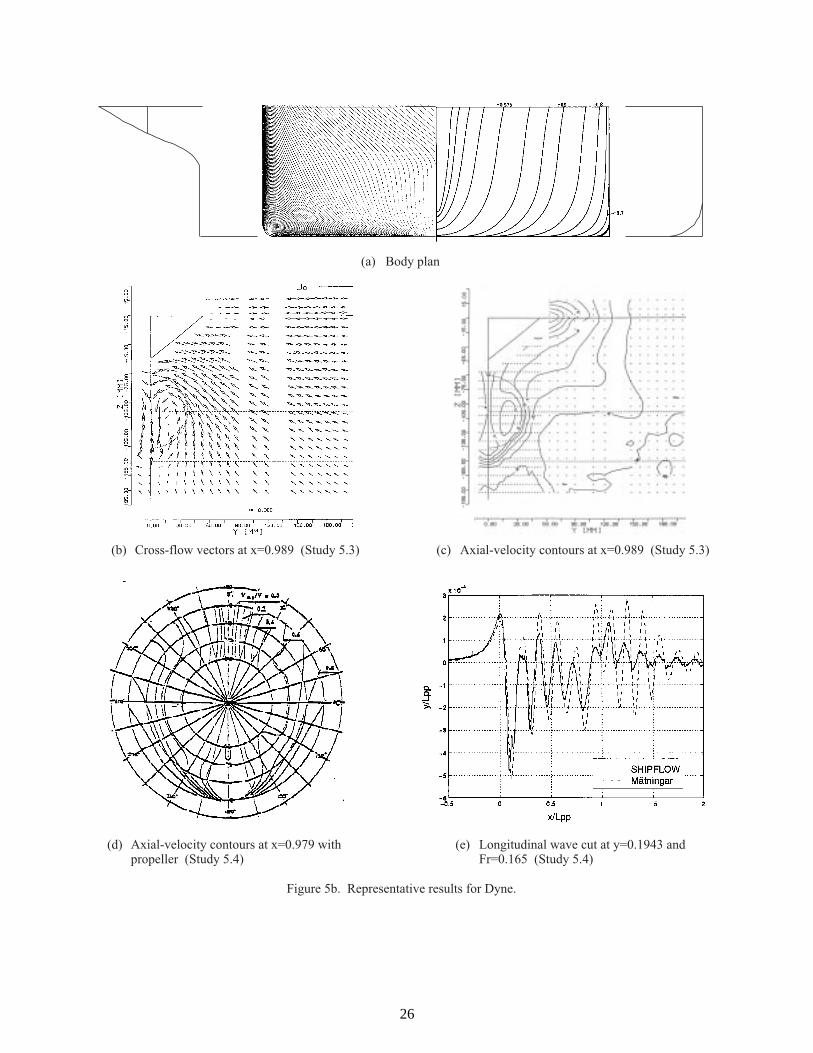
(a) Body plan
Figure 5b. Representative results for Dyne.
(d) Axial-velocity contours at x=0.979 withpropeller (Study 5.4)
(e) Longitudinal wave cut at y=0.1943 andFr=0.165 (Study 5.4)
(b) Cross-flow vectors at x=0.989 (Study 5.3) (c) Axial-velocity contours at x=0.989 (Study 5.3)
27
(b) uu contours in the propeller plane atRe=3.55e06 (Study 6.2)
l l
(a) Body plan
Figure 6. Representative results for Ryuko-Maru.
(c) Axial velocity contours and vectors for Fr=0.153and x=0.925 (7.0 m model) (Study 6.1)
(d) Axial velocity contours and vectors for Fr=0.153and x=0.925 (30.0 m model) (Study 6.1)
(e) Axial velocity contours and vectors for Fr=0.153and x=0.925 (full scale) (Study 6.1)
28
(a) Body plan
Figure 7. Representative results for DAIOH.
(d) Comparison of measured vorticity distributionsat the propeller plane (NKK) (Study 7.1)
(e) Comparison of measured vorticity distributionsat the propeller plane (OU) (Study 7.1)
(b) Comparison of measured wake distributions at thepropeller plane (NKK) (Study 7.1)
(c) Comparison of measured wake distributions at thepropeller plane (ASMB) (Study 7.1)
29
(a) Body plan
Figure 8. Representative results for VLCC and VLCC2.
(d) Comparison of axial velocity contours in the propeller plane for VLCC and VLCC2 (Study 8.1-8.2)
(b) Wave profile on the hull surface at Fr=0.26 (VLCC) (Study 8.1)


![G]L^ :JK - 北海道治山林道協会 安心・安全で緑豊かな …h-chisanrindo.com/pdf2/kinenkouenkai_23.05.19.pdf5 ‡](https://static.documents.pub/doc/80x56/5b3a86317f8b9a895a8b8be8/gl-jk-h-.jpg)


