USER INSTRUCTIONS FOR THE POLICY ANALYSIS MODEL FOR ASEAN (PAMA) Prepared for UNITED NATIONS ENVIRONMENT PROGRAMME By INTERNATIONAL INSTITUTE FOR ENERGY CONSERVATION - ASIA 12 th Floor, United Business Center II Building, 591, Sukhumvit Road, Wattana, Bangkok – 10110 THAILAND
Transcript
USER INSTRUCTIONS FOR THE POLICY ANALYSIS MODEL FOR ASEAN (PAMA)
Prepared for
UNITED NATIONS ENVIRONMENT PROGRAMME
By
INTERNATIONAL INSTITUTE FOR ENERGY CONSERVATION - ASIA12th Floor, United Business Center II Building, 591, Sukhumvit Road,
Wattana, Bangkok – 10110 THAILAND
September 2016
ACKNOWLEDGEMENTS
This manual was prepared by the International Institute for Energy Conservation (IIEC), for the United Nations Environment Programme (UNEP)–Global Environment Facility (GEF) en.lighten initiative as part of the Association of South East Asia Nations Standards Harmonization Initiative for Energy Efficiency (ASEAN SHINE) project.
IIEC and UNEP would like to thank the EU Switch-Asia Regional Policy Support Component and the Australian Government for funding the development of this document, as part of the ASEAN SHINE – Lighting project.
ASEAN Regional Efficient Lighting Market Assessment Prepared by IIEC for UNEP
STEP-BY-STEP INSTRUCTIONS.....................................................................................4Step 1 – Open spreadsheet tool....................................................................................................4Step 2 – Menus selection...............................................................................................................4Step 3 (Optional) – User Inputs......................................................................................................9
APPENDIX A. MODELLING METHODOLOGY.................................................................13Overview of the Policy Analysis Model for ASEAN.......................................................................13Modelling Methodology..............................................................................................................14National Lamp Stock Module.....................................................................................................................................14National lamp shipment Module...............................................................................................................................17Energy Efficiency Policy Measure Module.................................................................................................................19
Model Inputs and Assumptions...................................................................................................21Model Inputs and References....................................................................................................................................21Model Assumptions...................................................................................................................................................24
APPENDIX B. EXAMPLES OF MODEL USAGE.................................................................26EX1. Multiple policy intervention scenarios.................................................................................26EX2. Build-up regional data by using PAMA model......................................................................28
September 2016|1
ASEAN Regional Efficient Lighting Market Assessment Prepared by IIEC for UNEP
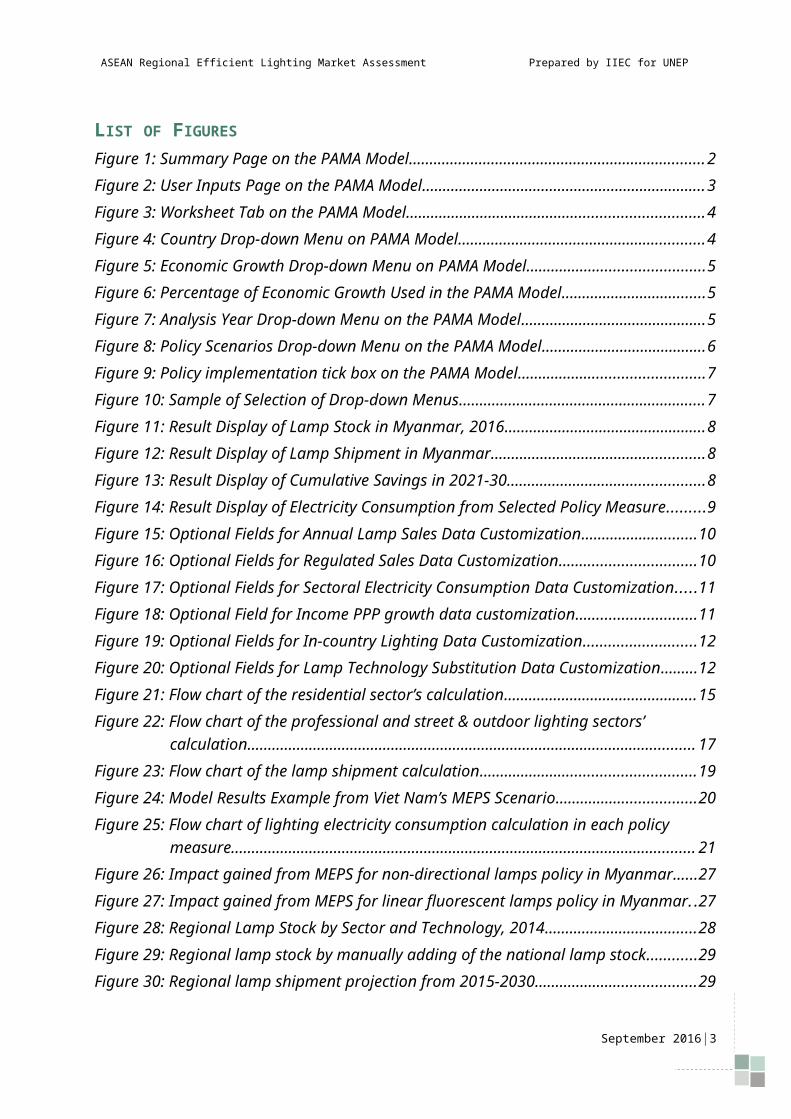
LIST OF FIGURES
Figure 1: Summary Page on the PAMA Model...............................................................................2Figure 2: User Inputs Page on the PAMA Model............................................................................3Figure 3: Worksheet Tab on the PAMA Model...............................................................................4Figure 4: Country Drop-down Menu on PAMA Model....................................................................4Figure 5: Economic Growth Drop-down Menu on PAMA Model....................................................5Figure 6: Percentage of Economic Growth Used in the PAMA Model............................................5Figure 7: Analysis Year Drop-down Menu on the PAMA Model.....................................................5Figure 8: Policy Scenarios Drop-down Menu on the PAMA Model.................................................6Figure 9: Policy implementation tick box on the PAMA Model......................................................7Figure 10: Sample of Selection of Drop-down Menus....................................................................7Figure 11: Result Display of Lamp Stock in Myanmar, 2016..........................................................8Figure 12: Result Display of Lamp Shipment in Myanmar..............................................................8Figure 13: Result Display of Cumulative Savings in 2021-30..........................................................8Figure 14: Result Display of Electricity Consumption from Selected Policy Measure.....................9Figure 15: Optional Fields for Annual Lamp Sales Data Customization........................................10Figure 16: Optional Fields for Regulated Sales Data Customization............................................10Figure 17: Optional Fields for Sectoral Electricity Consumption Data Customization..................11Figure 18: Optional Field for Income PPP growth data customization.........................................11Figure 19: Optional Fields for In-country Lighting Data Customization.......................................12Figure 20: Optional Fields for Lamp Technology Substitution Data Customization......................12Figure 21: Flow chart of the residential sector’s calculation........................................................15Figure 22: Flow chart of the professional and street & outdoor lighting sectors’ calculation......17Figure 23: Flow chart of the lamp shipment calculation..............................................................19Figure 24: Model Results Example from Viet Nam’s MEPS Scenario............................................20Figure 25: Flow chart of lighting electricity consumption calculation in each policy measure.....21Figure 26: Impact gained from MEPS for non-directional lamps policy in Myanmar...................27Figure 27: Impact gained from MEPS for linear fluorescent lamps policy in Myanmar...............27Figure 28: Regional Lamp Stock by Sector and Technology, 2014...............................................28Figure 29: Regional lamp stock by manually adding of the national lamp stock.........................29Figure 30: Regional lamp shipment projection from 2015-2030..................................................29Figure 31: Regional lamp shipment projection by manually adding of the national lamp
shipment...................................................................................................................30Figure 32: Regional lighting electricity consumption projection..................................................30Figure 33: Regional lighting electricity consumption projection by manually adding of the
national electricity consumption...............................................................................31
September 2016|2
ASEAN Regional Efficient Lighting Market Assessment Prepared by IIEC for UNEP
LIST OF TABLES
Table 1: Explanations for each Policy Scenario..............................................................................6Table 2: Summary of Data Collection from Household Surveys...................................................22Table 3: Assumption on Lamp Wattages in 3 different Sectors in ASEAN....................................24Table 4: Assumption on Operating Hours and Utilisation............................................................25Table 5: Lamp Technology Substitution Year on Year..................................................................25
September 2016|3
ASEAN Regional Efficient Lighting Market Assessment Prepared by IIEC for UNEP
INTRODUCTION
The Policy Analysis Model for ASEAN (PAMA) is a self-contained spreadsheet model that provides both a user-oriented analysis and a national cost-benefit analysis of lighting policies. The model uses country-specific data and indices (population, GDP, per capita income, electrification and distribution rates, etc.), in combination with product-specific data (lamp shipment by types, efficacies and lifetimes) to construct estimates of impacts from multiple energy efficiency policy scenarios.
This model was designed as a user-friendly tool for policy-makers to view:
1) Total number of lamps installed in each country with projections up to 2030; 2) Lamp shipments from first purchases1 and replacements based on economic forecasts and
lighting technology adoption in each country with projections up to 2030 and;3) Energy saving, CO2 emission reductions, and financial savings achieved through the
implementation of energy efficiency policy measures.
The analyses can be customized to produce specific results without additional user inputs, through the use of drop-down menus located on the Summary page (see Figure 1).
1 First purchase is a new installation of lamps. In other words, it is defined as new light points gained from new construction, refurbishment, or renovation projects.
September 2016|1
ASEAN Regional Efficient Lighting Market Assessment Prepared by IIEC for UNEP
Figure 1: Summary Page on the PAMA Model
In addition, this model was populated with up-to-date key market and survey data by IIEC between 2014 and 2015 from various sources. More up-to-date data can also be added through the User Inputs page for better accuracy of projections (see Figure 2). Details on how to adjust this are located in Step 3.
September 2016|2
ASEAN Regional Efficient Lighting Market Assessment Prepared by IIEC for UNEP
The following is a step-by-step guide for using and customizing this tool.
September 2016|3
ASEAN Regional Efficient Lighting Market Assessment Prepared by IIEC for UNEP
STEP-BY-STEP INSTRUCTIONS
STEP 1 – OPEN SPREADSHEET TOOL
Open the spreadsheet file. Make sure that the security level in Excel is set to enable macros (How to enable macro: https://support.office.com/en-us/article/Enable-or-disable-macros-in-Office-documents-7b4fdd2e-174f-47e2-9611-9efe4f860b12).
STEP 2 – MENUS SELECTION
Navigate to the Summary worksheet tab (see Figure 3).
Figure 3: Worksheet Tab on the PAMA Model
Select the “Country” drop-down menu to select the country you wish to analyse (see Figure 4).
Figure 4: Country Drop-down Menu on PAMA Model
Select the “Economic Growth” drop-down menu to select the economic scenario. There are three options under the economic growth drop-down menu i.e., 1) “High Growth (OECD)2,” a high growth option under economics stability; 2) “Conservative (ADB)3,” a lower growth rate predictive assumption; and 3) “Custom growth (user input),” a customising option in which GDP growth can be manually input by the user (see Figure 5). The default value of the Economic Growth is “High Growth (OECD)”.
2 Estimates of GDP growth in this scenario are based on the OECD Development Centre, MPF-2016 (Medium-Term Projection Framework). Reference: OECD. (2016). Economic Outlook for Southeast Asia, China and India 2016: Enhancing Regional Ties. Paris: OECD Publishing. For more information on MPF, please visit www.oecd.org/dev/asiapacific/mpf.
3 Estimates of GDP growth in this scenario are based on the negative scenario projected by ADB’s Economics and Research Department. Reference: ADB. (2014, December). The ASEAN Economy in the Regional Context: Opportunities, Challenges, and Policy Options. Retrieved from Asian Development Bank (ADB). For more information, please find http://www.adb.org/sites/default/files/publication/152830/reiwp-145.pdf.
ASEAN Regional Efficient Lighting Market Assessment Prepared by IIEC for UNEP
Figure 5: Economic Growth Drop-down Menu on PAMA Model
When selecting the ‘Custom growth (user input)’ option from the “Economic Growth” drop-down menu, user needs to enter the expected GDP growth in percentage in the green column next to the drop-down menu (Shown in Figure 5).
Forecasts of economic growth rate for each ASEAN member state in high and conservative scenarios used in the PAMA model are shown in Figure 6, and these data are presented in the CountryData page (tab).
Country High growth (OECD, 2016)
Conservative(ADB, 2014)
BRN 1.8% 1.2%
KHM 7.3% 4.0%
IDN 5.5% 2.5%
LAO 7.3% 3.5%
MYS 5.0% 2.5%
MMR 8.2% 4.0%
PHL 5.7% 3.0%
SGP 2.6% 1.0%
THA 3.6% 2.0%
VNM 6.0% 3.5%
Figure 6: Percentage of Economic Growth Used in the PAMA Model
Then, select the “Analysis Year” drop-down menu. The “Analysis Year” is default to 2016; users can select any desired year to see total number of installed lamps and shipment in any selected year.
September 2016|5
ASEAN Regional Efficient Lighting Market Assessment Prepared by IIEC for UNEP
Figure 7: Analysis Year Drop-down Menu on the PAMA Model
After that, select the desired Policy Scenario for analysis.
Figure 8: Policy Scenarios Drop-down Menu on the PAMA Model
Table 1 provides explanations for each of the three scenarios as follows:
Table 1: Explanations for each Policy Scenario
Policy Scenario Explaination
1) Business as usual (BAU) A scenario where lighting markets naturally and gradually shift towards energy efficient lighting technologies, without any policy stimulus.
2) Energy Efficiency (EE) A scenario where lighting markets are actively stimulated by more stringent standards and simultaneously encouraged by labelling schemes. By default, in this scenario, incandescent lamps are initially set to be banned after 2020 and MEPS for compact fluorescent lamps, fluorescent lamps, and high intensity discharge lamps are also established in the same year.
However, users can select each scenario one by one by ticking each box of the “Policy implementation” function (see Figure 9).
3) Best available technology (BAT) An ideal scenario in which lighting markets across ASEAN member states shift towards the best available energy efficient type of lamps (i.e., LEDs). In this scenario, a vast majority of lamps are set to be replaced by LED technology by 2030.
If the user selects the “Energy Efficiency” option from Policy Scenario drop-down menu, then it is required to select specific energy efficiency policy implementation to be implemented from the following list as shown in Figure 9. By default, all policies are pre-selected, and users should de-select the boxes of any policy that is not being considered.
September 2016|6
ASEAN Regional Efficient Lighting Market Assessment Prepared by IIEC for UNEP
The model is designed to be interactive and can be used for decision making purposes. By comparing one policy implementation against the others, user can assess the highest impact policy intervention (See Appendix B – Examples of model usage for customisation guidelines).
September 2016|7
ASEAN Regional Efficient Lighting Market Assessment Prepared by IIEC for UNEP
Policy implementation(EE scenario only)
Prohibition of ILs MEPS for CFLs MEPS for LFLs MEPS for HID Labelling programme for CFLs
Figure 9: Policy implementation tick box on the PAMA Model
Figure 10 below shows the sample of selected menus: Myanmar is the selected country, with “High Growth (OECD),” “2016,” and “Energy Efficiency” as the selected settings, with all policy implementation selected.
Figure 10: Sample of Selection of Drop-down Menus
After selection, the page (see Figure 10) will show the specific data for each country selected under the section of “Country Profile at a Glance”, which contains the following information:
Population and Projected Growth (from the UN Secretariat, population division and National Census). Available at https://esa.un.org/unpd/wpp/Download/Standard/Population/
Per Capita Income (Gross National Income, adjusted for Purchasing Power Parity) from the World Bank, 2015. Available at http://data.worldbank.org/indicator/NY.GDP.PCAP.PP.CD
Electrification Rate and Transmission and Distribution losses (most recent data from respective organisations in each ASEAN country)
CO2 emission factors (kg CO2 per kilowatt hour electricity, IEA 2013 and List of Grid Emission Factors created by Kentaro Takahashi and Akihisa Kuriyama). Available at https://www.iea.org/publications/freepublications/publication/CO2EmissionsFromFuelCombustionHighlights2015.pdf and http://enviroscope.iges.or.jp/modules/envirolib/view.php?docid=2136
Figure 11; Figure 12; Figure 13; and Figure 14 provide examples of graphical results data on estimates of lamp stock and shipment, cumulative savings in 2021-30 and electricity consumption from selected policy measures in Myanmar.
ASEAN Regional Efficient Lighting Market Assessment Prepared by IIEC for UNEP
Residential Professional Street and Outdoor
Total0.0
5.0
10.0
15.0
20.0
25.0
30.0
35.0
40.0
45.0
50.0
HIDLEDLinear fluorescentCFLHalogenIncandescent
Lam
p st
ock
(in m
illio
n un
its)
Figure 11: Result Display of Lamp Stock in Myanmar, 2016
2030
2029
2028
2027
2026
2025
2024
2023
2022
2021
2020
2019
2018
2017
2016
2015
2014
2013
2012
2011
2010
2009
2008
2007
2006
2005
2004
2003
2002
2001
2000
0
5,000,000
10,000,000
15,000,000
20,000,000
25,000,000
30,000,000
35,000,000
40,000,000
45,000,000
50,000,000
First PurchaseReplacementsTotal Sales
Year
Figure 12: Result Display of Lamp Shipment in Myanmar
Figure 13: Result Display of Cumulative Savings in 2021-30
September 2016|9
ASEAN Regional Efficient Lighting Market Assessment Prepared by IIEC for UNEP
0.0
1.0
2.0
3.0
4.0
5.0
6.0
7.0
8.0Residential Commercial Industrial Street and Outdoor Energy EfficiencyBAU
Tera
watt
-hou
rs
Figure 14: Result Display of Electricity Consumption from Selected Policy Measure
STEP 3 (OPTIONAL) – USER INPUTS
In this step, any data obtained by the user that is specific to their country can be incorporated into the model to update or replace the default values and estimates provided with the model. The spreadsheet allows data input for several parameters, including lamp shipment data, and the rates of change in lamp technologies present in the market. All areas for user input are located on the User Inputs sheet. The cells that allow users to update data are highlighted in green.
Shipments data
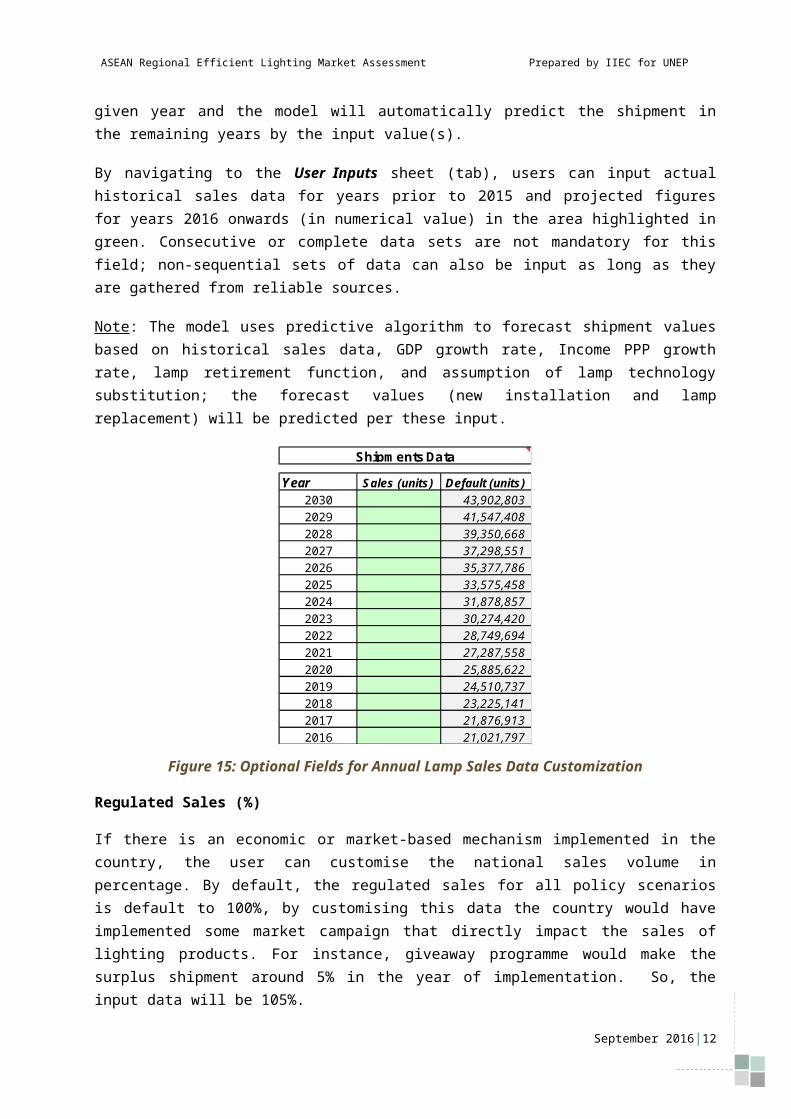
By default, the spreadsheet model forecasts the number of lamp shipment in any given year by a mathematic model that takes into account growth in ownership (due to economic growth), and declining function for lamp replacements (due to expected longer lifetime of lamps). The user can deliberately adjust the shipment value in any given year and the model will automatically predict the shipment in the remaining years by the input value(s).
By navigating to the User Inputs sheet (tab), users can input actual historical sales data for years prior to 2015 and projected figures for years 2016 onwards (in numerical value) in the area highlighted in green. Consecutive or complete data sets are not mandatory for this field; non-sequential sets of data can also be input as long as they are gathered from reliable sources.
Note: The model uses predictive algorithm to forecast shipment values based on historical sales data, GDP growth rate, Income PPP growth rate, lamp retirement function, and assumption of lamp technology substitution; the forecast values (new installation and lamp replacement) will be predicted per these input.
September 2016|10
ASEAN Regional Efficient Lighting Market Assessment Prepared by IIEC for UNEP
Figure 15: Optional Fields for Annual Lamp Sales Data Customization
Regulated Sales (%)
If there is an economic or market-based mechanism implemented in the country, the user can customise the national sales volume in percentage. By default, the regulated sales for all policy scenarios is default to 100%, by customising this data the country would have implemented some market campaign that directly impact the sales of lighting products. For instance, giveaway programme would make the surplus shipment around 5% in the year of implementation. So, the input data will be 105%.
Regulated sales (%) 105.00%
Figure 16: Optional Fields for Regulated Sales Data Customization
Energy data
The model is designed to use sectoral electricity consumption statistics as a key input for stock model in the commercial and industrial sector. The sectoral electricity consumption is the share of electricity consumption by each major sector in percentage. By default, the model relies on official data reported from respective ministries or national utilities in each country. The default data is based on the most recent data available in 2014 – 20154. Figure 17 shows how to input data into this table, sectoral electricity consumption in Myanmar are input as an example.
By default, the model has used official electricity statistics in each country for the period 2014 to 2015 as indicated in Figure 17. By updating this data, users must not leave any of the 5 sectors blank. It is required to enter 0% in case of no data. The automatic entry for "Others" will ensure that the summation of the total consumption is equal to 100%, and the “Entry Check” will provide an error notification if incomplete data input is occurred.
4 Information sources are flagged in the CountryData page (tab), Electricity Consumption (TWh) section.
September 2016|11
ASEAN Regional Efficient Lighting Market Assessment Prepared by IIEC for UNEP
Country Name Residential Commercial Industrial Public Others Entry CheckBrunei Darussalam
Figure 17: Optional Fields for Sectoral Electricity Consumption Data Customization
Economic Data
The growth of Gross National Income per capita at purchasing power parity (PPP) effects the new installation of lamps. By default, this parameter is assumed to be equal to GDP growth rate which is cross-reference to any economic growth scenario selected by the user. The user can customise Income PPP growth if there is data available.
Economic data
Income PPP growth (%) 4%
Figure 18: Optional Field for Income PPP growth data customization
Household and market survey data
Actual surveyed data from each country are used to determine the total number of lamps installed in each sector, which are key model parameters. The percentage share of electricity from lighting in each sector is used to determine the energy consumption in kWh for the sector. This figure is then divided by the unit energy consumption (UEC) of lamp in each sector by the model so the number of installed lamps can be calculated. For instance, the number of light points per household is an average number of lamps found in the residential sector of the country of interest. This number is then multiplied with the total number of electrified household in the same country by the market model. The by-product of
September 2016|12
ASEAN Regional Efficient Lighting Market Assessment Prepared by IIEC for UNEP
this is the estimated number of lamp installed in the residential sector. By default, the model uses the average number of light points per household based on the household survey conducted in 20155.
Figure 19 shows the sample of data entered into each optional field.
Surveyed dataThe residential sectorNo. of light point per household 10
The commercial sector%share of electricity from lighting 10%
The industrial sector%share of electricity from lighting 5%
Street & Outdoor lighting sector%share of street lighting from the total electricity consumption 2%
Figure 19: Optional Fields for In-country Lighting Data Customization
Lamp Technology substitution
Overtime, it is envisaged that the uptake of energy efficient lamps will happen naturally and gradually in any market without any policy stimulus, as these products mature and their prices decline. The lamp technology substitution forecast is used to project the installed lamp stock in the future under each policy scenario. If the user wishes to change the forecast, they must select from the drop down menu the annual percentage decrease of lamps (which is a negative value) and the user-input values will then supersede the default values in the Database sheet.
Figure 20: Optional Fields for Lamp Technology Substitution Data Customization
5 Singapore is only the country where this data is not available, the number presented in the model was taken from Policy Analysis Modelling System developed by CLASP and LBNL at 29 light points per household.
September 2016|13
ASEAN Regional Efficient Lighting Market Assessment Prepared by IIEC for UNEP
APPENDIX A. MODELLING METHODOLOGY
Lamp Stock and Shipment Model for ASEAN
OVERVIEW OF THE POLICY ANALYSIS MODEL FOR ASEAN
The Policy Analysis Model for ASEAN (PAMA) was developed in response to the agreement made by ASEAN member states to collaborate on a regional transition to energy efficient lighting. The PAMA model will assist policy makers to determine the scope of lighting technologies that are widely used in the region, as well as to identify and provide information on economic benefits when the supporting policies are implemented.
This model was developed as a market forecasting, spreadsheet-based tool that incorporates multiple energy efficient lighting policy scenarios and provides the estimated benefits of policy implementation, including minimum energy performance standards (MEPS) and appliance labelling programmes. Moreover, the model estimates the highest saving potential when best available technology (BAT) is applied throughout the region. The model was designed to be used by the ASEAN member states. In addition, the outputs from different policies applied individually by each state can be summed to estimate the regional impacts. The model includes the following modules:
National Lamp Stock module – This module estimates the total number of lamps installed in each country with projections up to 2030. It utilises different approaches to estimate the installed lamp stocks in different end-use sectors. Lamp stocks for the national residential sector are compiled from data obtained through country household lighting surveys, while lamps stocks for commercial, industrial, and street and outdoor lighting sectors were developed based on shares of lighting consumption in the national electricity consumption data provided by each ASEAN member state.
National Lamp Shipment module – This module estimates the lamp shipments from first purchase and replacements based on economic forecasts and lighting technology adoption in each country with projections up to 2030. The annual lamp shipments are estimated based on mathematical models. The module also fundamentally relies on official data, preliminary studies, surveyed data, with only marginal reliance on assumptions. This use of national data also allows the module to estimate regional impacts by summing up individual country results.
Energy Efficiency Policy Measure module – This module calculates energy saving, CO2 emission reductions, and financial savings achieved through the implementation of energy efficiency policy measures. The module is designed to operate with the widest possible range of policies, with minimal need for adjusting country data if there is no major update available.
September 2016|14
ASEAN Regional Efficient Lighting Market Assessment Prepared by IIEC for UNEP
MODELLING METHODOLOGY
Although there are a number of fixed parameters (e.g., population, electricity consumption, average lamp wattages, operating hours) integrated into PAMA, variable parameters (e.g., sectoral electricity consumption, average number of light points for each household, percentage share of electricity consumption from lighting) are listed for future revision. The User Inputs worksheet is designed for more accurate country-specific insight where available, and this can be easily customised.
NATIONAL LAMP STOCK MODULE
Residential Sector
Estimation of the total lamp stock installed in the residential sector in each ASEAN member state is based on the data from the in-person household surveys and official reports from the member states6. The estimated stock of lamps was derived from the average number of lamps found in the survey; this figure was then multiplied by the number of electrified households in each member state to arrive at the installed lamp stock. The number of electrified households was extrapolated by combining official census report data, updated status of electrification rate, and population growth rate in each country. The lamp wattages and operating hours were also collected and used to construct the total electricity consumption model (see Table 2). The total installed lamps function is calculated based on surveyed data and official statistics; given by:
Lamp Stock ¿ Lp× Np×ElecRHHs
Where: Lamp Stock is the units installed of lamps;
Lp is the number of light point per household, collected from household surveys,
Np is the number of population, officially reported by the country,
ElecR is the electrification rate, officially reported by the national utility or ministry of energy, and
HHs is the household size, based on UN Habitat or most recent country census report.
Note: Users can input more accurate or up-to-date average light point data if there is more reliable data available.
6 Brunei Darussalam and Singapore are omitted from the scope of the field surveys, data presented in the model is taken from preliminary studies
September 2016|15
ASEAN Regional Efficient Lighting Market Assessment Prepared by IIEC for UNEP
Figure 21: Flow chart of the residential sector’s calculation
Professional (Commercial and Industrial) Sector
Lamp stocks in the professional sector in each ASEAN member state were estimated using a top-down computation model7 with the following key parameters: percentage share of electricity consumption by lighting applications in each sector; penetration of different lighting technologies; and typical lamp wattages and operating hours8. The estimation of electricity share from lighting (in kWh per year) was based on sectoral electricity use statistics and energy audit reports that provide electricity shares by lighting applications in the commercial and industrial sectors. The penetration rate of each lighting technology was based on data provided by the lighting industry associations in each country. Typical
7 The top-down model uses electricity consumption data by the commercial sector in each country, together with parameters from industry interviews and energy audit reports to estimate the total commercial lamp stock in each country.
8 Approaches for citing and references these parameters were based on best available data obtained from each country. Sources of data were classified into four levels based on their credibility: 1) Published data officially released by the governments; 2) Energy audit reports from prestigious institutions; 3) Publications, journal articles or reports; and if none of the above can be found the model utilises 4) data from the similar geographical location and GDP size country.
September 2016|16
ASEAN Regional Efficient Lighting Market Assessment Prepared by IIEC for UNEP
lamp wattages and operating hours were developed based on industry interviews and available through energy audit reports. In cases where the aforementioned data were not available for a specific member state, data from other neighbouring member states with similar purchasing power parity (PPP), infrastructure, and culture were used by the model to generate outputs.
Note: If there is an absence of the electricity shares by lighting data in any country, the research reported by the most similar country (in purchasing power parity, infrastructure) is then substituted.
Public Lighting (Street and Outdoor) Sector
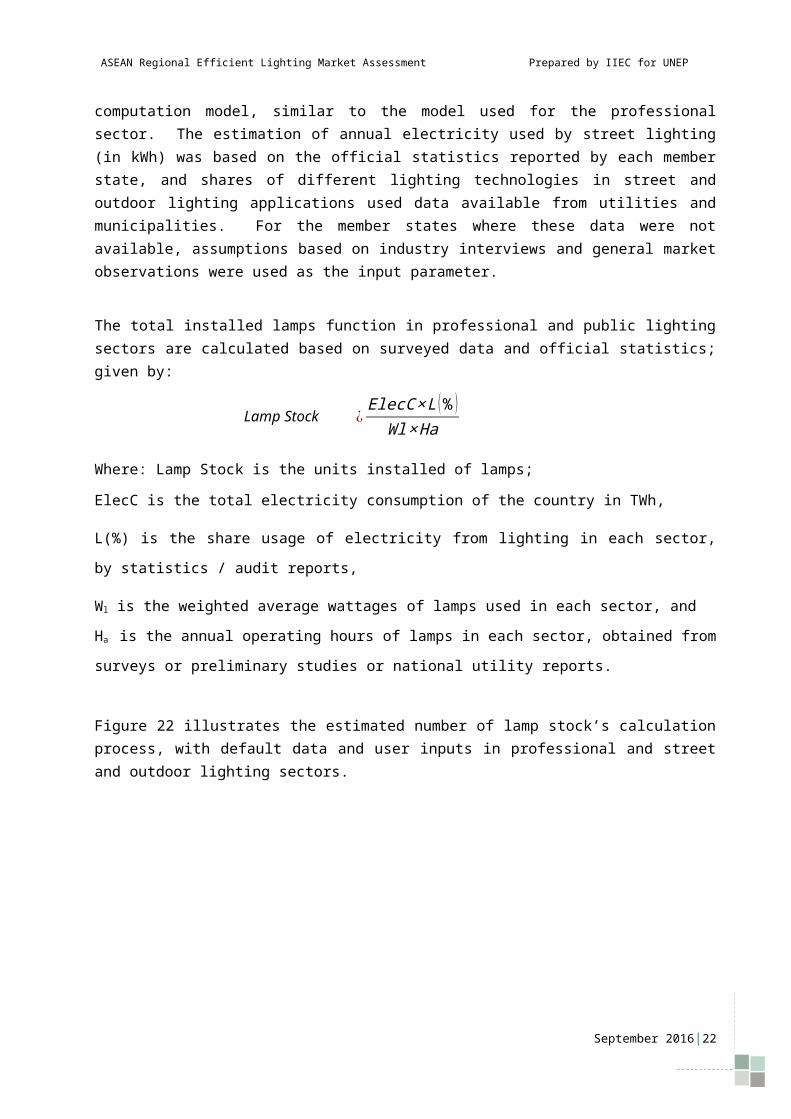
Estimation of installed lamp stock for street and outdoor lighting applications in each ASEAN member state was also based on a top-down computation model, similar to the model used for the professional sector. The estimation of annual electricity used by street lighting (in kWh) was based on the official statistics reported by each member state, and shares of different lighting technologies in street and outdoor lighting applications used data available from utilities and municipalities. For the member states where these data were not available, assumptions based on industry interviews and general market observations were used as the input parameter.
The total installed lamps function in professional and public lighting sectors are calculated based on surveyed data and official statistics; given by:
Lamp Stock ¿ElecC×L (% )
Wl×Ha
Where: Lamp Stock is the units installed of lamps;
ElecC is the total electricity consumption of the country in TWh,
L(%) is the share usage of electricity from lighting in each sector, by statistics / audit reports,
Wl is the weighted average wattages of lamps used in each sector, and
Ha is the annual operating hours of lamps in each sector, obtained from surveys or preliminary studies or
national utility reports.
Figure 22 illustrates the estimated number of lamp stock’s calculation process, with default data and user inputs in professional and street and outdoor lighting sectors.
September 2016|17
ASEAN Regional Efficient Lighting Market Assessment Prepared by IIEC for UNEP
Figure 22: Flow chart of the professional and street & outdoor lighting sectors’ calculation
NATIONAL LAMP SHIPMENT MODULE
Determination of economically-driven appliance ownership rates allowed for the calculation of the goods delivered to consumers. Calculations of shipments (annual sales volume) are important, since this model determines the fraction(s) of lamps that will be affected by policy scenarios at any point in the policy timeframe.
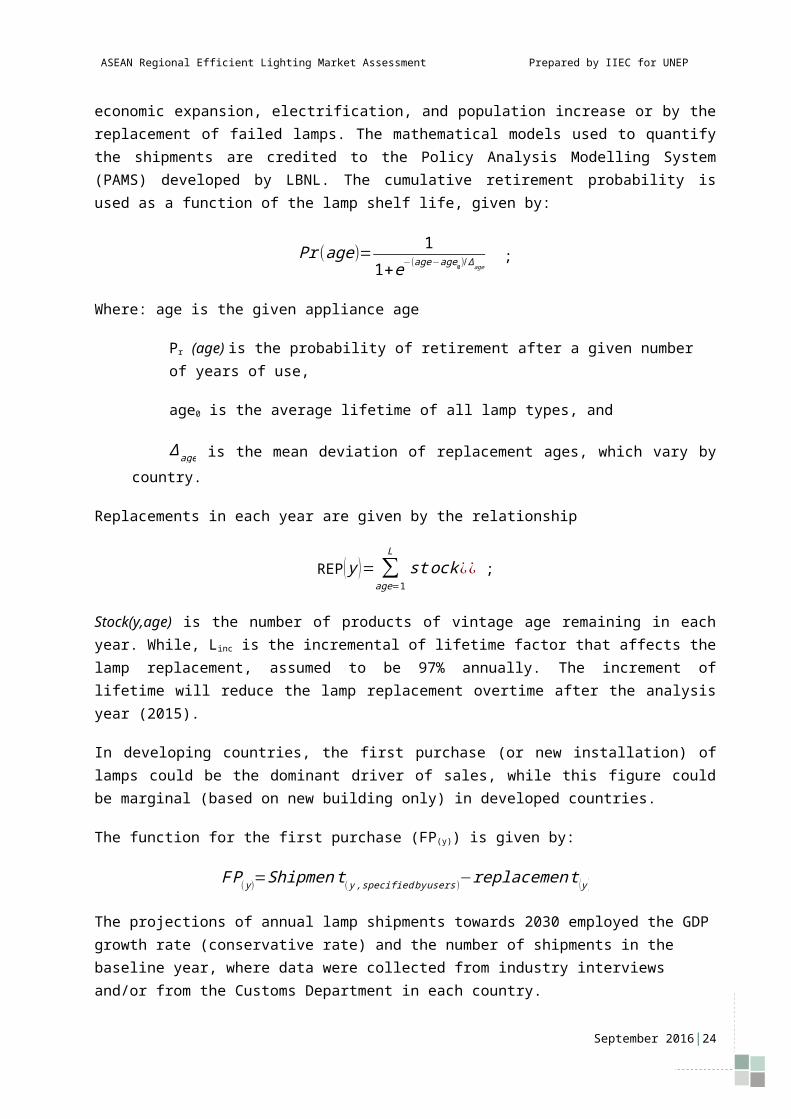
Changes in lamp shipments are typically driven by the change (increase or decrease) in lamps ownership per household that results from the economic expansion, electrification, and population increase or by the replacement of failed lamps. The mathematical models used to quantify the shipments are credited to the Policy Analysis Modelling System (PAMS) developed by LBNL. The cumulative retirement probability is used as a function of the lamp shelf life, given by:
September 2016|18
ASEAN Regional Efficient Lighting Market Assessment Prepared by IIEC for UNEP
Pr (age)= 11+e−(age−age0)/∆age
;
Where: age is the given appliance age
Pr (age) is the probability of retirement after a given number of years of use,
age0 is the average lifetime of all lamp types, and
∆age is the mean deviation of replacement ages, which vary by country.
Replacements in each year are given by the relationship
REP( y )= ∑age=1
L
st ock ¿¿ ;
Stock(y,age) is the number of products of vintage age remaining in each year. While, L inc is the incremental of lifetime factor that affects the lamp replacement, assumed to be 97% annually. The increment of lifetime will reduce the lamp replacement overtime after the analysis year (2015).
In developing countries, the first purchase (or new installation) of lamps could be the dominant driver of sales, while this figure could be marginal (based on new building only) in developed countries.
The function for the first purchase (FP(y)) is given by:
F P( y)=Shipmen t( y ,specified byusers)−replacemen t ( y )
The projections of annual lamp shipments towards 2030 employed the GDP growth rate (conservative rate) and the number of shipments in the baseline year, where data were collected from industry interviews and/or from the Customs Department in each country.
Finally, the total shipments for the current year are provided by:
Shipment ( y)=F P( y)+REP ( y )
Figure 23 presents lamp shipment’s calculation process, with default data and user inputs.
September 2016|19
ASEAN Regional Efficient Lighting Market Assessment Prepared by IIEC for UNEP
Figure 23: Flow chart of the lamp shipment calculation
ENERGY EFFICIENCY POLICY MEASURE MODULE
An example of the outputs produced by the energy efficiency policy measure module is shown in Figure24, which summarises electricity savings that could be achieved from MEPS and labelling policy measures in 2030. Economic benefits and environmental benefits are also calculated based on the savings from reduced electricity use.
September 2016|20
ASEAN Regional Efficient Lighting Market Assessment Prepared by IIEC for UNEP
Figure 24: Model Results Example from Viet Nam’s MEPS Scenario
The projections of impacts by different energy efficiency policy measures were developed based on country level data, estimated GDP growth, electricity consumption forecast, and lamp technology substitution assumptions. The module provides different policy measures and market stimulating programmes. The savings potential assumes that the MEPS and labelling are implemented by 2020 (Details are given in Section 3). The projections of electricity consumption from lighting employed the estimated number of installed lamps in each sector and unit energy consumption in each type of lamp; given by:
Annual Unit Energy Consumption is given by the relationship:
Annual UEC = L (% )×Wl (kW )×Ha(h)
1000
Where: L (%) is the share usage of electricity from lighting in each sector, by statistics / audit reports,
Wl is the weighted average wattages of lamps used in each sector (W), and
Ha is the annual operating hours of lamps in each sector (h), obtained from surveys or preliminary studies or national utility reports.
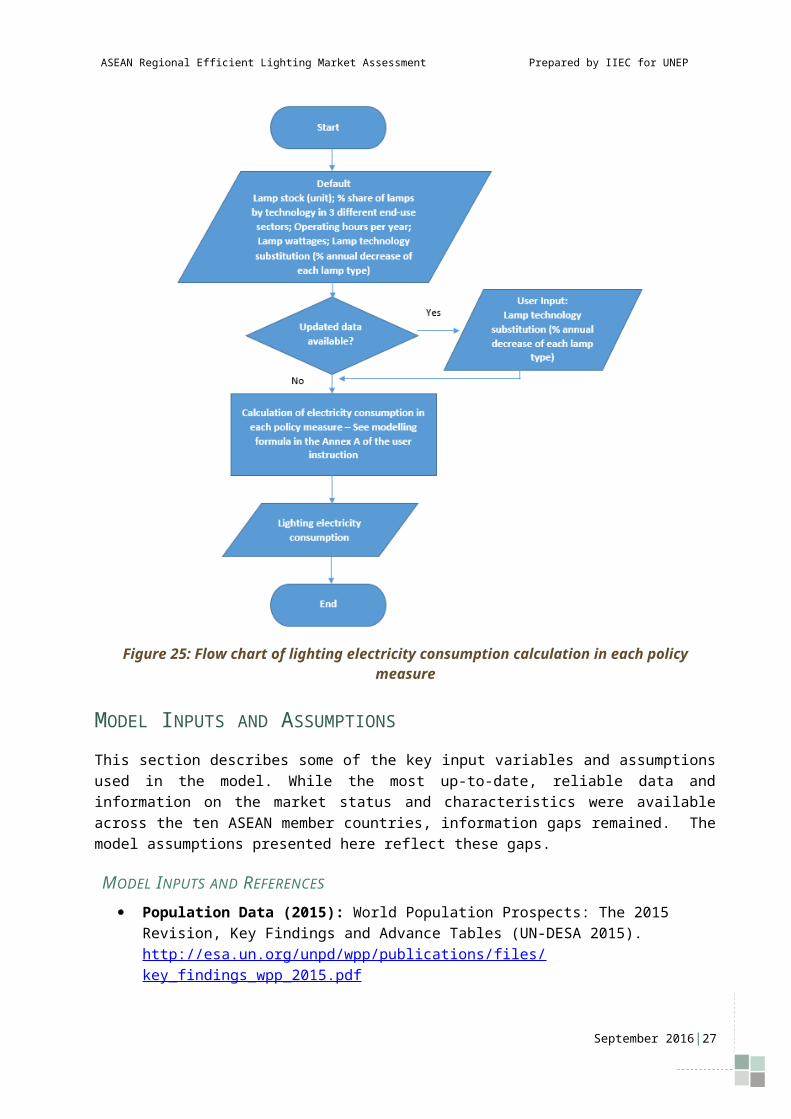
Figure 25 illustrates calculation of electricity consumption in each policy measure.
September 2016|21
ASEAN Regional Efficient Lighting Market Assessment Prepared by IIEC for UNEP
Figure 25: Flow chart of lighting electricity consumption calculation in each policy measure
MODEL INPUTS AND ASSUMPTIONS
This section describes some of the key input variables and assumptions used in the model. While the most up-to-date, reliable data and information on the market status and characteristics were available across the ten ASEAN member countries, information gaps remained. The model assumptions presented here reflect these gaps.
MODEL INPUTS AND REFERENCES
Population Data (2015): World Population Prospects: The 2015 Revision, Key Findings and Advance Tables (UN-DESA 2015).
Household Size: UN Habitat and census reports from each of the member states
Electrification Rate (2014-15): Collated from official sources of individual country (For more information on references: navigate to the ‘Country data’ sheet (tab) of the model)
September 2016|22
ASEAN Regional Efficient Lighting Market Assessment Prepared by IIEC for UNEP
Transmission and Distribution Loss Factor: collected from the IEA and reports issued by each national utility.
Income PPP and GDP (in USD): Calculated using GDP/population. GDP in current US$ (data for 2010) is taken from the World Bank (The World Bank 2016).
Income/economic Growth: Based on OECD report ‘Economic Outlook for Southeast Asia, China and India 2016’ (OECD 2016) and ADB report “The ASEAN Economy in the Regional Context: Opportunities, Challenges, and Policy Options” (ADB 2014).
Country High growth (OECD, 2016)
Conservative(ADB, 2014)
BRN 1.8% 1.2%
KHM 7.3% 4.0%
IDN 5.5% 2.5%
LAO 7.3% 3.5%
MYS 5.0% 2.5%
MMR 8.2% 4.0%
PHL 5.7% 3.0%
SGP 2.6% 1.0%
THA 3.6% 2.0%
VNM 6.0% 3.5%
Electricity Tariffs: collated from official sources (national electric utilities, Bureau of statistics).
Energy and Environment Data
Sectoral Electricity Consumption: Collated from official sources of individual country (For more information on references: navigate to the ‘Database’ sheet (tab) of the model).
Transmission and distribution losses: IEA and published data by national utility in each country.
CO2 Emission Factor: IEA (2013), and List of Grid Emission Factors created by Kentaro Takahashi and Akihisa Kuriyama (IGES, 2015).
Lighting Data
Estimates of the installed stock of lamps were collated from household surveys in 2015, lighting industry and relevant government agencies and electric utilities in each member state.
September 2016|23
ASEAN Regional Efficient Lighting Market Assessment Prepared by IIEC for UNEP
Table 2: Summary of Data Collection from Household Surveys
Country No. of surveyed HHs
AVG no. of light points found and used
WattagesOperating hours
IIEC Survey
Secondary resources
Brunei Darussalam
N/A N/A 23 (Ahmad, 2014)
Provided by Brunei Darussalam National
Energy Research Institute (BNERI)
Assumed by using similar geographical location and GDP size country
(Malaysia)
Cambodia 73 8.1 N/A Collected by lamp types from HH survey
Collected by lamp types from IIEC HH survey
Indonesia 50 7.3 N/A Collected by lamp types from HH survey
Collected by lamp types from IIEC HH survey
Lao PDR > 1000 (nationwide)
7.2 7.17 (EdL, 2014)
EdL Nationwide HH Surveys
EdL Nationwide HH Surveys
Malaysia 50 19.6 N/A Collected by lamp types from HH survey
Collected by lamp types from IIEC HH survey
Myanmar 73 8.6 N/A Collected by lamp types from HH survey
Collected by lamp types from HH survey
Philippines 50 6.0 N/A Collected by lamp types from HH survey
Collected by lamp types from HH survey
Singapore N/A N/A 29.94 (PAMS) Assumed by using similar geographical
location and GDP size country (Malaysia)
Assumed by using similar geographical location and GDP size country
(Malaysia)
Thailand 71 14.1 18 (EGAT and KMUTT, 2015)
Collected by lamp types from IIEC HH survey
(Have compared with EGAT HH Surveys –
Similar results)
Collected by lamp types from IIEC HH survey
Viet Nam 50 13.6 14.7 (Pham Thi Huyen et. al.,
2013)
Collected by lamp types from IIEC HH survey
(Have compared with the surveys done by
ISPONRE, 2013 – Similar results)
Collected by lamp types from IIEC HH survey
Estimates of the typical lamp wattage, operating hours, lamp lifetime, installation labour and other factors were developed for countries based on industry consultations, internet research and country feedback.
Estimates of the shares of the electricity use from lighting were collated from official published data or energy audit reports of each member state.
Baseline lamp unit prices: per reference from the retailer surveys in 2014 and provided by in-country consultants in 2015 as well as on-line resources.
September 2016|24
ASEAN Regional Efficient Lighting Market Assessment Prepared by IIEC for UNEP
Historical shipments of lamps: collected from interviews with various stakeholders including lamp manufacturers, importers or wholesalers, lighting associations in each member state.
September 2016|25
ASEAN Regional Efficient Lighting Market Assessment Prepared by IIEC for UNEP
MODEL ASSUMPTIONS
Lamp WattagesLamp wattages were assumed in the commercial, industrial and street and outdoor lighting sectors, while survey data were used in the residential sector. Table 33 provides the wattages for all lamp types used commonly in ASEAN9.
Table 3: Assumption on Lamp Wattages in 3 different Sectors in ASEAN
Assumed typical wattageLamp type Commercial (W) Industrial (W) Outdoor (W)
Incandescent 60 60 100
Halogen 50 50 80
CFL 14 24 25
LFL - T5 26 26 28
LFL - T8 32 36 32
LFL - T12 40 40 40
LFL - Circular 28 32 28
LED omnidirectional 7.2 10 16.5
LED tube 14.0 16.0 16.5
LED others 14.0 20.0 16.5
HID - HPS 120 150 180
HID - Mercury Vapour 120 150 180
HID - Metal Halide 120 150 180
LED street light 30 70 90
Operating Hours and Utilisation
Operating hours is an important factor that reflects the usage pattern of each lamp type. In high income households, the ownership of lamps (number of light points per household) tends to be higher, but the usage per light point tends to be lower when compared to less affluent households. This hypothesis is likely to be true since the operating hours of lamps in the residential sector of low to middle income countries based on GDP per capita reported by the World Bank10 (i.e., Cambodia, Lao PDR, Myanmar, Philippines and Viet Nam) are found to be significantly longer than in higher income countries (Indonesia, Malaysia, Thailand) (The World Bank 2016). The operating hours recorded from household owners in ASEAN were used for the residential modelling.
9 Average common wattages were estimated based on retailer and household surveys conducted by IIEC in 2015, interview with government agencies and utilities including energy audit reports (Ballast losses determined in fluorescent and street lighting applications).
10 Based on the World Bank GDP per capita database: http://data.worldbank.org/indicator/NY.GDP.PCAP.CD
September 2016|26
ASEAN Regional Efficient Lighting Market Assessment Prepared by IIEC for UNEP
For other sectors, the best available data were applied for all building sectors in all member states. Utilisation percentages of different lighting technologies in each end-use sector were estimated, based on the working days per year that are normalised by several factors, e.g. planned maintenance, holidays. Table 4 provides a summary of the assumptions and utilisation in each country for each lamp technology.
Table 4: Assumption on Operating Hours and Utilisation
Operating Hours (applied to commercial, industrial and street lighting sectors)
Lamp Technology Substitution Before and After Policy Year
It is envisaged that the uptake of energy efficient lamps will happen over time naturally and gradually in the market, as these products mature and prices decline, without any policy stimulus. This substitution scheme is applied to the business as usual (BAU) scenario during period 2000 – 2030 by the model, using 2015 as a baseline year. The annual decline of sales of conventional lamp types (in percentages) is shown in Table 5Error: Reference source not found11. These figures were derived from the historical
11 Technology substitution option is available for user modification in the ‘User Inputs’ sheet (tab)
September 2016|27
ASEAN Regional Efficient Lighting Market Assessment Prepared by IIEC for UNEP
import/export trend data in ASEAN. The efficient lamps will replace the existing stock of lamps according to this rate and the future unit energy consumption associated with this circumstance will be calculated by the model.
Table 5: Lamp Technology Substitution Year on Year
Technology substitutionIncandescent -7.0%
Halogen -3.1%
CFL -2.0%
LFL - T5 -1.5%
LFL - T8 -3.1%
LFL - T12 -35.0%
LFL - Circular -2.3%
HID -0.4%
September 2016|28
ASEAN Regional Efficient Lighting Market Assessment Prepared by IIEC for UNEP
APPENDIX B. EXAMPLES OF MODEL USAGE
EX1. MULTIPLE POLICY INTERVENTION SCENARIOS
The model allows the user to compare impact gaining from each policy intervention.
Example: a policy maker would like to compare between implementation of MEPS for non-directional products and MEPS for linear fluorescent lamps, whether which lighting policy intervention will better serve the department to reach goals in energy and environment.
Step I: Select the country, economic growth, and desired policy options
Figure 26 provides examples of graphical results data on estimates of electricity consumption from implementation of MEPS for non-directional products in Myanmar.
September 2016|29
ASEAN Regional Efficient Lighting Market Assessment Prepared by IIEC for UNEP
Figure 26: Impact gained from MEPS for non-directional lamps policy in Myanmar
Step II: Select another policy option to compare with the previous option
Figure 27 provides examples of graphical results data on estimates of electricity consumption from implementation of MEPS for linear fluorescent lamps in Myanmar.
Figure 27: Impact gained from MEPS for linear fluorescent lamps policy in Myanmar
It is shown that the implementation of MEPS for linear fluorescent lamps policy potentially has higher savings in comparison to the implementation of MEPS for non-directional lamps in Myanmar.
September 2016|30
ASEAN Regional Efficient Lighting Market Assessment Prepared by IIEC for UNEP
The users can apply this approach to any desired policy option for comparison and decision making purposes.
EX2. BUILD-UP REGIONAL DATA BY USING PAMA MODEL
PAMA model is designed to serve as a national lighting market forecasting tool, broader decision making process such as quantifying the whole ASEAN region, can also be done through manual data customisation.
Regional lamp stock:
Based on the PAMA model, the total number of lamps installed in various end-use sectors in all ASEAN member states is estimated at around 1.9 billion lamps in 2014 (see Figure 28).
Figure 28: Regional Lamp Stock by Sector and Technology, 2014
To construct this regional lamp stock chart, it is required consistency of the setting especially for key parameters (e.g. economic growth, year, and policy scenario) in order for data homogeneity.
First, the users select the “Country” one by one and navigate to Policy Scenarios worksheet, then copy cell B295:F303 or values from a table (see Figure 29) and paste it into the newly created blank sheet. The users then select the other countries and apply the same approach until complete all countries.
September 2016|31
ASEAN Regional Efficient Lighting Market Assessment Prepared by IIEC for UNEP
Figure 29: Regional lamp stock by manually adding of the national lamp stock
After that, the users sum all countries’ values on the blank sheet, then generate a sum of those values and create a chart from the selected range of cells manually.
Regional lamp shipment:
By using PAMA model, lamp shipments in ASEAN is projected that annual lighting product shipments will rise from around 567 million lamps in 2014 to around 829 million lamps in 2030 (See Figure 30).
Figure 30: Regional lamp shipment projection from 2015-2030
To construct the regional lamp shipments chart similarly as above, the users can manually build it up by selecting the “Country” one by one and navigating to “Base Stock” worksheet.
Then select a range of cells: column E to G (‘First purchase’, ‘Replacements’, and ‘Total Sales’) and row 7 to the desired rows or projection period (e.g. 2014-2030 – row 7:24) (see Figure 31). The users copy the selected cells and paste it into a blank worksheet.
September 2016|32
ASEAN Regional Efficient Lighting Market Assessment Prepared by IIEC for UNEP
Figure 31: Regional lamp shipment projection by manually adding of the national lamp shipment
The users apply this approach until complete all countries, then sum all countries’ values on the blank sheet and manually create a regional lamp shipments chart from those values.
Regional Lighting Electricity consumption:
According to projection of the regional lighting electricity consumption (TWh), it is projected that the impacts gained from implementation of multiple policy intervention options in the energy efficiency scenario is projected to be 18.5 TWh in 2030 (See Figure 32).
0.0
20.0
40.0
60.0
80.0
100.0
120.0
140.0
160.0
180.0 Residential Commercial Industrial Street&outdoor EE scenarioBAU
Tera
watt
-hou
rs
September 2016|33
ASEAN Regional Efficient Lighting Market Assessment Prepared by IIEC for UNEP
The users can manually build up this chart by selecting a country from the dropdown list and navigating to Policy Scenarios sheet, then copy cell G172:M203 and paste into a blank worksheet.
Figure 33: Regional lighting electricity consumption projection by manually adding of the national electricity consumption
The users then select the other countries and apply the same approach until complete all countries. The users will do the sum and create a projection chart manually from the sum of all countries’ values.