16


Annual groundwater quality survey 2016
Environment Canterbury 1
Introduction What is the annual groundwater quality survey?
Each year in the spring, in the months from September to December, Environment Canterbury / Kaunihera Taiao ki Waitaha collects groundwater samples from wells across the region. The samples are analysed for a range of water quality parameters.
Why do we carry out an annual survey?
The survey provides data for evaluating long-term, regional-scale changes in groundwater quality. It also provides an annual snapshot of groundwater quality in the Canterbury region.
Why spring?
The composition of the groundwater can vary over the course of the year. Spring is when we generally see contaminant concentrations at their highest. Spring is also when groundwater levels are typically at their highest, so wells are not dry and we can collect samples. Groundwater levels across the region were low in 2016 and several wells were dry after a prolonged period of dry weather conditions. The missing wells are unlikely to have a significant impact on regional conclusions, as only 2% of wells that are typically sampled were dry.
How do we sample the groundwater?
We collect samples according to Environment Canterbury’s standard procedure for the collection of groundwater quality samples, which is consistent with the National Groundwater Sampling Protocol (MfE, 2006). The procedure includes purging by pumping out at least three well volumes or by pumping the well at a low flow rate with the pump intake at the level of the well screens. We measure field parameters (groundwater temperature, dissolved oxygen concentration, pH and conductivity) at each well during purging and only collect the sample when these readings are stable. Our samples are filtered in the field for metals (cations) analysis or unfiltered for other parameters. We keep the samples chilled (but not frozen) during transport to the laboratory. Our groundwater samples are analysed by Hill Laboratories for major ion chemistry (sodium, potassium, calcium, magnesium, alkalinity, chloride and sulphate), nutrients (ammonia nitrogen, nitrate nitrogen and dissolved reactive phosphorus), iron, manganese, reactive silica, pH, electrical conductivity and indicator bacteria (E. coli and total coliforms).
What do we do with the data?
We use data from the annual surveys to determine the state of the groundwater resource and to assess changes in groundwater quality over time. We also use the data as a baseline to compare with results from other investigations. We send the data to the Ministry for the Environment / Manatū Mō Te Taiao when the ministry compiles national statistics on the state of the environment in New Zealand.
All the data we collect are stored in our water quality database and are publicly available through the Water Quality Samples search function in Environment Canterbury’s online data catalogue: data.ecan.govt.nz or on request to our Customer Services.
Annual groundwater quality survey 2016
Environment Canterbury 2
Glossary
Denitrification
Denitrification refers to a series of microbially assisted chemical reactions in which the nitrate anion is converted to other forms of nitrogen such as nitrous oxide or nitrogen gas. It occurs primarily in environments where there is no available oxygen (such as anoxic groundwater).
GV
GV stands for ‘Guideline Value’. It is set by the New Zealand Ministry of Health / Manatū Hauora as a threshold above which objectionable aesthetic effects may be observed, such as odour, taste, corrosion or staining problems (MoH, 2008). The GV is not a health-based limit.
MAV
MAV stands for ‘Maximum Acceptable Value’. It is set by the New Zealand Ministry of Health / Manatū Hauora to define water suitable for human consumption and hygiene (MoH, 2008). For most chemical parameters, the MAV is the highest concentration at which, based on present knowledge, the water is considered not to cause any significant risk to the health of the consumer over 70 years of consumption. For two of the parameters that we test, nitrate and E. coli, the MAV is set a bit differently. For nitrate, the MAV is a short-term exposure limit established to protect bottle-fed infants against blue baby syndrome. For E. coli, a concentration above the MAV may cause a significant risk of contracting a waterborne disease.
Median
In statistics, the median is the middle value in an ordered list of numbers. We use the median rather than the arithmetic mean (average) to summarise water quality because the mean may be biased by samples with very high or very low concentrations.
Nitrate nitrogen
This refers to the concentration of nitrate in water, calculated based on the mass of nitrogen in the nitrate anion. We record the concentration in milligrams of nitrogen per litre of water (mg/L).

Annual groundwater quality survey 2016
Environment Canterbury 3
The 2016 annual survey
From September to December 2016, we collected 342 samples (including 27 duplicate samples for quality control) from 315 wells across the Canterbury region.
Survey coverage
Figure 1 below shows the locations of the wells we sampled. The annual survey covered nine out of the ten Canterbury Water Management Strategy (CWMS) zones. The exception was Banks Peninsula, where there is not much groundwater resource potential and water supplies are derived mainly from surface water resources. The Selwyn-Waihora and Ashburton zones are heavy users of groundwater, and these two zones together accounted for 58% of the wells in the survey. Nine of the wells we regularly sample were dry in 2016 - eight of them in the Selwyn-Waihora and Ashburton zones.
Well depths
135 of the wells we sampled in our survey (43% of the total) had depths of 20 m or less. We sampled 98 wells with depths between 20 and 50 m, 50 wells with depths between 50 and 100 m and 27 wells that were more than 100 m deep. The deepest well sampled in our survey was located in the Ashburton zone and was 252 m deep.
Figure 1: Locations and depths of wells sampled in the 2016 annual survey
Annual groundwater quality survey 2016
Environment Canterbury 4
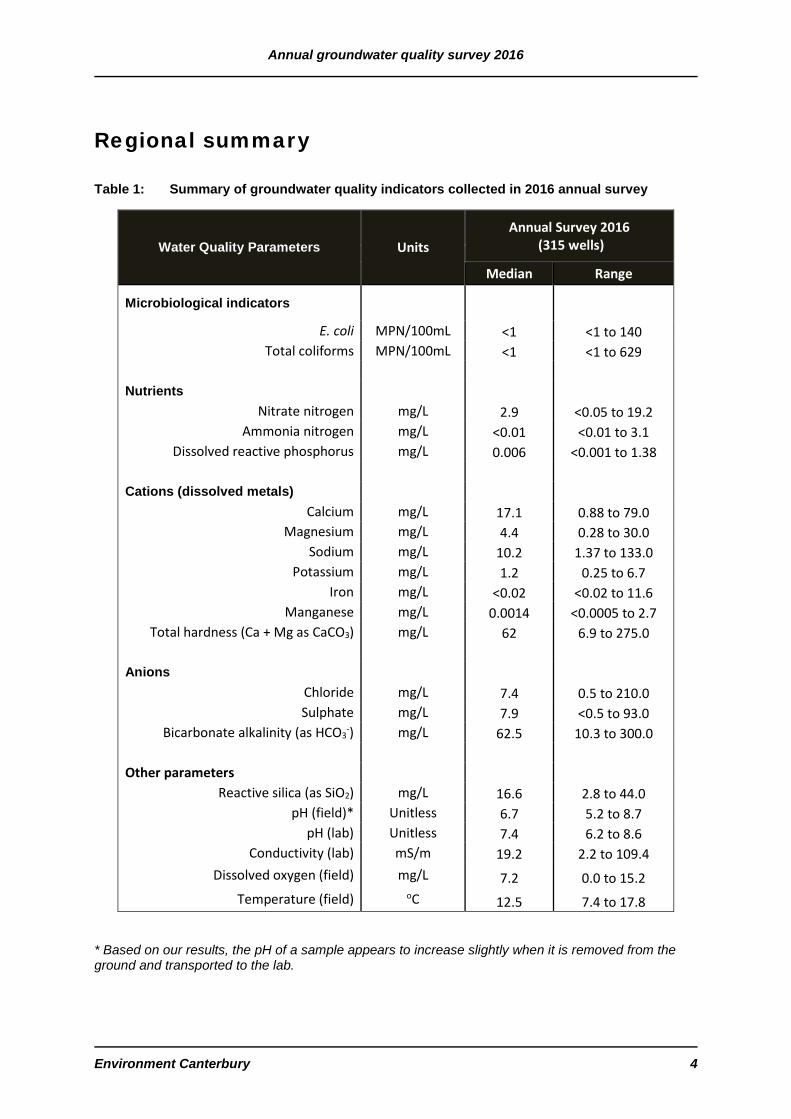
Regional summary
Table 1: Summary of groundwater quality indicators collected in 2016 annual survey
* Based on our results, the pH of a sample appears to increase slightly when it is removed from the ground and transported to the lab.
Water Quality Parameters Units Annual Survey 2016
(315 wells)
Median Range
Microbiological indicators
E. coli MPN/100mL <1 <1 to 140 Total coliforms MPN/100mL <1 <1 to 629
Nutrients
Nitrate nitrogen mg/L 2.9 <0.05 to 19.2 Ammonia nitrogen mg/L <0.01 <0.01 to 3.1
Dissolved reactive phosphorus mg/L 0.006 <0.001 to 1.38 Cations (dissolved metals)
Calcium mg/L 17.1 0.88 to 79.0 Magnesium mg/L 4.4 0.28 to 30.0
Sodium mg/L 10.2 1.37 to 133.0 Potassium mg/L 1.2 0.25 to 6.7
Iron mg/L <0.02 <0.02 to 11.6 Manganese mg/L 0.0014 <0.0005 to 2.7
Total hardness (Ca + Mg as CaCO3) mg/L 62 6.9 to 275.0
Anions Chloride mg/L 7.4 0.5 to 210.0 Sulphate mg/L 7.9 <0.5 to 93.0
Bicarbonate alkalinity (as HCO3-) mg/L 62.5 10.3 to 300.0
Other parameters
Reactive silica (as SiO2) mg/L 16.6 2.8 to 44.0 pH (field)* Unitless 6.7 5.2 to 8.7
pH (lab) Unitless 7.4 6.2 to 8.6 Conductivity (lab) mS/m 19.2 2.2 to 109.4
Dissolved oxygen (field) mg/L 7.2 0.0 to 15.2 Temperature (field) oC 12.5 7.4 to 17.8
Ann
ual g
roun
dwat
er q
ualit
y su
rvey
201
6
Envi
ronm
ent C
ante
rbur
y
5
Com
pari
son
to N
ew Z
eala
nd D
rink
ing-
wat
er S
tand
ards
C
ante
rbur
y gr
ound
wat
er is
wid
ely
used
as
a so
urce
of u
ntre
ated
drin
king
wat
er. W
e us
ed th
e N
ew Z
eala
nd D
rinki
ng-w
ater
Sta
ndar
ds (M
oH, 2
008)
to a
sses
s th
e gr
ound
wat
er q
ualit
y. T
able
2 s
umm
aris
es th
e nu
mbe
r of w
ells
in e
ach
CW
MS
zone
, and
in th
e re
gion
as
a w
hole
, whi
ch d
id n
ot m
eet t
he s
tand
ards
.
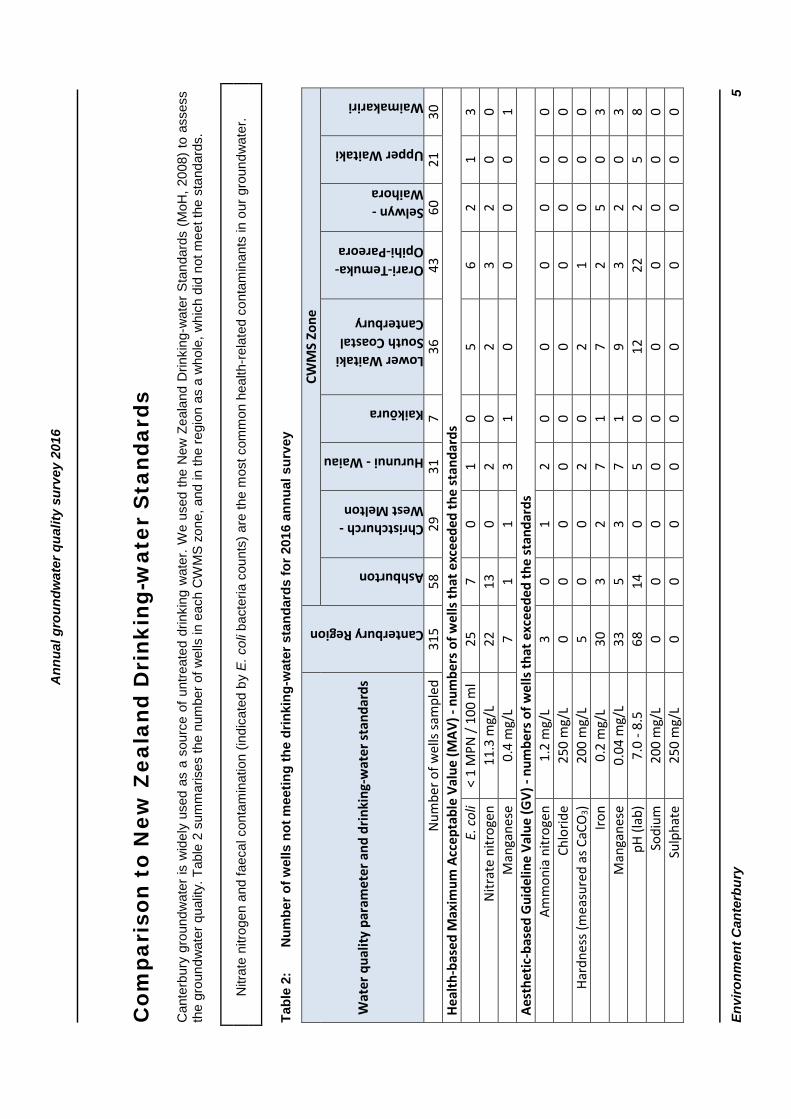
Nitr
ate
nitro
gen
and
faec
al c
onta
min
atio
n (in
dica
ted
by E
. col
i bac
teria
cou
nts)
are
the
mos
t com
mon
hea
lth-r
elat
ed c
onta
min
ants
in o
ur g
roun
dwat
er.
Tabl
e 2:
N
umbe
r of w
ells
not
mee
ting
the
drin
king
-wat
er s
tand
ards
for 2
016
annu
al s
urve
y
Wat
er q
ualit
y pa
ram
eter
and
drin
king
-wat
er st
anda
rds
Canterbury Region
CWM
S Zo
ne
Ashburton
Christchurch - West Melton
Hurunui - Waiau
Kaikōura
Lower Waitaki South Coastal Canterbury
Orari-Temuka-Opihi-Pareora
Selwyn - Waihora
Upper Waitaki
Waimakariri
Num
ber o
f wel
ls sa
mpl
ed
315
58
29
31
7 36
43
60
21
30
He
alth
-bas
ed M
axim
um A
ccep
tabl
e Va
lue
(MAV
) - n
umbe
rs o
f wel
ls th
at e
xcee
ded
the
stan
dard
s E.
col
i <
1 M
PN /
100
ml
25
7 0
1 0
5 6
2 1
3 N
itrat
e ni
trog
en
11.3
mg/
L 22
13
0
2 0
2 3
2 0
0 M
anga
nese
0.
4 m
g/L
7 1
1 3
1 0
0 0
0 1
Aest
hetic
-bas
ed G
uide
line
Valu
e (G
V) -
num
bers
of w
ells
that
exc
eede
d th
e st
anda
rds
Amm
onia
nitr
ogen
1.
2 m
g/L
3 0
1 2
0 0
0 0
0 0
Chlo
ride
250
mg/
L 0
0 0
0 0
0 0
0 0
0 Ha
rdne
ss (m
easu
red
as C
aCO
3) 20
0 m
g/L
5 0
0 2
0 2
1 0
0 0
Iron
0.2
mg/
L 30
3
2 7
1 7
2 5
0 3
Man
gane
se
0.04
mg/
L 33
5
3 7
1 9
3 2
0 3
pH (l
ab)
7.0
- 8.5
68
14
0
5 0
12
22
2 5
8 So
dium
20
0 m
g/L
0 0
0 0
0 0
0 0
0 0
Sulp
hate
25
0 m
g/L
0 0
0 0
0 0
0 0
0 0
Annual groundwater quality survey 2016
Environment Canterbury 6
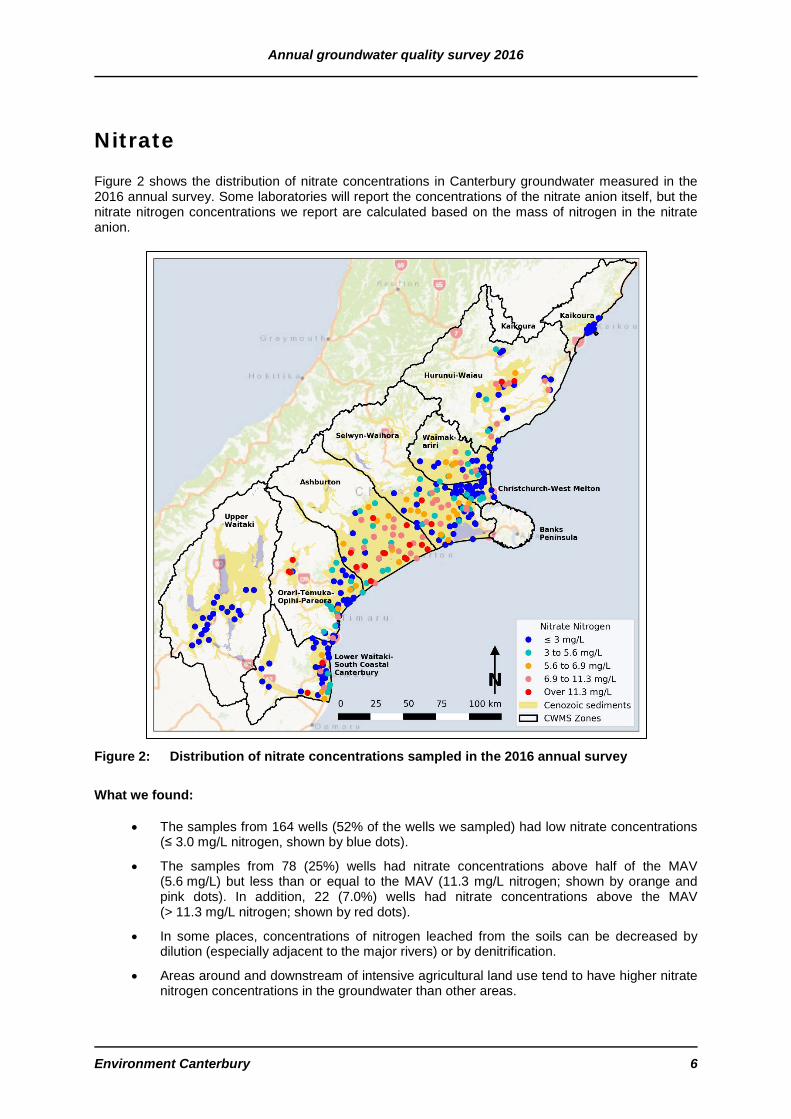
Nitrate Figure 2 shows the distribution of nitrate concentrations in Canterbury groundwater measured in the 2016 annual survey. Some laboratories will report the concentrations of the nitrate anion itself, but the nitrate nitrogen concentrations we report are calculated based on the mass of nitrogen in the nitrate anion.
Figure 2: Distribution of nitrate concentrations sampled in the 2016 annual survey
What we found:
• The samples from 164 wells (52% of the wells we sampled) had low nitrate concentrations (≤ 3.0 mg/L nitrogen, shown by blue dots).
• The samples from 78 (25%) wells had nitrate concentrations above half of the MAV (5.6 mg/L) but less than or equal to the MAV (11.3 mg/L nitrogen; shown by orange and pink dots). In addition, 22 (7.0%) wells had nitrate concentrations above the MAV (> 11.3 mg/L nitrogen; shown by red dots).
• In some places, concentrations of nitrogen leached from the soils can be decreased by dilution (especially adjacent to the major rivers) or by denitrification.
• Areas around and downstream of intensive agricultural land use tend to have higher nitrate nitrogen concentrations in the groundwater than other areas.
Annual groundwater quality survey 2016
Environment Canterbury 7
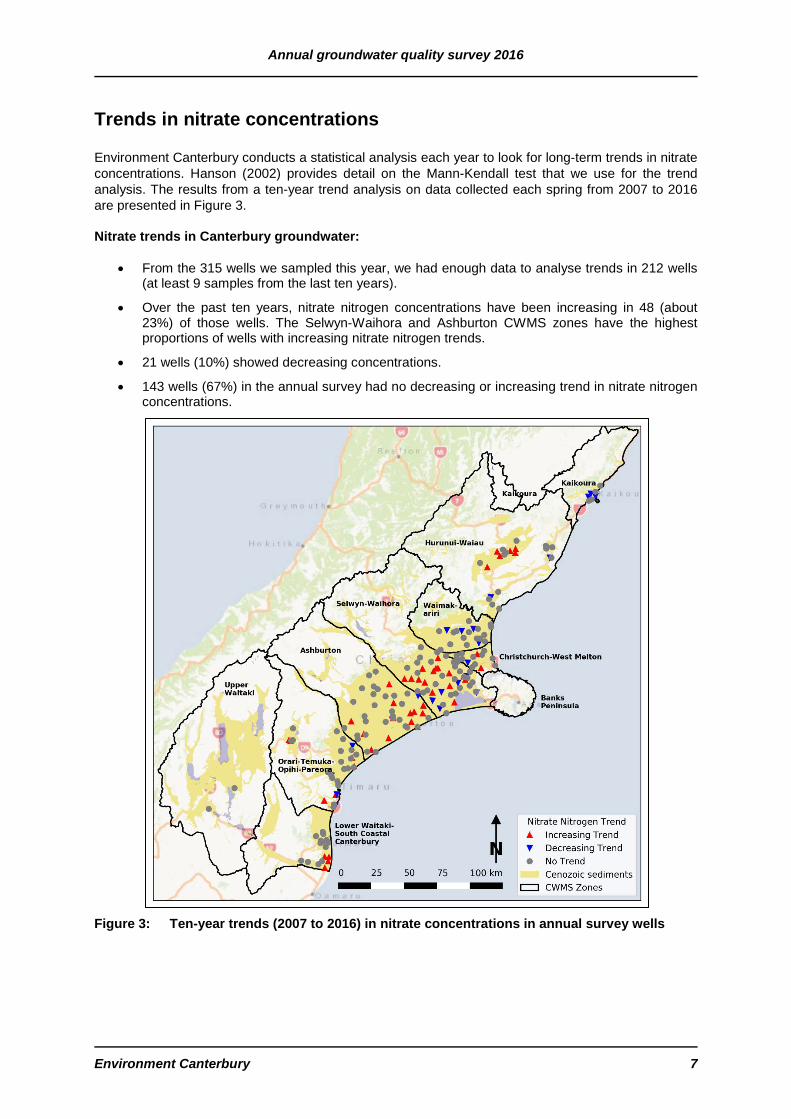
Trends in nitrate concentrations Environment Canterbury conducts a statistical analysis each year to look for long-term trends in nitrate concentrations. Hanson (2002) provides detail on the Mann-Kendall test that we use for the trend analysis. The results from a ten-year trend analysis on data collected each spring from 2007 to 2016 are presented in Figure 3. Nitrate trends in Canterbury groundwater:
• From the 315 wells we sampled this year, we had enough data to analyse trends in 212 wells (at least 9 samples from the last ten years).
• Over the past ten years, nitrate nitrogen concentrations have been increasing in 48 (about 23%) of those wells. The Selwyn-Waihora and Ashburton CWMS zones have the highest proportions of wells with increasing nitrate nitrogen trends.
• 21 wells (10%) showed decreasing concentrations.
• 143 wells (67%) in the annual survey had no decreasing or increasing trend in nitrate nitrogen concentrations.
Figure 3: Ten-year trends (2007 to 2016) in nitrate concentrations in annual survey wells

Annual groundwater quality survey 2016
Environment Canterbury 8
Dissolved reactive phosphorus Figure 4 below shows the distribution of Dissolved Reactive Phosphorus (DRP) collected in the 2016 annual survey. DRP in groundwater could be coming from several sources, either natural or from human activities such as farming or discharge of effluent. DRP plays a role in a surface waterbody’s ability to support algae and plant growth.
Figure 4: Distribution of dissolved reactive phosphorus concentrations sampled in the 2016
annual survey
What we found:
• The DRP concentrations in Canterbury groundwater are generally low (< 0.009 mg/L). • The wells at the coastal areas appear to have greater DRP concentrations than inland wells. • There is no strong correlation between DRP concentration and well depth. • High DRP concentrations in some of the wells are probably from phosphorus-bearing rocks or
sediments. • The highest DRP concentration recorded in the 2016 survey was 1.38 mg/L and this sample
came from a 5.2 m deep well at Hurunui-Waiau CWMS zone. This well also had high concentrations of ammonia, iron and manganese that exceeded the limits in the New Zealand Drinking-water Standards (MoH, 2008).

Annual groundwater quality survey 2016
Environment Canterbury 9
Trends in dissolved reactive phosphorus concentrations This is the first year that Environment Canterbury has enough data (at least five samples collected over the last ten years) to conduct a statistical analysis to look for long-term trends in dissolved reactive phosphorus concentrations. Where we have enough data, it was typically sampled early in the period (2007-2008) and late in the period (2014-2016) with a data gap in the middle years (2009-2013). Hanson (2002) provides detail on the Mann-Kendall test that we use for the trend analysis. We have collected fewer dissolved reactive phosphorus concentration measurements over the last 10 years than nitrate nitrogen so these trend results are less statistically robust. The results from a ten-year trend analysis on available DRP data are presented in Figure 5. Dissolved reactive phosphorus trends in Canterbury groundwater:
• From the 315 wells we sampled this year, we had enough data to analyse trends in 206 wells.
• Over the past ten years, DRP concentrations have been increasing in only three (about 1%) of those wells. These wells have low DRP concentrations (< 0.007 mg/L). They are not related spatially or by depth or geology and they all have different trends in nitrate nitrogen concentrations.
• Nine wells (4%) showed decreasing concentrations of DRP.
• 194 wells (95%) in the annual survey had no decreasing or increasing trend in DRP concentrations.
Figure 5: Ten-year trends (2007 to 2016) in dissolved reactive phosphorus concentrations in
annual survey wells

Annual groundwater quality survey 2016
Environment Canterbury 10
E. coli We test for the presence and quantity of E. coli bacteria in water as an indicator of contamination from faecal material. Detections of E. coli show no strong geographical pattern, but they are most common in shallower wells. Shallow groundwater throughout the region is vulnerable to faecal contamination. In the 2016 annual survey:
• E. coli was detected in 25 (7.9%) of the wells we sampled. This was a slightly higher detection rate than the previous year (we detected E. coli in the samples from 22 (6.7%) wells in our 2015 survey).
• Sixteen samples with E. coli detections came from wells less than 20 m deep and 9 samples with E. coli detections came from wells deeper than 20 m.
• We found one well with E. coli present (1 MPN/100ml) that is screened from 90 to 100 m below ground. Wells installed at such depth generally have less risk of microbial contamination and this deep well has not had any positive E.coli records in the past. Other deep wells with E. coli present were 86 m deep (2 MPN/100 ml) and 68 m deep (58 MPN/100 ml). These wells are not related spatially.
Figure 6: E. coli results from the 2016 annual survey

Annual groundwater quality survey 2016
Environment Canterbury 11
Manganese and iron
• As in previous years, concentrations of manganese and iron were generally low (below the limits stated in NZDWS) in most of the wells we sampled in the 2016 survey.
• Higher concentrations are generally natural, but they can also be related to discharges, such as leachate from old landfill sites.
• Seven sampled wells (2.2%) had manganese concentrations above the health-based MAV (0.4 mg/L).
• Fifteen wells (5.7%) had only manganese concentrations above the GV (0.04 mg/L); 12 wells (3.8%) had only iron concentrations above the GV (0.2 mg/L) and 18 wells (5.7%) had both managnase and iron concentrations over the GV.
Figure 7: Distribution of manganese concentrations sampled from the 2016 annual survey

Annual groundwater quality survey 2016
Environment Canterbury 12
Figure 8: Distribution of iron concentrations sampled from the 2016 annual survey
Summary and conclusion • We sampled groundwater from 315 wells across the Canterbury region in our 2016 annual
groundwater quality survey.
• The samples from 22 wells (7.0%) had nitrate nitrogen concentrations above the health-based Maximum Acceptable Value (MAV). This was very similar to the previous year’s survey (22 wells and 6.7% of sampled wells). E. coli were detected in the samples from 25 wells, which was an increase from the previous survey (22 wells).
• We found increasing trends in nitrate concentrations in 23% of the wells where we could analyse trends over the past ten years. The concentrations in 67% of the wells showed no trends, while only 10% of the wells showed decreasing trends.
• Nearly two-thirds of the wells in Canterbury region had low Dissolved Reactive Phosphorus (DRP) concentrations below 0.009 mg/L and there are no strong correlations between DRP concentrations and the depth.
• We found increasing trends in dissolved reactive phosphorus concentrations in only 1% of the wells where we could analyse trends over the past ten years. The concentrations in 95% of the wells showed no trends, and 4% of the wells showed decreasing trends
• The samples from some wells did not meet the aesthetic Guideline Value (GV) for hardness, iron, manganese, pH, and ammonia. These results were very similar to previous surveys.


Annual groundwater quality survey 2016
Acknowledgements This report was prepared by Matt Hanson of Environment Canterbury. The report was reviewed by Lisa Scott, Maureen Whalen, Hisham Zarour and Carl Hanson. Dave Evans, Ross Cressy, Shaun Philip and Hamish Carrad collected the groundwater samples.
References Hanson, C., 2002. Nitrate concentrations in Canterbury groundwater – a review of existing data. Environment Canterbury technical report R02/17. MfE, 2006. A national protocol for State of the Environment groundwater sampling in New Zealand. Published by the New Zealand Ministry for the Environment, Wellington. 52 pages. MoH, 2008. Drinking-Water Standards for New Zealand 2005 (revised 2008). Published by the New Zealand Ministry of Health, Wellington. 163 pages.
Environment Canterbury Report No. R17/17 ISBN 978-1-98-852037-7 (print)
978-1-98-852038-4 (web)


