33
| Date post: | 18-Dec-2015 |
| Category: |
Documents |
| Upload: | anissa-garrison |
| View: | 218 times |
| Download: | 1 times |

Outline
Introduction
Objectives
Analysis
Design
BOQ
Recommendation

Road Description
The Deir Sharaf-Bazzarya Road is considered a part of the national highway, and the longest one the West Bank.
Which is Highway 60 that connects between Jenin in the north up to Hebron in the south, passing through most governorates of the West Bank.
The length of Deir Sharaf-Bazzarya segment after design is 7.67Km.
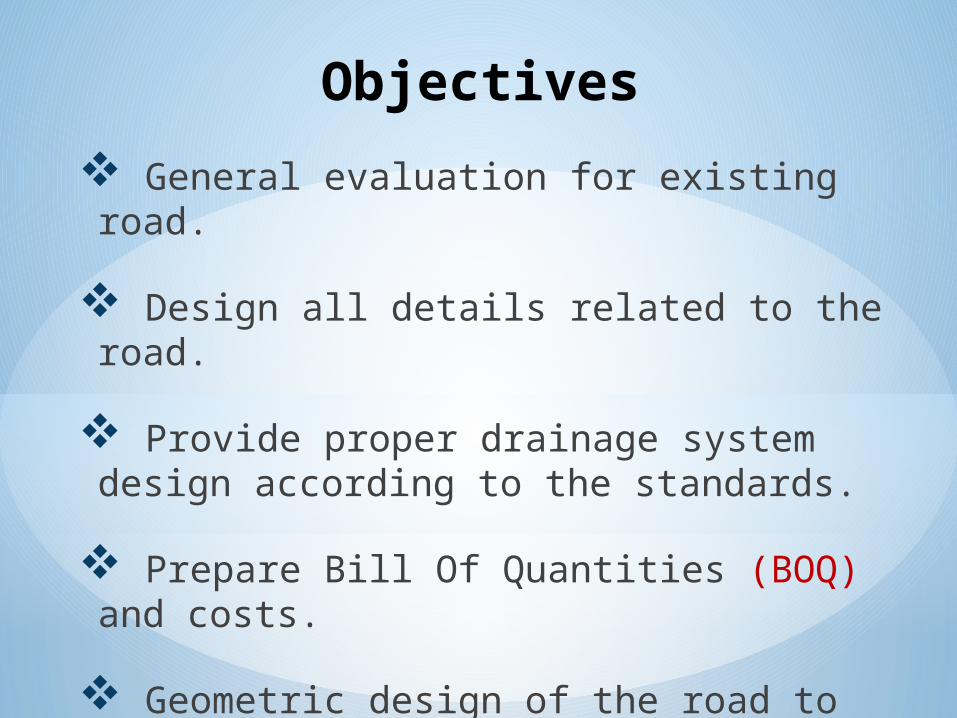
Objectives
General evaluation for existing road.
Design all details related to the road.
Provide proper drainage system design according to the standards.
Prepare Bill Of Quantities (BOQ) and costs.
Geometric design of the road to accomplish the standards, taking in the consideration as possible as the existing right of way.
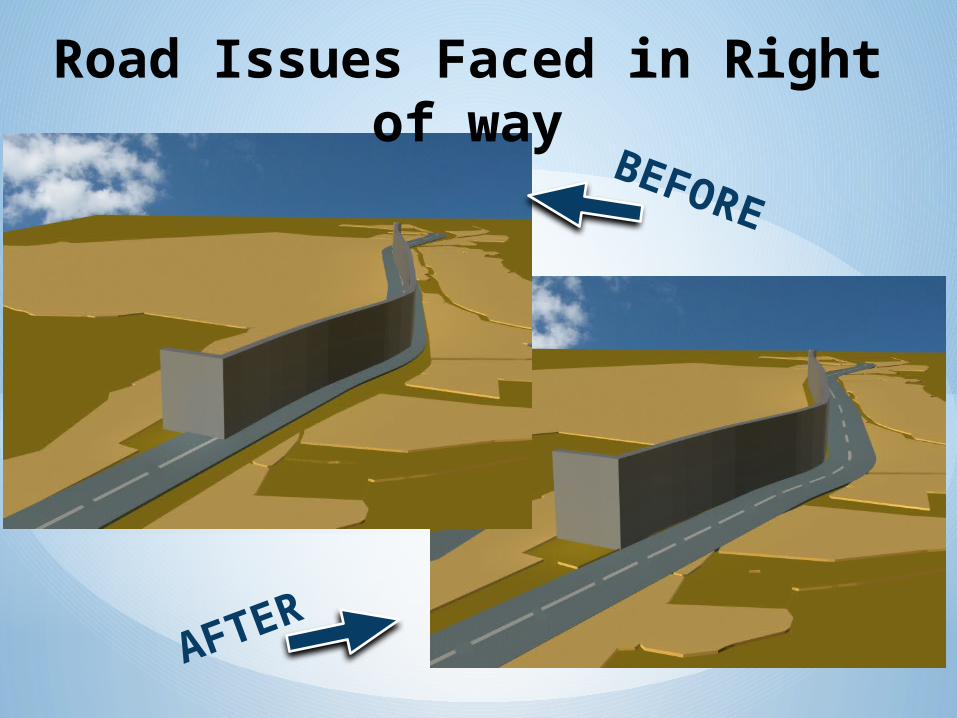
BEFORE
AFTER
Road Issues Faced in Right of way
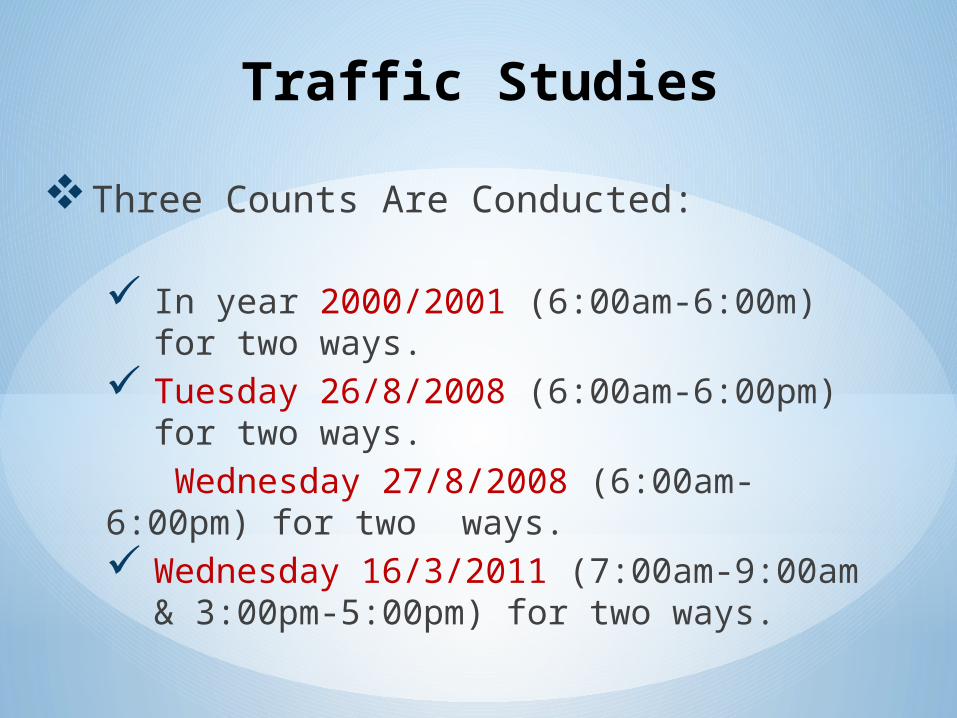
Traffic Studies
Three Counts Are Conducted:
In year 2000/2001 (6:00am-6:00m) for two ways.
Tuesday 26/8/2008 (6:00am-6:00pm) for two ways.
Wednesday 27/8/2008 (6:00am-6:00pm) for two ways. Wednesday 16/3/2011 (7:00am-9:00am &
3:00pm-5:00pm) for two ways.

Results of traffic counts
Date of Count
(Peak Hour)
PH
PHV
(Veh/hr)
2000-2001 3:30 – 4:30 PM 571
2008Tue 3:00 – 4:00 PM 242
Wed 8:00 – 9:00 AM 265
2011 4:00 – 5:00 PM 328

Growth Rate & PHV Analysis
Sum of 4 hr. in year 2000/2001 (7:00am-9:00am & 3:00pm-5:00pm) for two ways = 1890 veh.
Sum of 4 hr. in year 2011 (7:00am-9:00am & 3:00pm-5:00pm) for two ways = 2841 veh.
Annual growth rate between years (2000-2008) is
2464=5052(1+i)8 -8.58%. This is not logical value.
Annual growth rate between years (2000-2011) is
2841=1890(1+i)11 3.77%. This is a logical value.
In This Project, this value will be applied for next 20 years.
Thus, the Peak hour Volume after 20 years (in 2031)
= 328(1+0.037)20 = 678 veh/hr.
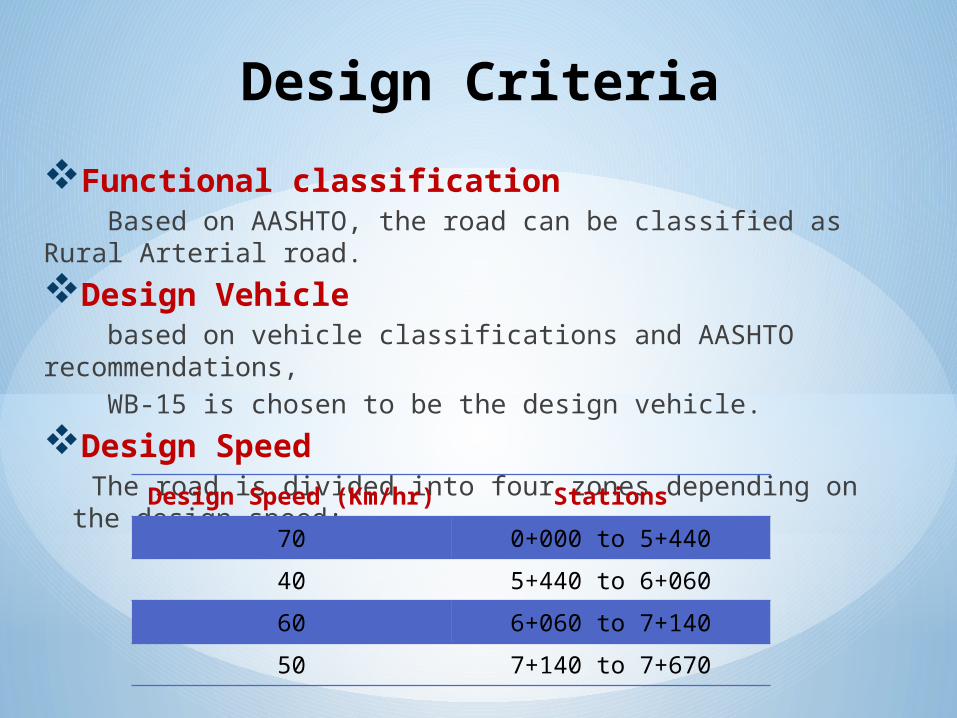
Design Criteria
Functional classification Based on AASHTO, the road can be classified as Rural Arterial road.
Design Vehicle based on vehicle classifications and AASHTO recommendations, WB-15 is chosen to be the design vehicle.
Design Speed The road is divided into four zones depending on the design
speed:Design Speed (Km/hr) Stations
70 0+000 to 5+440
40 5+440 to 6+060
60 6+060 to 7+140
50 7+140 to 7+670
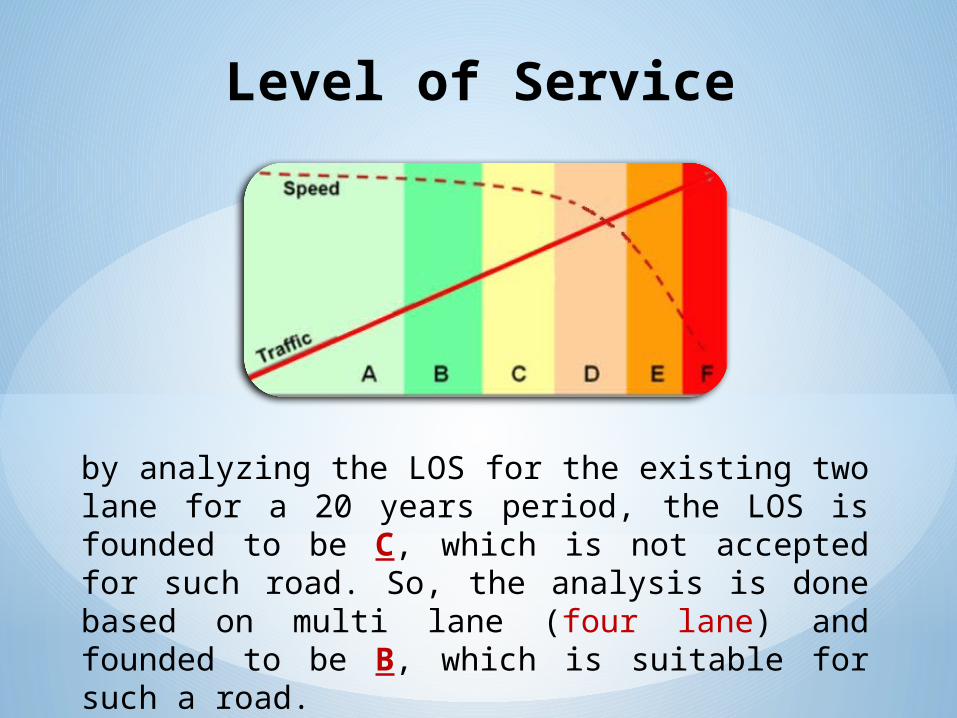
Level of Service
by analyzing the LOS for the existing two lane for a 20 years period, the LOS is founded to be C, which is not accepted for such road. So, the analysis is done based on multi lane (four lane) and founded to be B, which is suitable for such a road.

Design Criteria for Horizontal Curves
Max. f Min. Radius(m)
Design Speed(km/hr)
0.15 154 70
0.23 50 40
0.17 130 60
0.19 90 50
Side Friction Factor (f): affected by Design Speed
Based on AASHTO design Superelevation rate is 10%
Minimum Radius
Superelevation
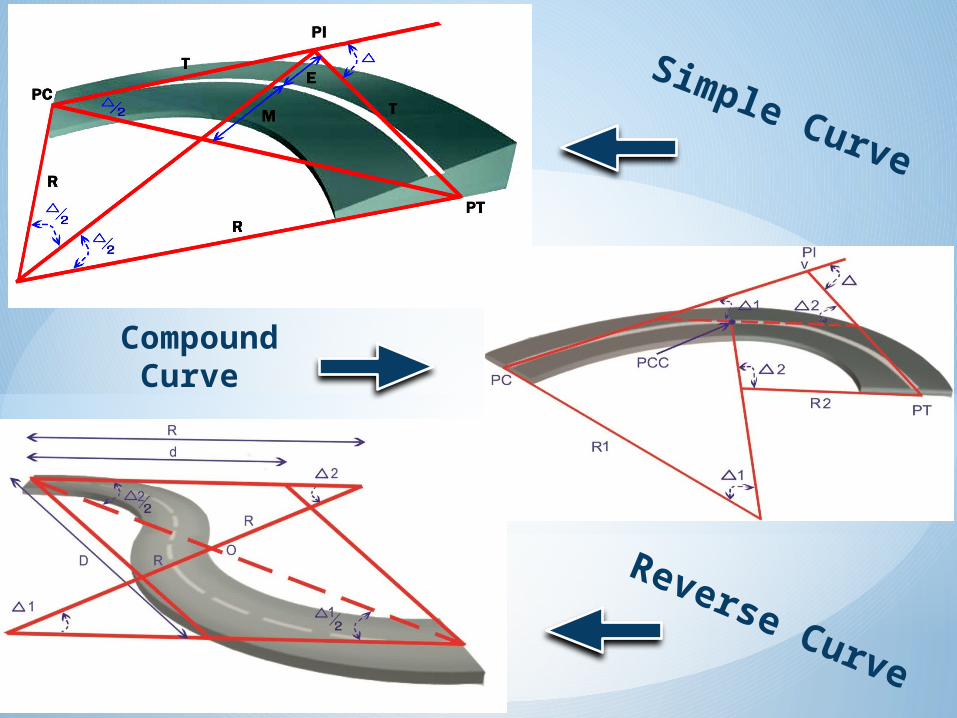
Compound Curve
Simple Curve
Reverse Curve
Design Criteria for Vertical Curves
Terrain Here in case of (Deir Sharaf - Bazzarya Road) the area can be categorized as rolling terrain, but in some of locations are classified as mountainous terrain.
Grade Since the terrain is rolling, in the project design the grade reach the max. grade which is 6%, and also the min. grade equal 0.5%. For mountainous terrain 8% maximum grade is selected.

Road Issues Faced in Geometric Design Phase
Sharp Curves
The Right of way (R.O.W) is an old planned and may not be appropriate for the modern design.

ITERATION 1
ITERATION 2

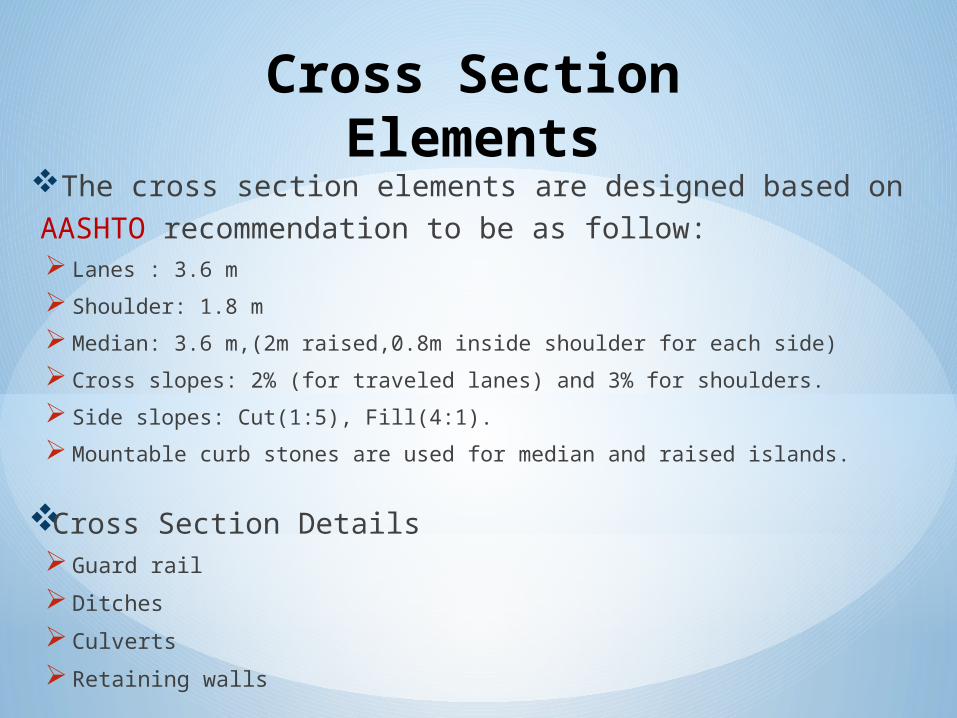
Cross Section Elements
The cross section elements are designed based on AASHTO recommendation to be as follow: Lanes : 3.6 m
Shoulder: 1.8 m
Median: 3.6 m,(2m raised,0.8m inside shoulder for each side)
Cross slopes: 2% (for traveled lanes) and 3% for shoulders.
Side slopes: Cut(1:5), Fill(4:1).
Mountable curb stones are used for median and raised islands.
Cross Section Details Guard rail
Ditches
Culverts
Retaining walls

Typical Cross Section
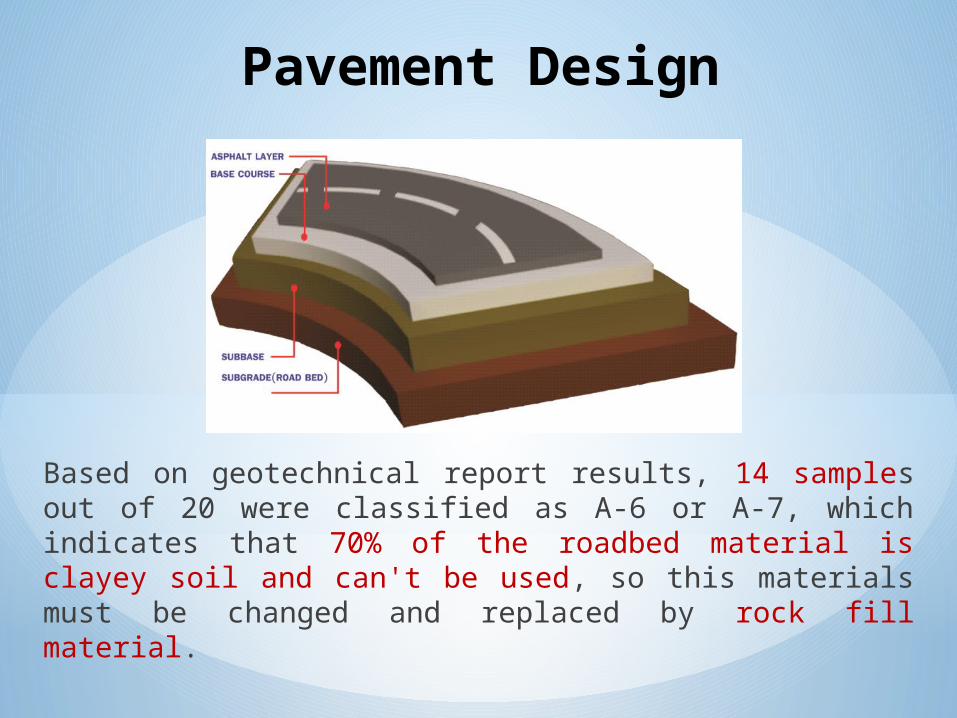
Pavement Design
Based on geotechnical report results, 14 samples out of 20 were classified as A-6 or A-7, which indicates that 70% of the roadbed material is clayey soil and can't be used, so this materials must be changed and replaced by rock fill material.

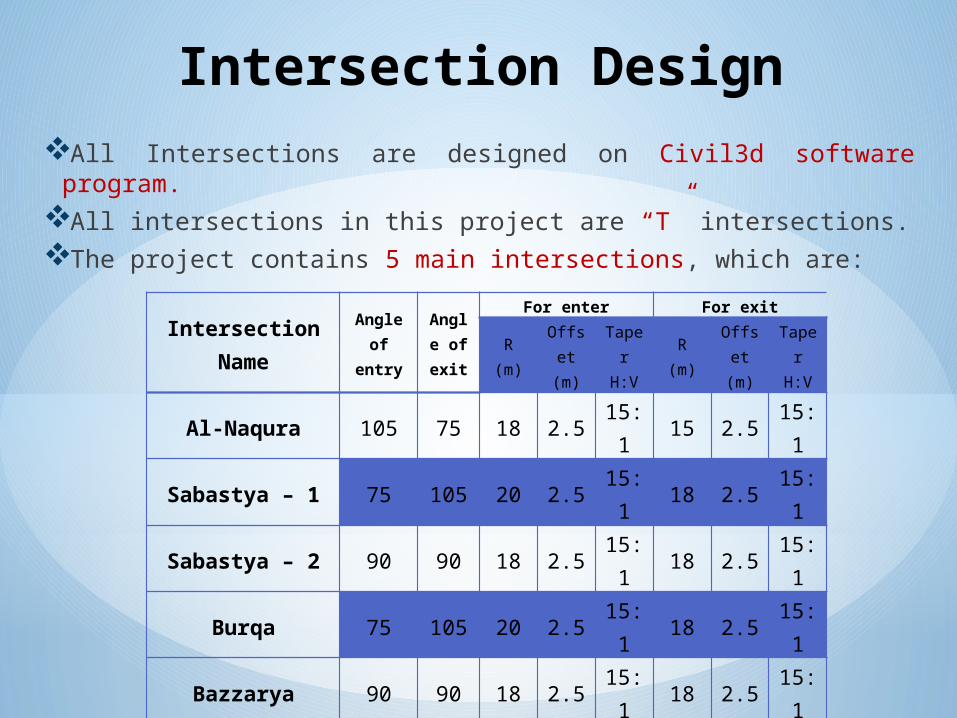
Intersection Design
All Intersections are designed on Civil3d software program.All intersections in this project are “T” intersections.The project contains 5 main intersections, which are:
IntersectionName
Angle of
entry
Angle of exit
For enter For exit
R(m)
Offset(m)
TaperH:V
R(m)
Offset(m)
TaperH:V
Al-Naqura 105 75 18 2.5 15:1 15 2.5 15:1
Sabastya – 1 75 105 20 2.5 15:1 18 2.5 15:1
Sabastya – 2 90 90 18 2.5 15:1 18 2.5 15:1
Burqa 75 105 20 2.5 15:1 18 2.5 15:1
Bazzarya 90 90 18 2.5 15:1 18 2.5 15:1


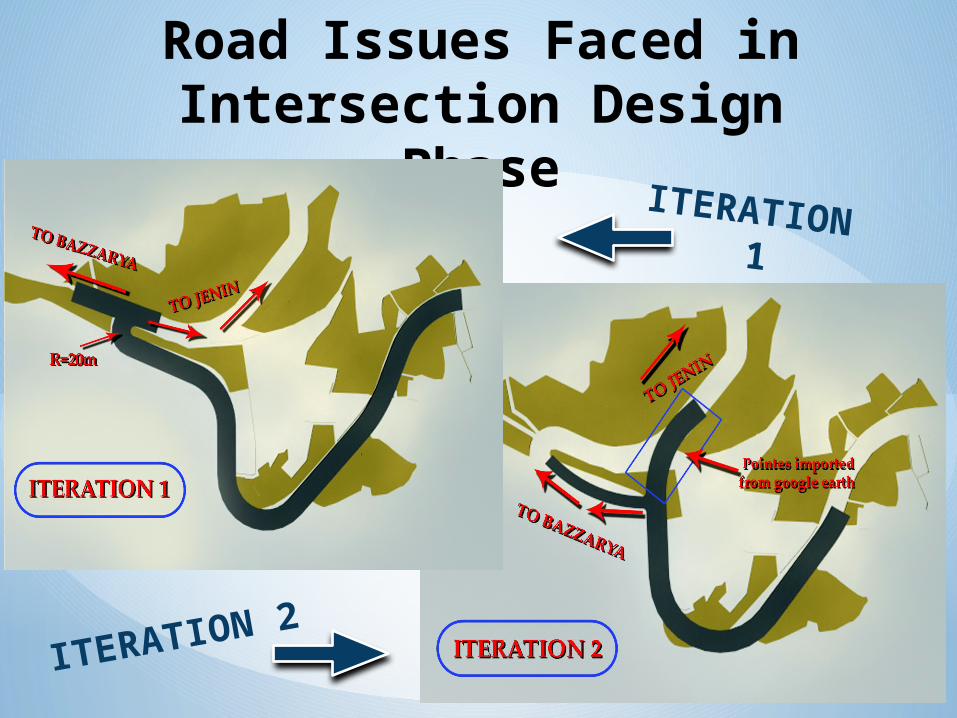
Road Issues Faced in Intersection Design
Phase
ITERATION 1
ITERATION 2

Drainage DesignHydrologic Analysis:
Five locations of culverts are determined depending on the geometric and hydrologic considerations of the road, each culvert will carry known amount of water coming from one or more catchment areas that analyzed and calculated by using AutoCAD Civil 3D Software.The amounts of water were calculated by two methods:
1- Manually by using rational method equation.
2- Bentley Civil Storm Software which depends on modified rational method.
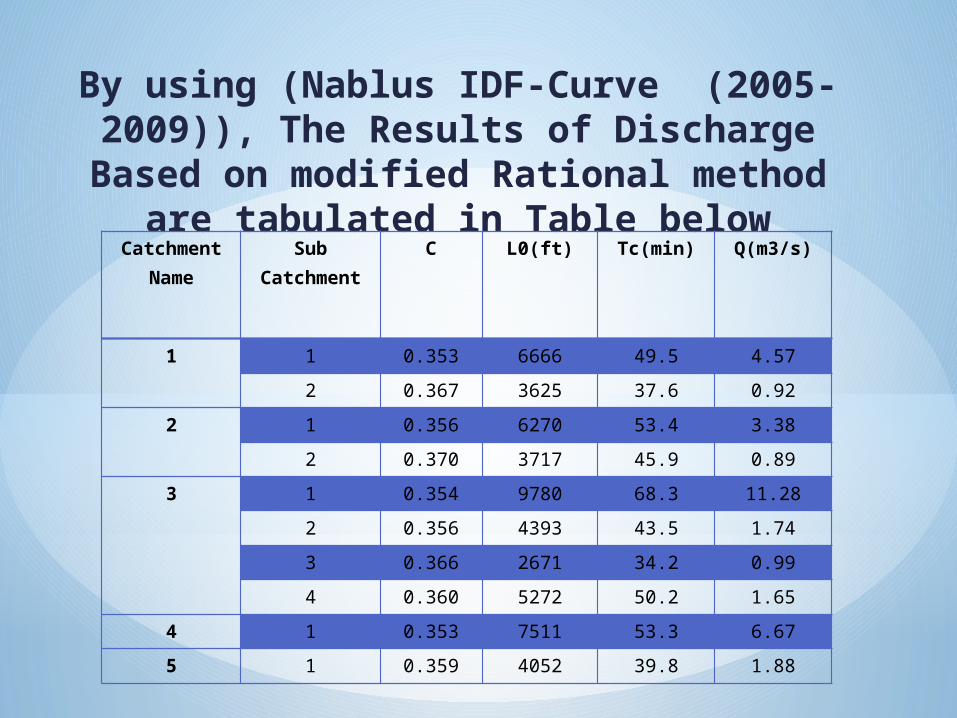
By using (Nablus IDF-Curve (2005-2009)), The Results of Discharge
Based on modified Rational method are tabulated in Table below
Catchment Name
Sub Catchment
C L0(ft) Tc(min) Q(m3/s)
1 1 0.353 6666 49.5 4.57
2 0.367 3625 37.6 0.92
2 1 0.356 6270 53.4 3.38
2 0.370 3717 45.9 0.89
3 1 0.354 9780 68.3 11.28
2 0.356 4393 43.5 1.74
3 0.366 2671 34.2 0.99
4 0.360 5272 50.2 1.65
4 1 0.353 7511 53.3 6.67
5 1 0.359 4052 39.8 1.88

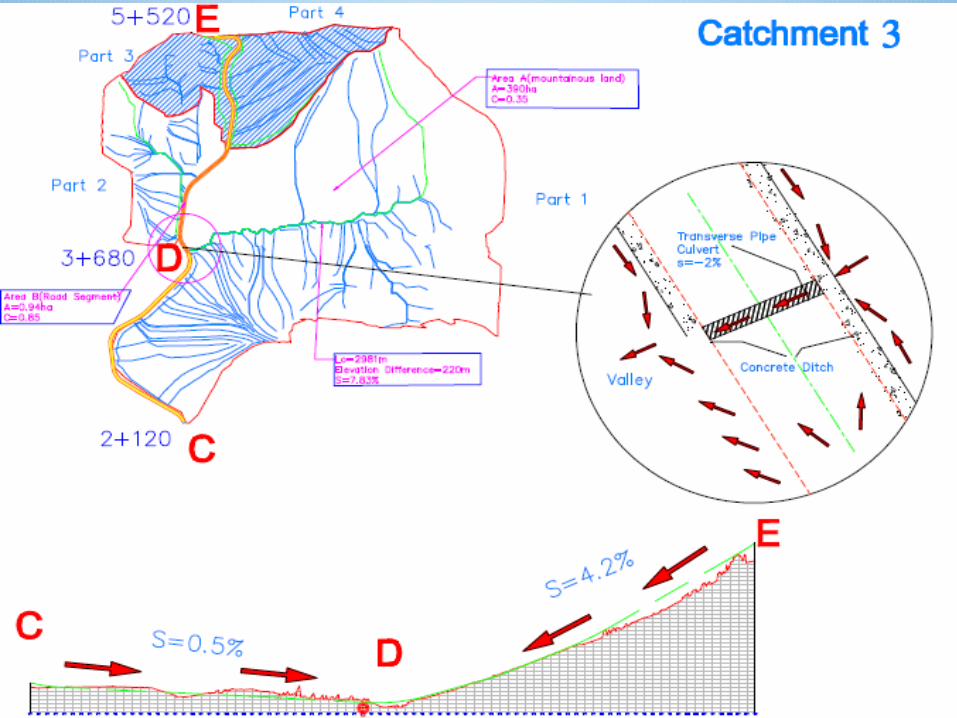
The maximum discharge shown in catchment (3), sub-catchment ( 1 ) as
shown in civil storm model below

Ditch CheckCulver
t #Number of Pipes
Culvert STA
Design D(mm
)
Slope (%)
Velocity
(m/s)
Hw(m)
1 1 0+000 800 2 1.83 0.94
2 1 2+120 1400 1.5 2.01 1.43
3 3 3+680 1400 1.5 2.40 1.65
4 2 5+520 1400 1.5 2.14 1.48
5 1 6+720 1000 1.5 2.38 1.40
Culvert Design Results

Item Unit Quantity Unit price) ( $ Total price) ($
Earth WorksExcavation m3 368378.66 5 1841893
Embankment construction m3 344742.72 6 2068456
Earth works 3910349Sub-Base And Base course
Sub-base course m3 35889.55 18 646012
Base-course m3 26138.72 27 705745
Rock Fill m3 71779.1 5 358895
Sub-base and base course 1710652Bituminous Construction
Prime Coat(MC) m2 156712.86 1.5 2350697 cm thickness asphalt m2 156712.86 15 2350692
Bituminous construction 2585762Miscellaneous Works
Traffic signs No. 117 100 11700Curbstones for median m 15030 20 300600
Curbstones for islands m 282 18 5076Cat Eyes No. 5114 10 51140
Guard Rail m 2720 100 272000
Retaining Walls m3 11627 170 1976590Longitudinal yellow traffic marking m 15340 2 30680Longitudinal white traffic marking m 20453 2 40906
Object marking(Arrows) m2 146.69 9 1321Miscellaneous works 2690013Drainage system works
Concrete Ditches m 7920 50 396000Proposed Culverts(D-80cm) m 25 450 11250
Proposed Culverts(D-40cm) m 200 300 60000Proposed Culverts(D-100cm) m 25 500 12500Proposed Culverts(D-140cm) m 170 600 102000
Drainage system works 581750
CostTotal 11478526

Recommendations
1- Wide the right of way to be more free in design, especially in horizontal alignment, and design more smooth circular curves.
2- Survey some locations of the project.
3- Make a geotechnical report for side slope stability and use retaining wall if its required.
4- Take the land ownership issue in consideration for calculating the total budgeted cost of the project.


