79
1-1 Introduction to Operations Management Introduction- Operations as a Competitive Weapon
| Date post: | 17-Aug-2015 |
| Category: |
Data & Analytics |
| Upload: | aman-choudhary |
| View: | 96 times |
| Download: | 0 times |
1-1 Introduction to Operations Management
Introduction- Operations as a Competitive
Weapon
1-2 Introduction to Operations Management
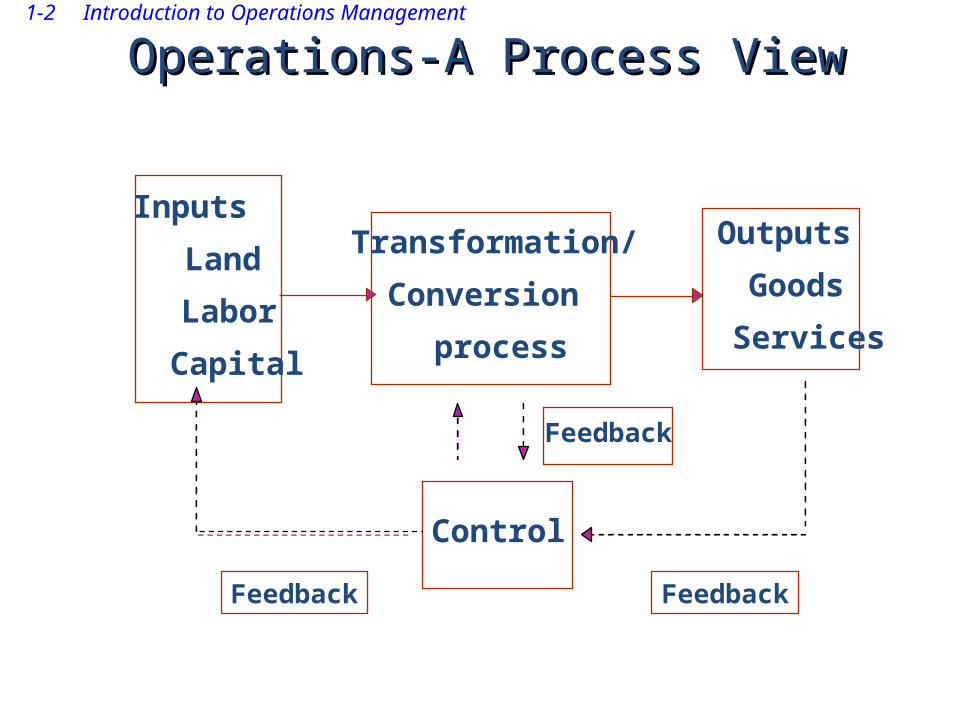
Operations-A Process ViewOperations-A Process View
Inputs
Land
Labor
Capital
Transformation/
Conversion
process
Outputs
Goods
Services
Control
Feedback
FeedbackFeedback
1-3 Introduction to Operations Management
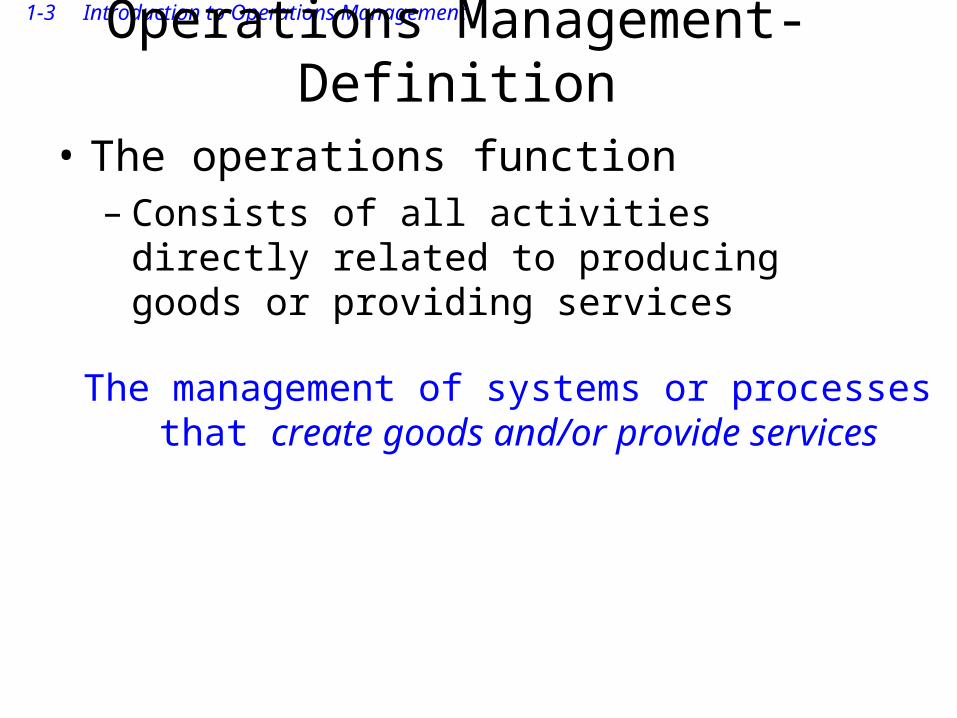
Operations Management-Definition
• The operations function– Consists of all activities directly related to
producing goods or providing services
The management of systems or processes that create goods and/or provide services
1-4 Introduction to Operations Management
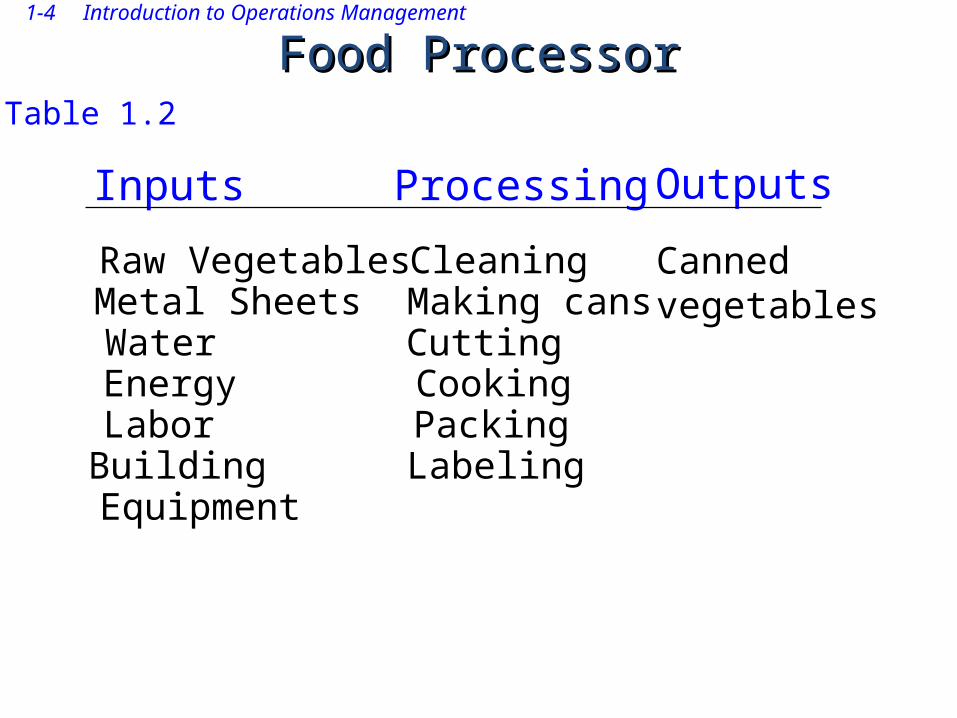
Food ProcessorFood Processor
Inputs Processing Outputs
Raw Vegetables Cleaning Canned vegetables Metal Sheets Making cans
Water CuttingEnergy CookingLabor PackingBuilding LabelingEquipment
Table 1.2
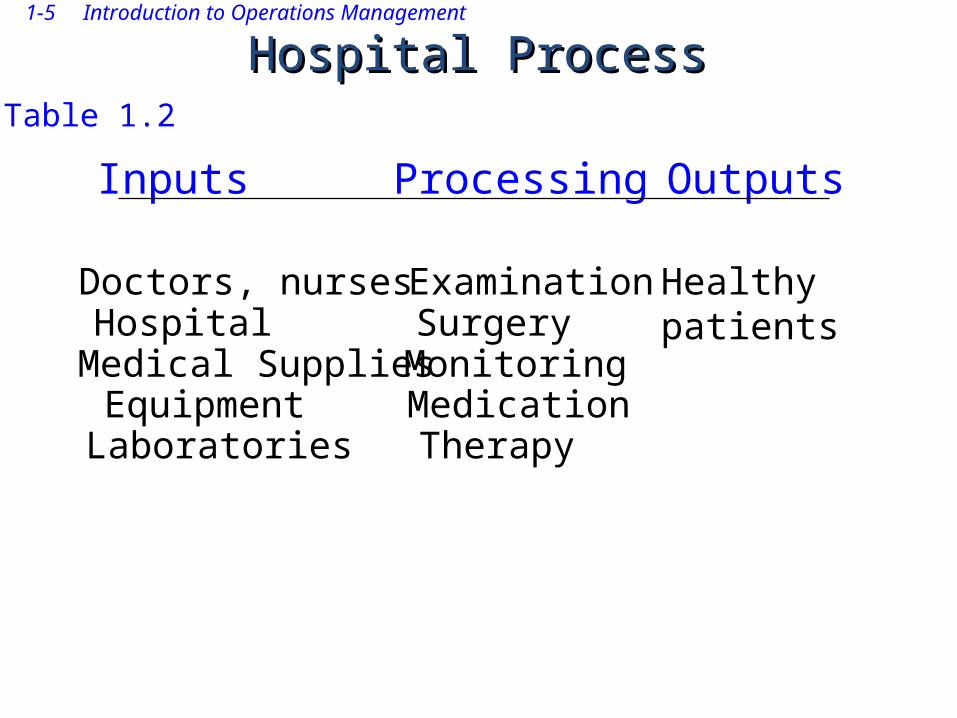
1-5 Introduction to Operations Management
Hospital ProcessHospital Process
Inputs Processing Outputs
Doctors, nurses Examination Healthy patientsHospital Surgery
Medical Supplies MonitoringEquipment MedicationLaboratories Therapy
Table 1.2
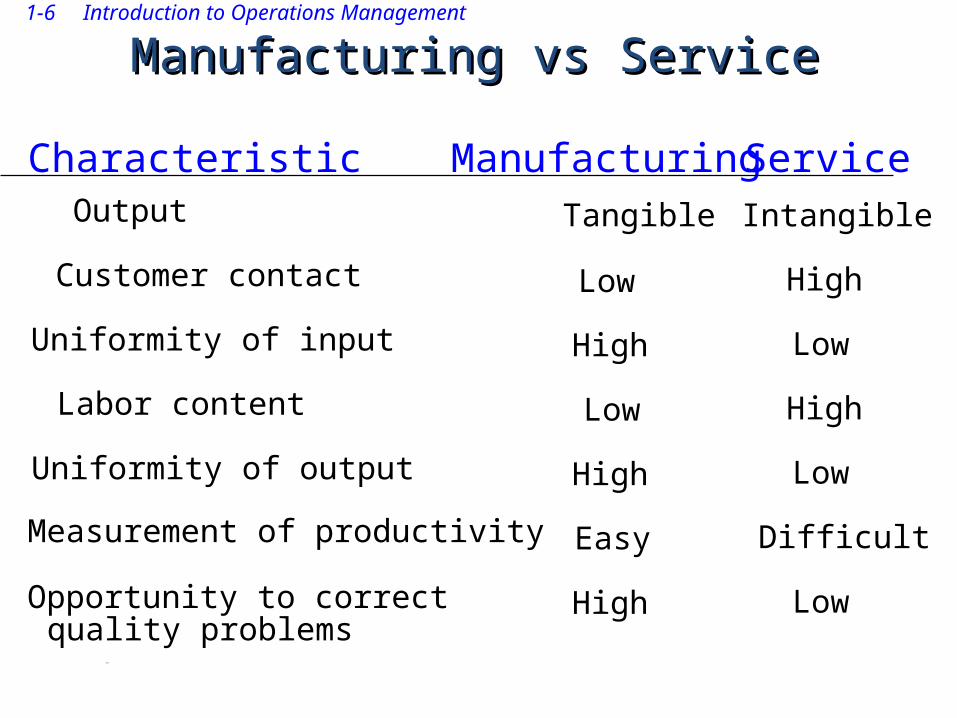
1-6 Introduction to Operations Management
Manufacturing vs ServiceManufacturing vs Service
Characteristic Manufacturing ServiceOutput
Customer contact
Uniformity of input
Labor content
Uniformity of output
Measurement of productivity
Opportunity to correct
Tangible
Low
High
Low
High
Easy
High
Intangible
High
Low
High
Low
Difficult
Lowquality problems
High
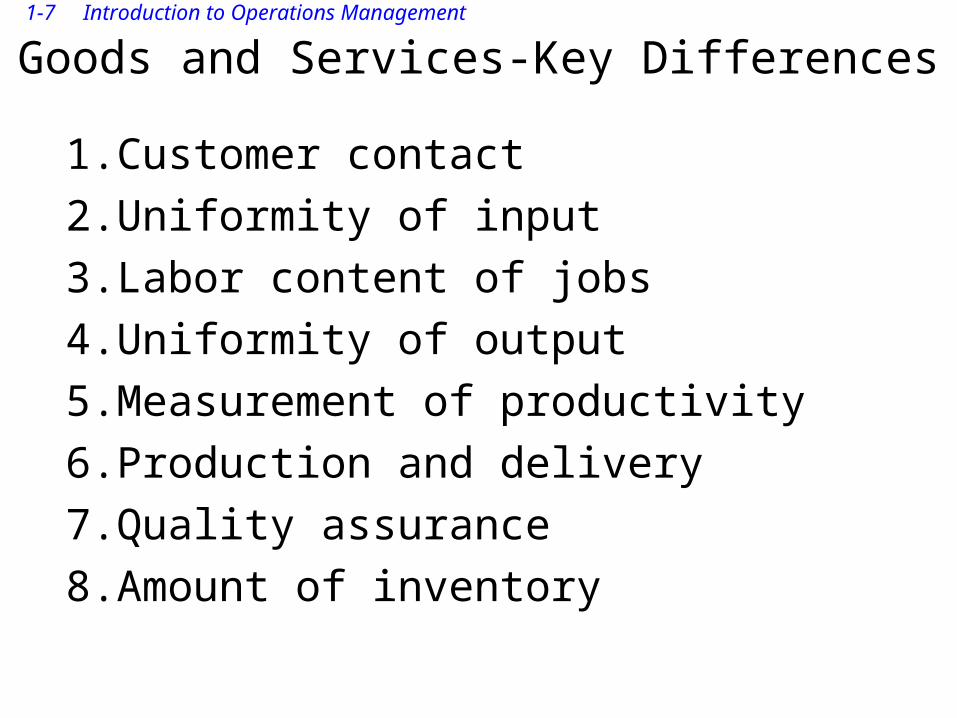
1-7 Introduction to Operations Management
Goods and Services-Key Differences
1. Customer contact2. Uniformity of input3. Labor content of jobs4. Uniformity of output5. Measurement of productivity6. Production and delivery7. Quality assurance8. Amount of inventory
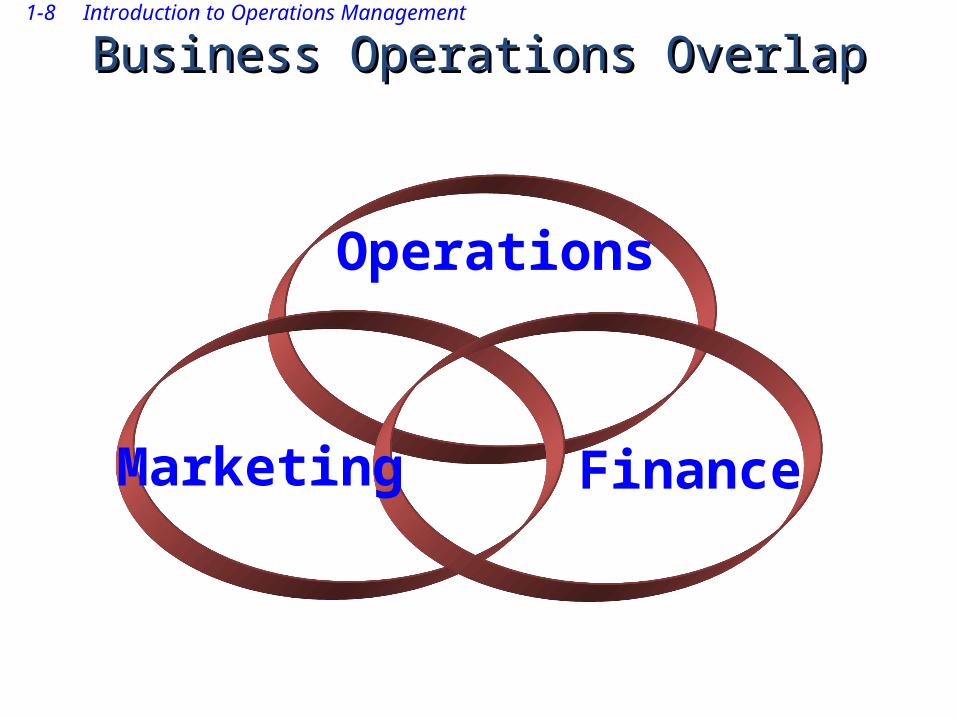
1-8 Introduction to Operations Management
Business Operations OverlapBusiness Operations Overlap
Operations
FinanceMarketing
1-9 Introduction to Operations Management
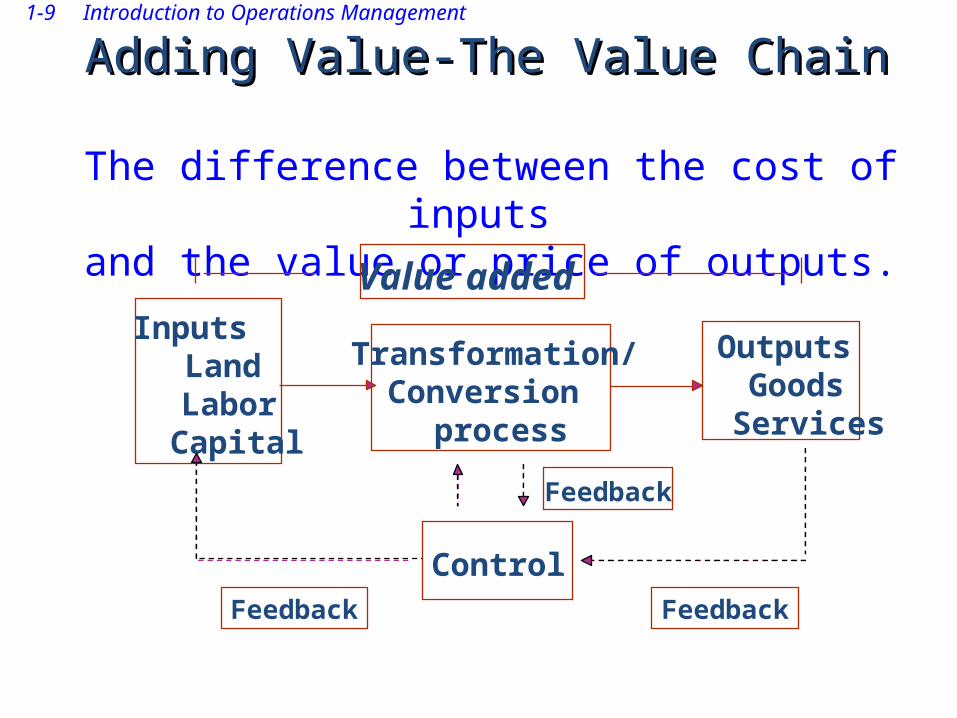
Adding Value-The Value ChainAdding Value-The Value Chain
The difference between the cost of inputs and the value or price of outputs.
Inputs Land Labor Capital
Transformation/Conversion
process
Outputs Goods Services
Control
Feedback
FeedbackFeedback
Value added
1-10 Introduction to Operations Management
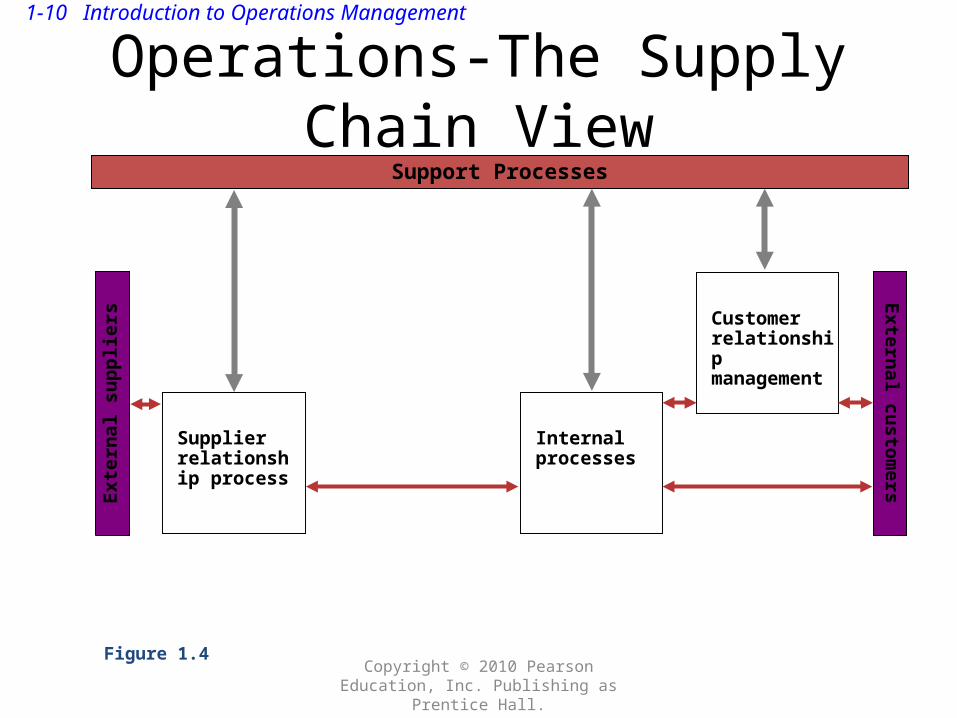
Operations-The Supply Chain View
Copyright © 2010 Pearson Education, Inc. Publishing as Prentice Hall.
Support Processes
Ext
ern
al s
up
pli
ers
Exte
rnal cu
stom
ers
Supplier relationship process
Internal processes
Customer relationship management
Figure 1.4
1-11 Introduction to Operations Management
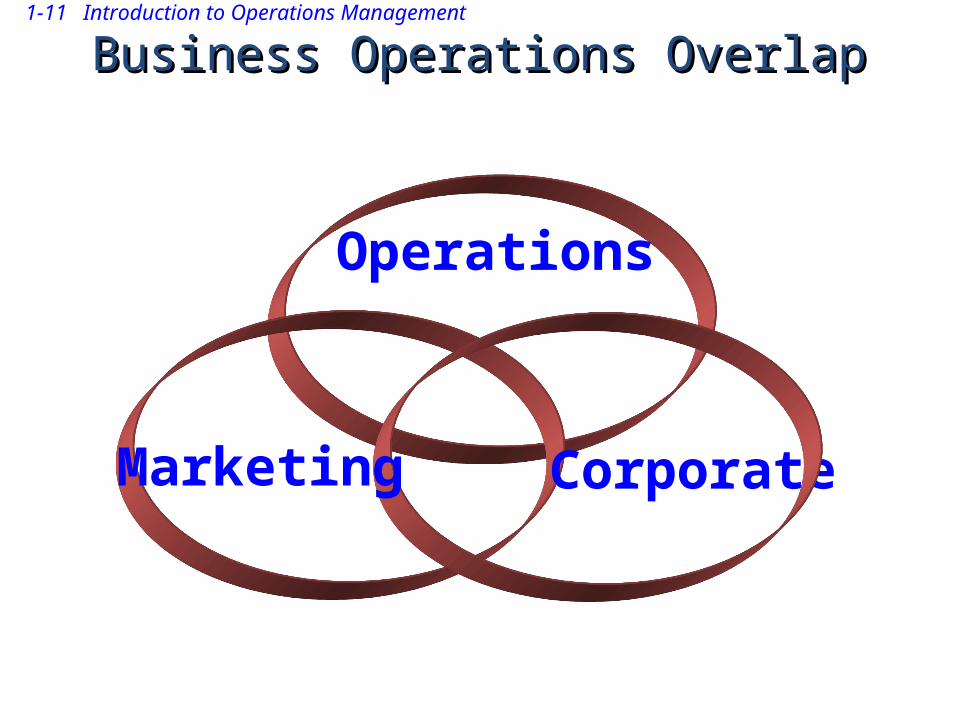
Business Operations OverlapBusiness Operations Overlap
Operations
CorporateMarketing
1-12 Introduction to Operations Management
1-12
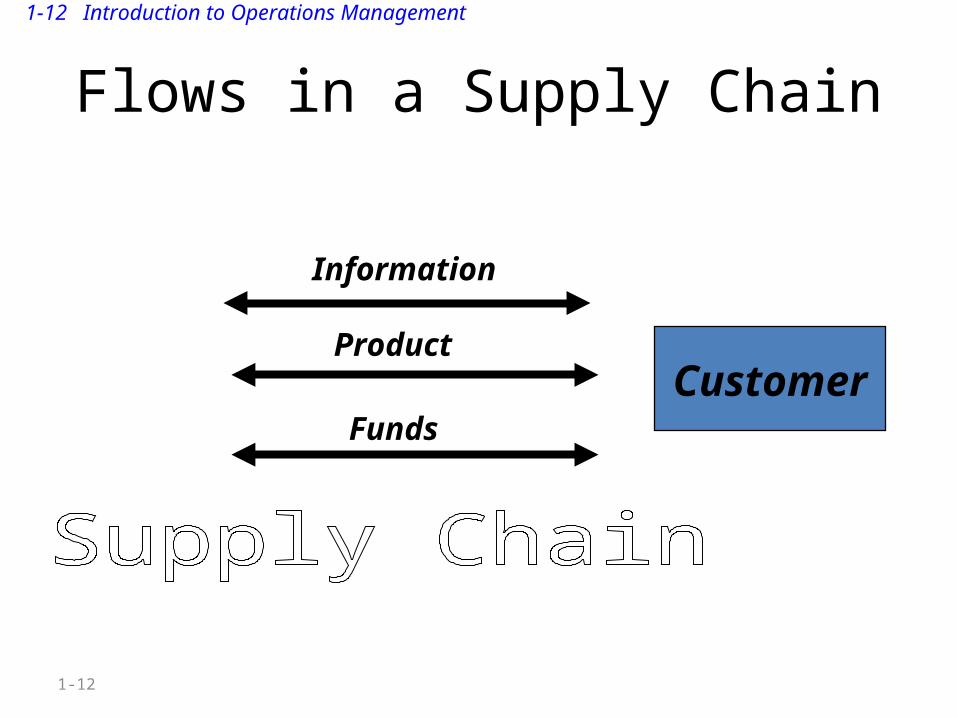
Flows in a Supply Chain
Customer
Information
Product
Funds
1-13 Introduction to Operations Management
Global Environment and Challenges for Operations Managers
• Global Competition• Productivity Improvement-service sector
productivity gains much lower in comparison with the manufacturing sector
• Rapid Technological Change• Ethical, Workforce Diversity and
Environmental Issues
1-14 Introduction to Operations Management
Operations Management Decisions
• Strategic • Planning• Tactical
1-15 Introduction to Operations Management
Operations Management Tools and Techniques
• Forecasting • Lean Systems• Operations Research

1-16 Introduction to Operations Management
Forecasting
1-17 Introduction to Operations Management
FORECAST:• A statement about the future
• Used to help managers– Plan the system– Plan the use of the system
1-18 Introduction to Operations Management
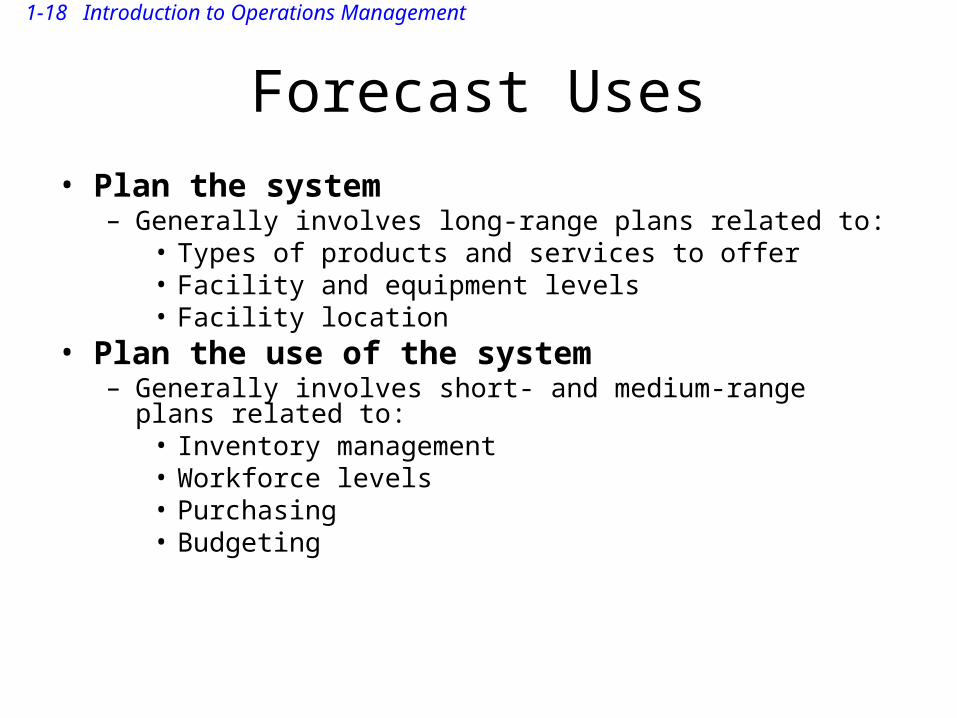
Forecast Uses• Plan the system
– Generally involves long-range plans related to:• Types of products and services to offer• Facility and equipment levels• Facility location
• Plan the use of the system– Generally involves short- and medium-range plans related to:
• Inventory management• Workforce levels• Purchasing• Budgeting
1-19 Introduction to Operations Management
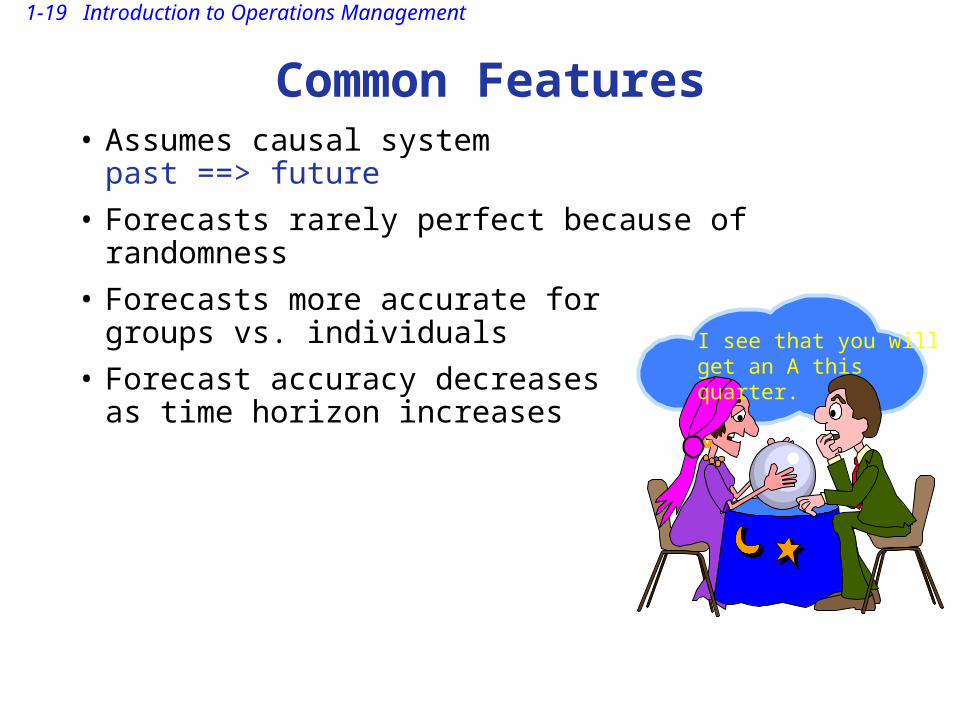
• Assumes causal systempast ==> future
• Forecasts rarely perfect because of randomness
• Forecasts more accurate forgroups vs. individuals
• Forecast accuracy decreases as time horizon increases
I see that you willget an A this quarter.
Common Features
1-20 Introduction to Operations Management
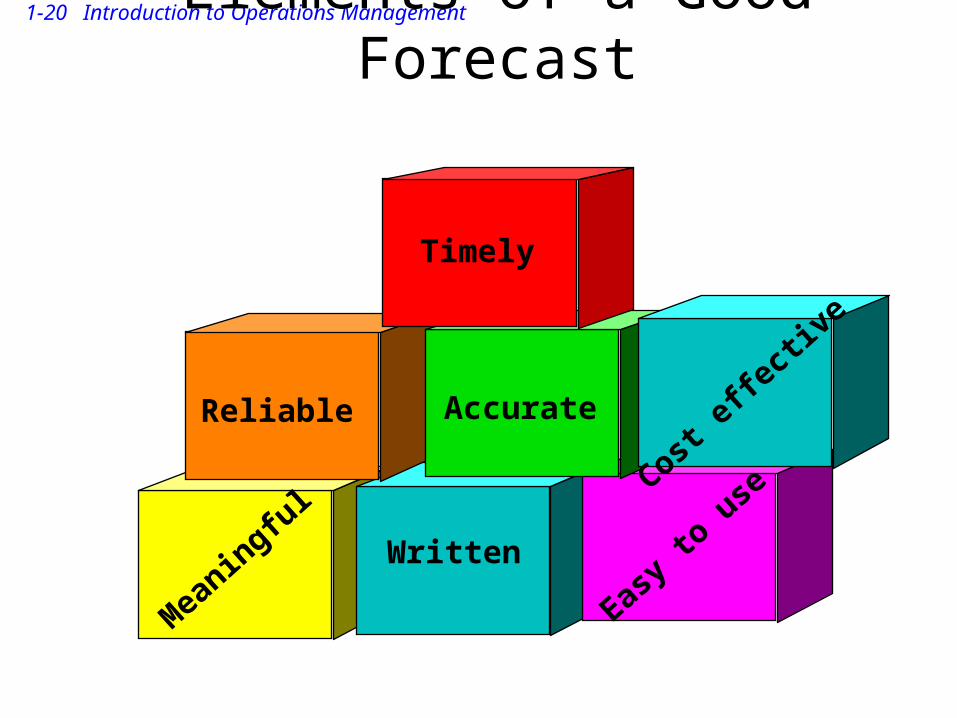
Elements of a Good Forecast
Timely
AccurateReliable
Mea
ningfu
l
Written
Easy
to u
seCost
effe
ctiv
e
1-21 Introduction to Operations Management
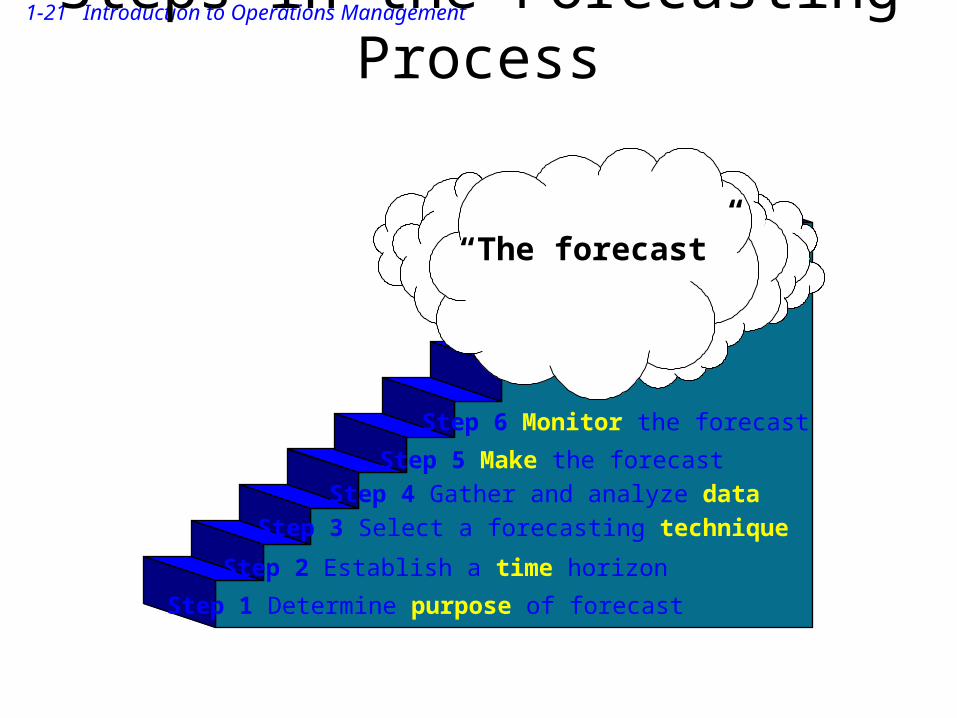
Steps in the Forecasting Process
Step 1 Determine purpose of forecast
Step 2 Establish a time horizon
Step 3 Select a forecasting technique
Step 4 Gather and analyze data
Step 5 Make the forecast
Step 6 Monitor the forecast
“The forecast”
1-22 Introduction to Operations Management
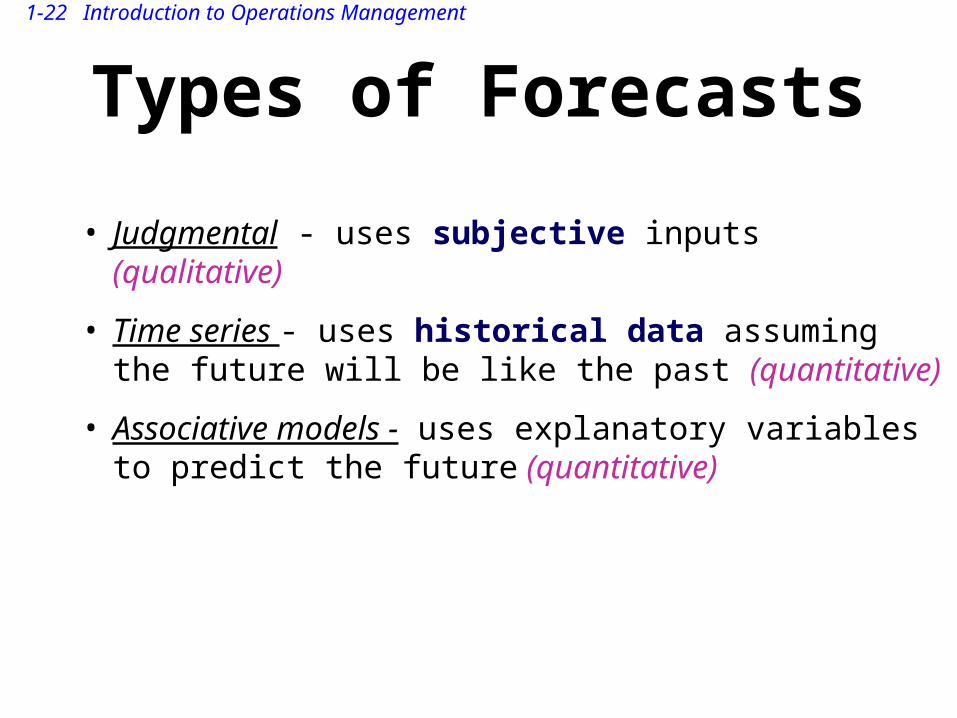
Types of Forecasts
• Judgmental - uses subjective inputs (qualitative)
• Time series - uses historical data assuming the future will be like the past (quantitative)
• Associative models - uses explanatory variables to predict the future (quantitative)
1-23 Introduction to Operations Management
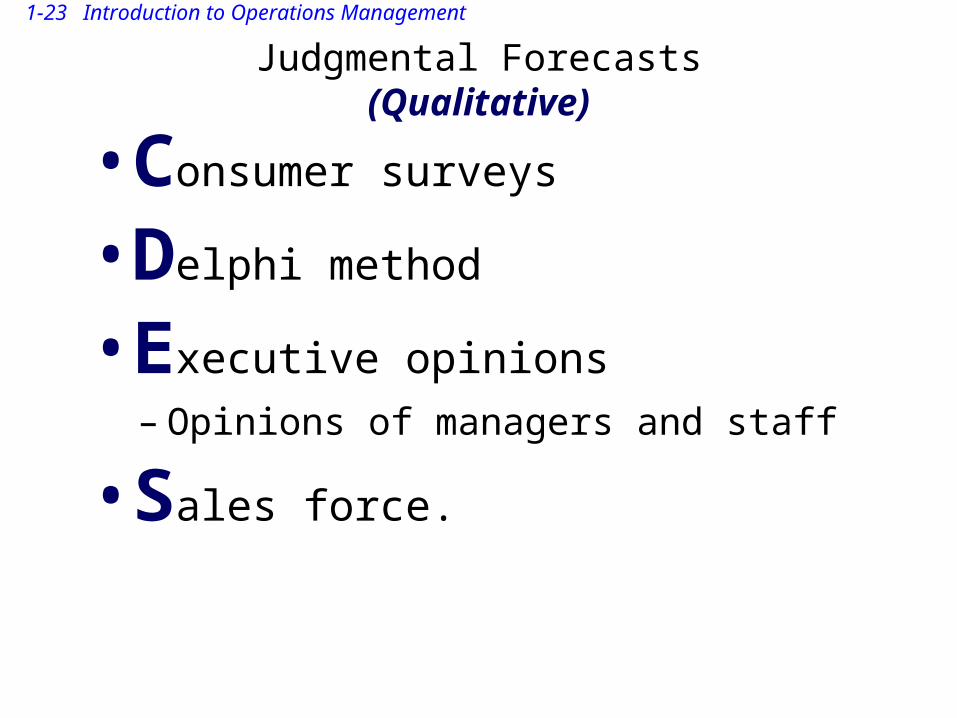
Judgmental Forecasts(Qualitative)
•Consumer surveys
•Delphi method
•Executive opinions
– Opinions of managers and staff
•Sales force.
1-24 Introduction to Operations Management
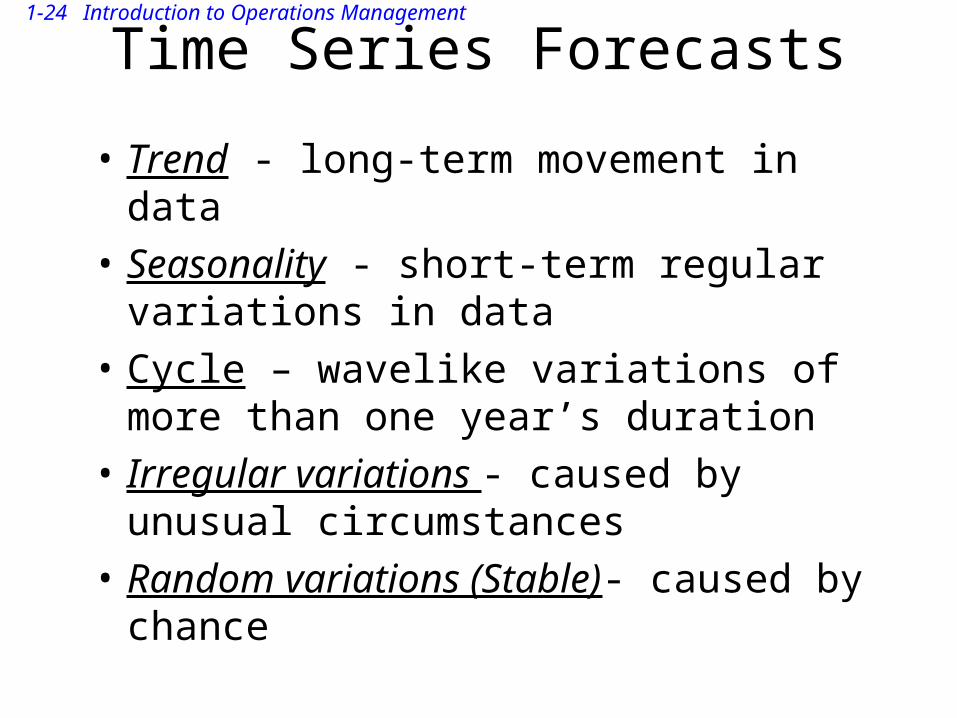
Time Series Forecasts
• Trend - long-term movement in data• Seasonality - short-term regular variations in
data• Cycle – wavelike variations of more than one
year’s duration• Irregular variations - caused by unusual
circumstances• Random variations (Stable)- caused by
chance
1-25 Introduction to Operations Management
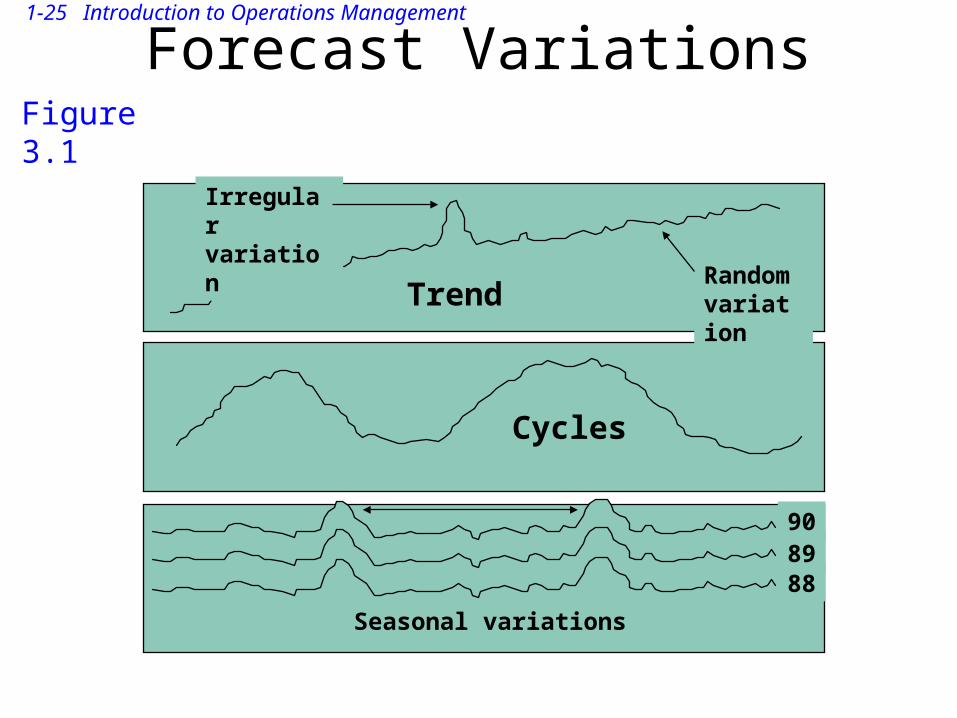
Forecast Variations
Trend
Irregularvariation
Seasonal variations
908988
Figure 3.1
Cycles
Randomvariation
1-26 Introduction to Operations Management
Time Series Forecasts-Methods
• Naive• Averaging• Trend• Seasonality• Exponential smoothing
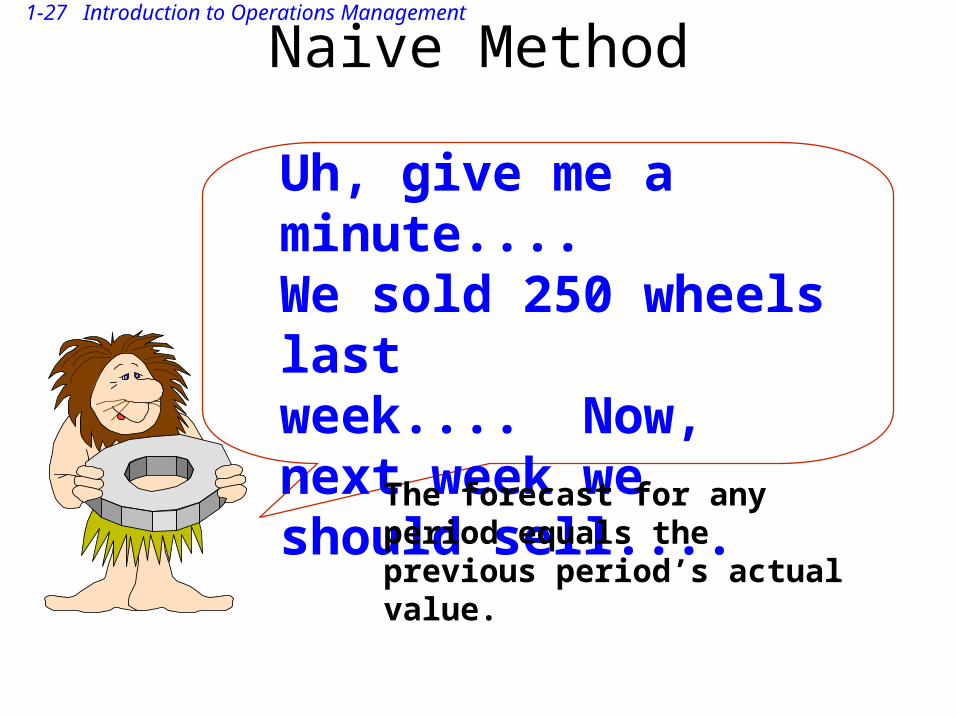
1-27 Introduction to Operations Management
Naive Method
Uh, give me a minute.... We sold 250 wheels lastweek.... Now, next week we should sell....
The forecast for any period equals the previous period’s actual value.
1-28 Introduction to Operations Management
Naïve Method
• Simple to use• Virtually no cost• Quick and easy to prepare• Data analysis is nonexistent• Easily understandable• Cannot provide high accuracy• Can be a standard for accuracy
1-29 Introduction to Operations Management
Naïve Method
• Stable time series data• Seasonal variations
– Next value in a series will equal the previous value in a comparable period
• Data with trends– F(t) = A(t-1) + (A(t-1) – A(t-2))
1-30 Introduction to Operations Management
Averaging Method
• Simple moving average
• Weighted moving average
1-31 Introduction to Operations Management
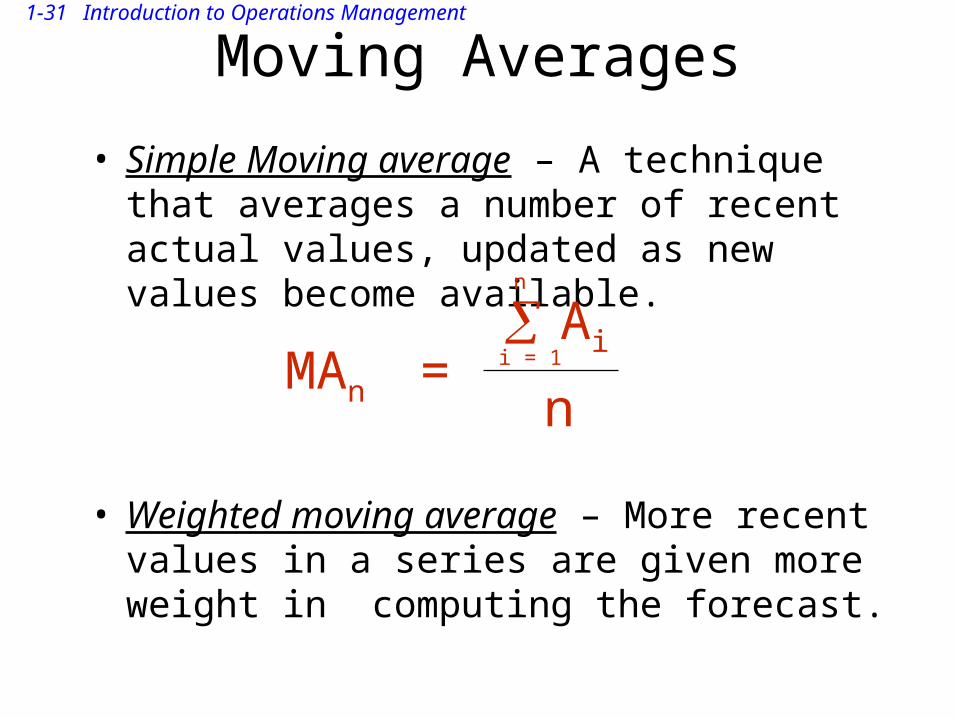
Moving Averages
• Simple Moving average – A technique that averages a number of recent actual values, updated as new values become available.
• Weighted moving average – More recent values in a series are given more weight in computing the forecast.
MAn = n
Aii = 1n
1-32 Introduction to Operations Management
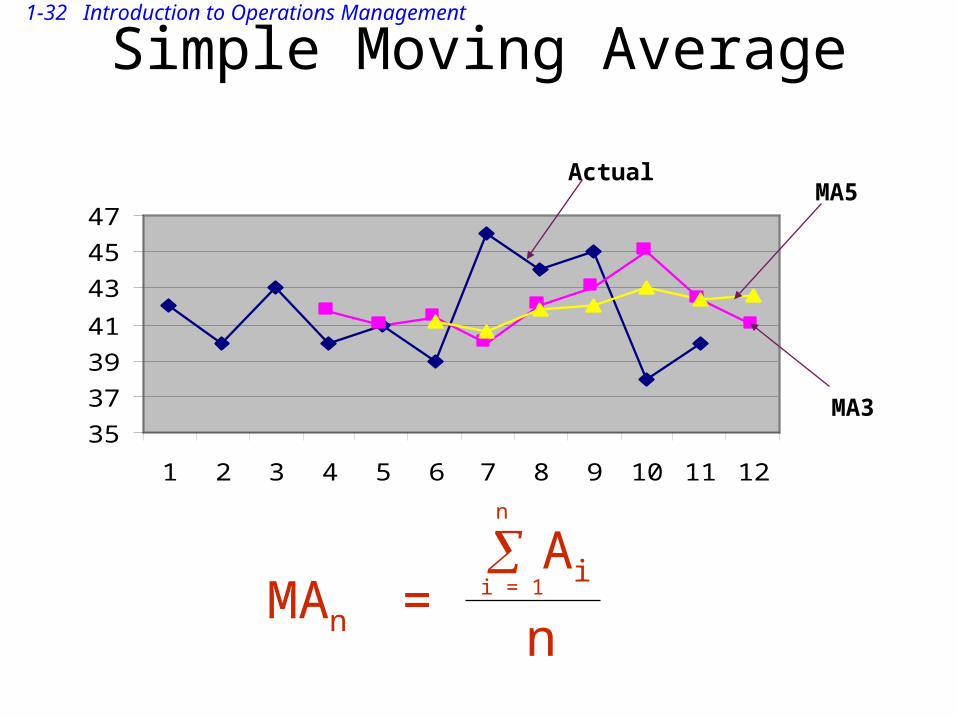
Simple Moving Average
MAn = n
Aii = 1n
35
37
39
41
43
45
47
1 2 3 4 5 6 7 8 9 10 11 12
Actual
MA3
MA5
1-33 Introduction to Operations Management
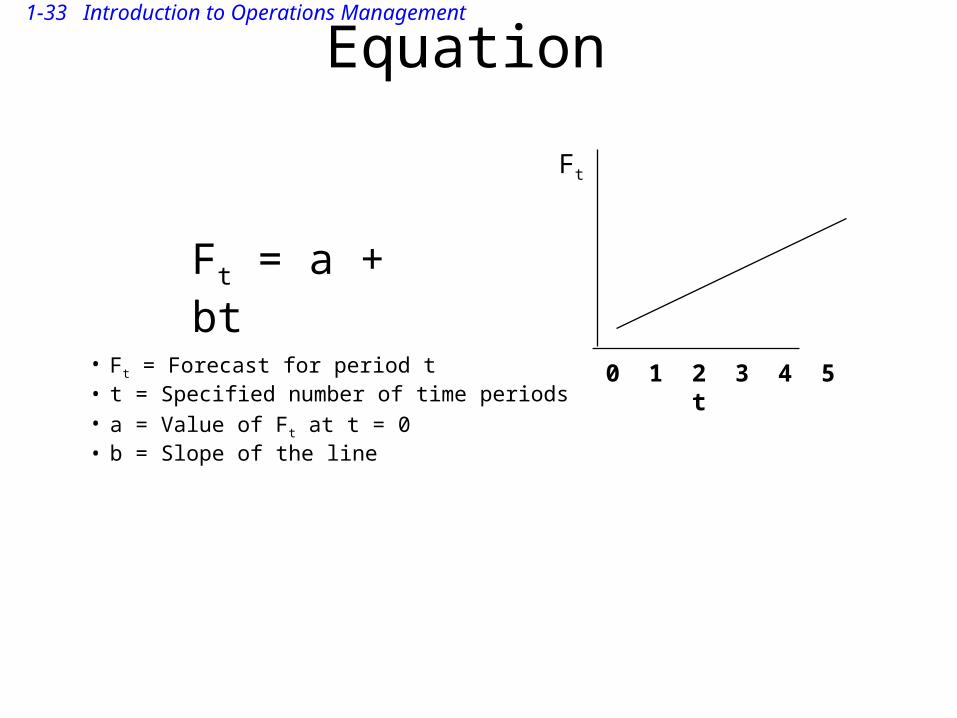
Trend Method-Linear Trend Equation
• Ft = Forecast for period t• t = Specified number of time periods• a = Value of Ft at t = 0• b = Slope of the line
Ft = a + bt
0 1 2 3 4 5 t
Ft
1-34 Introduction to Operations Management
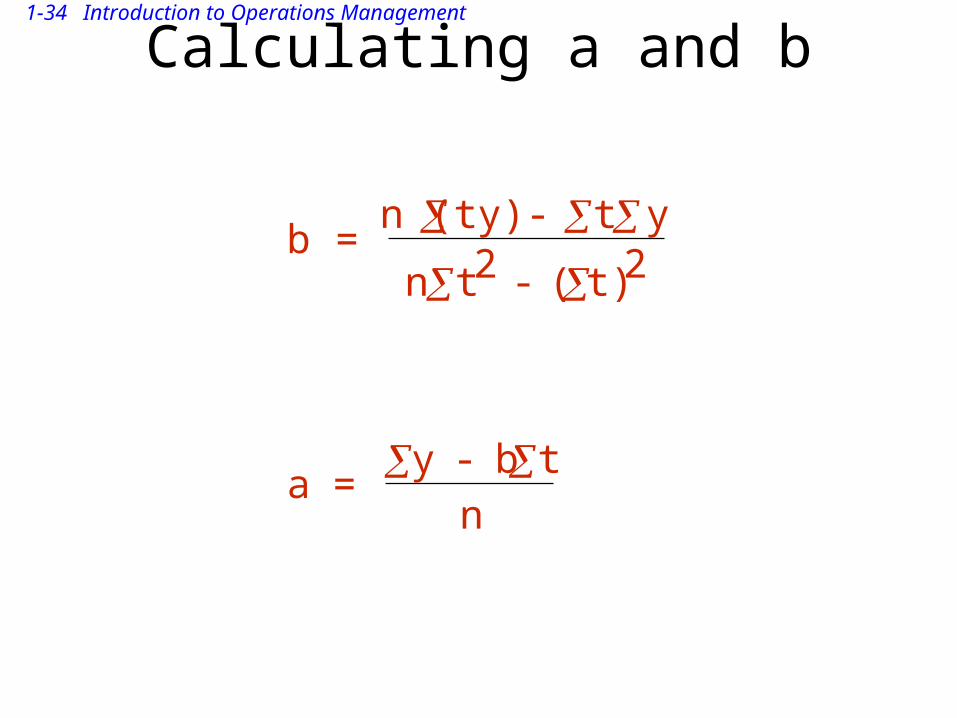
Calculating a and b
b = n (ty) - t y
n t2 - ( t)2
a = y - b t
n
1-35 Introduction to Operations Management
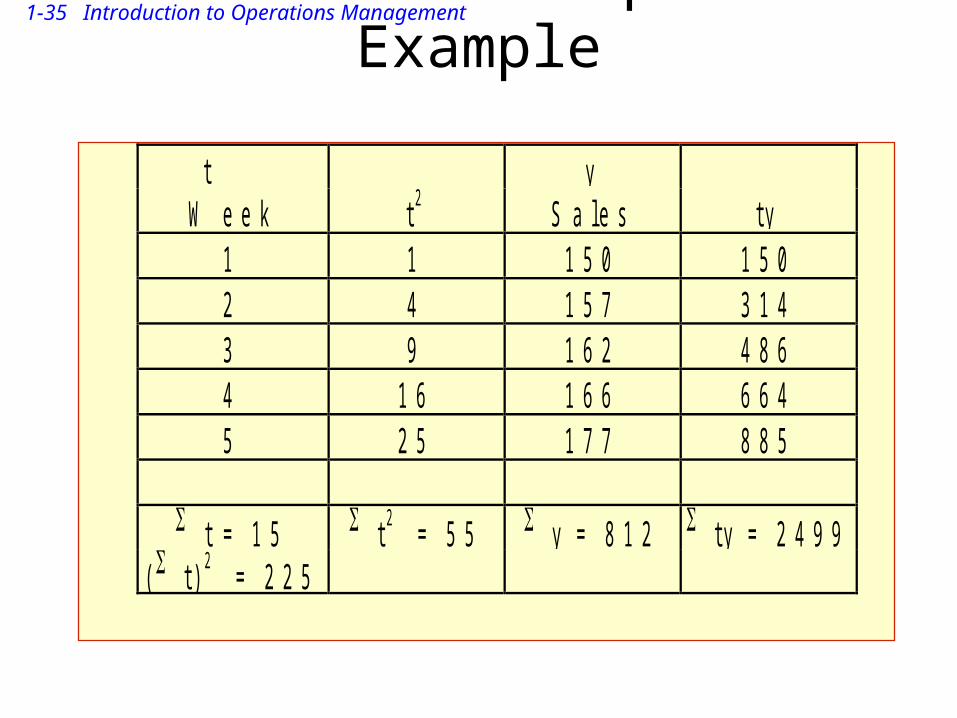
Linear Trend Equation Example
t yW e e k t 2 S a l e s t y
1 1 1 5 0 1 5 02 4 1 5 7 3 1 43 9 1 6 2 4 8 64 1 6 1 6 6 6 6 45 2 5 1 7 7 8 8 5
t = 1 5 t 2 = 5 5 y = 8 1 2 t y = 2 4 9 9( t ) 2 = 2 2 5
1-36 Introduction to Operations Management
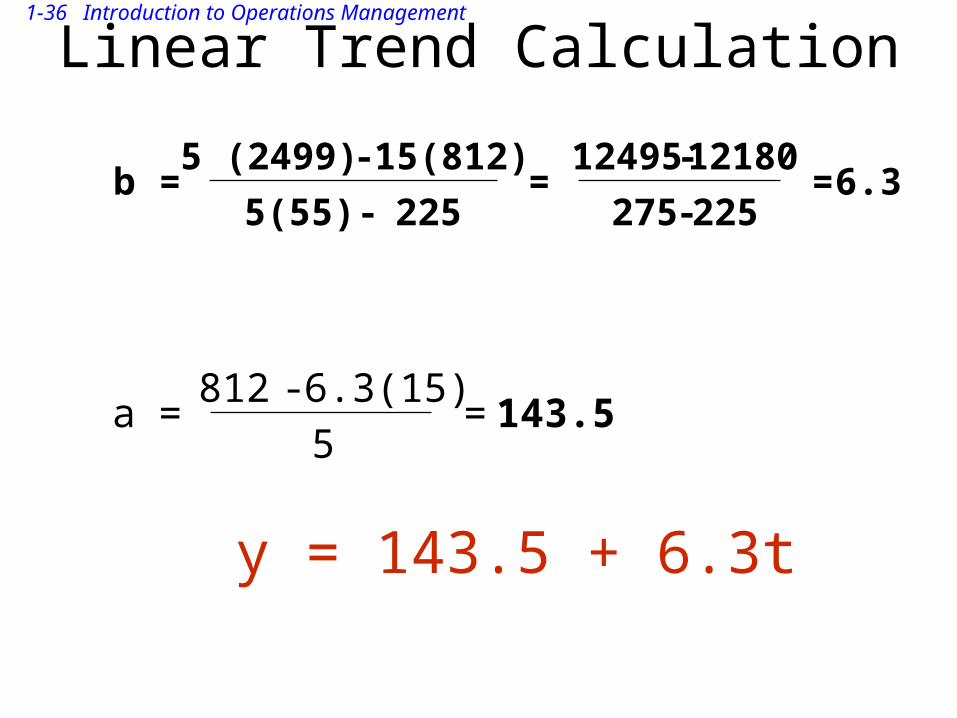
Linear Trend Calculation
y = 143.5 + 6.3t
a = 812 - 6.3(15)
5 =
b = 5 (2499) - 15(812)
5(55) - 225 =
12495-12180
275 -225 = 6.3
143.5
1-37 Introduction to Operations Management
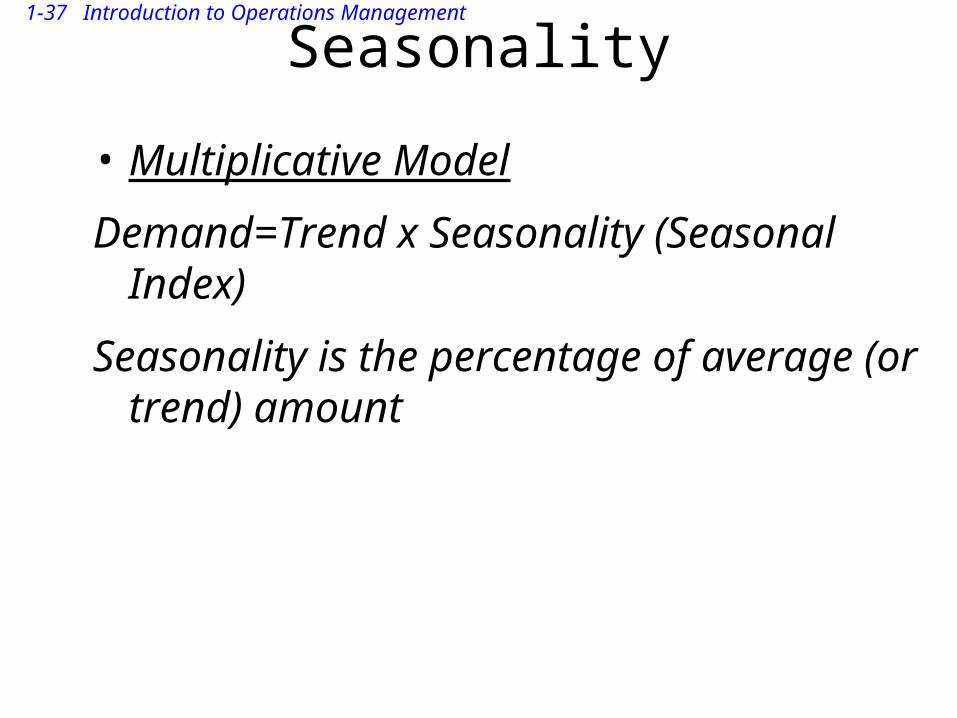
Seasonality
• Multiplicative Model
Demand=Trend x Seasonality (Seasonal Index)
Seasonality is the percentage of average (or trend) amount
1-38 Introduction to Operations Management
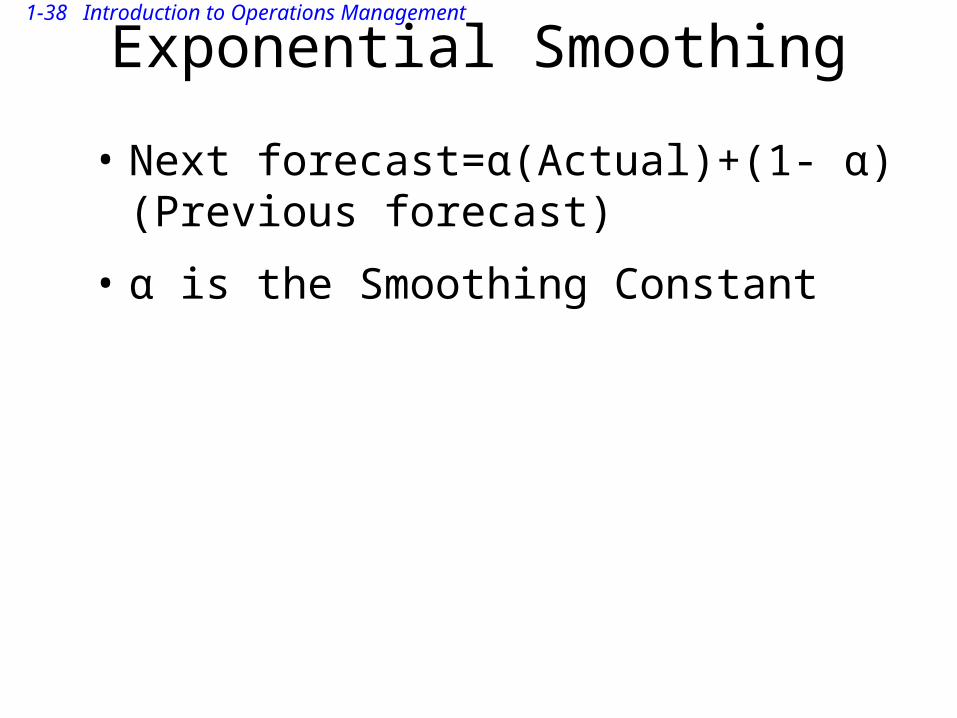
Exponential Smoothing
• Next forecast=α(Actual)+(1- α)(Previous forecast)
• α is the Smoothing Constant
1-39 Introduction to Operations Management
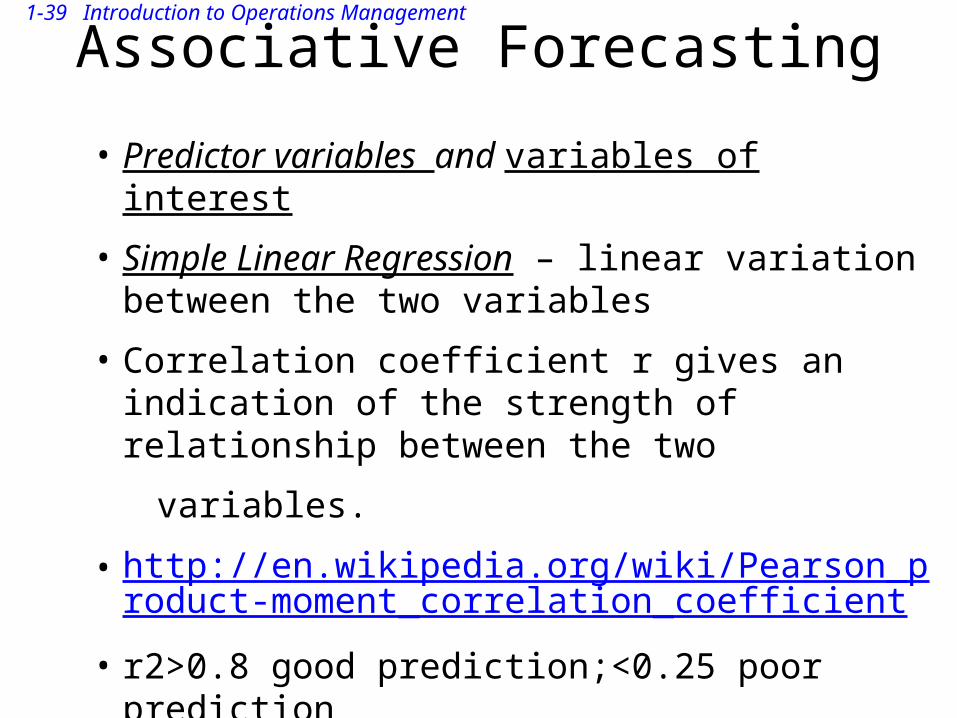
Associative Forecasting
• Predictor variables and variables of interest
• Simple Linear Regression – linear variation between the two variables
• Correlation coefficient r gives an indication of the strength of relationship between the two
variables.
• http://en.wikipedia.org/wiki/Pearson_product-moment_correlation_coefficient
• r2>0.8 good prediction;<0.25 poor prediction
1-40 Introduction to Operations Management
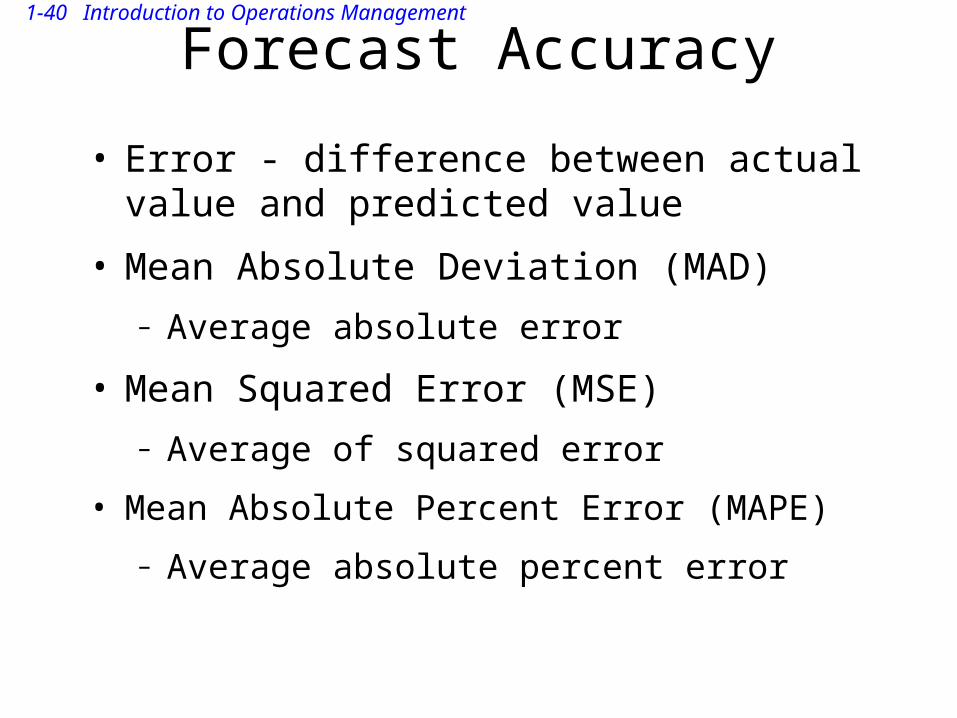
Forecast Accuracy
• Error - difference between actual value and predicted value
• Mean Absolute Deviation (MAD)– Average absolute error
• Mean Squared Error (MSE)– Average of squared error
• Mean Absolute Percent Error (MAPE)
– Average absolute percent error
1-41 Introduction to Operations Management
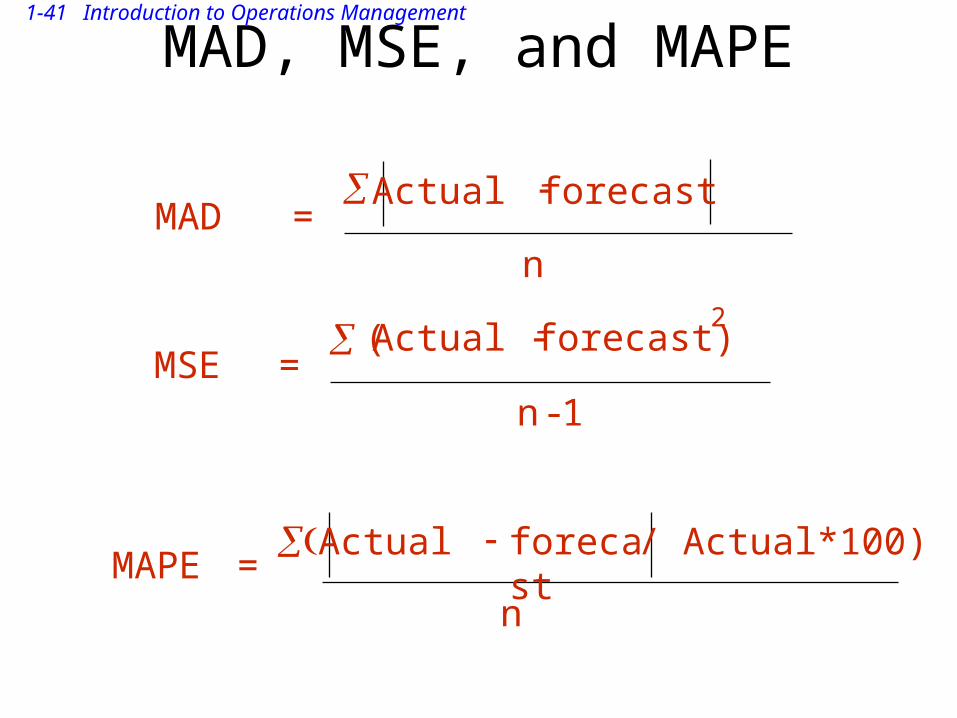
MAD, MSE, and MAPE
MAD = Actual forecast
n
MSE = Actual forecast)
-1
2
n
(
MAPE = Actual forecast
n
/ Actual*100)
1-42 Introduction to Operations Management
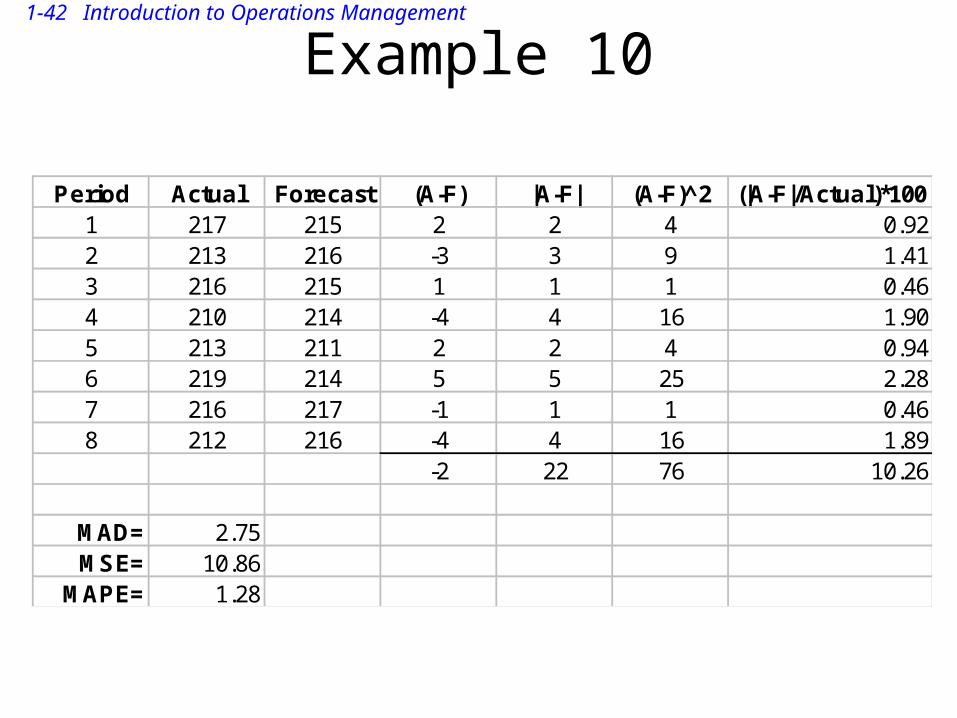
Example 10
Period Actual Forecast (A-F) |A-F| (A-F)^2 (|A-F|/Actual)*1001 217 215 2 2 4 0.922 213 216 -3 3 9 1.413 216 215 1 1 1 0.464 210 214 -4 4 16 1.905 213 211 2 2 4 0.946 219 214 5 5 25 2.287 216 217 -1 1 1 0.468 212 216 -4 4 16 1.89
-2 22 76 10.26
MAD= 2.75MSE= 10.86
MAPE= 1.28
1-43 Introduction to Operations Management
Controlling the Forecast
• Control chart• Tracking signal
1-44 Introduction to Operations Management
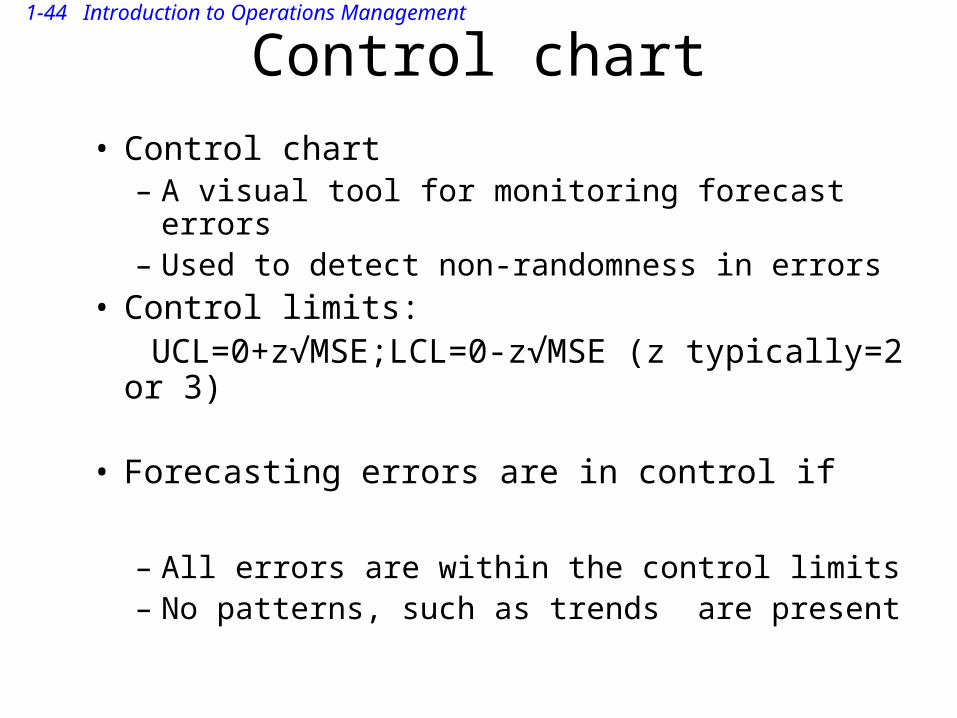
Control chart• Control chart
– A visual tool for monitoring forecast errors– Used to detect non-randomness in errors
• Control limits: UCL=0+z√MSE;LCL=0-z√MSE (z typically=2 or 3)
• Forecasting errors are in control if
– All errors are within the control limits– No patterns, such as trends are present
1-45 Introduction to Operations Management
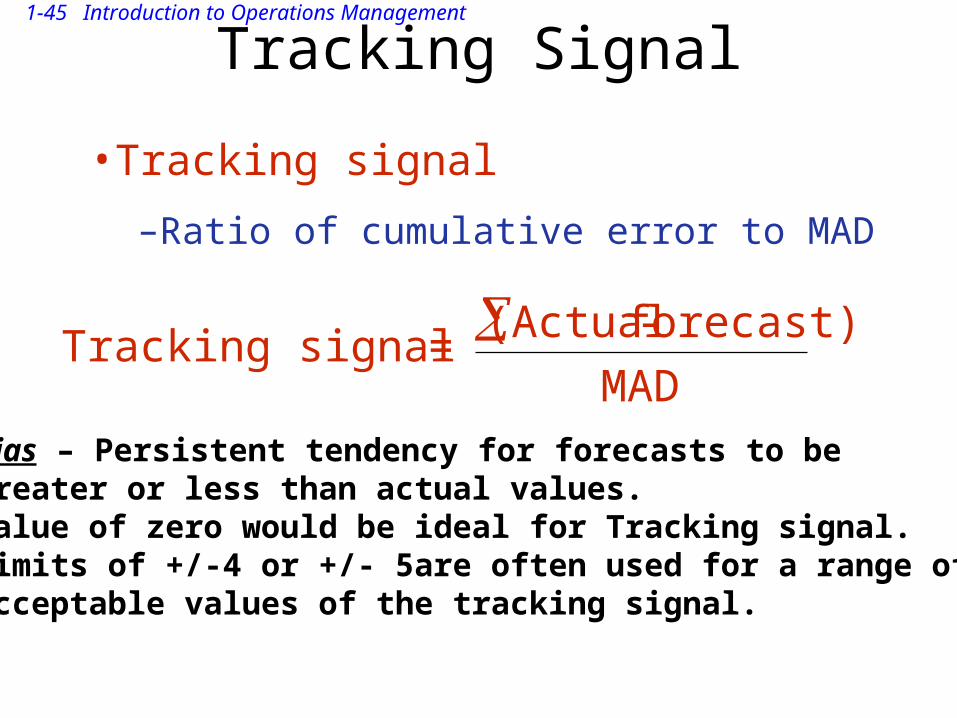
Tracking Signal
Tracking signal = (Actual-forecast)
MAD
•Tracking signal
–Ratio of cumulative error to MAD
Bias – Persistent tendency for forecasts to beGreater or less than actual values.Value of zero would be ideal for Tracking signal.Limits of +/-4 or +/- 5are often used for a range of acceptable values of the tracking signal.
1-46 Introduction to Operations Management
Sources of Forecast errors
• Model may be inadequate• Irregular variations• Incorrect use of forecasting technique
1-47 Introduction to Operations Management
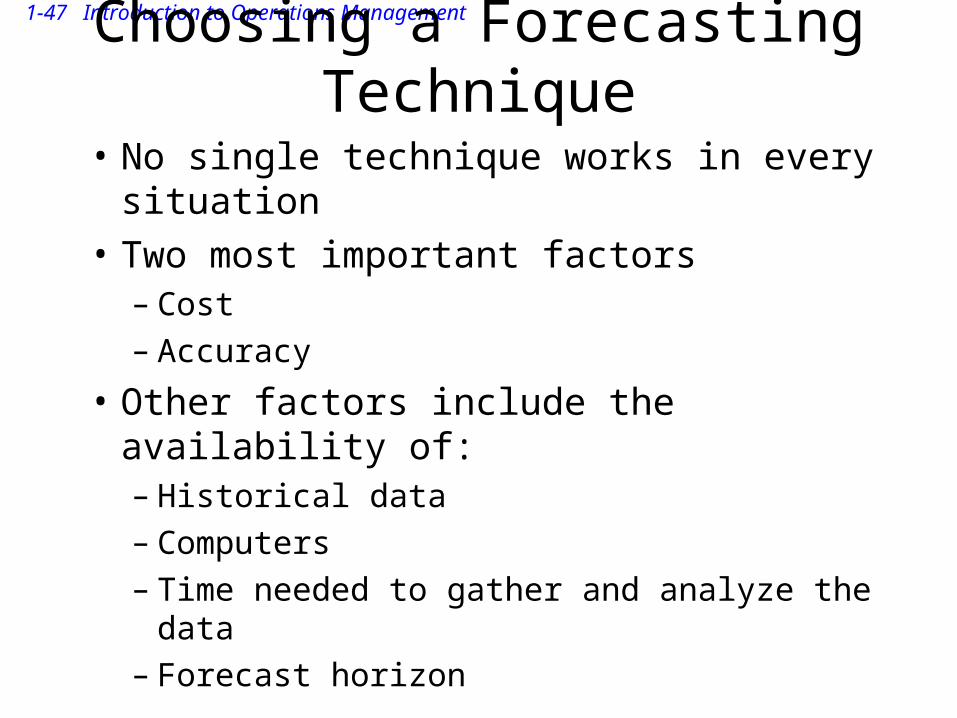
Choosing a Forecasting Technique
• No single technique works in every situation• Two most important factors
– Cost– Accuracy
• Other factors include the availability of:– Historical data– Computers– Time needed to gather and analyze the data– Forecast horizon

1-48 Introduction to Operations Management
Operations Research
1-49 Introduction to Operations Management
49
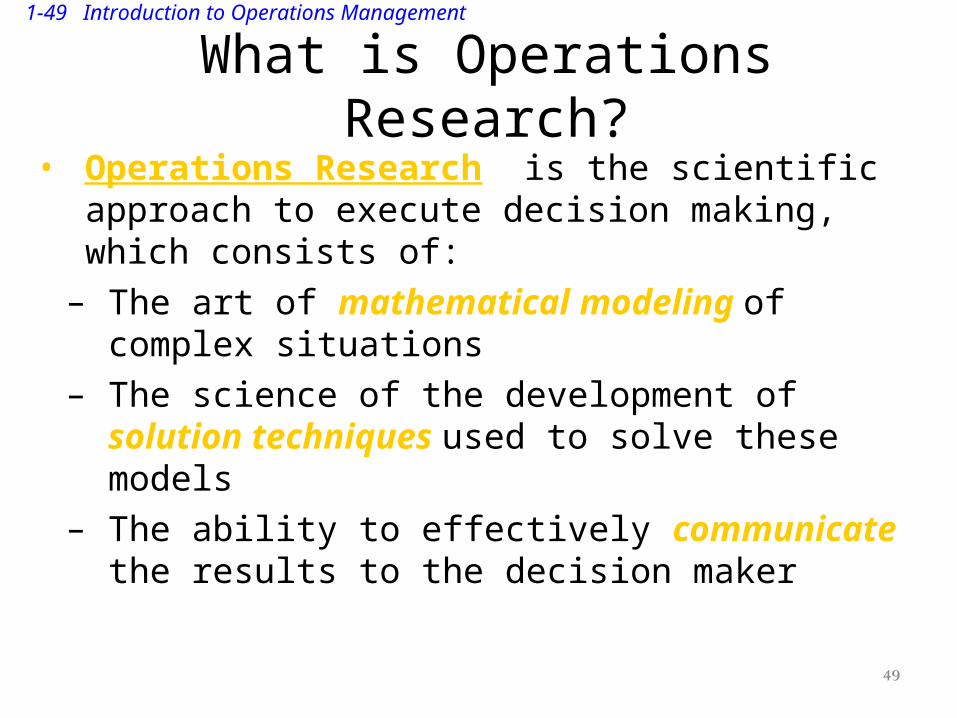
What is Operations Research?• Operations Research is the scientific
approach to execute decision making, which consists of:
– The art of mathematical modeling of complex situations
– The science of the development of solution techniques used to solve these models
– The ability to effectively communicate the results to the decision maker
1-50 Introduction to Operations Management
50
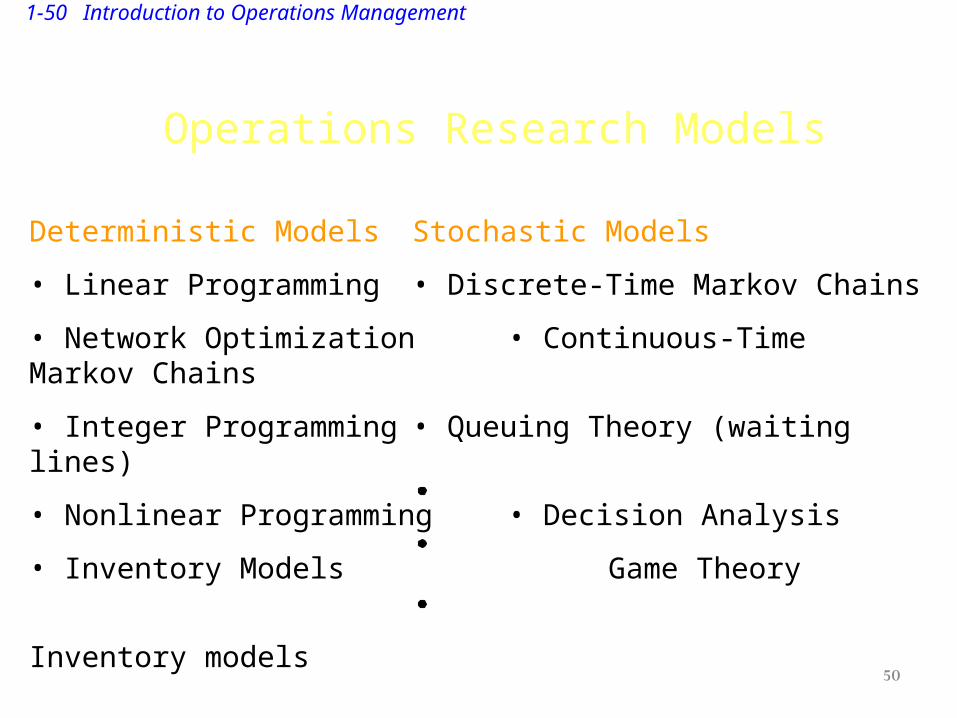
Operations Research Models
Deterministic Models Stochastic Models
• Linear Programming • Discrete-Time Markov Chains
• Network Optimization • Continuous-Time Markov Chains
• Integer Programming • Queuing Theory (waiting lines)
• Nonlinear Programming • Decision Analysis
• Inventory Models Game Theory
Inventory models
Simulation
1-51 Introduction to Operations Management
CHAPTER9
Management of Quality
1-52 Introduction to Operations Management
Agenda• Insights on Quality Management
– Defining Quality– Dimensions and Determinants
– The Consequences of Poor Quality
– Responsibility for Quality
– The Costs of Quality
– Ethics and Quality Management
1-53 Introduction to Operations Management
Agenda Contd.
• The Evolution of Quality
• Total Quality Management (TQM)
– TQM Tools
– Quality Function Deployment (QFD)
• Six-Sigma Quality Control
1-54 Introduction to Operations Management
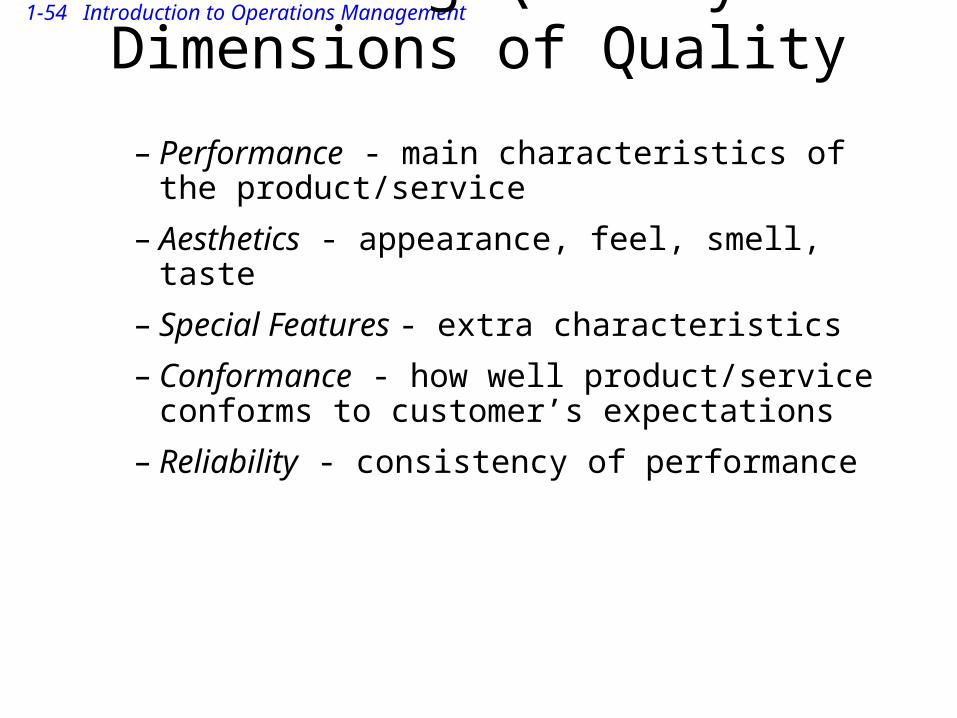
Defining Quality-Dimensions of Quality
– Performance - main characteristics of the product/service
– Aesthetics - appearance, feel, smell, taste
– Special Features - extra characteristics
– Conformance - how well product/service conforms to customer’s expectations
– Reliability - consistency of performance
1-55 Introduction to Operations Management
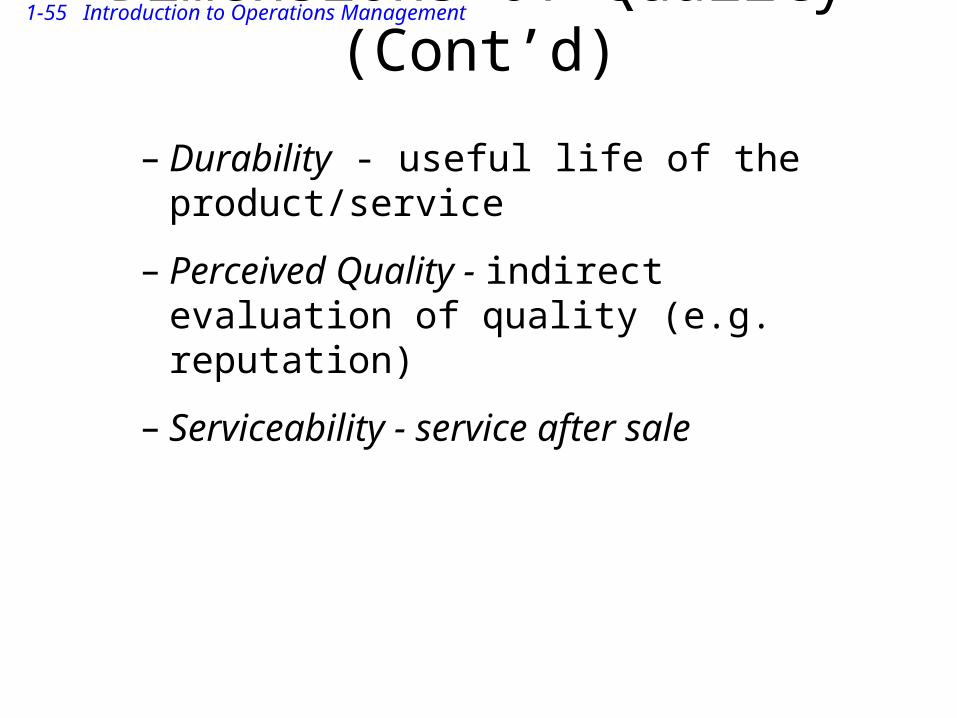
Dimensions of Quality (Cont’d)
– Durability - useful life of the product/service
– Perceived Quality - indirect evaluation of quality (e.g. reputation)
– Serviceability - service after sale
1-56 Introduction to Operations Management
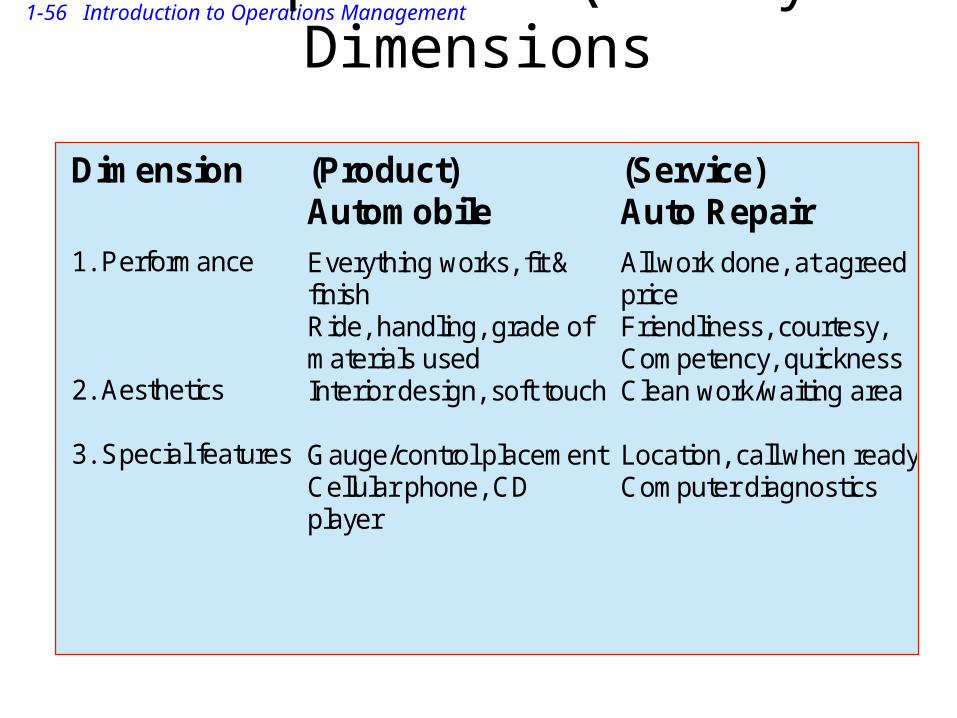
Examples of Quality Dimensions
Dimension
1. Performance 2. Aesthetics 3. Special features
(Product) Automobile
Everything works, fit & finish Ride, handling, grade of materials used Interior design, soft touch Gauge/control placement Cellular phone, CD player
(Service) Auto Repair
All work done, at agreed price Friendliness, courtesy, Competency, quickness Clean work/waiting area Location, call when ready Computer diagnostics
1-57 Introduction to Operations Management
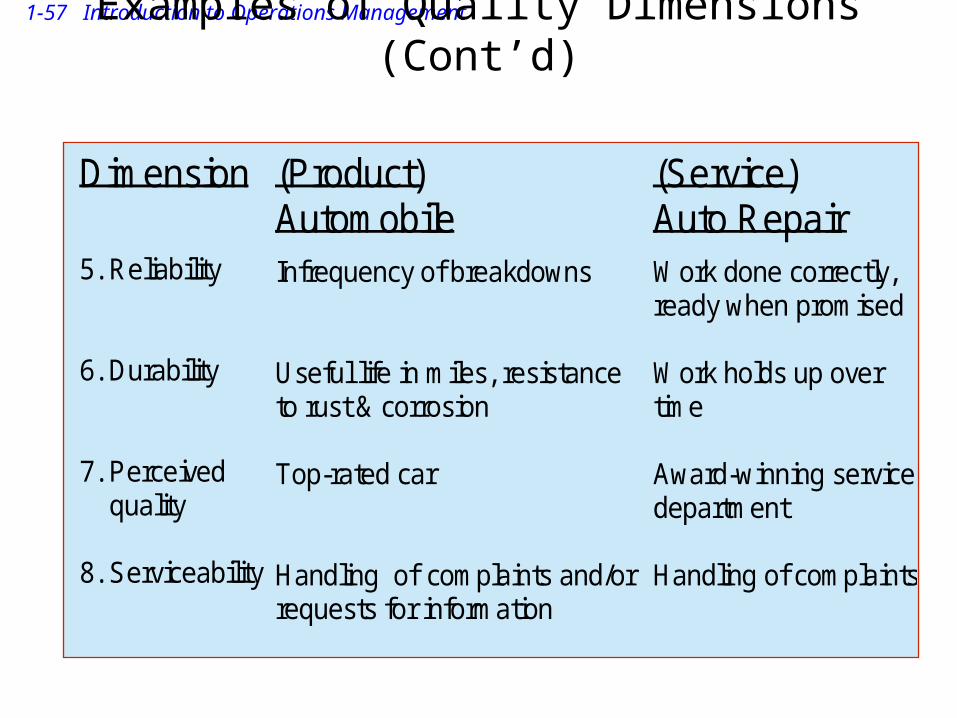
Examples of Quality Dimensions (Cont’d)
Dimension
5. Reliability 6. Durability 7. Perceived quality 8. Serviceability
(Product) Automobile
Infrequency of breakdowns Useful life in miles, resistance to rust & corrosion Top-rated car Handling of complaints and/or requests for information
(Service) Auto Repair
Work done correctly, ready when promised Work holds up over time Award-winning service department Handling of complaints
1-58 Introduction to Operations Management
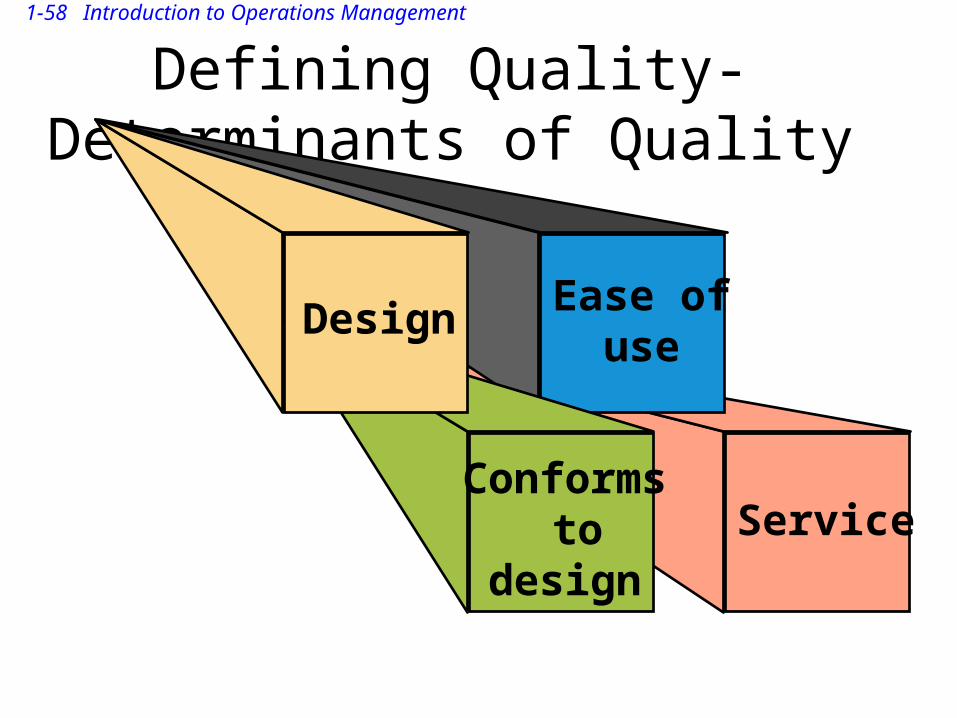
Defining Quality-Determinants of Quality
Service
Ease ofuse
Conforms to design
Design
1-59 Introduction to Operations Management
The Consequences of Poor Quality
• Loss of business• Liability• Productivity• Costs
1-60 Introduction to Operations Management
• Top management• Design• Procurement• Production/operations• Quality assurance• Packaging and shipping• Marketing and sales• Customer service
Responsibility for Quality
1-61 Introduction to Operations Management
Costs of Quality
• Failure Costs - costs incurred by defective parts/products or faulty services.
• Internal Failure Costs
– Costs incurred to fix problems that are detected before the product/service is delivered to the customer.
• External Failure Costs
– All costs incurred to fix problems that are detected after the product/service is delivered to the customer.
1-62 Introduction to Operations Management
Costs of Quality (continued)
• Appraisal Costs– Costs of activities designed to ensure quality or
uncover defects• Prevention Costs
– All TQ training, TQ planning, customer assessment, process control, and quality improvement costs to prevent defects from occurring
1-63 Introduction to Operations Management
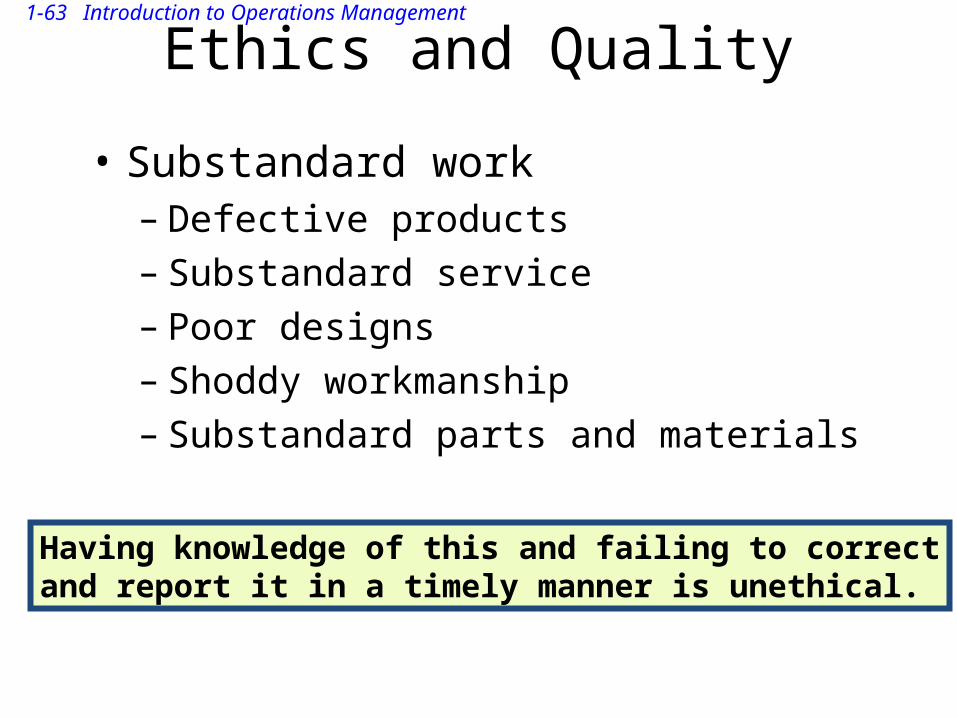
• Substandard work– Defective products– Substandard service– Poor designs– Shoddy workmanship– Substandard parts and materials
Ethics and Quality
Having knowledge of this and failing to correctand report it in a timely manner is unethical.
1-64 Introduction to Operations Management
19
80
– T
ota
l 1
98
0 –
Tota
l Q
ualit
yQ
ualit
y
19
70
– Q
ualit
y M
anag
em
en
t 1
97
0 –
Qu
alit
y M
an
ag
em
en
t Pro
gra
ms
Pro
gra
ms
19
60
– Q
ualit
y W
arr
an
ty1
96
0 –
Qu
alit
y W
arr
an
ty
19
30
– S
tati
stic
al C
on
trol
193
0 –
Sta
tist
ical C
on
trol
19
20
–
192
0 –
In
spect
ion
Insp
ect
ion
19
00
–
190
0 –
S
up
erv
isio
nS
up
erv
isio
n
19
00
– M
anp
ow
er
pre
dom
inan
ce1
90
0 –
Manp
ow
er
pre
dom
inan
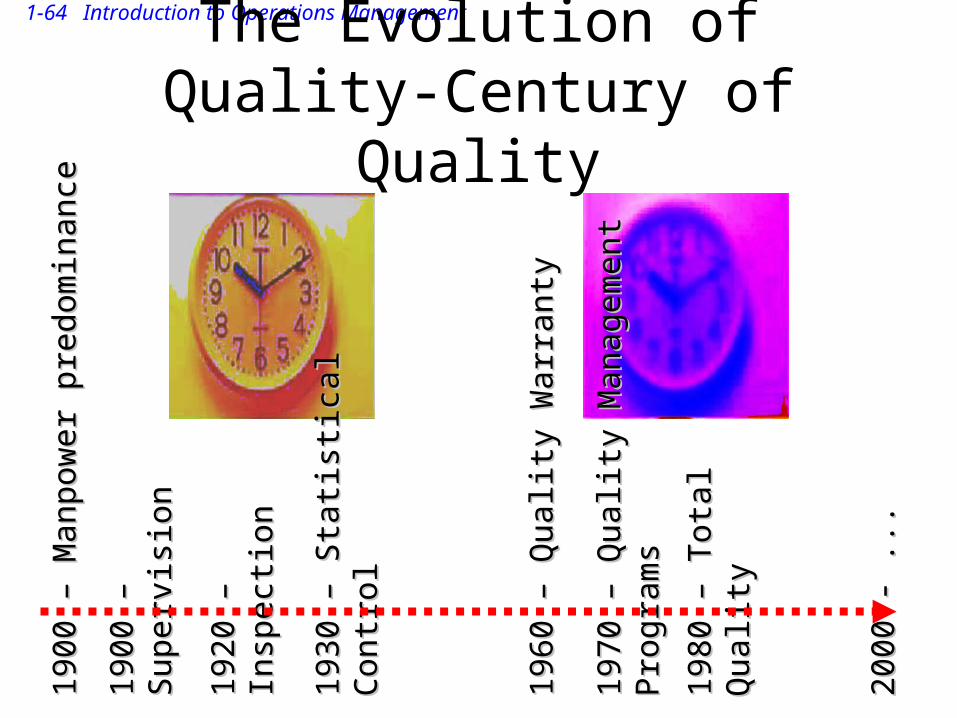
ceThe Evolution of Quality-Century of
Quality
200
0 -
...
2
00
0 -
...
1-65 Introduction to Operations Management
Total Quality Management (TQM)A philosophy that involves everyone in an organization in a continual effort to improve quality and achieve customer satisfaction.
T Q M
1-66 Introduction to Operations Management
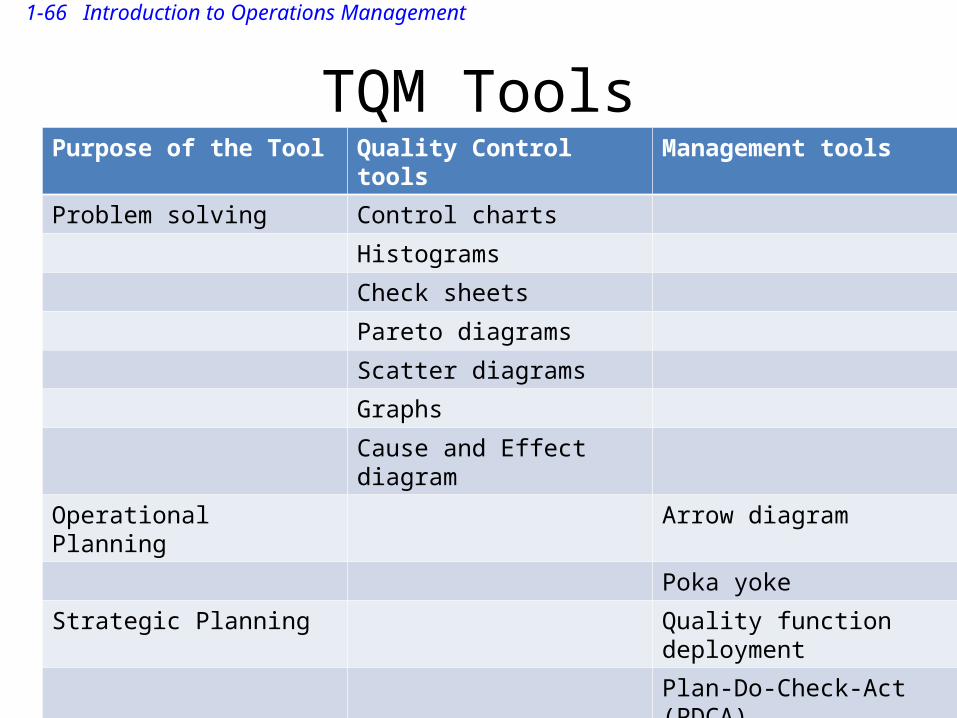
TQM ToolsPurpose of the Tool Quality Control tools Management tools
Problem solving Control charts
Histograms
Check sheets
Pareto diagrams
Scatter diagrams
Graphs
Cause and Effect diagram
Operational Planning Arrow diagram
Poka yoke
Strategic Planning Quality function deployment
Plan-Do-Check-Act (PDCA)
1-67 Introduction to Operations Management
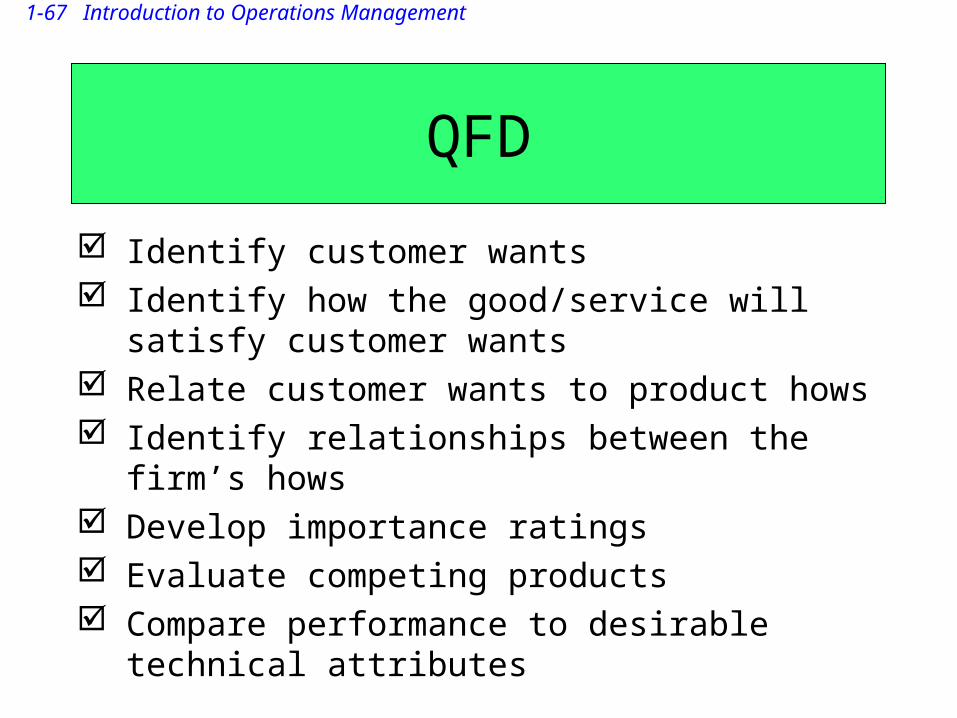
QFD
Identify customer wants Identify how the good/service will satisfy customer
wants Relate customer wants to product hows Identify relationships between the firm’s hows Develop importance ratings Evaluate competing products Compare performance to desirable technical attributes
1-68 Introduction to Operations Management
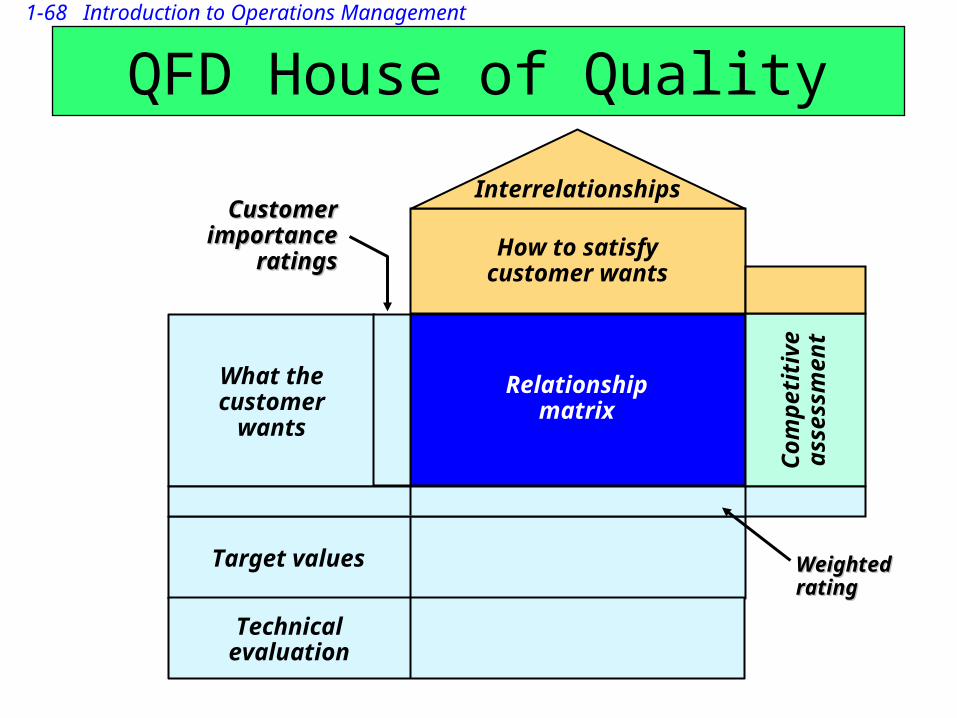
QFD House of Quality
Relationshipmatrix
How to satisfycustomer wants
Interrelationships
Co
mp
etit
ive
asse
ssm
ent
Technicalevaluation
Target values
What the customer
wants
Customer Customer importance importance
ratingsratings
Weighted Weighted ratingrating
1-69 Introduction to Operations Management
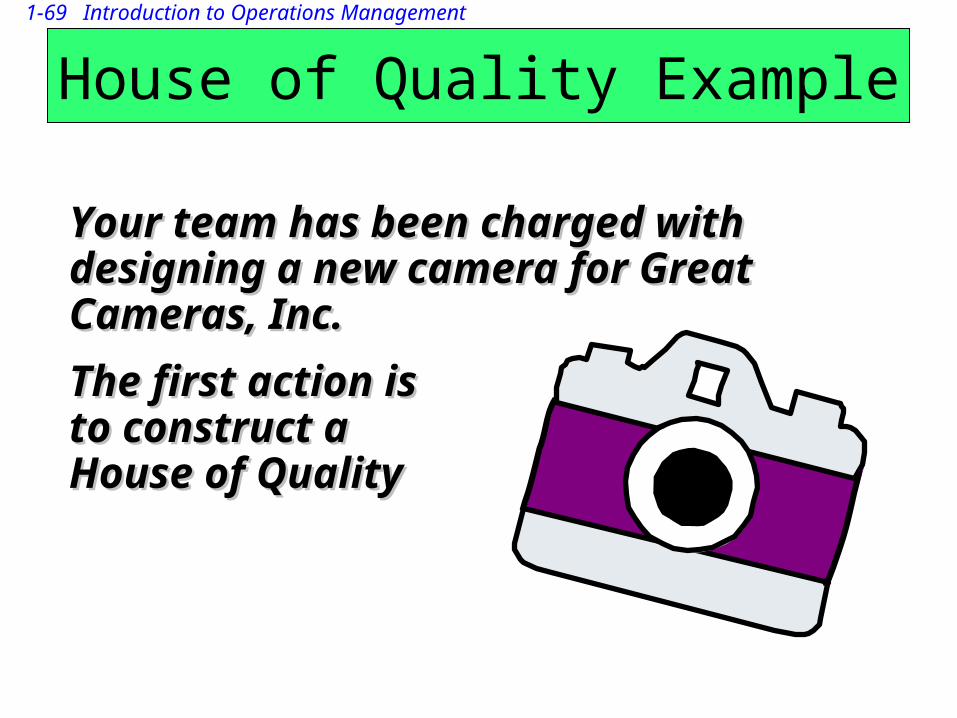
House of Quality Example
Your team has been charged with Your team has been charged with designing a new camera for Great designing a new camera for Great Cameras, Inc.Cameras, Inc.
The first action is The first action is to construct a to construct a House of QualityHouse of Quality
1-70 Introduction to Operations Management
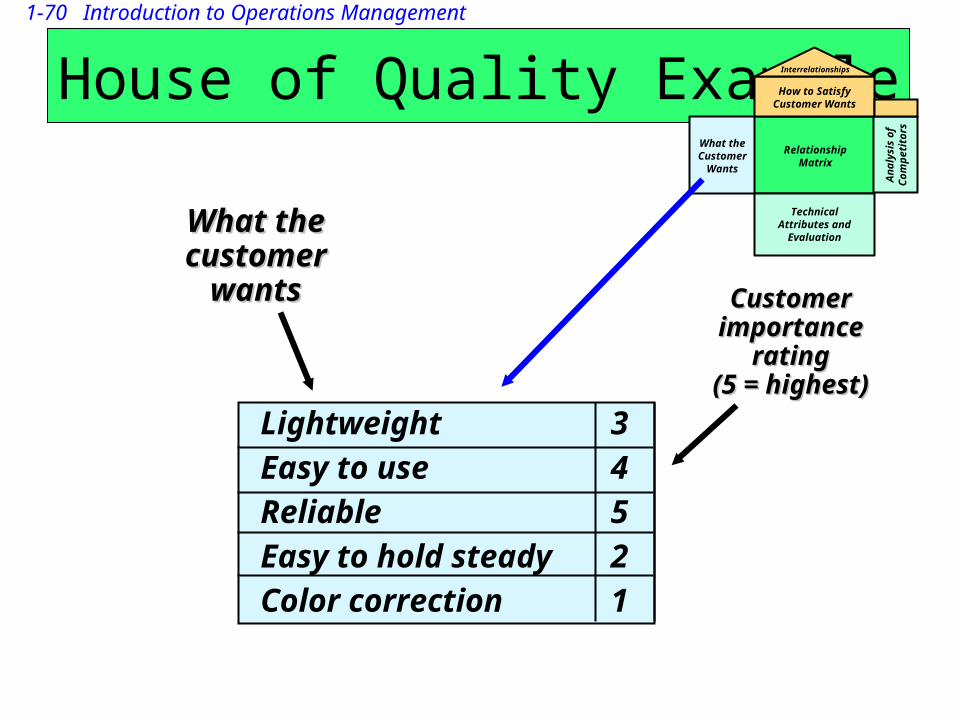
House of Quality Example
CustomerCustomerimportanceimportance
ratingrating(5 = highest)(5 = highest)
Lightweight 3Easy to use 4Reliable 5Easy to hold steady 2Color correction 1
What the What the customer customer
wantswants
What the Customer
Wants
RelationshipMatrix
TechnicalAttributes and
Evaluation
How to SatisfyCustomer Wants
Interrelationships
An
alys
is o
fC
om
pet
ito
rs
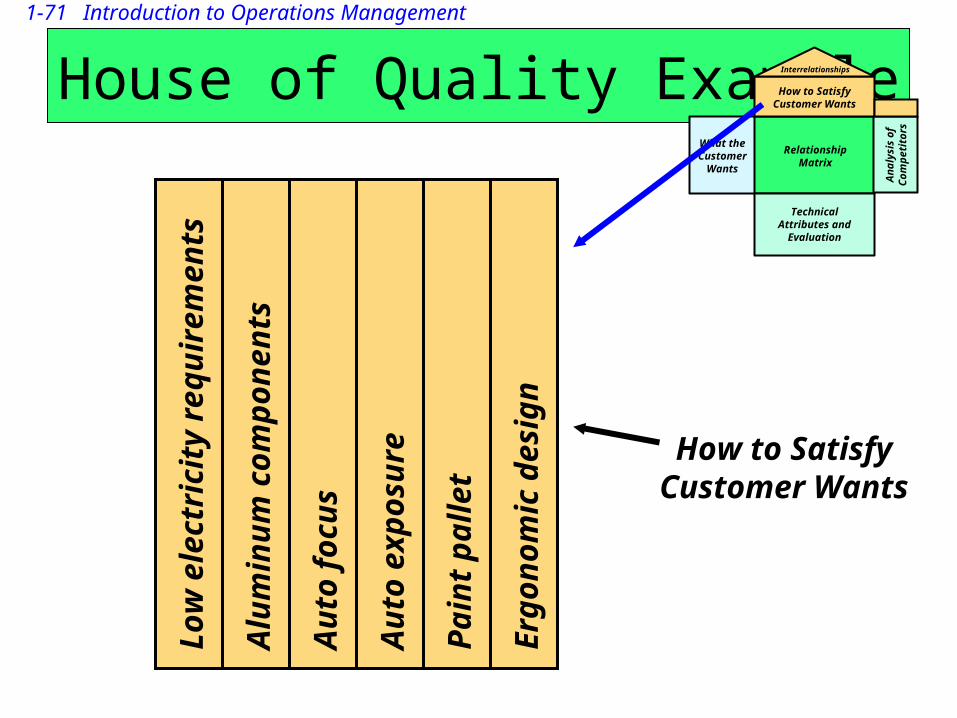
1-71 Introduction to Operations Management
House of Quality ExampleWhat the Customer
Wants
RelationshipMatrix
TechnicalAttributes and
Evaluation
How to SatisfyCustomer Wants
Interrelationships
An
alys
is o
fC
om
pet
ito
rs
Lo
w e
lect
rici
ty r
equ
irem
ents
Alu
min
um
co
mp
on
ents
Au
to f
ocu
s
Au
to e
xpo
sure
Pai
nt
pal
let
Erg
on
om
ic d
esig
n
How to SatisfyCustomer Wants
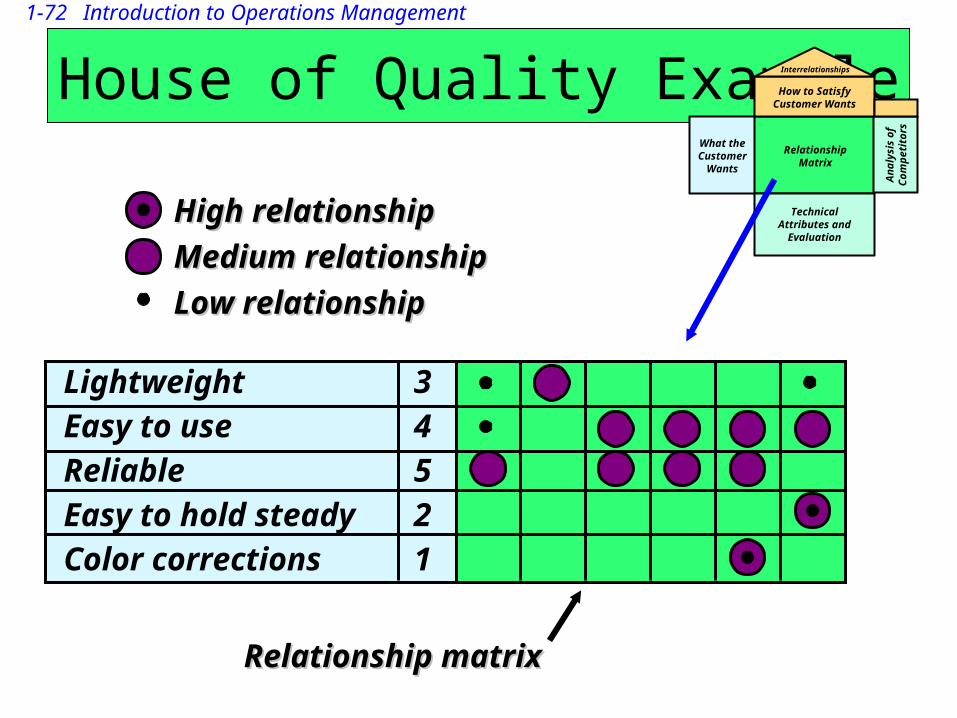
1-72 Introduction to Operations Management
Lightweight 3Easy to use 4Reliable 5Easy to hold steady 2Color corrections 1
House of Quality ExampleWhat the Customer
Wants
RelationshipMatrix
TechnicalAttributes and
Evaluation
How to SatisfyCustomer Wants
Interrelationships
An
alys
is o
fC
om
pet
ito
rs
High relationshipHigh relationship
Medium relationshipMedium relationship
Low relationshipLow relationship
Relationship matrixRelationship matrix
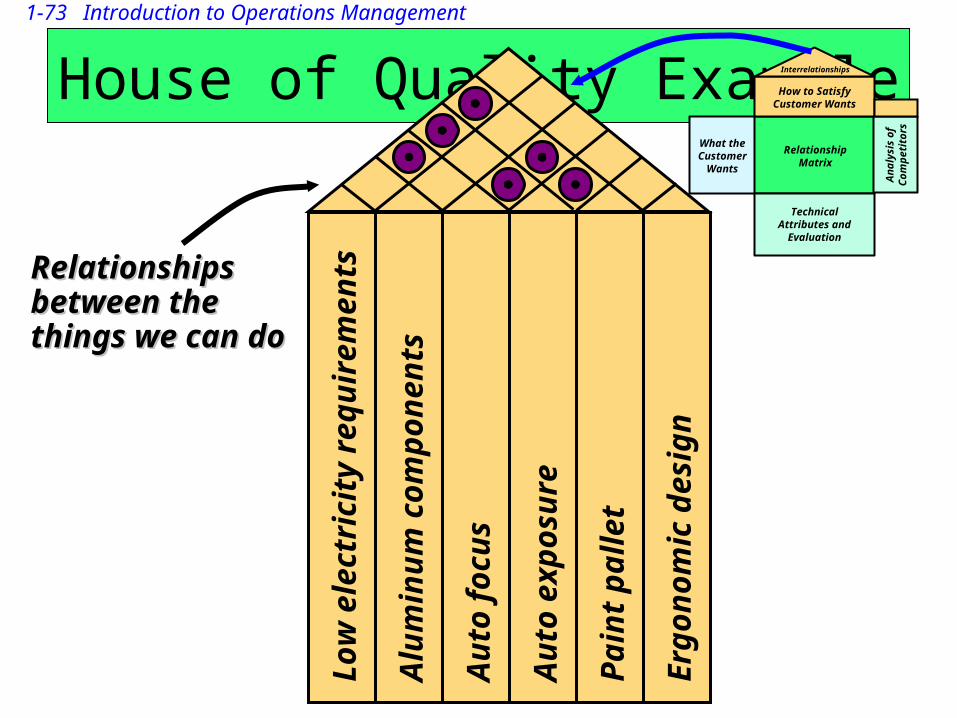
1-73 Introduction to Operations Management
House of Quality ExampleWhat the Customer
Wants
RelationshipMatrix
TechnicalAttributes and
Evaluation
How to SatisfyCustomer Wants
Interrelationships
An
alys
is o
fC
om
pet
ito
rs
Lo
w e
lect
rici
ty r
equ
irem
ents
Alu
min
um
co
mp
on
ents
Au
to f
ocu
s
Au
to e
xpo
sure
Pai
nt
pal
let
Erg
on
om
ic d
esig
n
Relationships Relationships between the between the things we can dothings we can do
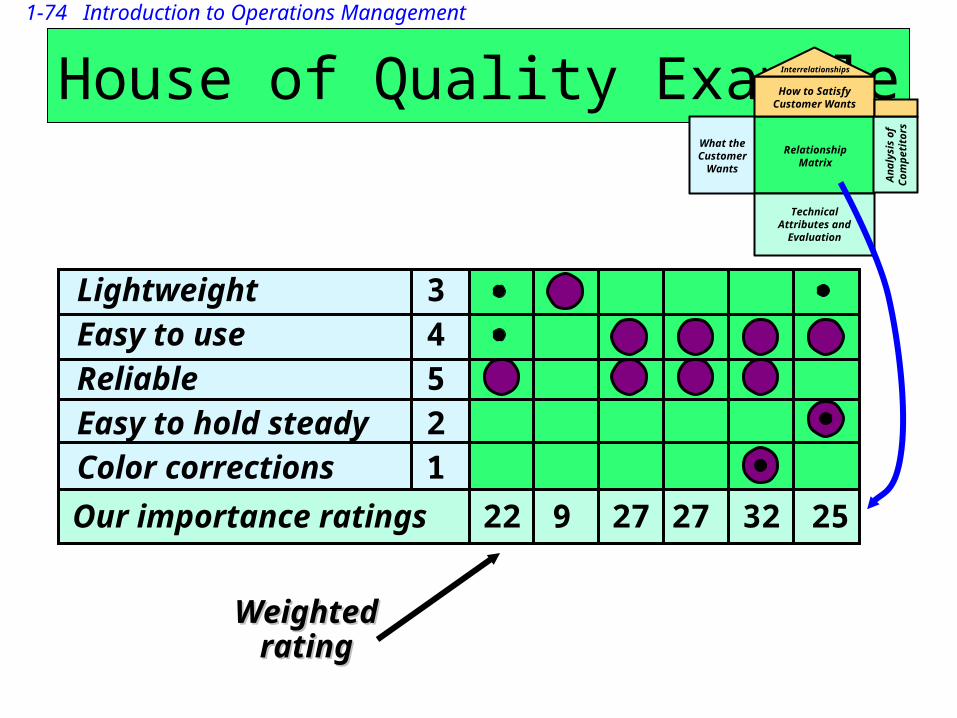
1-74 Introduction to Operations Management
House of Quality Example
Weighted Weighted ratingrating
What the Customer
Wants
RelationshipMatrix
TechnicalAttributes and
Evaluation
How to SatisfyCustomer Wants
Interrelationships
An
alys
is o
fC
om
pet
ito
rs
Lightweight 3Easy to use 4Reliable 5Easy to hold steady 2Color corrections 1
Our importance ratings 22 9 27 27 32 25
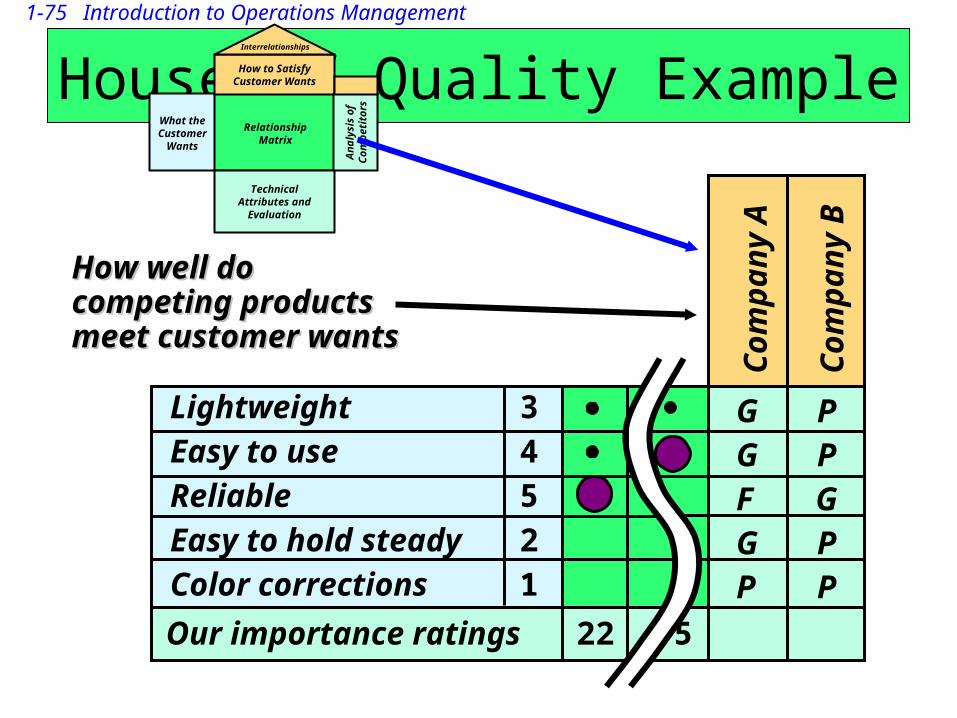
1-75 Introduction to Operations Management
House of Quality Example
Co
mp
any
A
Co
mp
any
B
G PG PF GG PP P
Lightweight 3Easy to use 4Reliable 5Easy to hold steady 2Color corrections 1
Our importance ratings 22 5
How well do How well do competing products competing products meet customer wantsmeet customer wants
What the Customer
Wants
RelationshipMatrix
TechnicalAttributes and
Evaluation
How to SatisfyCustomer Wants
Interrelationships
An
alys
is o
fC
om
pet
ito
rs
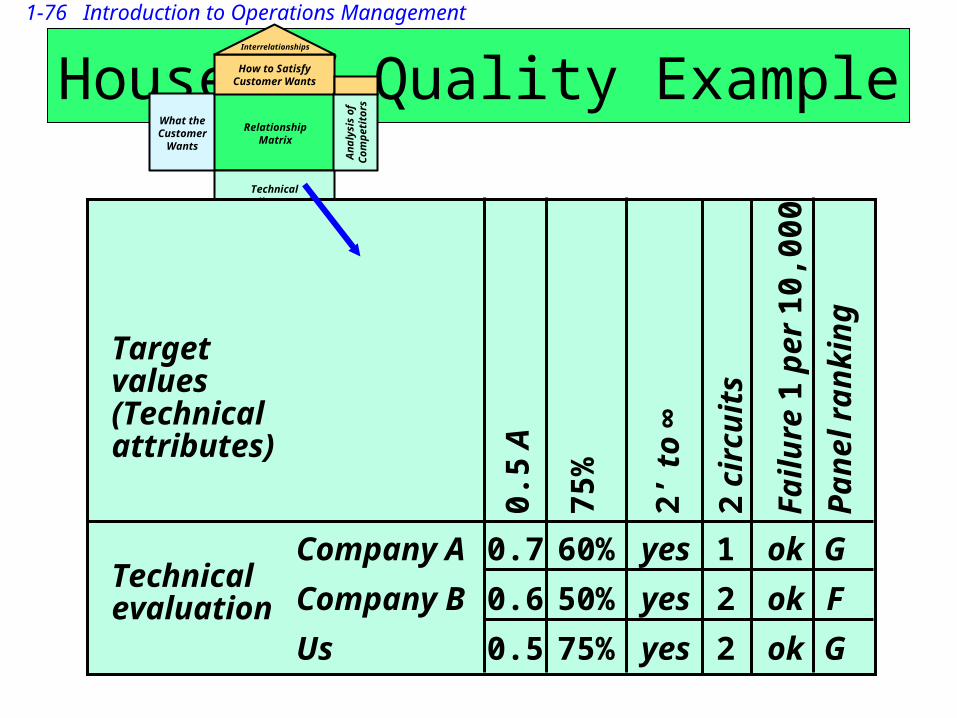
1-76 Introduction to Operations Management
House of Quality ExampleWhat the Customer
Wants
RelationshipMatrix
TechnicalAttributes and
Evaluation
How to SatisfyCustomer Wants
Interrelationships
An
alys
is o
fC
om
pet
ito
rsTarget values(Technical attributes)
Technical evaluation
Company A 0.7 60% yes 1 ok G
Company B 0.6 50% yes 2 ok F
Us 0.5 75% yes 2 ok G
0.5
A
75%
2’ t
o ∞
2 ci
rcu
its
Fai
lure
1 p
er 1
0,00
0
Pan
el r
anki
ng
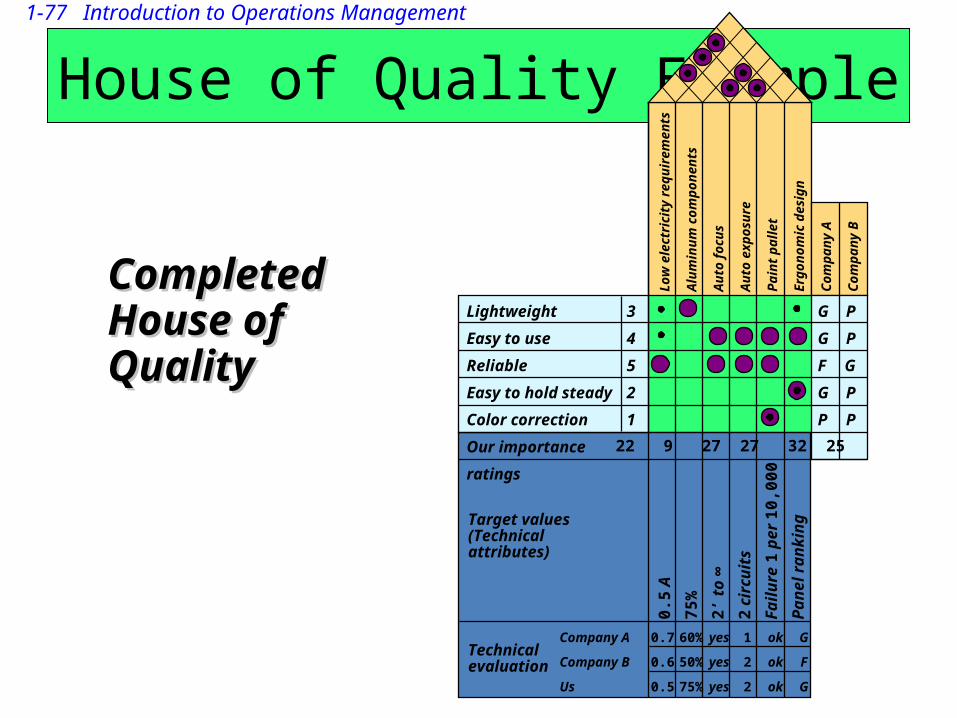
1-77 Introduction to Operations Management
House of Quality Example
Completed Completed House of House of QualityQuality
Lightweight 3
Easy to use 4
Reliable 5
Easy to hold steady 2
Color correction 1
Our importance ratings
Lo
w e
lect
rici
ty r
equ
irem
ents
Alu
min
um
co
mp
on
ents
Au
to f
ocu
s
Au
to e
xpo
sure
Pai
nt
pal
let
Erg
on
om
ic d
esig
n
Co
mp
any
A
Co
mp
any
B
G P
G P
F G
G P
P P
Target values(Technical attributes)
Technical evaluation
Company A 0.7 60% yes 1 ok G
Company B 0.6 50% yes 2 ok F
Us 0.5 75% yes 2 ok G
0.5
A
75
%
2’
to ∞
2 c
irc
uit
s
Fa
ilu
re 1
pe
r 1
0,0
00
Pa
ne
l ra
nk
ing
22 9 27 27 32 25
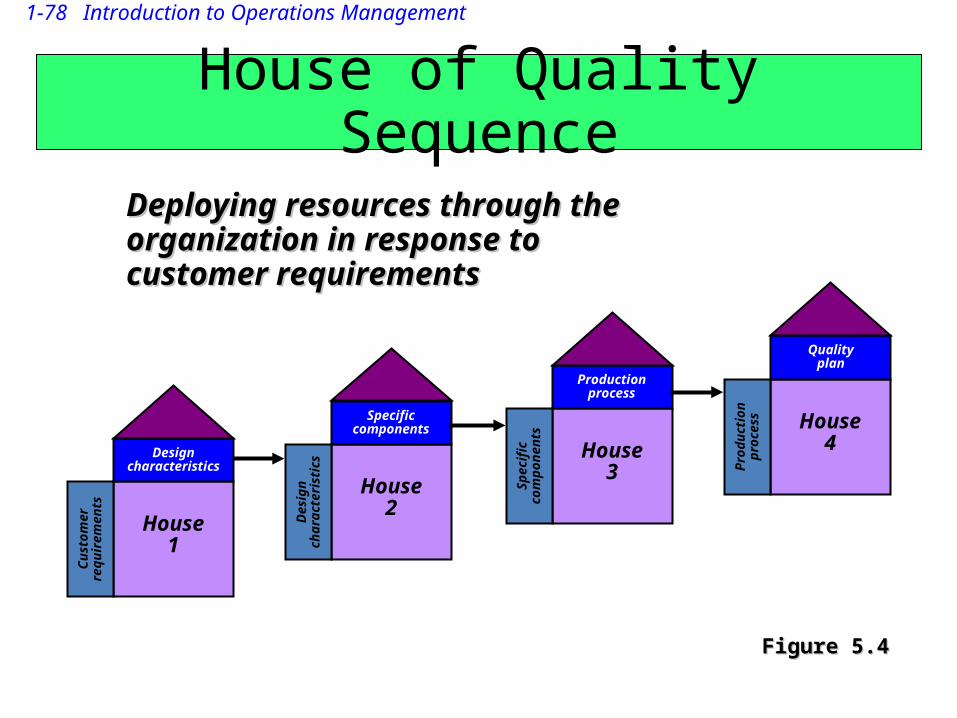
1-78 Introduction to Operations Management
House of Quality Sequence
Des
ign
ch
arac
teri
stic
s
Specific components
House 2
Cu
sto
mer
re
qu
irem
ents
Design characteristics
House 1
Sp
ecif
ic
com
po
nen
ts
Production process
House 3 P
rod
uct
ion
p
roce
ss
Quality plan
House 4
Figure 5.4Figure 5.4
Deploying resources through the Deploying resources through the organization in response to organization in response to customer requirementscustomer requirements
1-79 Introduction to Operations Management
Six Sigma Quality Control
• Application of statistical tools• New approach to process control• Enables organizations to improve their
quality to near-zero defect levels


