Summer Internship Project Report Reseller Development Program and Existing customer network of Marg Compusoft Pvt. Ltd. Submitted in partial fulfilment of the requirements for the award of Post Graduate Diploma in Management Submitted By Rupam Mondal Roll No.-pgfa1343
Transcript
Summer Internship Project Report
Reseller Development Program and Existing customer network of Marg Compusoft Pvt. Ltd.
Submitted in partial fulfilment of the requirements for the award of Post Graduate Diploma in Management
Submitted By
Rupam Mondal
Roll No.-pgfa1343
SUBMITTED TO: DR. SHIKHA BHATIA
July 2014
Page | ii
CertificateThis is to certify that Mr. Rupam Mondal student of Jaipuria Institute of Management; Noida has successfully completed the project work titled Reseller Development Program & Existing customer network From Marg Compusoft Pvt. Ltd. in partial fulfilment of requirement for the completion of PGDM course as prescribed by the Jaipuria Institute of Management, Noida.The project report is the record of authentic work carried out by him during the period from 18th April, 2014 to 30th June, 2014.He worked under my guidance.
SignatureName:Project guide (Internal)Date:
Counter signed by-
SignatureName:Program Director
Page | iii
Date: AcknowledgementI take this opportunity to express my profound gratitude and deep regards to my mentor Dr. Shikha Bhatia for her exemplary guidance, mentoring and constant encouragement throughout the Summer Internship Program. The blessing, help and guidance given by her time to time shall carry me a long way in the journey of life on which I am about to embark.I also take this opportunity to express a deep sense of gratitude to my company mentor Radhika Ahuja, HR, Marg Compusoft Pvt. Ltd., for her cordial support, valuable information and guidance, which helped me in completing this task through various stages.
I also like to thank Mr. Manish Chakraborty, Head Dealer, West Bengal, Marg compusoft Pvt. Ltd. for his constant support and guidance throughout my whole Summer Internship Program.
I am obliged to staff members of Marg Compusoft Pvt. Ltd., for the valuable information provided by them in their respective fields. I am grateful for their cooperation during the period of my Summer Internship Program.
Page | iv
JAIPURIA INSTITUTE OF MANAGEMENT, NOIDA
A-32A, Sector 62, Opp. IBM, Noida 201309
P. +911204638300-01 F.+911202403378 www.jaipuria.ac.in
Rupam Mondal
Page | v
JAIPURIA INSTITUTE OF MANAGEMENT, NOIDA
A-32A, Sector 62, Opp. IBM, Noida 201309
P. +911204638300-01 F.+911202403378 www.jaipuria.ac.in
Declaration
I, Mr. Rupam Mondal hereby declare that this project report is the record of authentic work carried out by me during the period from 18th April, 2014 to 30th June, 2014 and has not been submitted to any other university or Institute for the award of any Degree/ Diploma etc.
Signature Name of the student: Rupam MondalDate:
Page | vi
JAIPURIA INSTITUTE OF MANAGEMENT, NOIDA
A-32A, Sector 62, Opp. IBM, Noida 201309
P. +911204638300-01 F.+911202403378 www.jaipuria.ac.in
Executive summary
Marg Compusoft Pvt. Ltd. is a renowned software company providing software solution in
accounting and in inventory management field since 1992. Tally is the market leader in this
section and many small companies are giving our company a good competition in this section.
So to retain the market share and also spreading its business in to whole India strongly, Marg is
currently adopting and implementing some new strategies. My summer internship assignment
was to conduct a market survey in the West Bengal market to get feedback on Marg products
from existing customers and resellers (dealer).In West Bengal and its surroundings Marg is
doing its business through channel marketing , as the market containing huge opportunity but
as the dealers don’t have huge manpower and the company is not conducting any huge and
frequent marketing activity in this areas its quite difficult for the company to grab a huge
market share .
My Internship objective was to take feedback and suggest to the company on the existing
marketing and promotional activities carried out by them, for this two sets of questionnaires
were designed for existing customers and the reseller network. The major focus areas of
survey were the following:
1. Identification of problems and requirements of MARG’s Reseller network
2. Identification of problems of MARG’s Existing customers.
3. Identifying competitors and their strategies.
Marg provides software solution for pharmaceutical trade, and other businesses. However,
they are only known to the pharmaceutical market. After conducting a market survey on
reseller and dealer’s network in West Bengal and existing customers in Kolkata, the statistical
significance of data was analysed using specialized software (SPSS 20) and inferences were
drawn. It was found that the existing customers had problems with up-gradation of software;
frequent changes in company’s norms and after sales service. However the resellers had host
of problems, firstly Marg is not a preferred choice for the customers, the company has less
manpower and Price of Marg software is greater than local competitors. However, they agreed
that West Bengal is a potential market.
Based on the data analysis and discussions with the customers and resellers, the following is
recommended to the company:
1. Improve quality of service through adequate Quality checks and assurance and then
release the software and its updates.
2. Provide more helping hand and manpower to the dealer so that they can provide quality
of service, all customers are valuable for the company and keep good relation with every
customer as we all know that customer’s are king and which can be achieved by
providing a quality service to the customer at right time and right place
3. Many of the users have less knowledge regarding computer and hence it is so difficult for
the users to adopt the up-gradation so frequently. So I think company should look after
the matter as soon as possible
4. Price reduction to improve sales volumes
5. Improve after sales service by increasing the manpower of the dealer and reseller then
the revenue of the company will eventually increase through WOM as all the customers
6. are looking for a good service from a service providing company
7. Conduct more marketing activities and promotional campaigns for the software
especially at untapped market.
8. Do not to change norms and regulations frequently and provide more benefit to the
customer so that the market becomes penetrate-able.
Tough Marg Compusoft conducted Marketing activity recently on 22nd June, 2014 in Kolkata for
the first time, they also need to organize more marketing activity on the different parts
(districts) of West Bengal from the dealers side, so that the market came to know about the
software better than the previous days and if Marg will do so, I am sure that Marg will do a
good business in West Bengal.
As the Market of west Bengal is penetrate-able and due to lack of knowledge on software, it is
quite difficult for them to penetrate in to the market. If in future Marg will conduct some
awareness program for their possible customers as a whole it will beneficial for them as well.
ABOUT THE COMPANY...........................................................................................................................2BUSINESS STRATEGY.............................................................................................................................. 3
PROBABILITY SAMPLES AND NON-PROBABILITY SAMPLES.............................................................................16Types of non-probability samples...............................................................................................16Judgement sampling...................................................................................................................17
METHOD OF MY DATA COLLECTION.............................................................................................19
INSTRUMENT OF DATA COLLECTION............................................................................................19
QUESTIONNAIRE..................................................................................................................................19Types of Questionnaires..............................................................................................................19
NON DIRECTIVE INTERVIEW................................................................................................................... 21FOCUS INTERVIEW...............................................................................................................................21
JOB TITLE........................................................................................................................................... 22JOB OBJECTIVE....................................................................................................................................22GENERAL NATURE AND LEVEL OF THE JOB................................................................................................23
LIST OF DUTIES AND TASKS PERFORMED...................................................................................................25RELATIONSHIP AND ROLE WITHIN THE COMPANY.......................................................................................26
HYPOTHESIS FOR EXISTING CUSTOMERS...................................................................................................28FOR RESELLER DEVELOPMENT NETWORK..................................................................................................29
DIFFERENT VARIABLES:................................................................................................................30
DATA PROCESSING AND ANALYSIS..............................................................................................34
SCALES OF MEASURE............................................................................................................................34Nominal...................................................................................................................................... 34Ordinal........................................................................................................................................ 34Interval........................................................................................................................................34Ratio............................................................................................................................................34
TESTING AND ANALYSIS...............................................................................................................35
FOR EXISTING CUSTOMER......................................................................................................................35FOR RESELLER DEVELOPMENT NETWORK..................................................................................................47
FOR EXISTING CUSTOMERS.................................................................................................................... 61FOR RESELLER DEVELOPMENT PROGRAM..................................................................................................62
DRAFTING OF A QUESTIONNAIRE................................................................................................72
LEAFLETS OF MARG COMPUSOFT PVT. LTD. FOR DIFFERENT PRODUCTS:.....................................80
ORDER FORM OF MARG SOFTWARE(FROM THE DEALER SIDE)....................................................82
LIST OF CONTACTED DEALERS FOR FEED BACK.............................................................................83
MARKETING ACTIVITY OF MARG..................................................................................................84
List of figure
Figure I: Data source Hierarchy..........................................................................................................14Figure II: Up-gradation vs after sale service...................................................................................36Figure III: Recommendation Vs after sales service........................................................................38Figure IV: Recommendation and after sales service......................................................................40Figure V: Like to recommend...........................................................................................................40Figure VI: Time duration of using Marg vs Recommendation.......................................................42Figure VII: Technology and time duration of using Marg..............................................................44Figure VIII: Duration of using Marg software and service..................................................................46Figure IX: After sale service of Marg Figure X: Up gradation of marg software............................................................................................................................................. 46Figure XI: Providing good incentive vs happy reseller..................................................................49Figure XII: Various factors and switch to Marg software...............................................................51Figure XIII: Switch to Marg..............................................................................................................51Figure XIV......................................................................................................................................... 53Figure XV: Switch to Marg vs special software for different trade................................................54Figure XVI : Switch to Marg vs after sales service..........................................................................56Figure XVII: Customer switches to another software.........................................................................59Figure XVIII: Marg compusoft pvt. Ltd.’s Existing Customers survey report...............................77Figure XIX:Marg compusoft pvt. Ltd.’s Existing Customers survey report..................................77Figure XX:Marg compusoft pvt. Ltd.’s Existing Customers survey report...................................78Figure XXI:Marg compusoft pvt. Ltd.’s Existing Customers survey report..................................78Figure XXII: Marg compusoft pvt ltd’s reseller network survey report (Filled by dealers)........79Figure XXIII:Marg compusoft pvt ltd’s reseller network survey report (Filled by dealers)........79
Page | iii
List of tables
Table 1: List of job performed............................................................................................................25Table 2:Upgradation and after sales service...................................................................................35Table 3 :Easy accessibility, Problem solving capability and knowledge with ASS.......................36Table 4: Recommendation and after sales service.........................................................................37Table 5: like to recommend and ASS...............................................................................................39Table 6: like to recommend and Time duration.............................................................................40Table 7: Behaviour and ASS.............................................................................................................42Table 8: Behaviour and ASS.............................................................................................................43Table 9: Time duration and technology..........................................................................................45Table 10: Time duration of using Marg and technology................................................................47Table 11: Billing , inventory management, special software , ease of us e with any software before Marg.......................................................................................................................................47Table 12: T-test Marg is preffred choice or not..............................................................................48Table 13: Providing a good incentives and Happy reseller...........................................................49Table 14: switch to Marg w.r.t price, accuracy, easy to use and easy to maintain.......................50Table 15: switch to marg and after sales service............................................................................53Table 16: Switch and after sales service.........................................................................................56Table 17: Any existing market and market is moving....................................................................57Table 18: Favourable price..............................................................................................................58
Page | iv
ChapterIntroduction
Introduction
About the CompanyMarg Compusoft PVT. Ltd. is a software manufacturing company. It makes software in the field
of Inventory and Accounting Management. It specialises in providing solutions to
Pharmaceutical industry (for Chemist, C & F, Manufacturing companies), Excise and retail
software’s, online trading and Jewellery software, Mandi software, IT industry & complete
business consulting. The head office of Marg is situated in Roshanara Plaza, Rosanara Road,
Delhi.
Marg compusoft started their journey in 1990 .Anoop Singh and Mahendra Singh are the two
founder of this company. Anoop Singh is holding the position of Chair Man of this company and
Mahendra Singh is holding the position of Director of the company. Since the year 2002 Sudhir
Singh is holding the position of second director in the company. In the year 2004 Sailendar
Singh Become the executive director of the company.
In the beginning Marg Compusoft Pvt. Ltd. was only a Pharmaceutical software manufacturing
company and was doing their business within UP. But from 2006 they started spreading their
business nationally. Currently they have 250+ dealers network within India. They have over 6
lakh users in India and 1500 overseas users. Within 250+ dealers 70% are company’s full time
employees. Currently company‘s 60% business come from Pharmaceutical sector and 40%
from other trades.
Marg Compusoft Pvt. Ltd. is doing their market through channel, as I already told that Marg
have a strong dealer network of 250+ dealers throughout India. They have 1 ASM (Area Sales
Manager) in every area .
Tally, wizzy etc are the main competitor of Marg in national level. Also the local customized
software manufacturers are giving competition to Marg in various areas locally. Marg is a
single market player (nationally) in Inventory Management.
My Internship objective was to take feedback and suggest to the company on the existing
marketing and promotional activities carried out by them, for this two sets of questionnaires
were designed for existing customers and the reseller network. The major focus areas of
survey were the following:
Page | 2
1. Reseller network and their problems and requirements
2. Existing customers problems
3. Issues regarding competitors
4. Others issues if any
Marg provides software solution for pharmaceutical trade, and other businesses. However,
they are only known to the pharmaceutical market.
Business StrategyMarg compusoft Pvt. Ltd. is basically following two type of business strategy
1. Reseller
2. Referral Partner
Reseller
As Maarg compusoft is not sale his software personally, they sales their software through
reseller and dealers network. For this scheme a retailer should purchase at least two Marg
software. Marg provide this software to them at 75% of the actual price. Retailer responsibility
is to sell at list one software by their own and Marg will provide them another customer but
the profit will remain to them.
Referral Partners
Marg also target the CA and other retailer for referral partner. The referral partners are refer
customer to purchase Marg software. If the customer purchases Marg software then Marg
provide the referral partner an incentive of 10-15% on the purchase.
Reseller are basically the one of the business hand of the company. Company doing it’s
maximum business using his reseller network. Marg compusoft has a strong reseller network
through the nation. Reseller is one of the most important part of such kind of channel
marketing as most of the sales depend on the reseller of the company because the more a
reseller sell the sell of the company automatically increased.
But to increase this kind of reseller network Marg is facing some kind of problem regarding
manpower and lac of technical stuff. According to the market review, the marg software is good
Page | 3
even best in some of the segment but the after sell serve is not good. Also frequently policy
changing and up gradation is also a problem as before launching up gradation Marg is not gone
through proper quality cheque up according to the market.
As Tally and Bizzy is one of the market leader of this segment and in our country the user of
tally is more than any other software its quite difficult for the company to penetrate into the
market, as most of the CA are recommended their Clint Tally and the and most of the marketer
did not even know about Marg except the pharmaceutical industry so its quite difficult to work
upon such a project and make it success full .
Before go for a conclusion we should identify the problem area of developing Marg reseller
network And work upon the problem to make something out of it which will help us to
develop Marg reseller network.
Page | 4
Page | 5
Literature reviewChapter-
Literature ReviewAffiliate Revenue Sharing
Starting your own business in today's challenging times can be risky and cost prohibitive, with
no guarantee that you're going to succeed. But what if the risk was non-existent and the cost
was nominal, while the gains were high?
Clear Imaging has built a dependable reputation for developing extraordinary web sites, with
numerous satisfied customers. We thrive on word-of-mouth business, which opens the door to
mutually beneficial partnerships.
There Web Site "Reseller" Affiliate Program is open to select individuals, small businesses and
other web companies who want to engage in a win−win relationship and share in handsome
revenues with little effort required.
Clear Imaging is proud to announce a new Web Site "Reseller" Affiliate Program for individuals,
small business and other web companies. The program is designed to create a win-win
relationship between Clear Imaging and Reseller Affiliates as a way to share revenues with
very little effort on their part.
Sure, we've all seen the ads that say something like this or something more unbelievable. But
it's really possible. As a Clear Imaging Affiliate Reseller, you find the clients, we handle the web
site design, web site development, plus ongoing maintenance and you benefit from the sale.
You keep more money from Clear Imaging's reseller program than any other program out
there.
(Clear Imaging)
In both cases, purchases are influenced by the organization's procurement policy, the
industrial purchases and dealer purchases (purchases from wholesalers and retailers) are
many similarities between. In addition to industrial buyers and dealers purchase volume,
which results in considerable purchasing power. In recent years, the purchasing power of
retailers dealers (slimy et al., 1994) with the brand manufacturer reduces leverage, which
(Bloom and Perry, 2001) has increased. The challenge for manufacturers to combat the power
of their brands and retailers by differentiating (Chernatony and McDonald, 1998) is to develop
Page | 6
relationships with resellers. However, manufacturers and distributors of the brand mark are
not relevant role to that of "false belief" (Webster 2000, p. 17), business-to-business (B2B)
relationships in terms of understanding the consumer and non-trading relationships. This
article is a better brand manufacturers, end-users are concerned, where a B-2-B may offer
advantages for retailers in terms of how to explain responds to the challenge. In the industrial
marketing literature, research was initially critical of the established brands of industrial
markets (Gordon et al., 1993). Consumer Marketing (Keller, 2003), and brand management
focus was the characteristics of the brand and its effects. The survey of industrial buyers, such
as "greater confidence in the purchasing decision," "enhanced corporate reputation," and
"increased competitive advantage" (?. Mitchell et al, 2001 Hutton, 1997), has been recognized
as properties. However, some important differences between industrial market reseller to buy.
For immediate resale resellers buy brands with the purchase of the industrial market a brand,
the organization becomes part of the production process. The reseller purchases include
logistical reasons, but also the needs of end customers (Fairhurst and Fiorito, 1990), there is a
prestige. The reseller purchases brands Reseller organizations are directly competitive
advantage, market and economic performance (Buchanan, 1992) is likely to be affected. Also,
because of its size and purchasing power of many retailers, resellers performance can affect a
manufacturer's success in the market. Another difference between industrial buyers and
resellers (? Murry and Heide, 1998 Beverland, 2005) to implement marketing strategies by
manufacturers as to the ability of end customers. Ghosh et al., Requires (1995) notes, such as
point of purchase displays, samples and resellers and manufacturers marketing tool end
customer to use, but often reseller cooperation. A mismanaged reseller alliance with the brand
manufacturer (Lassar and Kerr, 1996)May undermine the value. Example, stores such as
performing decision makers resellers brand brand equity (Buchanan et al., 1999) could affect.
Also, a brand of party reseller (Quelch and Harding, 1996) to compete with the might introduce
a private label brand. Industrial research brand, with attention to a single brand (Rosenbröijer,
2001) have been purchased. Nevin (1995) points out, however, dealers for resale in brands A
class of competitors. Buy retail coffee brand in the literature often indirectly as product
specification and product quality are assessed using surrogate measures. It directly affects the
brand considering that some studies have mixed findings. Rao and McLaughlin (1989)
Branding is only one of many factors affecting the retailer had buyer's perspective. Collins -
Dodd and Louviere (1999) brand equity of the brand extension acceptance of reseller
impressed to know that, but did not affect pricing decisions or promotion. Baldauf et al., (2003)
Page | 7
in their study resellers tile brand equity (awareness, quality and dedication) explained the
variation in perceptions of brand exposure, but also the price, competition and cost factors
were as important as and found that it turns out well. These studies, however, the reseller to
purchase a brand has not considered the impact of the stock market. Anselmi (2000) market
share with respect to each brand had no effect on long-term relationships with distributors and
manufacturers allocation decisions can affect the ad showed. Major brands are less price elastic
(Bolton, 1989), but moderate trademarks, trade promotions (Hoch and Deighton, 1989) will
benefit most. Resellers minor brands (Blattberg et al., 1995), compared with the manufacturer
for major brands for our customers in a large percentage of the advertising rights tend to pass
on. The value of a brand manufacturer to the end customer and reseller decisions (Anderson,
1999 Narus) and a combined effect is best optimized through a corporate schesis.Metapolites
manufacturers and their respective strategic objectives (Kasulis et al., 1999) to achieve
partners looking with strong market power. Resellers large areas, larger store formats,
competitive prices and superior value through private label brands to meet consumer demand
will seek to maintain profitability. However, the reality of retail sales, manufacturers, retailers
and end customers is a network (Anderson et al., 1994) is included. So, to deal with many
manufacturers and resellers, manufacturers are also a reseller of these competitors
(Holmström, 1997) commission. Within this network, the end customer's brand (Ford et al.,
1998) serve to tie together a resource that connects manufacturers and resellers. Anderson
and Narus (1999) describes the term "equity market" Oriel how these relations resources
(brand, channel resellers and equity), links to manufacturers, retailers and end customers
together. Society (RBV) the resource-based view of the market shares and inter-organizational
relationships (Srivastava et al., 2001) for a theoretical framework behind these ideas. within
the RBV, brands that create competitive advantage for businesses or assets based on the
market are intangible. assets based on the market, as end users and control channel does not
interfere with the organizations or institutions, allowing companies to create value for
shareholders.Relational assets based on the market, such as supply chain management and
customer relationship management processes related to external relations. Research of this
cooperation (jap, 1999), satisfaction (Cannon and Perreault, 1999), commitment (Ganesan,
1994) and Trust (2000 Hoyt rights) as an external relationship emphasizes the importance of
the results. However, these external relationships within the brand is not included as a
research resource. Brands such as external relations B2B optimize resources, manufacturers
work (Heide, 1994) on the system of government should know. Ghosh and John (1999) Brand
Page | 8
equity for the results of business relationships and stable resources, including the impact of
regime type, identified. End customers with brands with strong brand equity that the firm can
rule better market access. However, relational governance and form partnerships with
resellers to use the minor may be more beneficial for businesses with trademarks. With a
lower prestige restaurant chains named these chains had fewer resources, as they were more
likely to engage in comb and Ketchen (1999) inter-organizational collaboration, confirmed this
point. Business-to-business marketing research now understands the importance of branding,
brand manufacturers to final customers the impression of a single phase connection is still
there. Brodie et al., (2002) research on inter-organizational relationships as sources of value
that the brand has not been addressed noted. Many researchers make collective and
participatory aspects of a recognized manufacturer and reseller relationships made, (Keller
and Lehmann, 2002) as one of the support with respect to the role of resellers.Consequently,
manufacturers reseller attitudes and behaviors towards brands on the effect of these factors is
unknown.
(Judy Motion, August 2006)
Page | 9
Page | 10
Chapter -3Objectives and
Research
Rationale & Objective of the project
Resellers are basically the one of the strong business hand of the company. Company doing its
maximum business using his reseller network.
Marg compusoft has a strong reseller network through the nation. Reseller is one of the most
important parts of such kind of channel marketing as most of the sales depend on the reseller
of the company because the more a reseller sell the product, the sells of the company
automatically increased.
But to increase this kind of reseller network Marg is facing some kind of problem regarding
manpower and lack of technical stuff. According to the market review, the marg software is
good even best in some of the segment but the after sell service is not good. Also frequently
policy changing and up gradation is also a problem as before launching up gradation Marg is
not gone through proper quality cheque up according to the market.
As Tally and Bizzy is one of the market leader of this segment and in our country the user of
tally is more than any other software its quite difficult for the company to penetrate into the
market, as most of the CA are recommended their Clint Tally and the and most of the marketer
did not even know about Marg except the pharmaceutical industry so its quite difficult to work
upon such a project and make it success full.
Before go for a conclusion we should identify the problem area of developing Marg reseller
network
And work upon the problem to make something out of it which will help us to develop Marg
reseller network.
The objective of the project is –
To analyze reseller network and their basic requirements.
To analyze existing customers problem and their needs to improve the after sale
service.
Suggest the company how to improve software according to the customers to sustain in
to this high competitive market.
Page | 11
Scope of the projectMarg Compusoft Pvt. Ltd. although there in the market since 1990 but did not make a good
impact on the other market except Pharmaceutical trade. As Tally is one of the market and in
this competitive market local software makers are also give this company a neck to neck
competition, so to sustain in to market and to flourish in to the market Marg need a more
strong reseller team which help him to grow its business and make the company well known to
its domain.
So in this point of view we have an ample opportunity to work on the reseller network and
help the company to increase its business and give the company the base on which it can create
a building of success to be a market leader.
Though Marg software is start diversify its business from Pharmaceutical domain to other
domains from 2006 but due to good technology in this short span of time other marketer start
feeling the presence of Marg in the Market. But due to lack of reseller network Marg is still
lacking some big market in various cities, though it has a good reseller network in DELHI ,but it
need to work out on the other metropolitan cities and other cities to capture a good market
share in this sector .
My project and task is to create reseller network in Kolkata ,and we all know Kolkata market is
one of the oldest market in India and which have ample opportunity to flourish this kind of
business as this kind of software is the basic need for a business man to run his business in a
well maintained way. But when we talked to some of the customer I came to know that the
actual problem faced by the market when using Marg and also using other soft ware .So to
retain its reputation in the market we need to develop our after sales service which is due to
lack of dealer in to the market as Kolkata market have only one dealer of Marg and lack of
reseller .So sometime it is quite impossible for a dealer to cover the whole market by his
own ,and due to lack of reseller it is more complicated for him to do his job .So our prime duty
is to create a good reseller network in Kolkata, then I think eventually those problem will
minimized and we utmost try to do so. It is basically focuses on the concept of supplier-
reseller relationships in the frame of B-to-B markets. The scope is to study the suitable reseller
partnership for Marg Compusoft Pvt. Ltd.. In addition, Examination of suitable reseller
partnership is one of the prime scope. The B-to-B scope is one of the important factors. This
topic also revolves around the B-C network in the form of after sales service of Marg compusoft
Page | 12
Pvt. Ltd. This study also targeted on the dyadic interaction and even though it is right that the
distributors of our company form networks, the network standpoint is out of reach. This study
is also resolute on researching two dyad at same time. On other hand, the possibility of this
study is to maintain on the sales part as well as the marketing. These two fields are incredibly
close to one other but there is at a halt pretty clear difference.
In this research I used Exploratory Research Design, and for this reason I collected
primary data from the existing market (Kolkata and its surroundings) through
questioner and also collected secondary data from the internet for review of literature.
I made two questioners as I want to focus on two thing
Re-seller network(Proposed by Company)
Existing customer (As per the market requirement)
Page | 13
Page | 14
Figure I: Data source Hierarchy
Population: desired, defined, and excluded
In any study of academic research elements (people, organizations, etc.) which form the
subject of a study population of objects is important to have a clear explanation. In most
studies in this population is a named set of specifications are in accordance with the elements,
which will be limited. These specifications provide clear guidance on the elements to be
included in the population do. Our review sample survey data meets two basic requirements
that focus on the design of the sample design. First, we have a population of only one of each
element to be included in the sample (non-zero) are concerned with the possibility of a
probability sample. Calculate the properties of estimators for the given design is the basis of
the statistical theory. The sample must be drawn from a population, then the other, it is
necessary to be able to build a frame that appropriate sample population included all elements
of the list of units. It is not possible or not practical to list all the elements of the population, the
group of elements that can be used as sampling units. For example, in the USA it is impossible
to build a list of all the houses, but you can select the sample in several stages. In the first stage,
counties were randomly sampled; In the second phase, the selected census tracts are sampled
counties; In the third phase, the road block is tested in selected areas. Then, in the final
selection stage that houses the list of selected blocks are required.
Sample design
Our consideration of survey data focuses on sample design that satisfies two basic
requirements. First, we are concerned only with probability sampling in which each element of
a population has a known ( non zero) probability of being include in the sample . This is the
basic for statistical theory in the derivation of the properties of the survey estimators for a
given designs. Second if the sample is to be drawn from a population, it is necessary to be able
to construct a sampling frame that list suitable sampling units that encompass all elements of
the population. If it is not feasible or is impractical to list all population elements, some clusters
of element can be used as sampling units. For example, it is impractical to construct a list of all
households in the United States, but we can select the sample in several stages.
Page | 15
The selection of a sample from a defined target population requires the construction of a
sampling frame. The sampling frame is commonly prepared in the form of a physical list of
population elements- although it may also consists of rather unusual listing, such as directories
or maps, which display less obvious linkages between individual lists entries and population
elements. A well- constructed sampling frame allows the researcher to take hold of defined
target population without the need to worry about contamination of the listening with
incorrect entries or entries which represent elements associated with the excluded population.
Probability samples and non-probability samples
The use of samples in educational research is usually followed by the calculation of sample
estimates with the aim of either
(a) Estimating the values of population parameters from sample statistics,
(b) testing statistical hypotheses about population parameters. These two aims require that
the researcher has some knowledge of the accuracy of the values of sample statistics as
estimates of the relevant population parameters. The accuracy of these estimates may
generally be derived from statistical theory – provided that probability sampling has been
employed. Probability sampling requires that each member of the defined target population
has a known, and non-zero, chance of being selected into the sample.
Page | 16
dealing objectively with issues concerning either the estimation of population parameters or the testing of hypotheses.
The use of non-probability samples is sometimes carried out with the (usually implied) justification that estimates derived from the sample may be linked to some hypothetical universe of elements rather than to a real population. This justification may lead to research results which are not meaningful if the gap between the hypothetical universe and any relevant real population is too large.
In some circumstances, a well-planned probability sample design can be turned accidentally into a non-probability sample design if subjective judgement is exercised at any stage during the execution of the sample design. Some researchers fall into this trap through a lack of control of field operations at the final stage of a multi-stage sample design. The most common example of this in educational settings occurs when the researcher goes to great lengths in drawing a probability sample of schools, and then leaves it to the initiative of teaching staff in the sampled schools to select a ‘random sample’ of students or classes.
Types of non-probability samples There are three main types of non-probability samples: judgement, convenience, and quota samples. These approaches to sampling result in the elements in the target population having an unknown chance of being selected into the sample. It is always wise to treat research results arising from these types of sample design as suggesting statistical characteristics about the population – rather than as providing population estimates with specifiable confidence limits.
Convenience sampling
A sample of convenience is the terminology used to describe a sample in which elements have
been selected from the target population on the basis of their accessibility or convenience to
the researcher.
Judgement sampling
Judgment or purposive sampling, the researcher appropriate target population samples that
represent a typical sample is able to select the item that is based on this assumption. Agree.
Page | 17
Quota sampling
Sometimes the samples closer to home, would be located in space or on the administrative side, the elements in the sample can be taken only for that reason, "casual sketches called" the researcher from the data collection.
In this sampling the population at first segmented and then sample is collected from each segment. It is non probabilistic sampling and no random sample is collected.
It is mainly useful when there is a limitation of time.
dealing objectively with issues concerning either the estimation of population parameters or the testing of hypotheses.
The use of non-probability samples is sometimes carried out with the (usually implied) justification that estimates derived from the sample may be linked to some hypothetical universe of elements rather than to a real population. This justification may lead to research results which are not meaningful if the gap between the hypothetical universe and any relevant real population is too large.
In some circumstances, a well-planned probability sample design can be turned accidentally into a non-probability sample design if subjective judgement is exercised at any stage during the execution of the sample design. Some researchers fall into this trap through a lack of control of field operations at the final stage of a multi-stage sample design. The most common example of this in educational settings occurs when the researcher goes to great lengths in drawing a probability sample of schools, and then leaves it to the initiative of teaching staff in the sampled schools to select a ‘random sample’ of students or classes.
Types of non-probability samples There are three main types of non-probability samples: judgement, convenience, and quota samples. These approaches to sampling result in the elements in the target population having an unknown chance of being selected into the sample. It is always wise to treat research results arising from these types of sample design as suggesting statistical characteristics about the population – rather than as providing population estimates with specifiable confidence limits.
(a) the selection and measurement of individual population elements is often too expensive, and
(b) certain complexities may be introduced intentionally into the sample design in order to address
more appropriately the objectives and administrative constraints associated with the research. The
complexities most often employed in educational research include the use of stratification
techniques, cluster sampling, and multiple stages of selection.
Simple random sampling
It is also known as probabilistic sampling . The sample are collected form the population in
random manner.
It is a basic sampling technique. Sampling is done without replacement. It is a unbiased
surveying technique.
Page | 18
Stratified sampling
The technique of stratification is often employed in the preparation of sample designs because it generally provides increased accuracy in sample estimates without leading to substantial increases in costs. Stratification does not imply any departure from probability sampling – it simply requires that the population be divided into subpopulations called strata and that probability sampling be conducted independently within each stratum. The sample estimates of population parameters are then obtained by combining information from each stratum.
Cluster sampling
A population of elements can usually be thought of as a hierarchy of different sized groups or ‘clusters’ of sampling elements. These groups may vary in size and nature. For example, a population of school students may be grouped into a number of classrooms, or it may be grouped into a number of schools. A sample of students may then be selected from this population by selecting clusters of students 12 as classroom groups or school groups rather than individually as would occur when using a simple random sample design.
Method of my Data collectionIn my I used convenience sampling technique as our company dealing with software
product dealing in the area of B2B market (Accounting and inventory management).
I collected data through online and offline questioner and take 51 sample for existing
customer and take 13 sample for reseller development network as there is insufficiency
of dealer in west Bengal (<30) but I believe that the report will show us the actual result
because each dealer having a strong referral network and some short of reseller
network and taking this into consideration that the dealers are leading reseller
network and referral network by their own and they are the representative of each
network individually. As it is quite difficult to access the reseller network and referral
network of each dealer’s area due to some internal and personal issues, I am
considering their feedback as the feedback of the targeted audiences.
Instrument of data collection
Page | 19
These include Questionnaire, Interview, Observation and Reading.Essentially the researcher must ensure that the instrument chosen is valid and reliable. The validity and reliability of any research project depends to a large extent on theappropriateness of the instruments. Whatever procedure one uses to collect data, it must be critically examined to check the extent to which it is likely to give you the expected results.
QuestionnaireThis is a data collection instrument mostly used in normative survey. This is a systematically prepared form of document with a set of questions deliberately designed to elicit responses from respondents or research informants for the purpose of collecting data or information. It is a form of inquiry document, which contains a systematically compiled and well organized series of questions intended to elicit the information which will provide insight in to the nature of the problem under study.
It is form that contains a set of questions on atopic or group o topics designed to be the respondents constitute the data for the research. The respondents are the population samples of study. The answer provided by answered by the respondents.
Types of Questionnaires
Questionnaires may be designed as
Structured or closed form
Unstructured, open ended form
Structured Questioner
They are those in which some control or guidance is given for the answer. This may be
described as closed form because the question are basically short, requiring the respondent to
provide a yes or no or checking an item out of a list of given responses. Questions that require
yes or no answers are also termed as Dichotomous questions. It may be multiple choices option
from which the respondent selects the answer closer to their own option. The respondents
choices are limited to the set of option provided.
Unstructured Questioner
This type which is also termed as open ended or unrestricted type of questioner are calls for a
free response in the respondent’s own words. The respondent frames and supplies the answer
to the question raised in the questioner. It also constitute questions which give the respondents
an opportunity to express his or her opinion from a set of options. Spaces are often provided for
respondents to make their inputs.
Four main kinds of interview
1. The structured interview;
2. The unstructured interview;
3. The non- directive interview; and
4. The focus interview.
Structured Interviews
The structured interviews are formal because, sets of questions are known as interview
questioner are posed to each interviewee visited and the responses are recorded on a
standardize schedule. It is therefore characterised as being a closed interview situation. In
structure interview, the interviewer follows a set pattern usually adhering as much as possible
to the order of questions on the interview questioner which posing the questions in a formal
manner. Interviewer must always ensure that the atmosphere of an interview is congenial to
establish interviewer-interviewee rapport.
Unstructured Interview
The unstructured interview is the less formal type in which although sets of questions may be
used, the interviewer freely modifies the sequence of questions, changes the wordings and
sometimes explains them or adds to them during the interaction. Hence the researcher has to be
Page | 20
careful in order not to deviate from his focus. The atmosphere may often casual. This is
conducted in what is characterised as an open situation because there is more flexibility and
freedom in the interaction.
Non directive interview
The non directive or unguided give excessive freedom for the respondent to express his/ her
ideas subjectively and spontaneously as he or she chooses or able to. There is no set question in
this style. It is the most appropriate type of interview of use when investigating issues where
the respondent has to be allowed to talk uninterrupted on a broad topic which will
unconsciously reveal personal motives, feelings, attitudes etc very much.
Focus Interview
Focus interview as the name suggests, focuses on the respondents subjective responses
researchers to render the non directive interview more interviewer control with the use with
the verbal cues that serves as stimulus to inspire respondent to volunteer more information on
the subject. As the story unfolds the researcher can hum in approval of what the respondents
submits of chip in a stimulating questions to encourage the flow of the conversation.
Transcribing
Data recorded from verbal interaction with respondents have to be transcribed i.e. convert the
speech sound into words as accurately as possible.
Observation
The study of photographs, videotapes, tape recordings, art objects, computer software and films
fall within this type of data collection procedure. The procedure should be unobtrusive to
enable informants to share their reality directly with researchers. It is creative and captures
attention visually. The presence of a photographer or the video technician may be intrusive and
influence responses. Observation is one of the very important methods for obtaining
comprehensive data in qualitative research especially when a composite of both oral and visual
data become vital to the research. A researcher obviously needs an audio-visual recorder for a
complete collection of such comprehensive record. By the use of observation strategy,
Page | 21
researchers are able to obtain first hand information about objects, and eventful happenings
like durbar and festivals. The possibility of distorting facts and records are reduced to the barest
minimum.
For my research purpose I used Structured questioner which is close ended .Because if I
used open ended questioner rather than close ended questioner I may face several
problem at the time of interpreted the data from the open ended questioner as I am using
exploratory research method. All the question are close ended so that the respondent
should answer at least option and the close ended questioner are also easy to converted
into quantitative data from the qualitative one where in case of open ended question it is
quite difficult to convert the qualitative data in to quantitative data. The questioner is
structured so that it help the respondent to answer sequentially and also help the
researcher to describe the questioner and make a interpretation from the questioner.
Job description
Job title
As the company(Marg Compusoft Pvt. Ltd. ) suggested, I work on reseller development
program at Kolkata under the head dealer of the company for West Bengal sector Mr. Manish
Chakroborty.
Job objective
My job objective is to create a strong reseller network in Kolkata so that the business of Marg
will spread in Kolkata as well as in West Bengal and there by the company can earn a good
market share in eastern region market.
Also my objective is to increase product awareness in to the market so that the Market came to
know our product and as one our Manager truly says that “ Market main jo dhikhega bohi
bikega” means visibility can increase sell as well as profit of the company.
For that reason I am increasing the awareness regarding the product in to the market so that
the untouched market and competitor market will came to know about our product and the
may shift towards our product.
Page | 22
General nature and level of the job
As we all know that it’s a marketing job which I am performing right now but specifically I am
basically doing cold calling as well as short of promotional activities, Market survey on the
reseller network and existing customers .
Though I am doing cold calling which is a duty of a sales man, but It help me to grow more
knowledge about the market and the behaviour of the people and I think it will benefitted me
in future.
The job profile is a well mix of physical and mental labour which I am doing every day. We have
to make our self comfortable whether we are tired or not in front of a customer when we
approaches them.
It seems to be very easy but the ground reality is when the weather of eastern region in the
month April-June is really pathetic I work under 42 Degree centigrade with humidity 75% . It
shows us how tough the job actually is but its an awesome experience to experience such kind
of job which tells us about the situation of any sales man and which also help us to know more
about the ground problem faces by a sales man so that in future if I worked as a sales manager
and I have to manage a sales team I can execute the job well.
Job analysis
As I previously told about the various function I perform in the job, I like to elaborate each
function and want to analyze each position of the job performed by me.
Cold calling
Cold calling is soliciting potential customers who were not expecting to speak with you. The
term cold refers to the fact that you have not laid any ground work of your call. If your calling
prospects who have already expressed interest in your products, such as a prospect who fills
out a post card or website request for information, then it referred to as warm calling.
Different sales experts will refer to both phone calls and physical drop in visits as cold calling,
but most sales people think of cold calling in terms of the telephone.
Page | 23
When in doubt, you can usually assume that a reference to cold calling relates to phone calls
rather than visits. Cold calling is one of the least liked tasks in sales. It emotionally demanding
because receives cold sales calls can bring out the worst in people. So sales people launching
into a round of cold calls can expect verbal abuse, prospects who hang up on them, and even
occasional threats. The best approach is to remind your self that they are not rejecting you,
they are simply reacting to the situation. Just let any hostility roll off and move on to the next
name on the list.
Promotional activity
Promotional activity is a part of marketing a product which is executed by the marketing
person of a company or other hired organization to increase the visibility of the product of the
company.
Promotional activities basically done in several aspects which is generally called marketing
activity which includes advertising, flexing, spreading WOM using existing customer,
Promotional videos through social network, customer feedback videos, serving leaflets, wall
painting etc.
In our organization I performed bannering and flexing of autos, Shoots customer feedback
videos for social network, serves leaflets etc which is a part of marketing activity recently
conducted by our company in Kolkata region.
Promotional activities are one of the most valuable investments for a company in long run. If
the promotional activities performed by a company well it stars giving results within a short
span of time. But the company should continues promotional activities in to the market so that
there visibility is always high into the market.
Market survey
Market survey is one of the most important part of marketing because it tells a lot about the
present scenario of the market. Market survey helps a company to know all the requirements,
drawbacks and benefit of the market if a proper survey is done by any marketing personnel it
can change the views of the company and it will help the company to increase its business as
well as it can tells a company the before and after promotional market response and sales. But
on the other hand a improper survey may results totally opposite from the previous one.
Here I conducted market survey on the requirements of existing customer and reseller
network and tries to analyze the problem and also tries to provide some solution to the
company so that the sales and customer satisfaction of our company will increase in this
Page | 24
respected area. As we all know now a days the marketer are looking for a good customer
satisfaction and they believes that customer is king which may increase positive WOM in to the
market and for that the sales of the company will increase. Otherwise one dissatisfied
customer can spread enough negative WOM so that the sales of the company will eventually
decrease which effects more than a positive word of mouth spreads by a satisfied customer
which can costs a lot for a company.
List of duties and tasks performed
Here is a list of job performed by me
Table 1: List of job performed
Sl no Job Performed Key to success
1 Cold calling Be patience when talk to a person, be specific, Tries to know
about the main problem of the person, Be confident when
talking, Tries to make it a conversation type rather a dialogue
type, Do not lie to them, Make a friendly atmosphere,
physically and mentally presence is required when taking to a
person, Keep a simple smile on your face etc
2 Promotional activity Select the targeted audience, approach them in a polite
manner, Try to present on the spot when the activity is on the
way, Don’t show your frustration towards them if any etc
3 Market survey Make a well judged and topic oriented questioner, Tries to
filled it by the targeted audience in front of you, Convince the
audience the benefit of giving feedback, always tries to
describe the meaning of the question to the audience if
required to avoid complication etc
4 Feedback calling Always wish the person first, tell the person about the purpose
of your calling, Be positive, don’t show anger etc
5 Contact Always contact to the designated person if you face any
problem in the market, Try to make a good reputation with
them, Always open yourself for any kind of suggestion from
them, Try to consult with them about the market etc
Page | 25
Relationship and role within the company
Business relationship management aims to maintain a positive relationship a positive
relationship with customers as well as within the organization. It’s a part of service strategy. It
affects the company’s business directly. If the inter organizational relationship (relationship
between the employees) are good then the services provided to the customer will be better
and the sales will automatically increase. On the other hand if relationship is not good then
sales may goes down.
Each and every person within the company should play some specific role to reach to the
targeted goal.
In case of a intern he or she should maintain a good relationship with his or her pears and as
well as with his or her mentor so that he or she can learn most from the organization so that it
will benefitted him or her in future.
Page | 26
Page | 27
Chapter - 4
Hypothesis & Different variables
Hypothesis
Marg Compusoft PVT. Ltd. is a software manufacturing company. They make software in the
field of Inventory And Accounting Management. They are specialist in providing solution of
Pharmaceutical industry, Customize software solution, & IT services. They also develop lot
many software including pharmaceutical (for Chemist, C & F, Manufacturing companies),for
complete pharmaceutical trade. Excise and retail software’s, online trading and Jewellery
software, Mandi software. They are also present in internet solution, IT industry & complete
business consulting.
According to my report I have to do research on the reseller network of the company as the
company is doing his business using channel marketing and also existing customer.
For doing so I am using exploratory research design and for that I have to construct several
hypothesis on basis of which I can test the collected data and finally will made some conclusion
out of this.
Hypothesis for existing customers
H0: There is a significant relationship between up gradation and after sales service.
H1: There is no significant relationship between up gradation and after sales service.
H0: There is a significant relationship between easy accessibility, problem solving
capability & knowledge of the service person with after sales service.
H1: There is no significant relationship between easy accessibility, problem solving
capability & knowledge of the service person with after sales service.
H0: There is a significant relationship between recommendation and after sales service.
H1: There is no significant relationship between recommendation and after sales
service.
Page | 28
H0: There is a significant relationship between time span of using Marg software and
recommendation of Marg software.
H1: There is no significant relationship between time span of using Marg software and
recommendation of Marg software.
H0: There is no significant difference between behaviour and after sales service.
H1: There is a significant difference between behaviour and after sales service.
H0: There is a significant positive relationship between technology and time duration of
using Marg software.
H1: There is no significant positive relationship between technology and time duration
of using Marg software.
H0: There is a significant relationship between Billing, Inventory management, Special
software of your trade, Ease of use with any software used before Marg.
H1: There is no significant relationship between Billing, Inventory management, Special
software of your trade, Ease of use with any software used before Marg.
For reseller development network
H0: Marg is the preferred choice for the customer.
H1: Marg is not the preferred choice for the customer.
H0: There is a significant positive relationship between Marg is providing good
incentive and the reseller are happy selling Marg software.
H1: There is no significant positive relationship between Marg is providing good
incentive and the reseller are happy selling Marg software.
H0: There is a significant relationship between Price of Marg software, Accuracy, Easy to
use and maintain with customer easily switch to Marg software.
H1: There is no significant relationship between Price of Marg software, Accuracy, Easy
to use and maintain with customer easily switch to Marg software.
Page | 29
H0: There is a significant positive relationship between after sales service and Customer
easily switch to Marg software.
H1: There is no significant positive relationship between after sales service and
Customer easily switch to Marg software.
H0: Marg is providing specialized software for different trade.
H1: Marg is not providing specialized software for different trade.
H0: There is no significant difference between Marg existing market and there is a
recent trade of the market to move form manual accounting to accounting using
software.
H1: There is significant difference between Marg existing markets and there is a recent
trade of the market to move form manual accounting to accounting using software.
H0: There is a significant relationship between Prices of Marg software, Favourability of
marg software with easy to convince the customer to purchase Marg software.
H1: There is no significant relationship between Prices of Marg software, Favourability
of marg software with easy to convince the customer to purchase Marg software.
H0: There is no significant difference between number of customer and existing market.
H1: There is significant difference between number of customer and existing market.
Different variables:
Independent Variable:
An independent variable is the variable you have control over, what you can choose and
manipulate. It is usually what you think will affect the dependent variable. In some cases, you
may not be able to manipulate the independent variable. It may be something that is already
Page | 30
there and is fixed, something you would like to evaluate with respect to how it affects
something else, the dependent variable like colour, kind, time.
Example: You are interested in how stress affects heart rate in humans. Your independent
variable would be the stress and the dependent variable would be the heart rate. You can
directly manipulate stress levels in your human subjects and measure how those stress levels
change heart rate.
In this project(Up gradation, Easy accessibility, Problem solving Capability, Knowledge of the
person, After sale service, Behaviour, Technology, Billing, Inventory management, Special
software of your trade, Ease of us ) – For existing customer,(Providing good incentive, Price of
Marg software, After sales service, Existing Market )-For reseller development network are
independent variable.
Dependent Variable:
A dependent variable is what you measure in the experiment and what is affected during the
experiment. The dependent variable responds to the independent variable. It is called
dependent because it "depends" on the independent variable. In a scientific experiment, you
cannot have a dependent variable without an independent variable.
Example: You are interested in how stress affects heart rate in humans. Your independent
variable would be the stress and the dependent variable would be the heart rate. You can
directly manipulate stress levels in your human subjects and measure how those stress levels
change heart rate.
In this project After sales service, Recommendation, Duration of using Marg, Any software used
before Marg, Customers are easily switch to Marg software, Recent trend of shifting in
accounting, Customer are purchasing Marg software, Existing market are the dependable
variables.
Page | 31
Moderating Variable:
A moderating variable represents a process or a factor that alters the impact of an independent
variable X on a dependent variable Y. The moderating variable may take the form of an
indicator variable (0/1 values), a categorical variable, or a continuous variable. Moderation of
the effects of X on Y is usually of interest in the context of a well-theorized area of research,
such as the provision of labour by individuals in which the human capital and labour market
segmentation theories are both well established. Moderating variables are those variables
which help us understanding the relationship between Independent variable and Dependable
variable.
Example: You are interested in how stress affects heart rate of human beings. Where heart rate
is dependent variable and stress is independent variable. Also heart rate is also depend on
various factor like exercise , Fear etc .This fear ,Exercise are moderating variables.
Page | 32
Page | 33
Chapter-Analysi
s
Data processing and analysis
Scales of measureThere are basically four types of scales are presents
1. Nominal
2. Ordinal
3. Interval
4. Ratio
Nominal
Nominal scale is the basic measurement of scale. In this scale there is no relation between the
options provided by the researcher. Basically nominal scale is used in case of YES/NO question
or question like which kind if food you like? Where there is no chance that the options are
related.
Ordinal
In case of Ordinal scale of measurement the options are related but we can’t define how much
less or greater a option is from one another.
Interval
Interval scale is one of the higher level of scale of measurement after Ordinal scale. In Interval
scale we can easily define how much one option is differs from the option. It is a modified
version of Ordinal scale. We can easily define the relationship between the options and the
difference between the options is in same intervals that’s why this scale is known as interval
scale. There is no absolute zero in interval scale.
Remember that you can use non-parametric techniques with interval and ratio data. But non-
parametric techniques are less powerful than the parametric ones.
Ratio
Ratio scale is highest level of measurement scale. In Ratio scale there is an absolute zero is
present. So the element like distance, no of building are measured in Ratio scale where we can
Page | 34
define the difference between the options and also the intervals are same for each cases but the
main thing is the count should not be less than 0.
Variables are presented as counts and percentages if categorical or as means and standard
deviations if continuous. Non-normally distributed continuous variables are presented as
geometric means (95% CI). The differences in tested parameters between participants from
high- and low-income neighbourhoods and students were explored using an independent t-test
(normally distributed continuous variables), Mann U Whitney test (non-normally distributed
variables), or a Chi square (χ2) test (categorical variables). Analysis of the question that probes
people’s reasons for going to fast food restaurants was performed only on participants who
reported eating at fast food restaurants. A p-value of 0.05 and less was considered statistically
significant. All analyses were performed using SPSS version 20, SPSS Inc., Chicago, IL
Testing and Analysis
For existing customer
H0: There is a significant relationship between up gradation and after sales service.
H1: There is no significant relationship between up gradation and after sales service.
Table 2:Upgradation and after sales service
rate * rate Crosstabulation
Count
Rate Total
Excellent Good Average Bad Worst
rate
Excellent 5 3 2 1 0 11
Good 2 3 8 3 1 17
Average 0 3 5 3 1 12
Bad 0 2 2 5 1 10
Worst 0 0 0 1 0 1
Total 7 11 17 13 3 51
Chi-Square Tests
Value Df Asymp. Sig. (2-
sided)
Page | 35
Pearson Chi-Square 21.911a 16 .146
Likelihood Ratio 22.271 16 .135
Linear-by-Linear Association 11.574 1 .001
N of Valid Cases 51
a. 24 cells (96.0%) have expected count less than 5. The minimum expected count
is .06.
Figure II: Up-gradation vs after sale service
After doing the chi-square it shows that the sig. value is statically not significant. Accept the
null hypothesis.It shows there is a significant relation between up-gradation and after sales
services.
H0: There is a significant relationship between easy accessibility, problem solving
capability & knowledge of the service person with after sales service.
H1: There is no significant relationship between easy accessibility, problem solving
capability & knowledge of the service person with after sales service.
Page | 36
Table 3 :Easy accessibility, Problem solving capability and knowledge with ASS
rate * rate Crosstabulation
Count
Rate Total
Excellent Good Average Bad Worst
rate
Excellent 5 3 2 1 0 11
Good 2 3 8 3 1 17
Average 0 3 5 3 1 12
Bad 0 2 2 5 1 10
Worst 0 0 0 1 0 1
Total 7 11 17 13 3 51
Chi-Square Tests
Value df Asymp. Sig. (2-
sided)
Pearson Chi-Square 21.911a 16 .146
Likelihood Ratio 22.271 16 .135
Linear-by-Linear Association 11.574 1 .001
N of Valid Cases 51
a. 24 cells (96.0%) have expected count less than 5. The minimum expected count
is .06.
H0: There is a significant relationship between recommendation and after sales service.
H1: There is no significant relationship between recommendation and after sales
service.
Table 4: Recommendation and after sales service
Case Processing Summary
Cases
Valid Missing Total
Page | 37
N Percent N Percent N Percent
total * rate 51 98.1% 1 1.9% 52 100.0%
total * rate Crosstabulation
Count
Rate Total
Excellent Good Average Bad Worst
total
4 3 0 1 1 0 5
5 1 2 0 0 0 3
6 0 4 2 1 1 8
7 1 2 1 3 1 8
8 0 0 4 3 0 7
9 1 2 2 0 0 5
10 1 0 3 2 0 6
11 0 1 1 0 0 2
12 0 0 0 1 0 1
13 0 0 2 1 1 4
14 0 0 1 1 0 2
Total 7 11 17 13 3 51
Chi-Square Tests
Value df Asymp. Sig. (2-
sided)
Pearson Chi-Square 42.870a 40 .349
Likelihood Ratio 48.694 40 .163
Linear-by-Linear Association 5.539 1 .019
N of Valid Cases 51
a. 55 cells (100.0%) have expected count less than 5. The minimum expected count
is .06.
Page | 38
Figure III: Recommendation Vs after sales service
It shoes that there is a significant relationship between Easy accessibility, problem solving
capability and knowledge of the person with after sale service. As the sig. square value shows
that it is statically not significant, so we are accepting the null hypothesis.
H0: There is a significant relationship between ASS of Marg software and
recommendation of Marg software.
H1: There is no significant relationship between ASS of Marg software and
recommendation of Marg software.
Table 5: like to recommend and ASS
like to recoand * rate Crosstabulation
Count
Rate Total
Excellent Good Average Bad Worst
like to recoand
already recommend the
software to many3 8 11 4 2 28
I like to recommend the
software4 2 5 6 0 17
may be in future 0 1 1 3 1 6
Total 7 11 17 13 3 51
Page | 39
Chi-Square Tests
Value df Asymp. Sig. (2-
sided)
Pearson Chi-Square 10.232a 8 .249
Likelihood Ratio 11.536 8 .173
Linear-by-Linear Association 1.771 1 .183
N of Valid Cases 51
a. 11 cells (73.3%) have expected count less than 5. The minimum expected count
is .35.
Figure IV: Recommendation and after sales service
As p>0.05 so it is statically not significant. Accept null hypothesis.
It shows that there is a significant relation between recommendation and after sales service.
GGraph
Page | 40
Figure V: Like to recommend
Table 6: like to recommend and Time duration
like to recommend * time duration Cross tabulation
Count
time duration Total
1 year 2years 3years 4years 5years or more
like to recoand
already recommend the
software to many1 3 4 5 15 28
I like to recommend the
software5 2 8 1 1 17
may be in future 1 2 2 1 0 6
Total 7 7 14 7 16 51
Chi-Square Tests
Value df Asymp. Sig. (2-
sided)
Pearson Chi-Square 22.276a 8 .004
Likelihood Ratio 24.969 8 .002
Linear-by-Linear Association 13.037 1 .000
N of Valid Cases 51
a. 12 cells (80.0%) have expected count less than 5. The minimum expected count
is .82.
Page | 41
Figure VI: Time duration of using Marg vs Recommendation
As p<0.05 so it is statically significant. Reject null hypothesis.
It shows that there is no relation between span of using Marg software and recommendation.
H0: There is no significant difference between behaviour and after sales service.
H1: There is a significant difference between behaviour and after sales service.


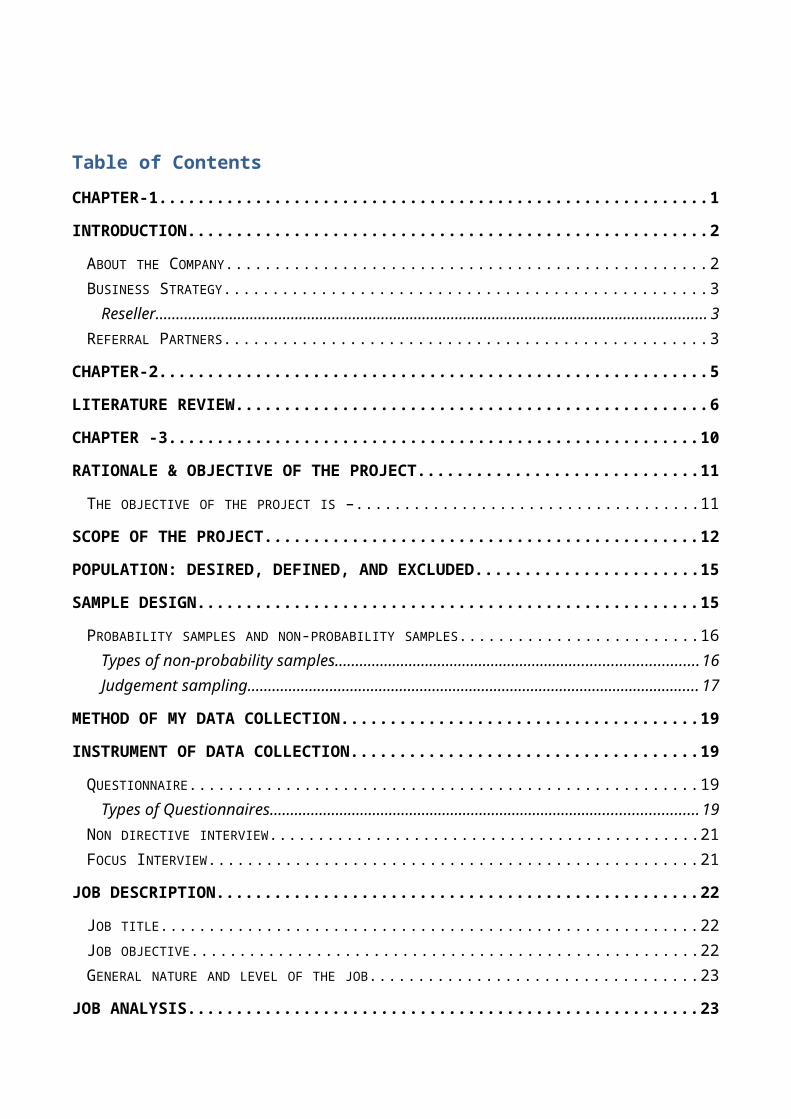


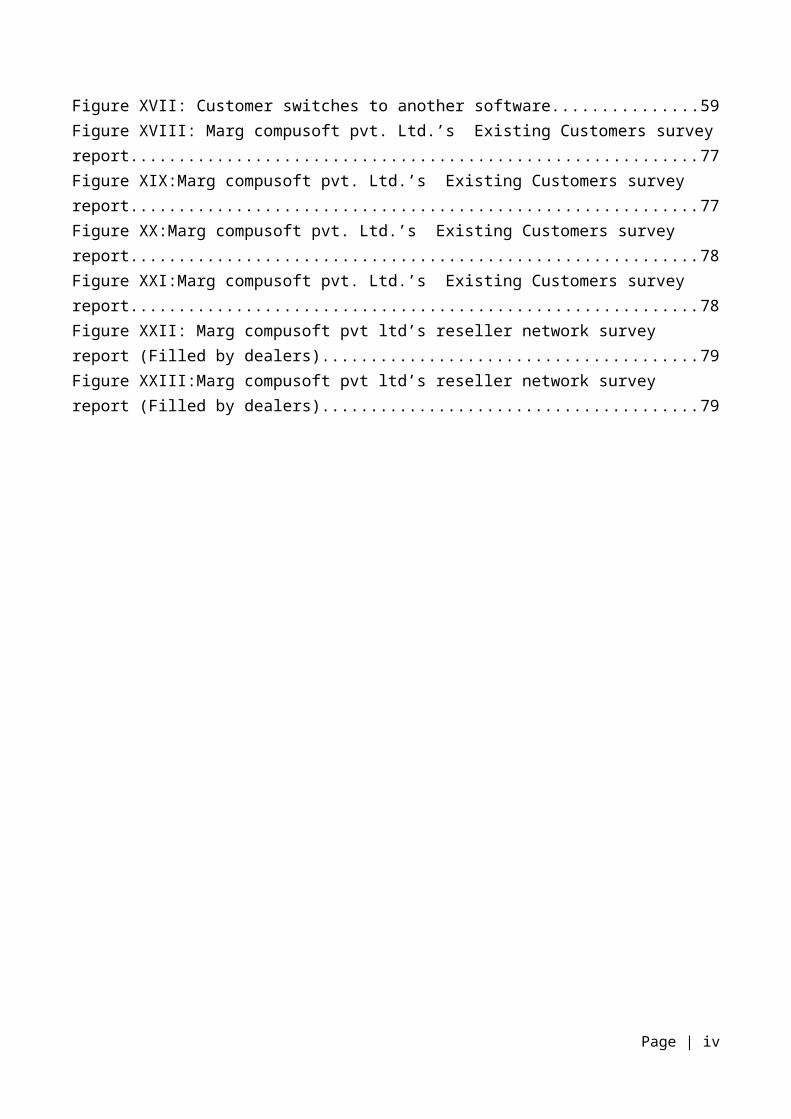


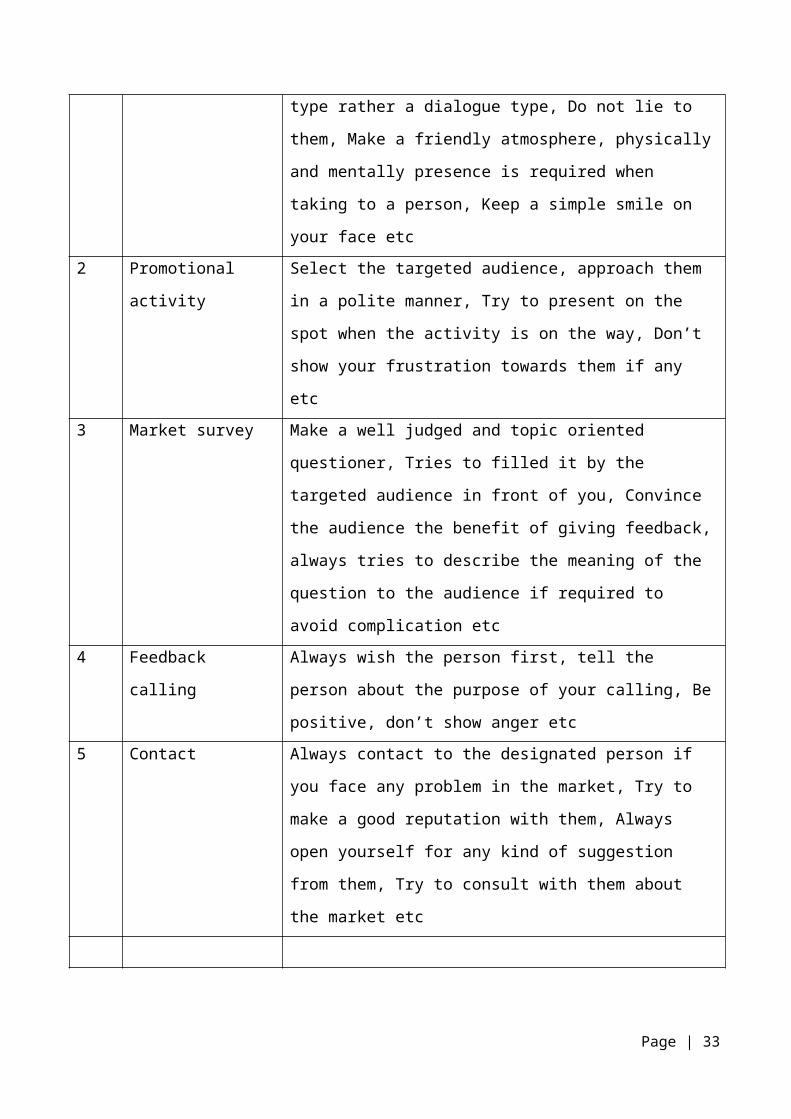


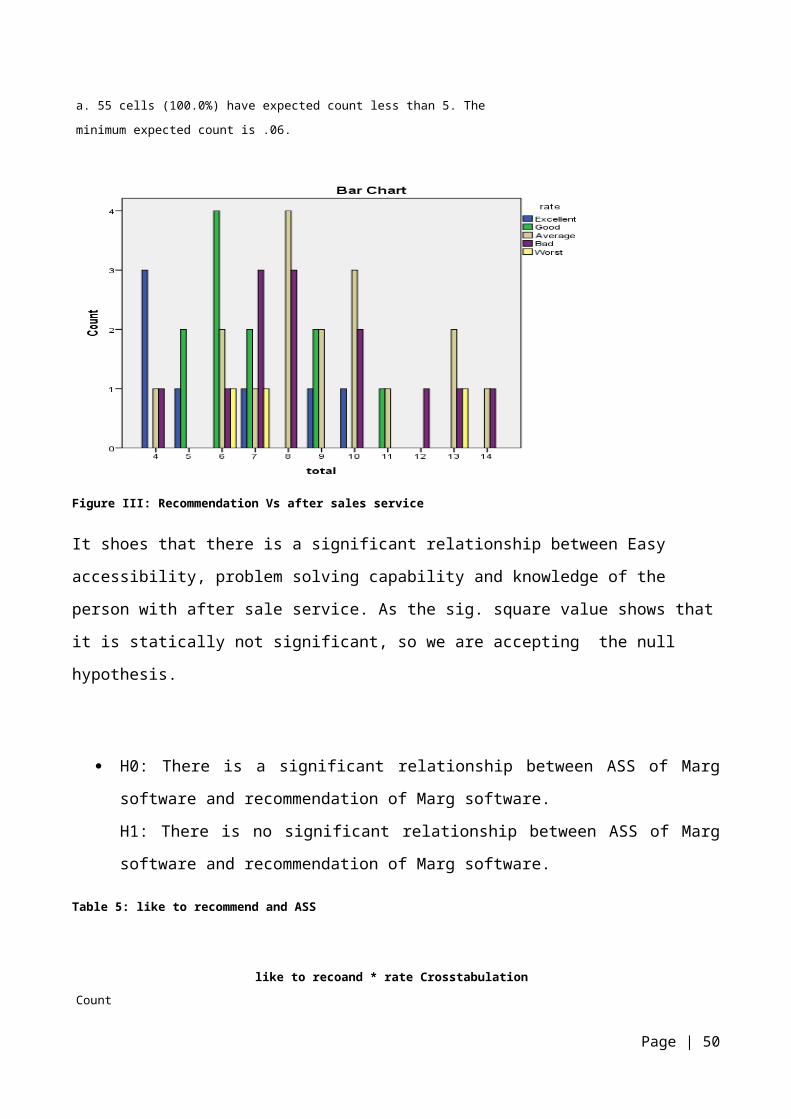


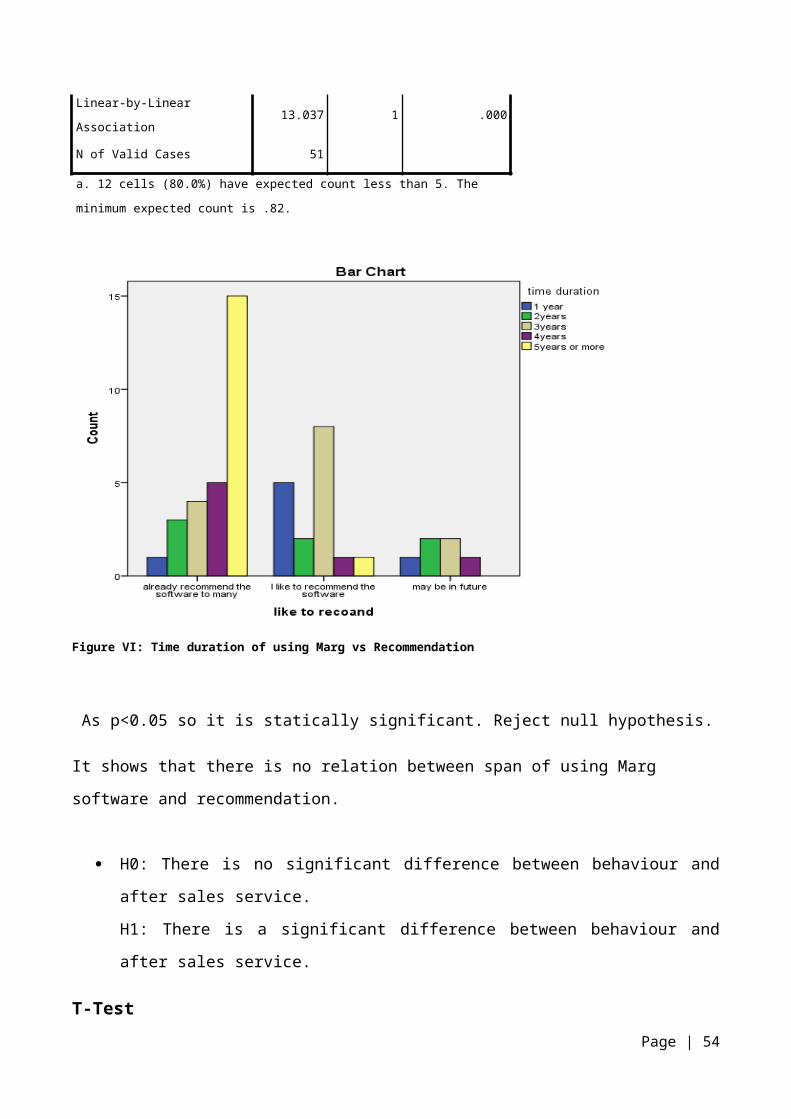
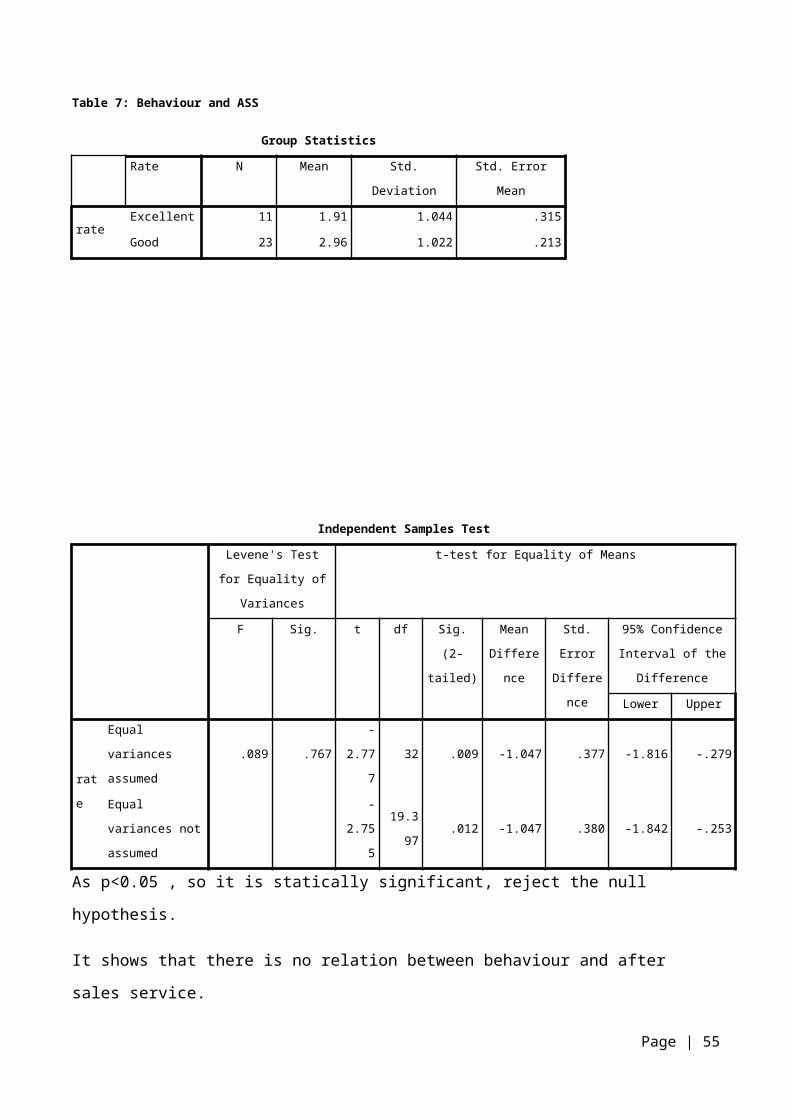


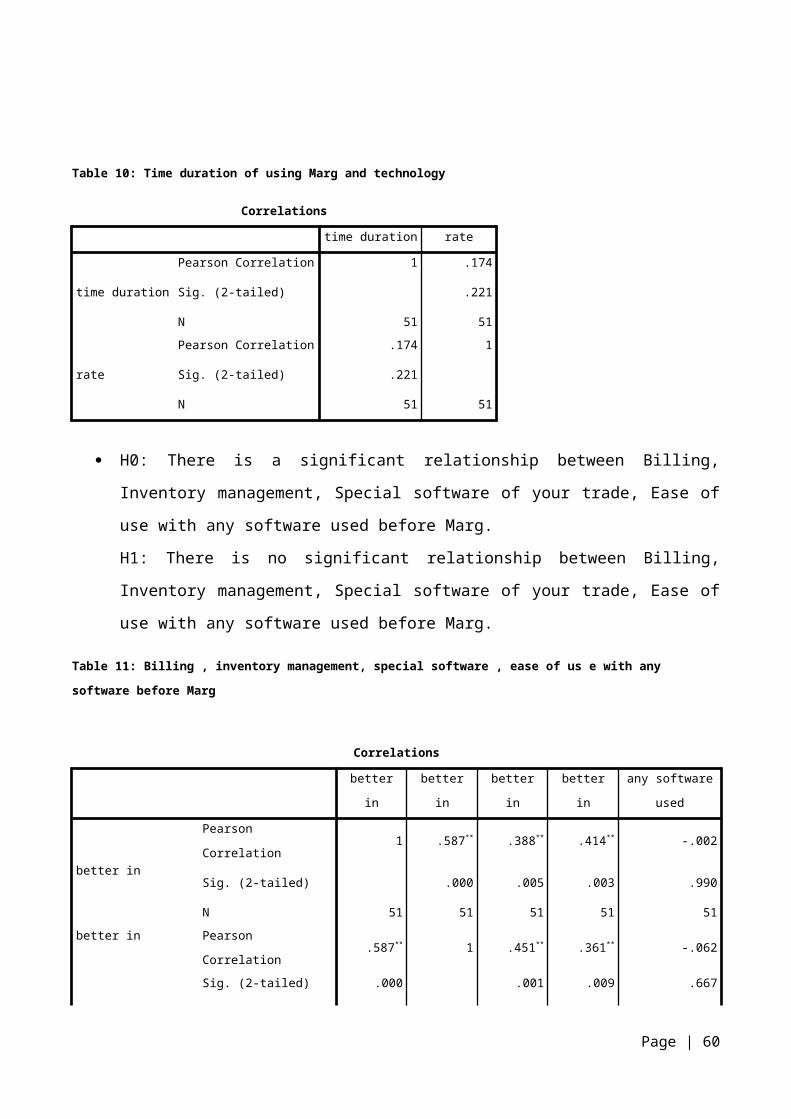


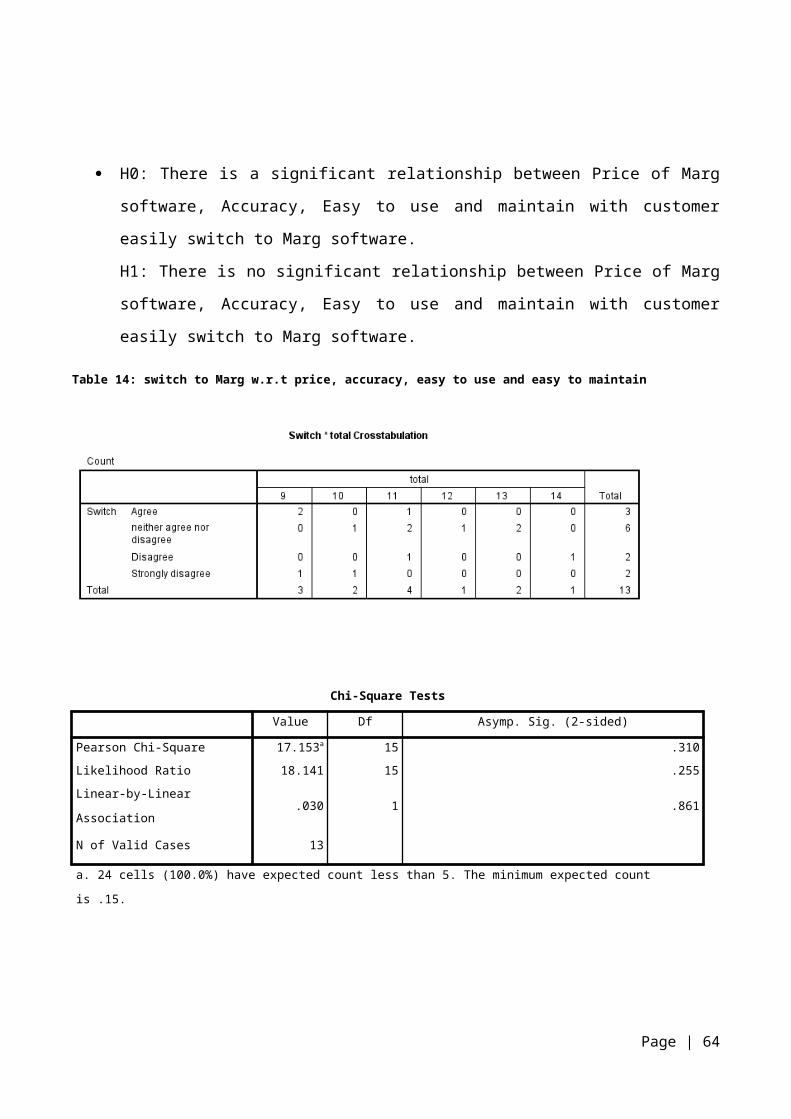


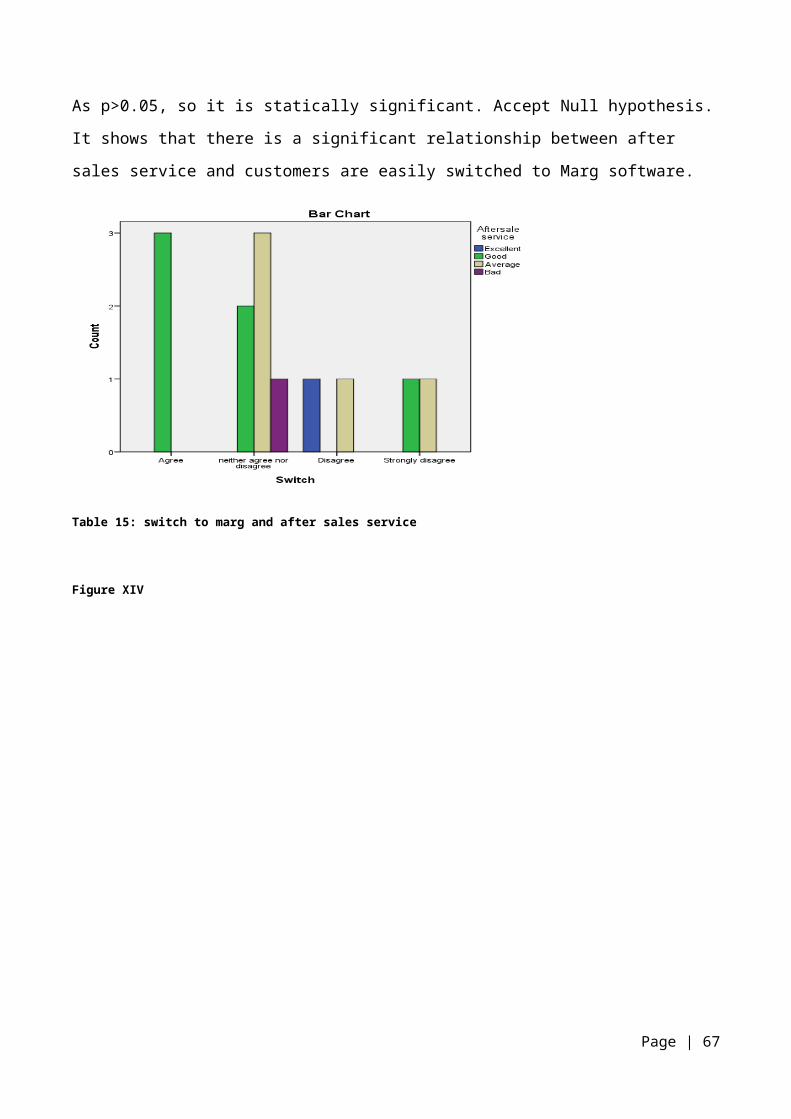


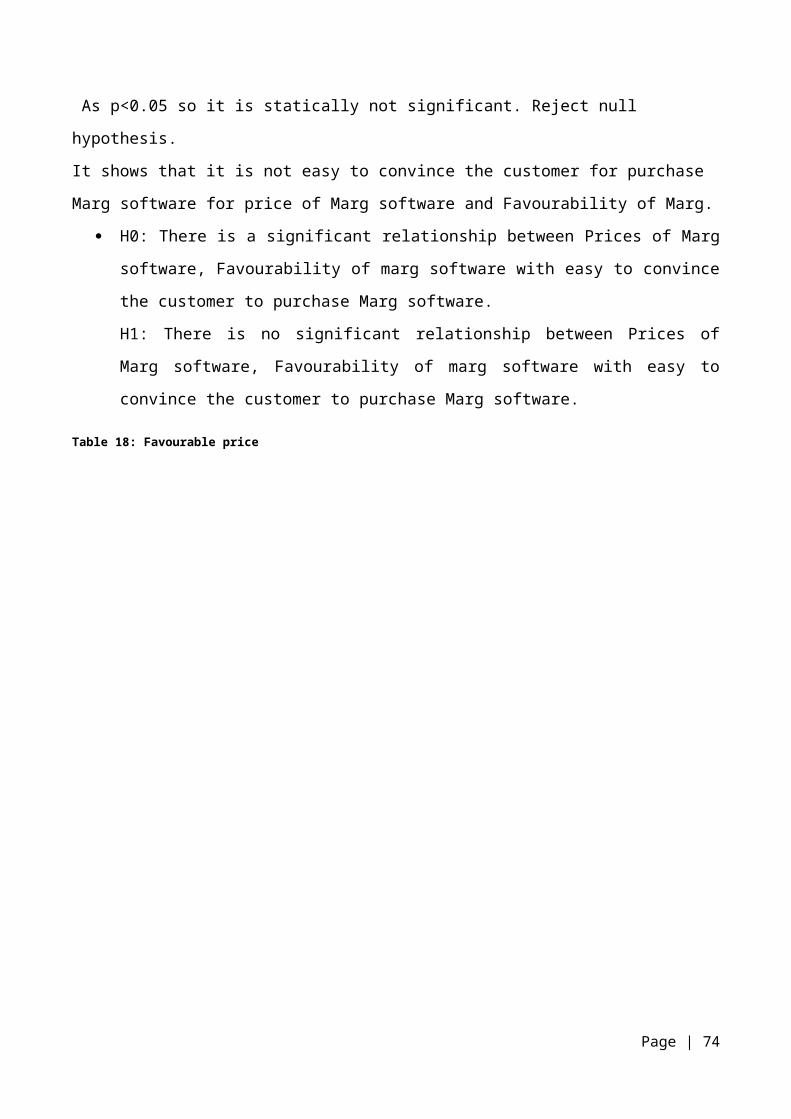
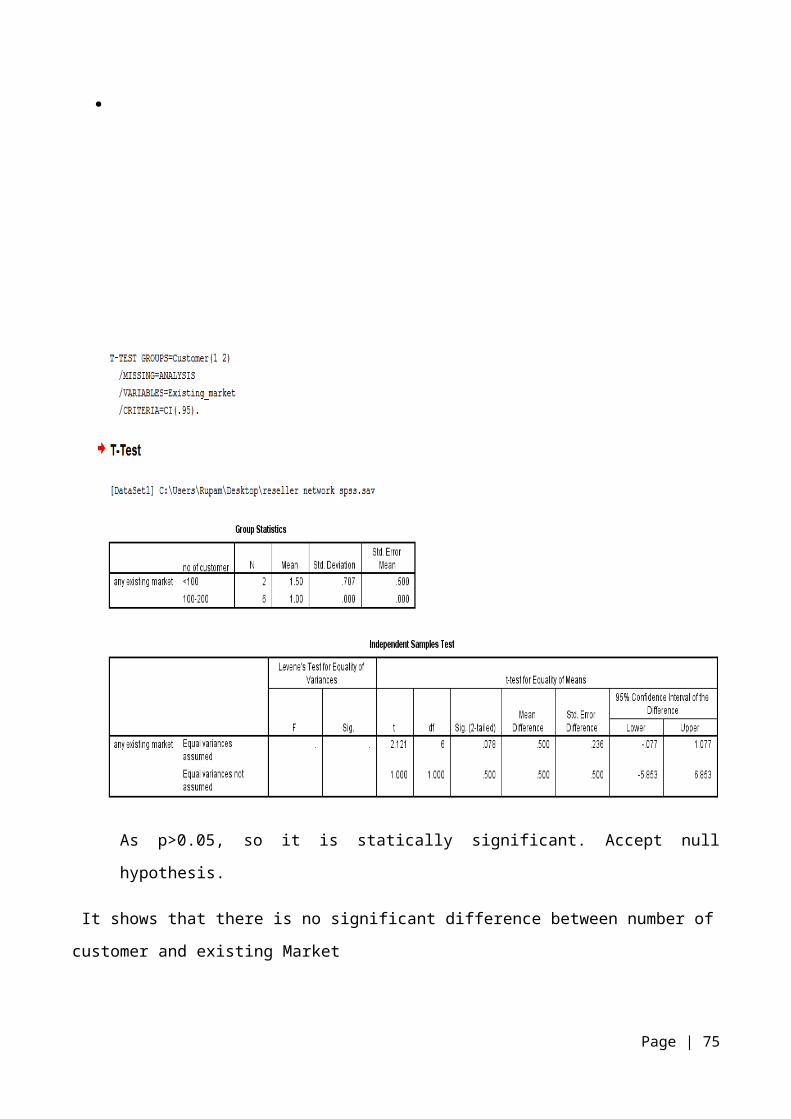
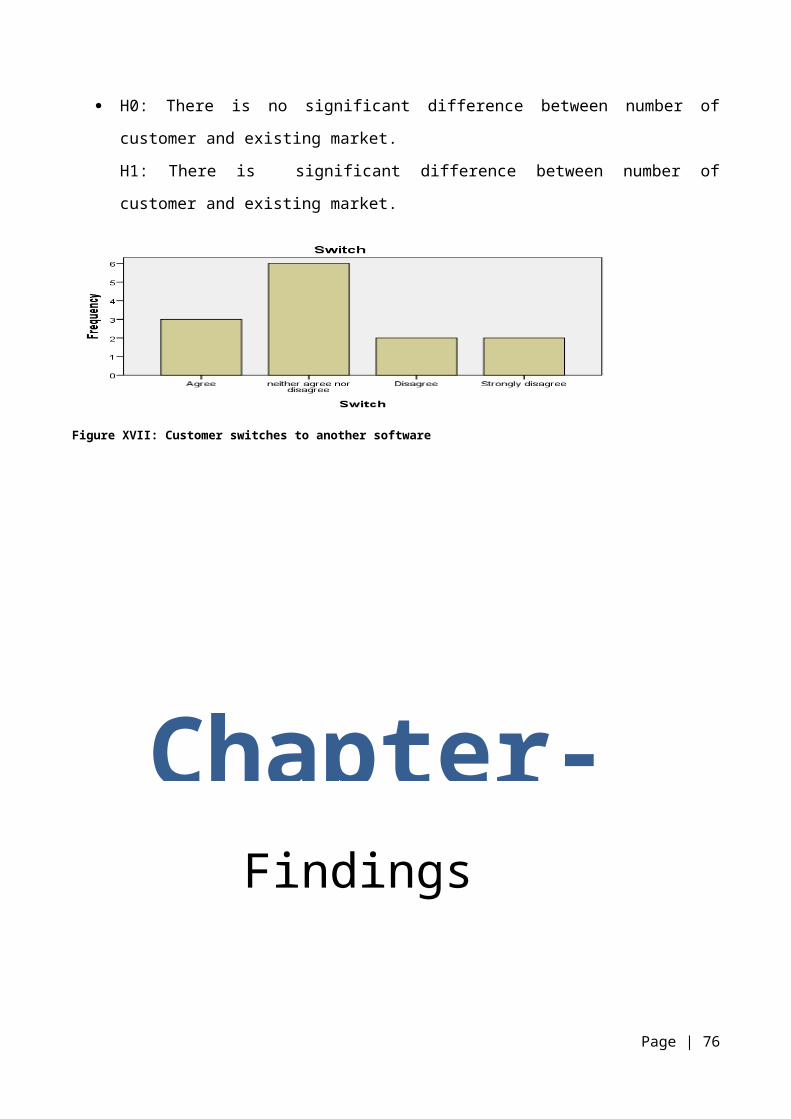


![[PPT]Consumer Behavior: People in the Marketplacerevealthought.weebly.com/uploads/3/2/1/7/32172955/plc_1.ppt · Web viewTitle Consumer Behavior: People in the Marketplace Author Milton](https://static.documents.pub/doc/80x56/5ad3a59e7f8b9a0f198dea11/pptconsumer-behavior-people-in-the-mark-viewtitle-consumer-behavior-people-in.jpg)


