39
1 Introduction to ALFA and ALFALFA Martha Haynes UAT12 12.01.16

1
Introduction to ALFA and ALFALFA
Martha Haynes UAT12 12.01.16

2
ALFALFA: A Census of Gas-bearing Galaxies
• A galaxy is a gravitationally bound object that consists of billions (and billions) of stars, gas clouds (of varying temperature and density = interstellar medium), dust clouds (mixed with the gas), and (so it seems), 90% dark matter.
• Optical surveys, like the Sloan Digital Sky Survey, detect the stellar component of galaxies.
• ALFALFA is designed to detect the cool (not hot; not cold) atomic gas in and near galaxies.
• ALFALFA is a blind survey; we observe the whole area of sky, whether or not we think/know there is an optical galaxy there.
• ALFALFA is a spectroscopic survey; not only do we detect the HI line flux, we also measure its frequency (velocity) and the width of the HI line (a measure of rotational velocity).
3
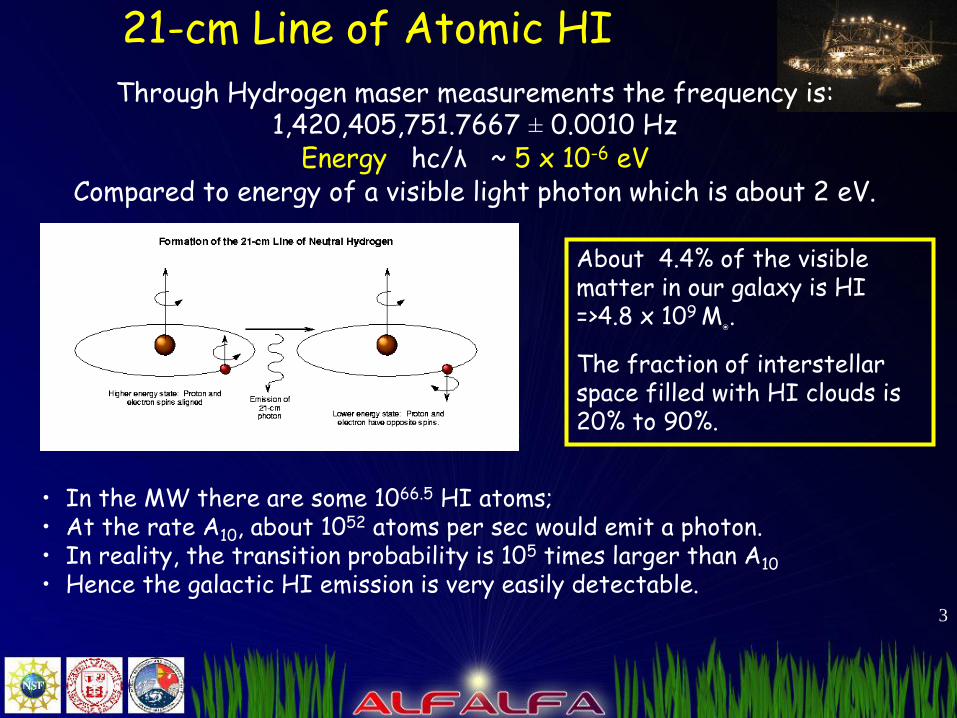
21-cm Line of Atomic HI
Through Hydrogen maser measurements the frequency is: 1,420,405,751.7667 ± 0.0010 Hz
Energy hc/λ ~ 5 x 10⁻⁶ eV Compared to energy of a visible light photon which is about 2 eV.
• In the MW there are some 1066.5 HI atoms; • At the rate A10, about 1052 atoms per sec would emit a photon. • In reality, the transition probability is 105 times larger than A10 • Hence the galactic HI emission is very easily detectable.
About 4.4% of the visible matter in our galaxy is HI =>4.8 x 10⁹ M๏. The fraction of interstellar space filled with HI clouds is 20% to 90%.

4
• Under most circumstances, the total H I mass can be derived from the integrated line profile; that is, the flux (integrated over all frequencies where there is signal) is proportional to the number of hydrogen atoms.
• The frequency (velocity) spread of the line reflects the velocities of the gas atoms, not quantum mechanics => hence the width of the line tells about the motions of the gas (rotation within the galaxy or turbulence, expansion, etc)
Rest frequency 1420.4058 MHz
∫ SdV HI mass V Distance ∆V Mass
HI emission from galaxies

5
Clues from the HI line • Redshifts (=> distances via Hubble’s Law) • HI mass and distribution (for extended
objects) • Normal, star-forming disks • Low mass, LSB dwarfs • Potential for future star formation
(HI content) • HI deficiency in clusters • History of tidal events
• Rotational velocities • Dark matter • Redshift-independent distances via
Tully-Fisher relation • HI absorption: optical depth
• Link to Ly-α absorbers • Fundamental constant evolution
HI in M31
Credit: R. Braun
∫ SdV HI mass
V Distance
∆V Mass
6
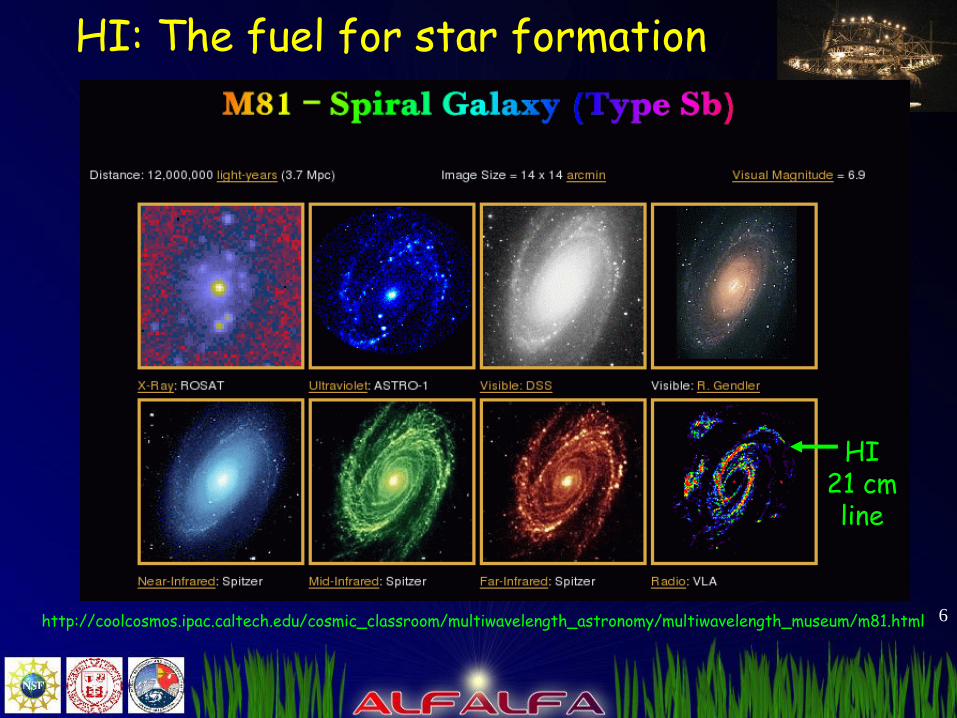
HI 21 cm line
http://coolcosmos.ipac.caltech.edu/cosmic_classroom/multiwavelength_astronomy/multiwavelength_museum/m81.html
HI: The fuel for star formation
7
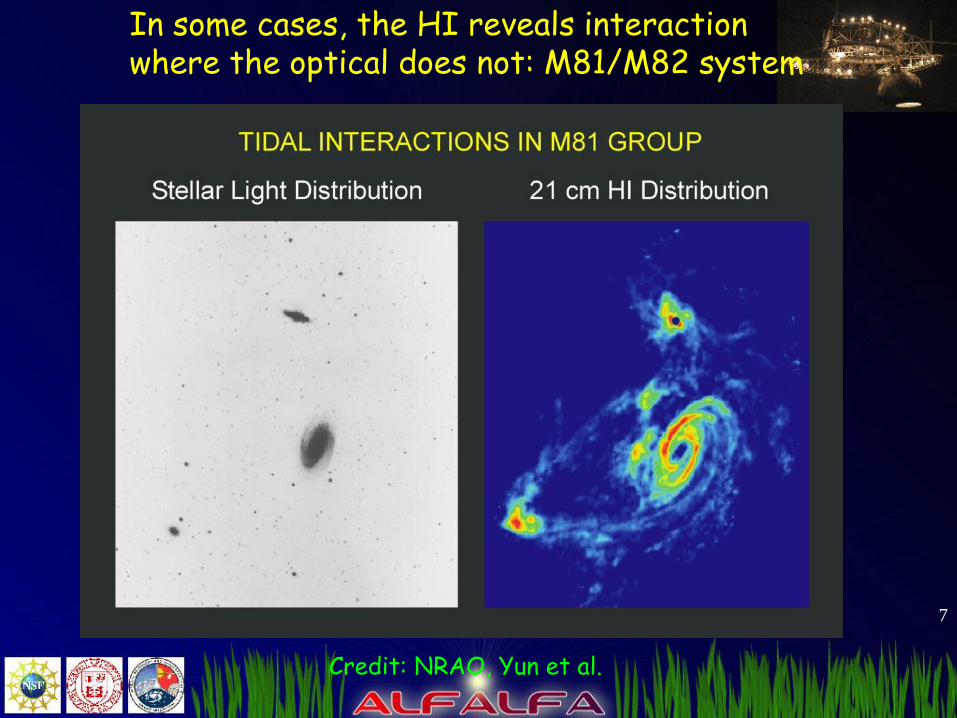
In some cases, the HI reveals interaction where the optical does not: M81/M82 system
Credit: NRAO, Yun et al.

8
NGC 5055 Optical (left); HI (right) Tom Osterloo
HI: Probing Dark Matter

9
HI : Why do we care ?
• Easy to detect, simply physics cold gas mass • Good index of SF fertility future SF • Comparative HI content => HI deficiency • Excellent tracer of host dynamics dark matter • Useful Cosmology tool TF relation, HIMF, BAO • Interaction/tidal/merger tracer • Can be dominant baryon form in low mass galaxies
• ALFALFA: A census of HI in the local universe
The HI 21 cm line @ 1.42 GHz

10
1. Census of HI in the Local Universe over cosmologically significant volume
2. Determination of the faint end of the HI Mass Function and the abundance of low mass gas rich halos
3. Environmental variation in the HI Mass Function
4. Blind survey for HI tidal remnants
5. Determination of the HI Diameter Function
6. The low HI column density environment of galaxies
7. The nature of HVC’s around the MW (and beyond?)
8. HI absorbers and the link to Ly absorbers
9. OH Megamasers at intermediate redshift 0.16 < z < 0.25
ALFALFA Science Goals

11
Survey Beam Area rms min MHI Ndet ts #/sqd arcmin sq. deg. (mJy @ 18 km/s) @ 10 Mpc sec
AHISS 3.3 13 0.7 2.0x10⁶ 65 var 5 ADBS 3.3 430 3.3 9.6x10⁶ 265 12 0.6
HIPASS 15. 30,000 13 3.6x10⁷ 5300 460 0.18
J-Virgo 12 32 4 1.1x10⁷ 31 3500 1 HIDEEP 15 32 3.2 8.8x10⁶ 129 9000 4 AGES7448 3.5 35 0.6 1.6x10⁶ 175 300 5 ZOA10 3.5 138 5 1.2x10⁶ 72 8 0.5 ALFALFA 3.5 7,000 1.7 4.4x10⁶ >30,000 40 6
ALFALFA is ~ 1 order of magnitude more sensitive than HIPASS with 4X better angular resolution.
Median cz for HIPASS ~ 2800 km/s For ALFALFA ~ 7800 km/s
ALFALFA detects 29X the source density (number of sources per square degree) of HIPASS
Comparison of blind HI surveys

12
ALFALFA: A 2nd generation HI survey
ALFALFA: • Designed to explore the HI mass function over a cosmologically
significant volume • Higher sensitivity than previous surveys • Higher spectral resolution => low mass halos • Higher angular resolution => most probable optical (stellar)
counterparts • Deeper: 3X HIPASS median redshift => volume • Wider area than surveys (other than HIPASS) => nearby
volumes for lowest MHI => cosmologically significant volume
• In comparison with opt/IR, the HI view is largely immature • HIMF based on only few thousand objects (HIPASS)
13
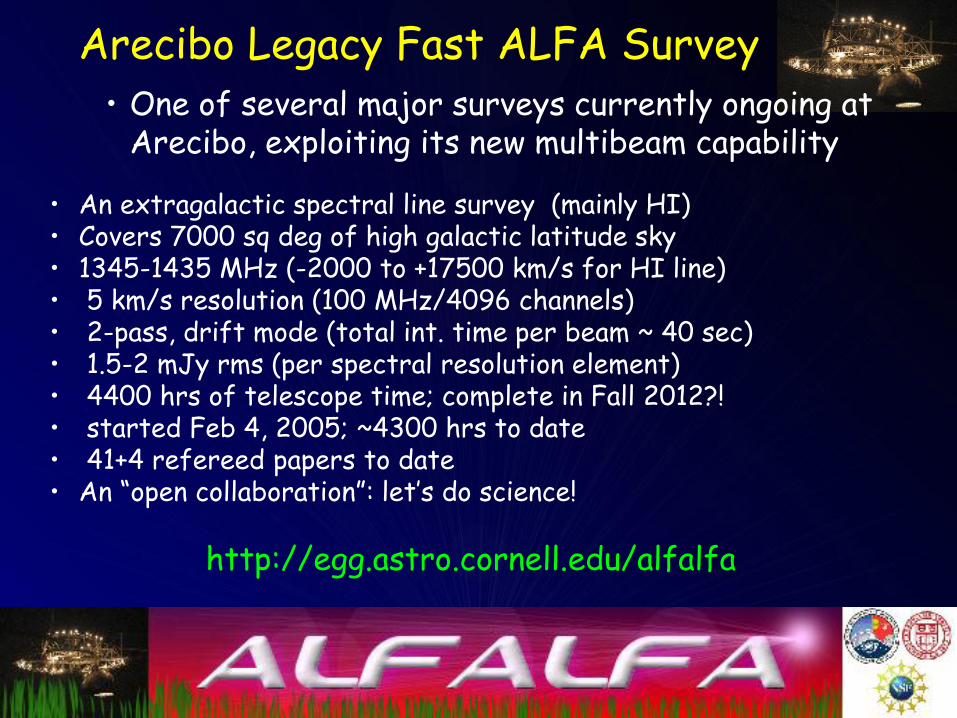
• An extragalactic spectral line survey (mainly HI) • Covers 7000 sq deg of high galactic latitude sky • 1345-1435 MHz (-2000 to +17500 km/s for HI line) • 5 km/s resolution (100 MHz/4096 channels) • 2-pass, drift mode (total int. time per beam ~ 40 sec) • 1.5-2 mJy rms (per spectral resolution element) • 4400 hrs of telescope time; complete in Fall 2012?! • started Feb 4, 2005; ~4300 hrs to date • 41+4 refereed papers to date • An “open collaboration”: let’s do science!
• One of several major surveys currently ongoing at Arecibo, exploiting its new multibeam capability
http://egg.astro.cornell.edu/alfalfa
Arecibo Legacy Fast ALFA Survey
14
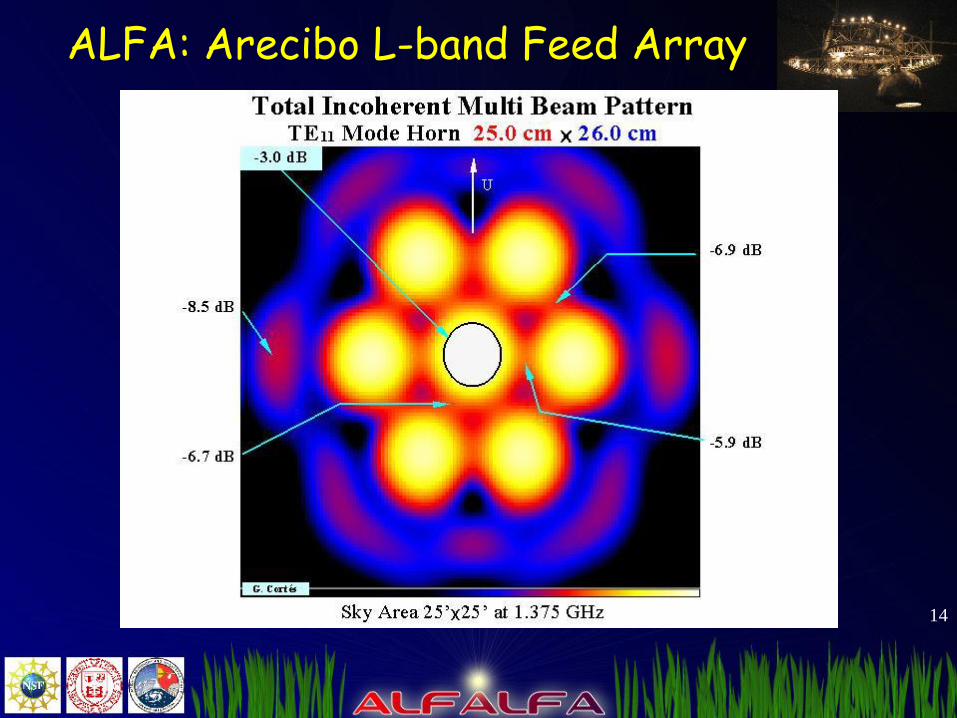
ALFA: Arecibo L-band Feed Array

15
ALFA is not a car…
Arecibo L-band Feed Array
It is a radio “camera”

16 7 elliptical beams Avg(HPBW)=3.5’ on elliptical pattern of axial ratio ~1.2
Drift scanning
17
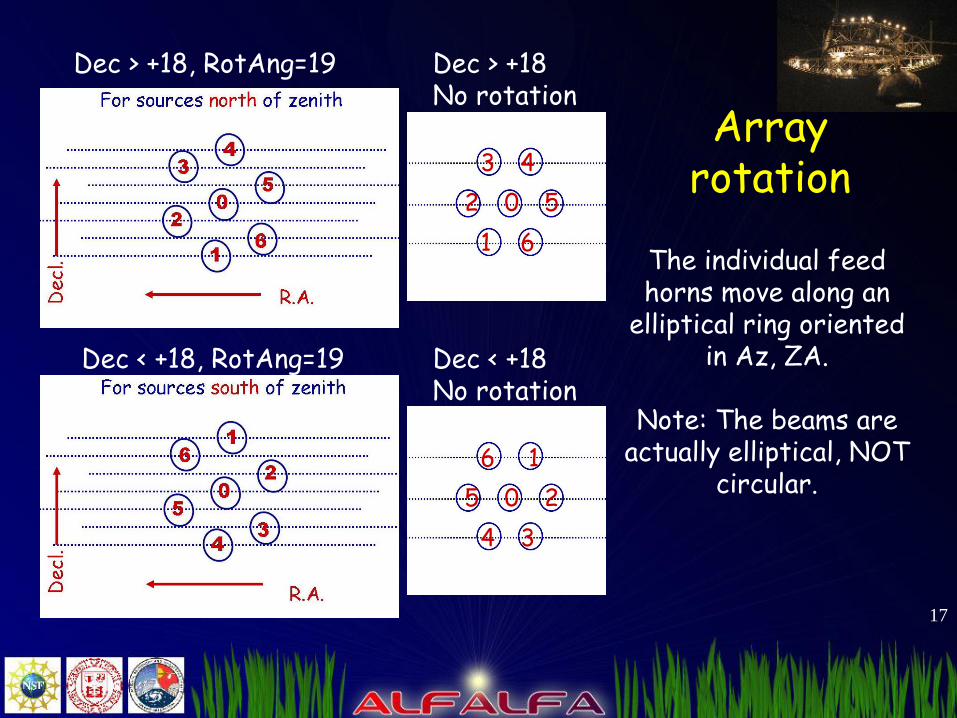
Array rotation
The individual feed horns move along an
elliptical ring oriented in Az, ZA.
Note: The beams are
actually elliptical, NOT circular.
Dec > +18, RotAng=19 Dec > +18 No rotation
Dec < +18, RotAng=19 Dec < +18 No rotation
4
5
3
2
1 6
0
1
2 0
3 4
5
6

18
Gain: 11 K/Jy 8.6 K/Jy
ALFA at 19º

19
ALFALFA schedule notation
• “Master list” of drift declinations preassigned, starting at 0° and moving northward to +36° => DriftN, N = 1, 148
• Two passes: p1 and p2
134p1 +322906
134p2 +323624
135p2 +325100
7.3 arcmin
14.6 arcmin

20
ALFALFA drift mode
Block Date AST LST # DecJ 11.01.17 M 17Jan 01h45-06h30 09h03-13h48 134p1 +322906
11.01.18 T 18Jan 01h30-06h15 08h52-13h37 138p1 +332730
11.01.19 W 19Jan 01h30-06h15 08h56-13h41 136p1 +325818 But: we actually run 15 minutes later to run calibration for TOGS
• “Almost” fixed azimuth drifts – Track in J2000 Declination – Declination of all survey drifts specified, except for +16° < DecJ < +20° (zenith “Zone of Avoidance”)
• Specify observing “block” according to date/time at start, specified as yy.mm.dd
11.01.17: January 17, 2011 11.01.18 : January 18, 2011

21
Beam 0
Beam 1
Beam 2
Beam 3
Beam 4
Beam 5
Beam 6
WAPP
ALFA spectra: 16 x 4096 frequency channels (2 not used) 7 beams X 2 polarizations/beam 100 MHz wide Centered at 1385 MHz
Spectrometer setup for ALFALFA
So resolution is 100 MHz/4096
channels
22
• Man-made signals are much stronger than cosmic ones!
• Some are always present; others come and go.
• Radars (e.g. FAA at San Juan airport) occur with some regular period (e.g. 12 sec)
• Some RFI is so strong that it “saturates” the front end.
• Some RFI can be avoided through coordination (Puntas Salinas)
Radio Frequency Interference
We have to live with it (but we don’t have to like it!).
See: http://www.naic.edu/~a2010/rfi_common.htm

23
RFI List

24
RFI is ugly
Galactic hydrogen
FAA radar
Galaxy!
Channel number/frequency
Reco
rd/t
ime/R
.A.

25
Two-pass strategy
We want to drift across each stop on the sky TWICE • Double integration time • Helps to discriminate cosmic sources from
1. Noise 2. RFI
We offset the 2nd drift by half of the beam spacing. • Helps with position centroiding • Evens out the gain scalloping
We conduct the 2nd pass 3-9 months after the first. • Cosmic sources will have shifted in frequency due to the Earth’s motion around the Sun, but terrestrial ones won’t have. • Some interference comes and goes.

26
Final coverage for 2 pass strategy
• For the 2nd pass, Beam 0, which has higher gain than the others, is offset by 7.3 arcmin from its 1st pass position.
• Some smoothing of gain scalloping.
• 2-pass sampling thus at 1.05 arcmin
• 2nd pass occurs 3-9 months after the 1st pass (vs. RFI)
7.3'
2.1'
1.05'
2-pass beam layout

27
ALFALFA Scheduling Strategy
• ALFALFA aims to survey 7000 square degrees of high galactic latitude sky.
• “Fixed azimuth drift” mode: the telescope moves only slightly, to maintain constant Dec (J2000); Drifts offset by 14.6 arcmin.
• A “tile” of data will contain all beam positions within a box of 20 min in RA by 4 degrees in Dec.
• Within a single observing block, the data taking sequence consists of a series of 600 second (10 min) drifts at constant Dec J.
• Over a season, we try to “complete” sets of drifts within a tile: 16 drifts/tile/pass.
• The second pass occurs 3-9 months after the 1st pass (to aid RFI identification and signal confirmation).
28
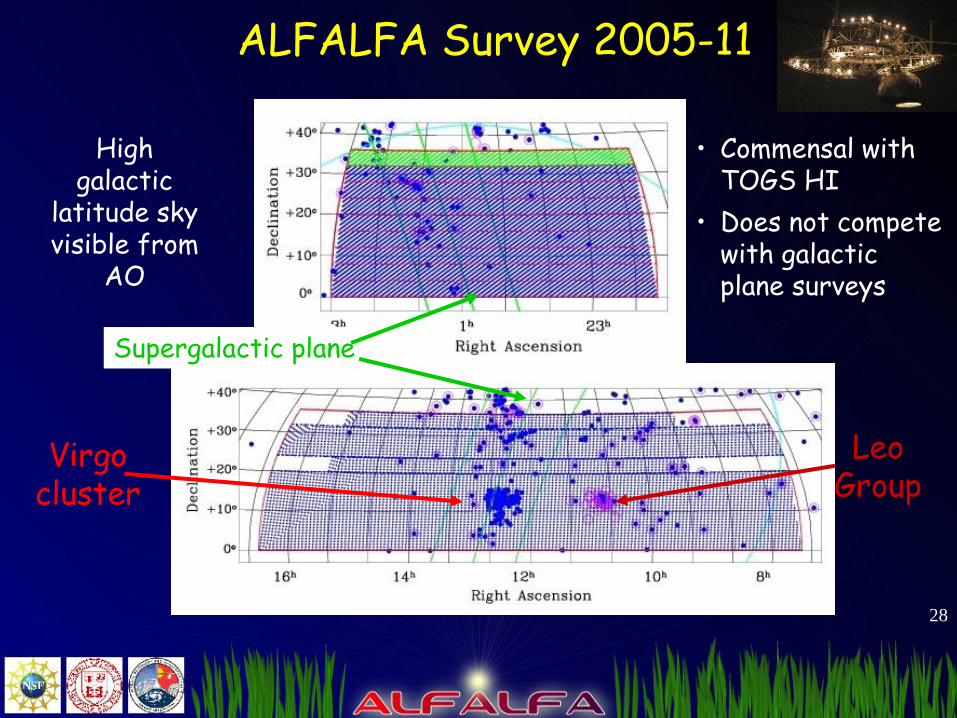
ALFALFA Survey 2005-11
• Commensal with TOGS HI
• Does not compete with galactic plane surveys
High galactic
latitude sky visible from
AO
Supergalactic plane
Virgo cluster
Leo Group

29
Channel Time
Temp
Channel
Time
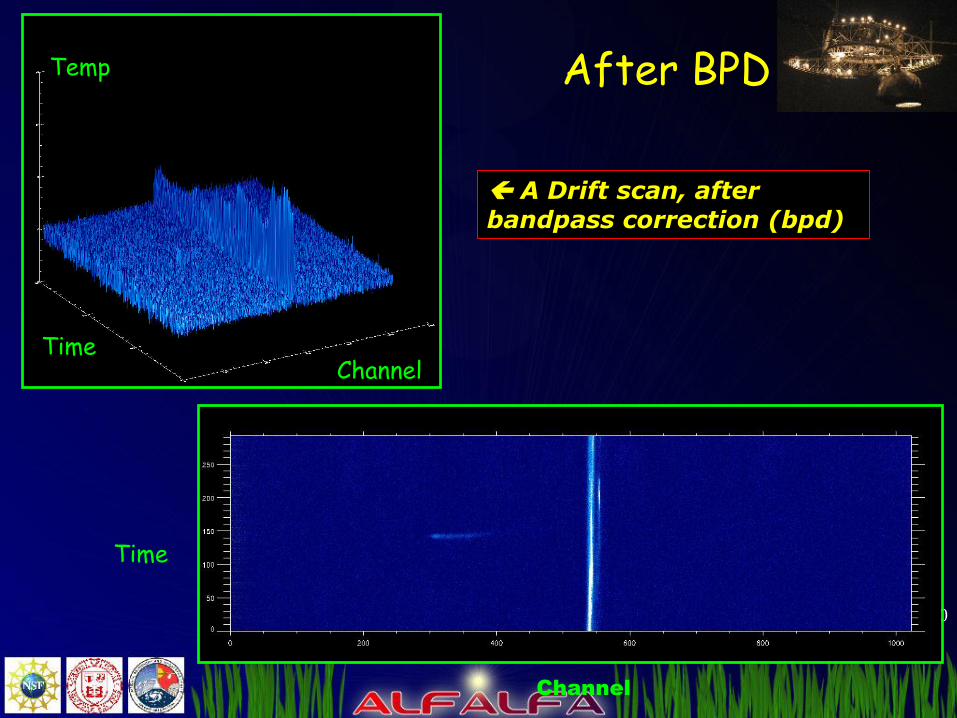
A Drift scan, before
bandpass correction (bpd)
Raw data
30
Channel Time
Temp
Channel
Time
A Drift scan, after
bandpass correction (bpd)
After BPD

31
• Telescope time is precious and competition is stiff.
• Our science goals demand high quality data.
• The legacy nature of ALFALFA raises the standards for data product generation and delivery.
• Arecibo and ALFA are complex instruments to use.
• RFI is nasty and inevitable.
• ALFALFA uses a lot of telescope time and generates a lot of data!
• The A2010 proposal was approved pending periodic reviews of our ability to perform the survey.
The ALFALFA technique delivers >99% “open shutter” time
Maximizing Observing Efficiency

32
Calibration:
1. Noise diode
2. Radio continuum sources of known flux
3. Galactic Hydrogen
ALFALFA observing sequence
• Set dome at transit (360° or 180°) • Rotate ALFA to 19° • Setup spectrometer • Start 600 sec drift scan
– Record spectra every 1 sec (actually 14 = 7 beams X 2 polarizations/beam)
....... • Terminate drift scan • Fire noise diode for 1 sec • Close/open FITS data file • Start next drift
........... Repeat until end of observing block
33
Scavenger Hunt #1
http://egg.astro.cornell.edu/alfalfa/ugradteam/hunt10/hunt1_10.htm
• Think about using ALFA for ALFALFA
• Start thinking about what we can learn about galaxies
• Please: no cheating by return attendees!
http://egg.astro.cornell.edu/alfalfa http://www.naic.edu/~a2010/galaxy_a2010.html Team website: A2010 + coolHI

34
Scavenger Hunt #1
http://egg.astro.cornell.edu/alfalfa/ugradteam/hunt11/hunt1_11.htm
To run IDL here at the workshop
• ssh –X [email protected]
• (The password) (ask Tom where this comes from!)
• cd /share/alfalfa/teama
• idl
• @wasinit2
• @alfinit

35
So, enough talk; let’s eat…!

36
37
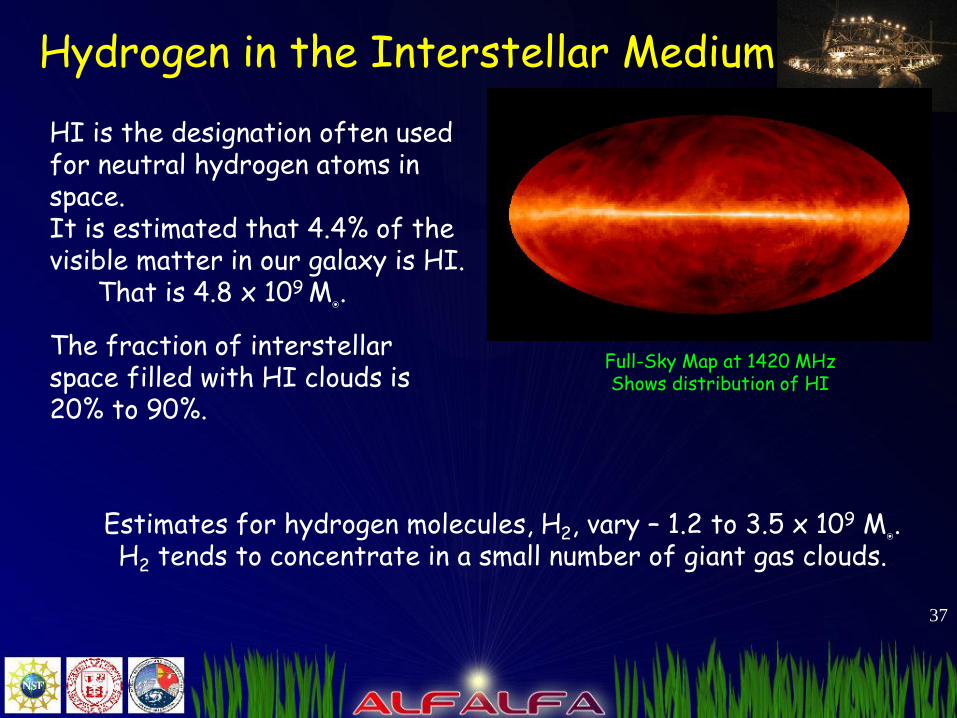
Hydrogen in the Interstellar Medium
Full-Sky Map at 1420 MHz Shows distribution of HI
HI is the designation often used for neutral hydrogen atoms in space. It is estimated that 4.4% of the visible matter in our galaxy is HI.
That is 4.8 x 10⁹ M๏. The fraction of interstellar space filled with HI clouds is 20% to 90%.
Estimates for hydrogen molecules, H2, vary – 1.2 to 3.5 x 10⁹ M๏. H2 tends to concentrate in a small number of giant gas clouds.

38
HI 21 cm line
• Neutral hydrogen (H I ) spin-flip transition
The transition probability for spontaneous emission 1 0 is
DE 1
0 16115
10 10111085.2 yrsA
The smallness of the spontaneous transition probability is due to • the fact that the transition is “forbidden” • the dependence of A10 on freq3 The “natural” halfwidth of the
transition is 5 x 10-16 Hz

39
21-cm Line of Atomic HI
• Predicted 1944 by van der Hulst • First observed 1951 by Ewen and Purcell • Observed regularly with Arecibo telescope by ALFALFA team members
Through Hydrogen maser measurements the frequency is: 1,420,405,751.7667 ± 0.0010 Hz
Energy hc/λ ~ 5 x 10⁻⁶ eV Compared to energy of a visible light photon which is about 2 eV.
The transition is mainly excited by other mechanisms, which make it orders of magnitude more frequent, e.g., the upper level is populated by:
- Collisions - Excitation by stellar radiation field or Lyman-a photons
• In the MW there are some 1066.5 HI atoms; • At the rate A10, about 1052 atoms per sec would emit a photon. • In reality, the transition probability is 105 times larger than A10 • Hence the galactic HI emission is very easily detectable.


