27
Introduction to Azure Machine Learning

Introduction to
Azure Machine
Learning

Introduction to Azure Machine Learning
Contents
Overview ............................................................. 3
Create a Workspace and Experiment ................. 5
Explore and Visualize Data ............................... 10
Create a Simple Predictive Model ..................... 14
Exercises ........................................................... 25
Terms of Use ..................................................... 26
Introduction to Azure Machine Learning 3
Summary
This lab is intended to serve as an introduction to creating a
predictive model with Azure Machine Learning.
The lab will walk through accessing the ML Studio environment,
exploring and visualizing data in Azure Machine Learning, and
creating a simple predictive model.
Business Case
Consumers often evaluate similar products by specific metrics of
interest to them. In the auto industry, Miles per Gallon (MPG) always
comes up as an important metric for consumers. How do
manufacturers know what an acceptable MPG will be for the vehicle
they are producing? Using advanced analytics, auto manufacturers
can use vehicle attributes and MPG for similar automobiles in the
market to predict what an acceptable MPG will be for their car
coming off the assembly line.
For this lab, you will be working with a dataset that includes various
information about automobiles from the 1970s and early 1980s. The
dataset includes attributes like miles per gallon (MPG), horsepower,
acceleration, weight, etc.
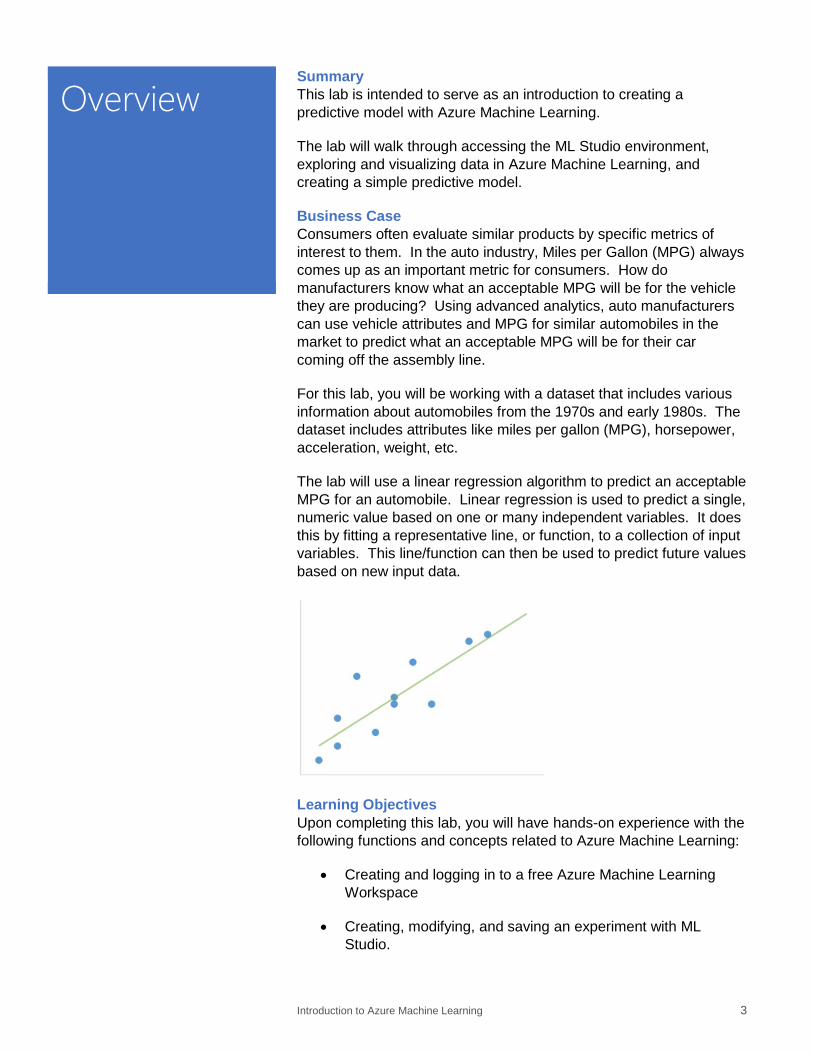
The lab will use a linear regression algorithm to predict an acceptable
MPG for an automobile. Linear regression is used to predict a single,
numeric value based on one or many independent variables. It does
this by fitting a representative line, or function, to a collection of input
variables. This line/function can then be used to predict future values
based on new input data.
Learning Objectives
Upon completing this lab, you will have hands-on experience with the
following functions and concepts related to Azure Machine Learning:
Creating and logging in to a free Azure Machine Learning
Workspace
Creating, modifying, and saving an experiment with ML
Studio.
Overview
Introduction to Azure Machine Learning 4
o Running an experiment
o Using sample datasets an experiment
o Browsing modules to use in an experiment
o Using the search function to find modules to use in an
experiment
o Connecting modules in an experiment
o Modifying and configuring properties of modules in an
experiment
Visualizing and exploring data in ML Studio
o Exploring summary statistics about datasets and
features
o Visualizing features with scatterplots, boxplots, and
histograms
o Visualizing relationships between features with
scatterplots and boxplots
o Visualizing predictive model results
Creating a basic predictive model in ML Studio
o Splitting data into a training dataset and a test dataset
o Training a Linear Regression model
o Testing a trained model
o Evaluating model performance
Lab Requirements/Prerequisites
A Microsoft account is required to access an Azure Machine
Learning workspace. If you don’t already have a Microsoft
account, you can obtain one for free by following the link
below:
https://www.microsoft.com/en-us/account/default.aspx
Introduction to Azure Machine Learning 5
Create/Access an Azure Machine Learning Workspace
To get started, you will need to create and log in to a free Azure
Machine Learning workspace. A workspace is like an all-inclusive
development environment with the tools to create, manage, and
publish machine learning models.
1. Open Internet Explorer using the shortcut on the desktop
taskbar.
2. Go to the ML Studio website by typing
http://studio.azureml.net in the address bar.
3. Click Sign In on the top right corner of the web page.
4. Enter the email address and password associated with
your Microsoft ID, and click the Sign In button.
5. If upon logging in, a Welcome video is displayed (usually
displays on the first login), click the X at the top right of the
video to close it.
Create a Workspace and Experiment

Introduction to Azure Machine Learning 6
6. If the Microsoft Samples dialogue box is displayed (usually
displays on the first login), go ahead and close it by choosing
the X in the top right corner of the pane.
You are now logged into the free workspace associated with
your Microsoft ID.

Introduction to Azure Machine Learning 7
Create a Blank Experiment
Next, we will create our first experiment. An experiment is a
collection of data, tasks, and machine learning algorithms that make
up a model.
1. Click the NEW button in the bottom left corner of the page.
2. Make sure EXPERIMENT is highlighted in the NEW dialogue window, and click the Blank Experiment pane.
3. You are now in the ML Studio. Notice:
a. The Canvas in the center of the screen. This is where
you will drag and drop modules and string them
together to create a data flow for your experiment.
b. The navigation icons on the far left of the site allowing
you to browse back to your Workspace
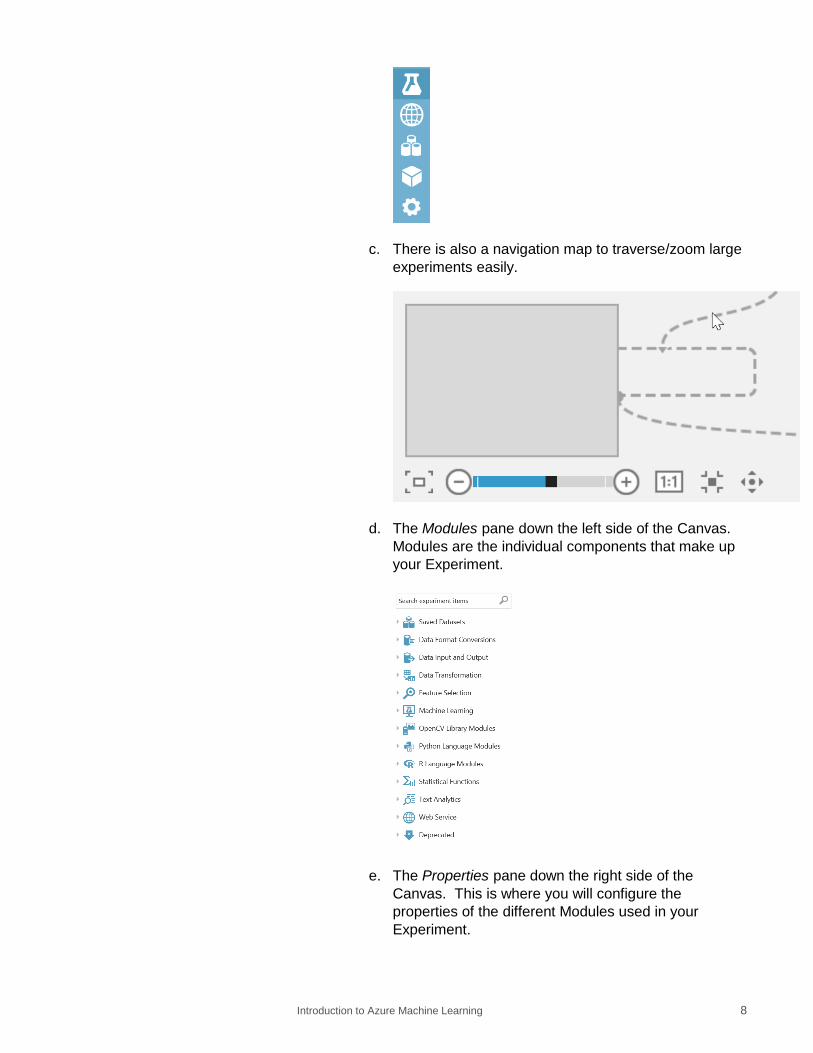
Introduction to Azure Machine Learning 8
c. There is also a navigation map to traverse/zoom large
experiments easily.
d. The Modules pane down the left side of the Canvas.
Modules are the individual components that make up
your Experiment.
e. The Properties pane down the right side of the
Canvas. This is where you will configure the
properties of the different Modules used in your
Experiment.

Introduction to Azure Machine Learning 9
4. At the top of the Canvas, highlight and delete the text that
reads Experiment created on…, and replace it with Lab - Intro to Azure Machine Learning.
To
Introduction to Azure Machine Learning 10
Input Sample Data
Azure Machine Learning offers several ways to connect to and import
data. For this lab, we will work with one of the sample datasets
included with Azure Machine Learning.
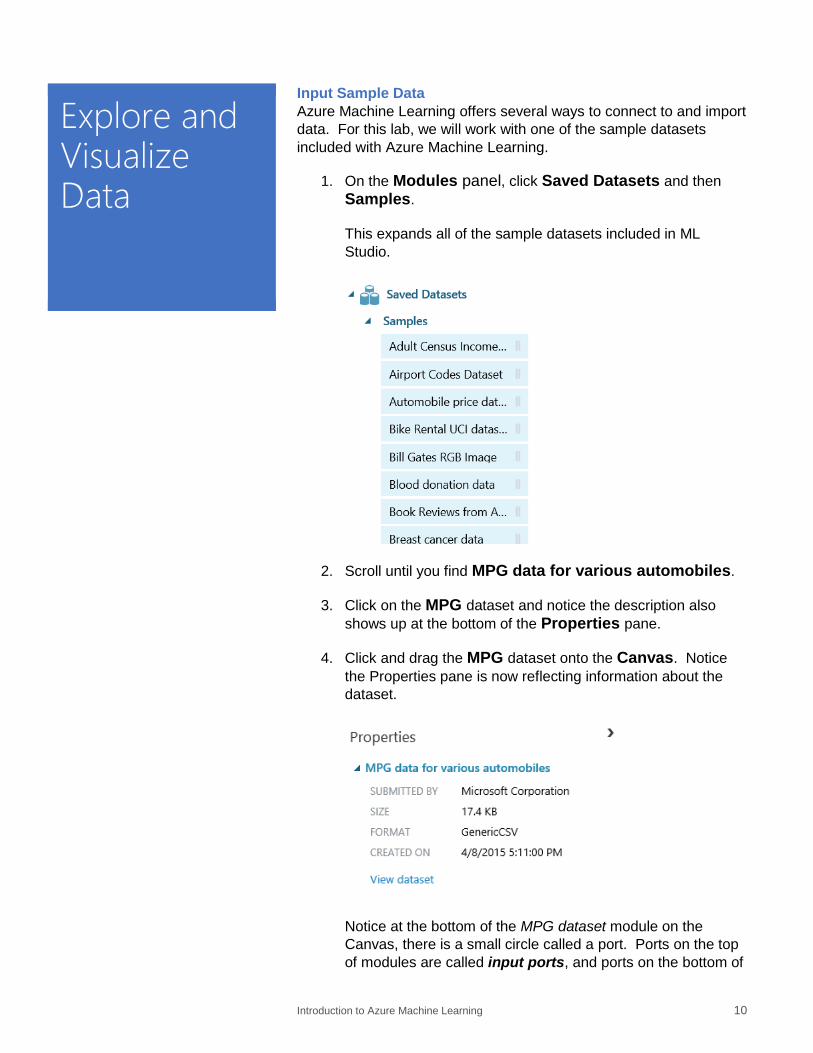
1. On the Modules panel, click Saved Datasets and then Samples.
This expands all of the sample datasets included in ML
Studio.
2. Scroll until you find MPG data for various automobiles.
3. Click on the MPG dataset and notice the description also
shows up at the bottom of the Properties pane.
4. Click and drag the MPG dataset onto the Canvas. Notice
the Properties pane is now reflecting information about the
dataset.
Notice at the bottom of the MPG dataset module on the
Canvas, there is a small circle called a port. Ports on the top
of modules are called input ports, and ports on the bottom of
Explore and Visualize Data

Introduction to Azure Machine Learning 11
modules are output ports. These ports are used to connect
modules to one another and to provide a menu of additional
options for the module.
Explore the Input Data
A common task in any advanced analytics workflow is to analyze and
profile the data you are working with. The following set of steps
highlights some of the ways we can explore and visualize the data
we just imported.
1. Click the output port at the bottom of the MPG dataset
module, and select Visualize from the menu that is
displayed.
The resulting dialogue box provides the number of rows and
columns in the dataset as well as the first 100 rows and first
100 columns in the dataset with a histogram for each column.
2. Click anywhere in the first column, MPG, to highlight the
column.

Introduction to Azure Machine Learning 12
Notice on the right side of the dialogue box, there is now
information in the Statistics pane and Visualizations pane
about MPG (you might need to use the horizontal scroll bar in
the dialogue box to scroll all the way to the right if Statistics
and Visualizations are not visible).
3. In the Visualizations pane, change the compare to
dropdown box from None to Horsepower.

Introduction to Azure Machine Learning 13
Notice the histogram changed to a ScatterPlot comparing
MPG to Horsepower.
4. Next, change the compare to dropdown option from
Horsepower to Model.
Notice the resulting chart is now a MultiboxPlot with an MPG
boxplot displayed for each of the values in the Model column.
5. Click the X in the top right corner of the Visualize dialogue
box to return to the Canvas.

Introduction to Azure Machine Learning 14
Split Input Data into Train and Test Data Sets
Now that we have explored our data, we are ready to create a
predictive model. The first thing we will do is split the original dataset
into 2 datasets: one dataset will be used for training a model, and
one will be used for testing our model (as it is typically better to test
our models with different data than what we trained it with).
1. In the search box at the top of the Modules pane, type the
word split and hit Enter.
Notice the list of modules has been filtered to show only those
relevant to the search term.
2. Click and drag the Split module onto the Canvas anywhere
under the MPG dataset.
Notice the Split module has 1 input port and 2 output ports.
The Properties pane displays properties that can be modified
for this module. There is also a description of the module at
the bottom of the Properties pane with a (more help…) link. A
page will open with more details about the module and its
configurable properties when this link is clicked.
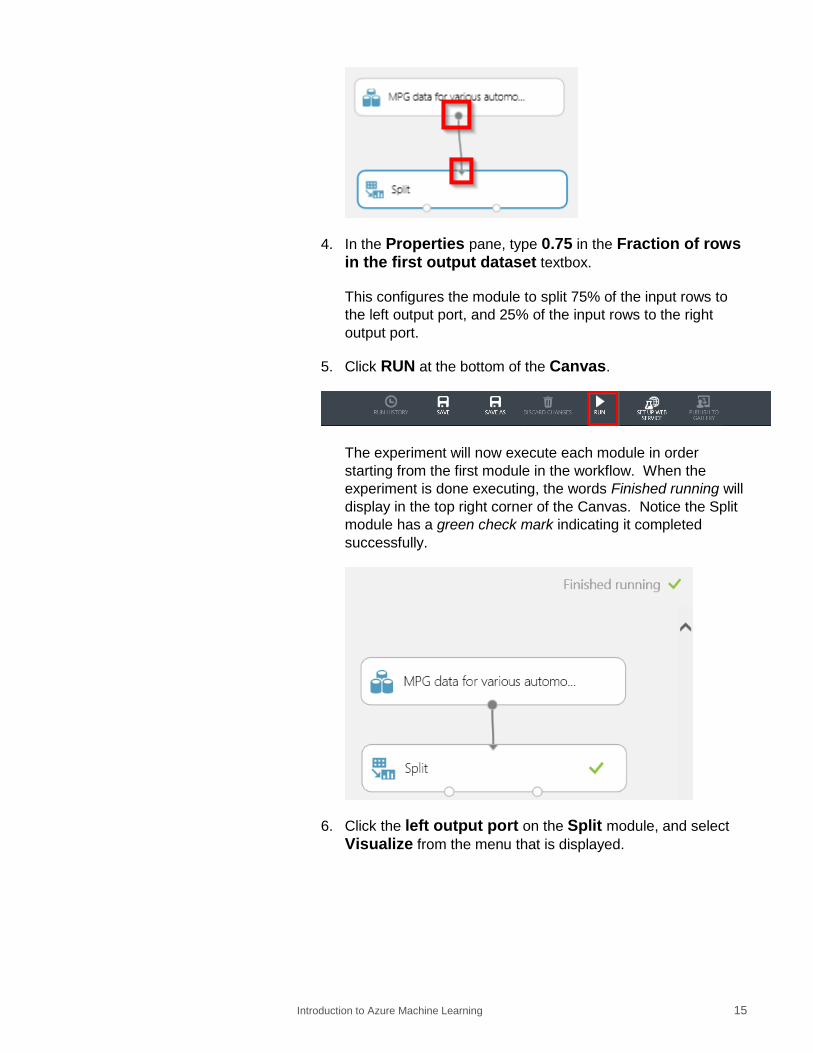
3. Click and drag the output port from the MPG dataset
module to the input port of the Split module.
Create a Simple Predictive Model
Introduction to Azure Machine Learning 15
4. In the Properties pane, type 0.75 in the Fraction of rows in the first output dataset textbox.
This configures the module to split 75% of the input rows to
the left output port, and 25% of the input rows to the right
output port.
5. Click RUN at the bottom of the Canvas.
The experiment will now execute each module in order
starting from the first module in the workflow. When the
experiment is done executing, the words Finished running will
display in the top right corner of the Canvas. Notice the Split
module has a green check mark indicating it completed
successfully.
6. Click the left output port on the Split module, and select
Visualize from the menu that is displayed.

Introduction to Azure Machine Learning 16
7.
Notice only 294 of the original 392 rows (75%) have been
routed to the left output port. The remaining 98 rows (25%)
have been routed to the right output port.
8. Click the X in the top right corner to close the Visualize dialogue box.
Train a Predictive Model
Next, you will use a common Linear Regression algorithm to train a
model that will predict an automobile’s MPG.
1. Type train in the search box at the top of the Modules pane.
2. Find the Train Model module, and click and drag it onto the
Canvas below the Split module.
3. Connect the left output port from the Split module to the
right input port on the Train Model module

Introduction to Azure Machine Learning 17
4. In the Properties pane, click the Launch column selector button.
This launches the Select Column dialogue box. Here, we will
select the column we want the model to predict.
5. Click the text box with the red circle in it, and select MPG from the list of columns.
6. Click the button to save the selection and close the
dialogue box.
7. Hover your mouse cursor over the red error icon in the Train
Model module. Noticehe error message now reads:
We now need to select an appropriate machine learning
algorithm to forecast MPG.
8. Clear the search box in the Modules pane and hit enter.
Introduction to Azure Machine Learning 18
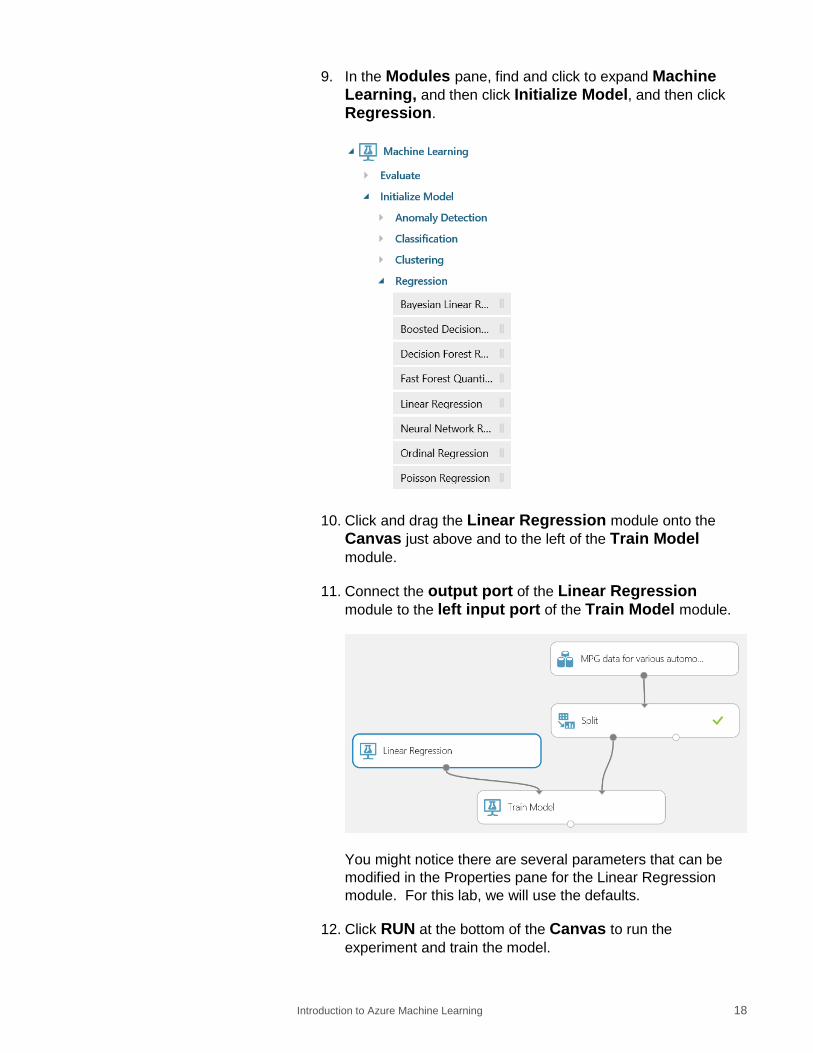
9. In the Modules pane, find and click to expand Machine Learning, and then click Initialize Model, and then click
Regression.
10. Click and drag the Linear Regression module onto the
Canvas just above and to the left of the Train Model module.
11. Connect the output port of the Linear Regression module to the left input port of the Train Model module.
You might notice there are several parameters that can be
modified in the Properties pane for the Linear Regression
module. For this lab, we will use the defaults.
12. Click RUN at the bottom of the Canvas to run the
experiment and train the model.

Introduction to Azure Machine Learning 19
The model will be trained to predict the MPG column using
the other fields in the dataset with the Linear Regression algorithm.
13. When the experiment finishes running, IF a CREATE SCORING EXPERIMENT COMMAND box pops up, click
the X at the top right corner of this box to close it.
Test the Predictive Model
Next, we will use the test dataset we created to test our newly trained
model. This will be done using our new model to predict the MPG for
each row in the test dataset.
1. In the search box at the top of the Modules pane, type the
word score.
2. Find the Score Model module, and click and drag it onto the
Canvas under the Train Model module.

Introduction to Azure Machine Learning 20
3. Connect the output port on the Train Model module to the
left input port on the Score Model module.
4. Connect the right output port on the Split module to the
right input port on the Score Model module.
5. Click RUN at the bottom of the Canvas to run the
experiment and score the test dataset with the trained Linear
Regression model.
6. After the experiment has finished running, click the output port on the Score Model module and select Visualize
from the displayed menu (see illustration below).

Introduction to Azure Machine Learning 21
7. In the list of columns, scroll to the right until Scored Labels
is visible, and click Scored Labels to select it.
The Scored Labels column represents the predicted MPG for
each row in the test dataset. Notice the Statistics pane and
histogram in the Visualizations pane on the right side of the
Visualize dialogue box.
8. In the Visualizations pane, change the compare to
dropdown option to MPG.

Introduction to Azure Machine Learning 22
The resulting ScatterPlot compares the Scored Labels
(predicted MPG) with the actual MPG for each row in the test
dataset.
9. Click the X in the top right corner to close the Visualize
dialogue box.
10. Click SAVE to save the experiment.
Evaluate the Test Results
Finally, we will evaluate how well the model performed against the
test dataset using a set of standard metrics for measuring regression
model performance.
1. In the search box at the top of the Modules pane, type the
word evaluate.
2. Find the Evaluate Model module, and click and drag it onto
the Canvas below the Score Model module.

Introduction to Azure Machine Learning 23
3. Connect the output port on the Score Model module to
the left input port on the Evaluate Model module.
4. Click RUN to run the experiment.
5. When the experiment has finished running, click the output port on the Evaluate Model module and select Visualize
from the displayed menu.
The columns and values in the Visualize dialogue box
represent common metrics for evaluating the performance of
a Linear Regression model. The metrics are calculated using
the results of the Score Model module. Many of the metrics
are based on the Error, which is the difference between the
Scored Labels (predicted value) and the actual values.
At this point, you can assess whether or not your model
performs at a satisfactory level. If not, you could go back and
tweak parameters, add new features, try a different machine
learning algorithm, etc. to try and get the model performance
to be more acceptable.
6. Click the X in the top right corner to close the Visualize
dialogue box.

Introduction to Azure Machine Learning 24
7. Click SAVE to save your experiment

Introduction to Azure Machine Learning 25
Try the following exercises.
1. Add data cleansing modules to your experiment:
a. Clean Missing Data (select an appropriate method for
replacement).
b. Remove Duplicate Rows
In each case consult the help files in the module properties
2. Add in a feature selection method to your experiment. In
Azure Machine Learning there are two types to explore:
a. Filter based feature selection
b. Permutation feature importance
What are the differences between the two?
3. Your experiment has one model type – Linear regression.
Add to your experiment another regression module (e.g.
Boosted Decision Tree Regression) and compare the
predictions on the out-of-sample test data with the linear
regression model.
Conclusion
This concludes the Intro to Azure Machine Learning lab. To recap,
you have successfully created and logged into an Azure Machine
Learning workspace, explored and visualized data in ML Studio, and
produced and saved a simple Linear Regression model that predicts
automobile MPG.
You now have a model that can be used by an auto manufacturer to
predict an acceptable MPG for any new automobile coming off the
assembly line. As a next step, you could upload new data to be
scored by your model, or you could even publish your model as a
web service. A web service gives you the ability to pass individual
rows in and get predicted values (MPG) out.
Exercises
Introduction to Azure Machine Learning 26
© 2016 Microsoft Corporation. All rights reserved.
By using this Hands-on Lab, you agree to the following terms:
The technology/functionality described in this Hands-on Lab is
provided by Microsoft Corporation in a “sandbox” testing environment
for purposes of obtaining your feedback and to provide you with a
learning experience. You may only use the Hands-on Lab to evaluate
such technology features and functionality and provide feedback to
Microsoft. You may not use it for any other purpose. You may not
modify copy, distribute, transmit, display, perform, reproduce,
publish, license, create derivative works from, transfer, or sell this
Hands-on Lab or any portion thereof.
COPYING OR REPRODUCTION OF THE HANDS-ON LAB (OR
ANY PORTION OF IT) TO ANY OTHER SERVER OR LOCATION
FOR FURTHER REPRODUCTION OR REDISTRIBUTION IS
EXPRESSLY PROHIBITED.
THIS HANDS-ON LAB PROVIDES CERTAIN SOFTWARE
TECHNOLOGY/PRODUCT FEATURES AND FUNCTIONALITY,
INCLUDING POTENTIAL NEW FEATURES AND CONCEPTS, IN A
SIMULATED ENVIRONMENT WITHOUT COMPLEX SET-UP OR
INSTALLATION FOR THE PURPOSE DESCRIBED ABOVE. THE
TECHNOLOGY/CONCEPTS REPRESENTED IN THIS HANDS-ON
LAB MAY NOT REPRESENT FULL FEATURE FUNCTIONALITY
AND MAY NOT WORK THE WAY A FINAL VERSION MAY
WORK. WE ALSO MAY NOT RELEASE A FINAL VERSION OF
SUCH FEATURES OR CONCEPTS. YOUR EXPERIENCE WITH
USING SUCH FEATURES AND FUNCITONALITY IN A PHYSICAL
ENVIRONMENT MAY ALSO BE DIFFERENT.
FEEDBACK. If you give feedback about the technology features,
functionality and/or concepts described in this Hands-on Lab to
Microsoft, you give to Microsoft, without charge, the right to use,
share and commercialize your feedback in any way and for any
purpose. You also give to third parties, without charge, any patent
rights needed for their products, technologies and services to use or
interface with any specific parts of a Microsoft software or service
that includes the feedback. You will not give feedback that is subject
to a license that requires Microsoft to license its software or
documentation to third parties because we include your feedback in
them. These rights survive this agreement.
MICROSOFT CORPORATION HEREBY DISCLAIMS ALL
WARRANTIES AND CONDITIONS WITH REGARD TO THE
HANDS-ON LAB , INCLUDING ALL WARRANTIES AND
CONDITIONS OF MERCHANTABILITY, WHETHER EXPRESS,
IMPLIED OR STATUTORY, FITNESS FOR A PARTICULAR
PURPOSE, TITLE AND NON-INFRINGEMENT. MICROSOFT
Terms of Use

Introduction to Azure Machine Learning 27
DOES NOT MAKE ANY ASSURANCES OR REPRESENTATIONS
WITH REGARD TO THE ACCURACY OF THE RESULTS, OUTPUT
THAT DERIVES FROM USE OF THE VIRTUAL LAB, OR
SUITABILITY OF THE INFORMATION CONTAINED IN THE
VIRTUAL LAB FOR ANY PURPOSE.
DISCLAIMER
This lab contains only a portion of the features and enhancements in
Microsoft Azure Machine Learning. Some of the features might
change in future releases of the product.


