INTRODUCTION TO BUSINESS OBJECTS Business Objects is a new “query and report” software program that is part of the CSC software package. Business Objects is not a replacement for IQ Objects but is an additional “query and report” software tool that is capable of doing more sophisticated mathematical calculations than IQ objects. In fact, Business Objects can be used to produce ratio studies, including the calculations for “Median” and “COD”. An icon will be set up on the user’s desktop when Business Objects is installed on the local computer (see Picture 1). The user clicks on the icon to open Business Objects. Picture 1 The “New Report Wizard” screen greets the user in Business Objects (see Picture 2). The user can click the “Finish” button to create a new report. If the user clicks the “Cancel” button, a blank gray screen appears (see Picture 3). From this screen the user can either start a new query or open an existing query that has been saved. To start a new query, the user clicks on the “white sheet of paper” in the far left corner of the Tool Bar. To open a saved query, the user clicks on the “open yellow folder” on the Tool Bar. The user can also click “File” on the Menu Bar and then click either “New” or “Open”. 1
Transcript
INTRODUCTION TO BUSINESS OBJECTS
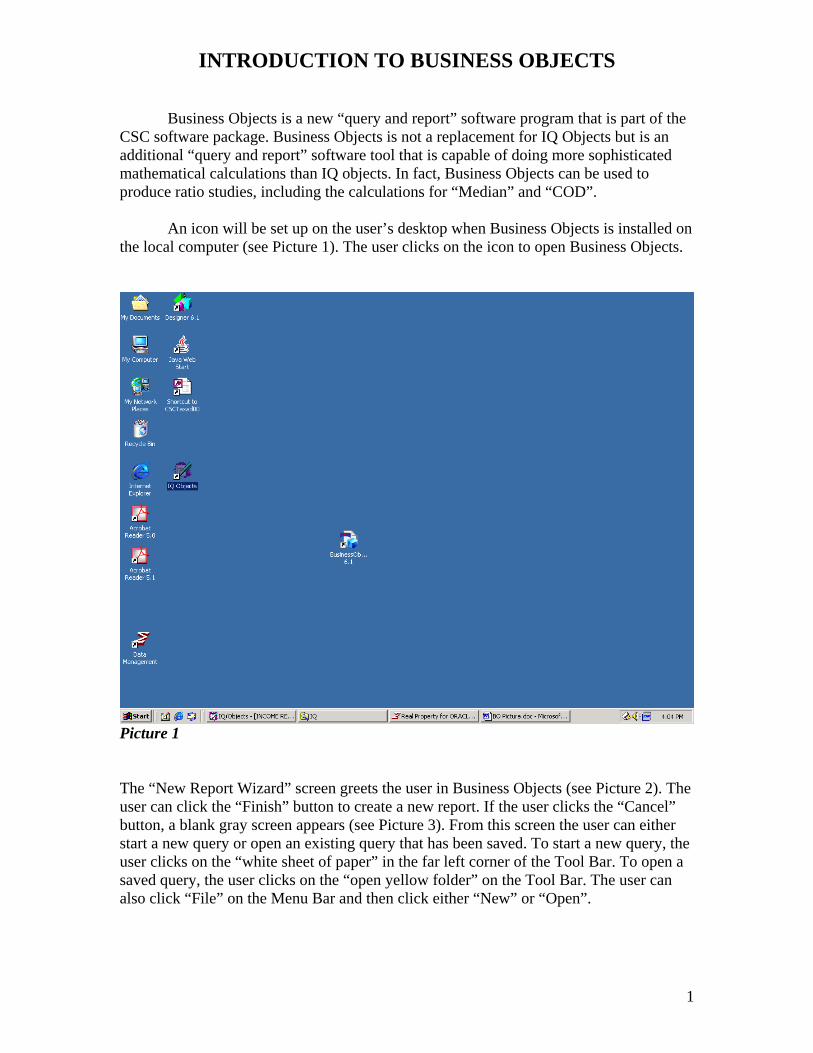
Business Objects is a new “query and report” software program that is part of the CSC software package. Business Objects is not a replacement for IQ Objects but is an additional “query and report” software tool that is capable of doing more sophisticated mathematical calculations than IQ objects. In fact, Business Objects can be used to produce ratio studies, including the calculations for “Median” and “COD”. An icon will be set up on the user’s desktop when Business Objects is installed on the local computer (see Picture 1). The user clicks on the icon to open Business Objects.
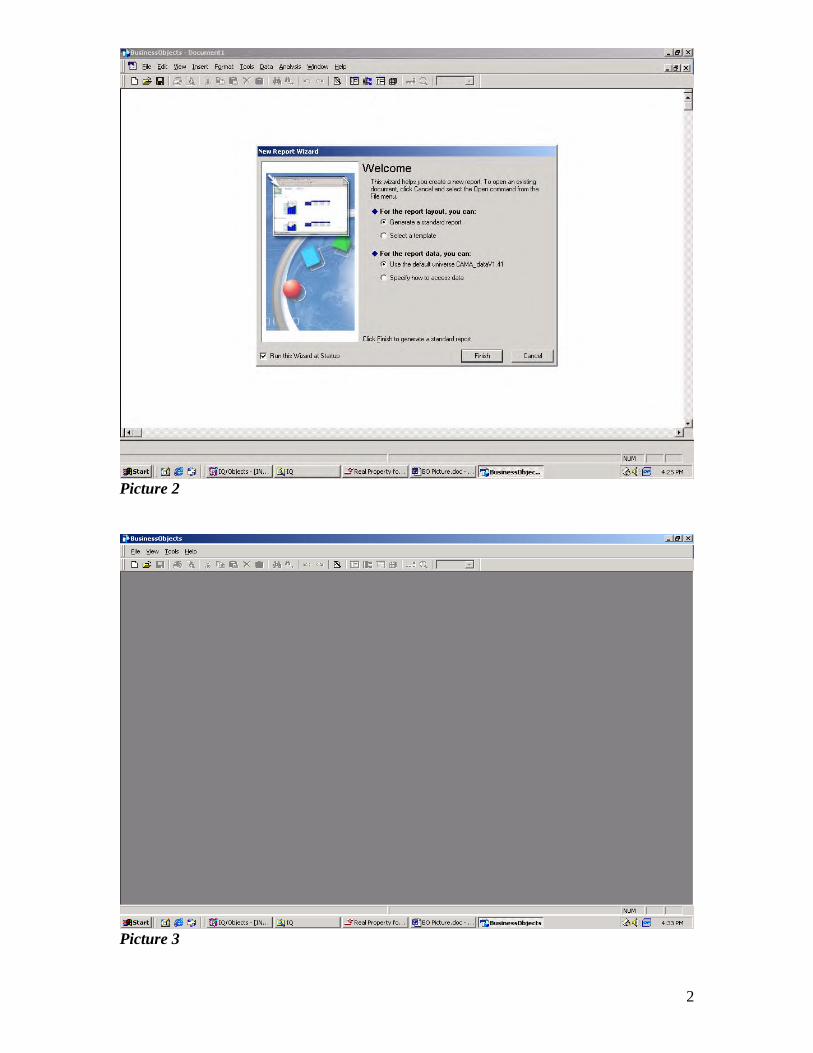
Picture 1 The “New Report Wizard” screen greets the user in Business Objects (see Picture 2). The user can click the “Finish” button to create a new report. If the user clicks the “Cancel” button, a blank gray screen appears (see Picture 3). From this screen the user can either start a new query or open an existing query that has been saved. To start a new query, the user clicks on the “white sheet of paper” in the far left corner of the Tool Bar. To open a saved query, the user clicks on the “open yellow folder” on the Tool Bar. The user can also click “File” on the Menu Bar and then click either “New” or “Open”.
1
Picture 2
Picture 3
2
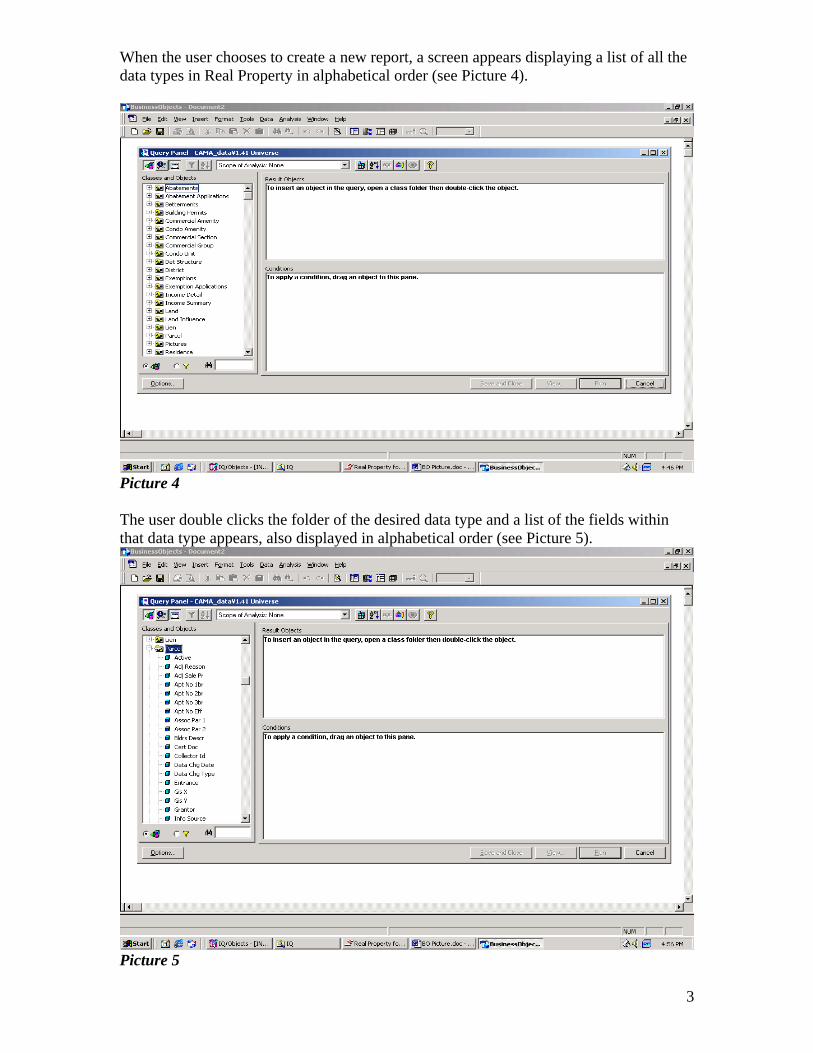
When the user chooses to create a new report, a screen appears displaying a list of all the data types in Real Property in alphabetical order (see Picture 4).
Picture 4 The user double clicks the folder of the desired data type and a list of the fields within that data type appears, also displayed in alphabetical order (see Picture 5).
Picture 5
3
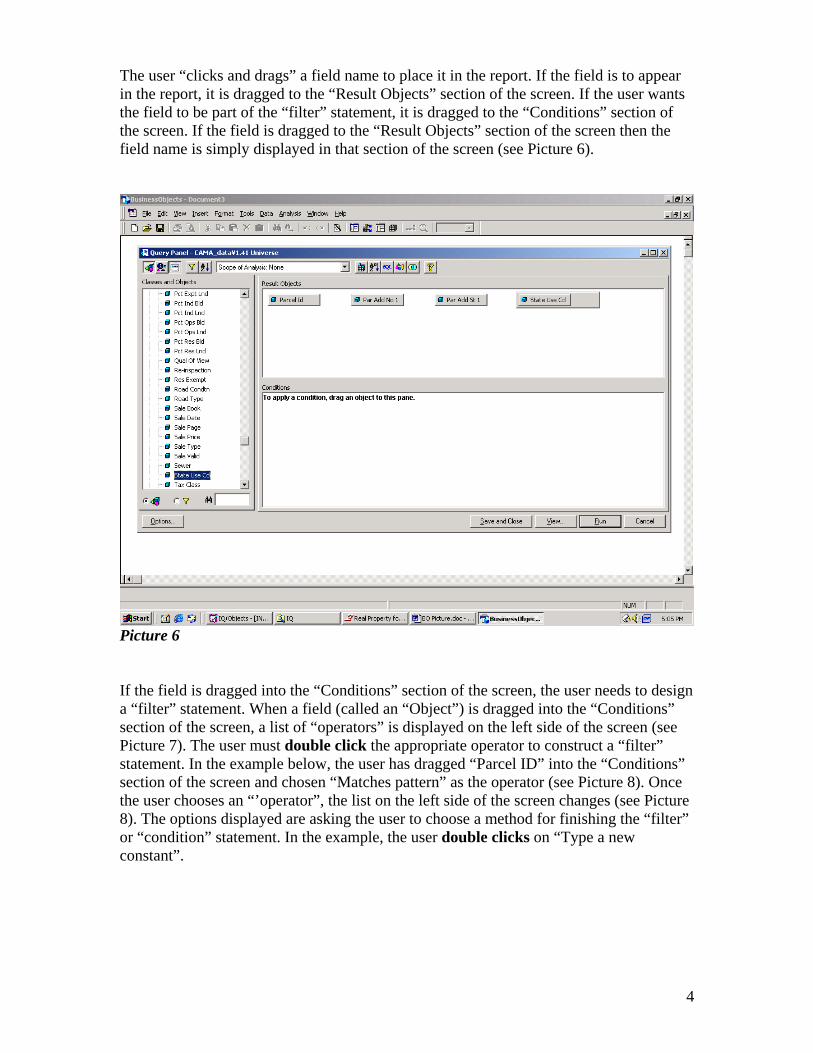
The user “clicks and drags” a field name to place it in the report. If the field is to appear in the report, it is dragged to the “Result Objects” section of the screen. If the user wants the field to be part of the “filter” statement, it is dragged to the “Conditions” section of the screen. If the field is dragged to the “Result Objects” section of the screen then the field name is simply displayed in that section of the screen (see Picture 6).
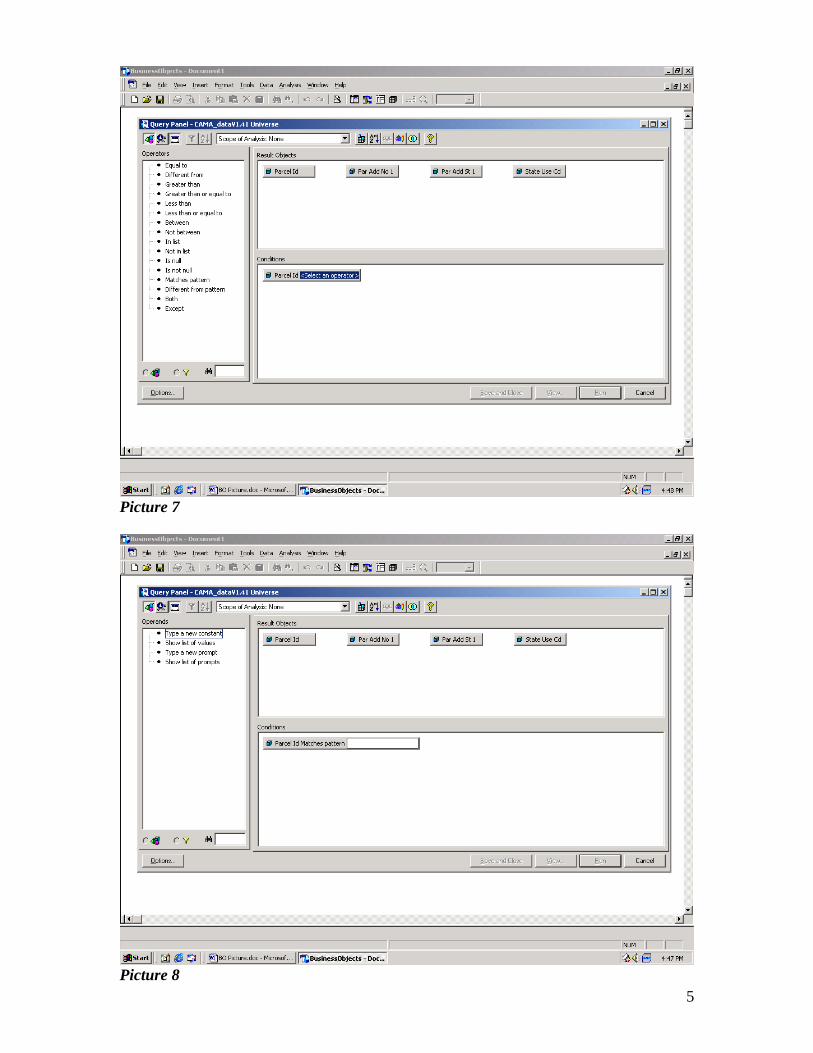
Picture 6 If the field is dragged into the “Conditions” section of the screen, the user needs to design a “filter” statement. When a field (called an “Object”) is dragged into the “Conditions” section of the screen, a list of “operators” is displayed on the left side of the screen (see Picture 7). The user must double click the appropriate operator to construct a “filter” statement. In the example below, the user has dragged “Parcel ID” into the “Conditions” section of the screen and chosen “Matches pattern” as the operator (see Picture 8). Once the user chooses an “’operator”, the list on the left side of the screen changes (see Picture 8). The options displayed are asking the user to choose a method for finishing the “filter” or “condition” statement. In the example, the user double clicks on “Type a new constant”.
4
Picture 7
Picture 8 5
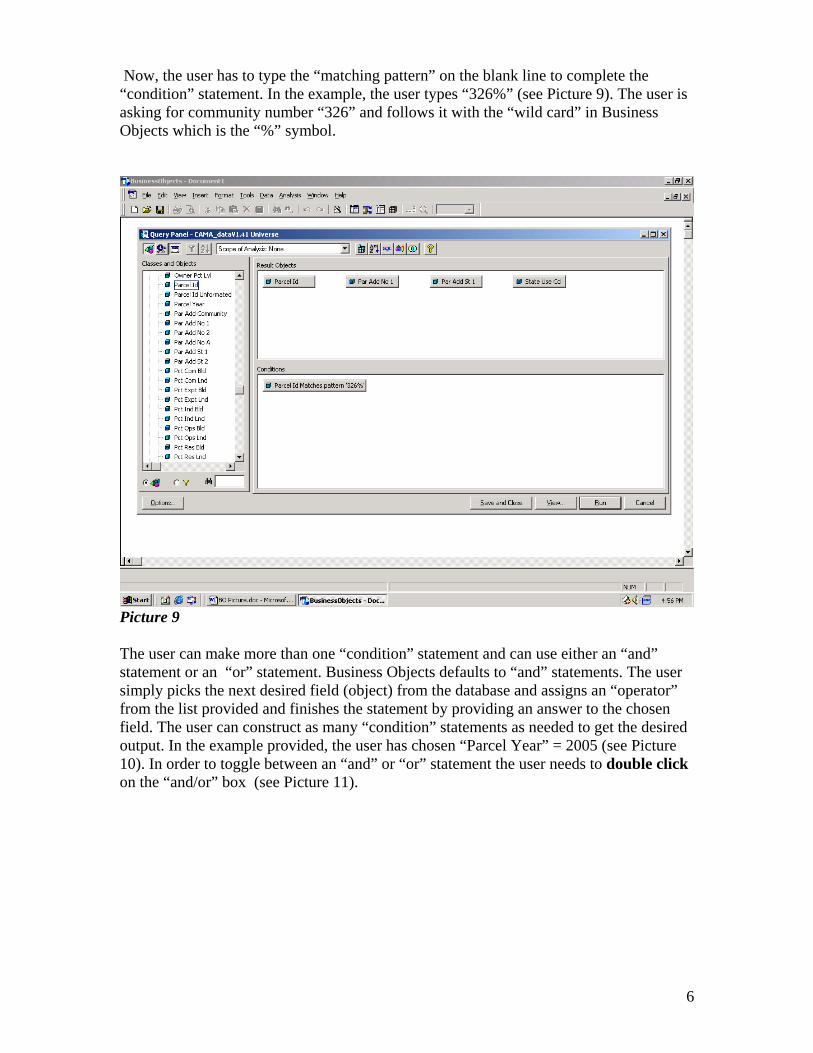
Now, the user has to type the “matching pattern” on the blank line to complete the “condition” statement. In the example, the user types “326%” (see Picture 9). The user is asking for community number “326” and follows it with the “wild card” in Business Objects which is the “%” symbol.
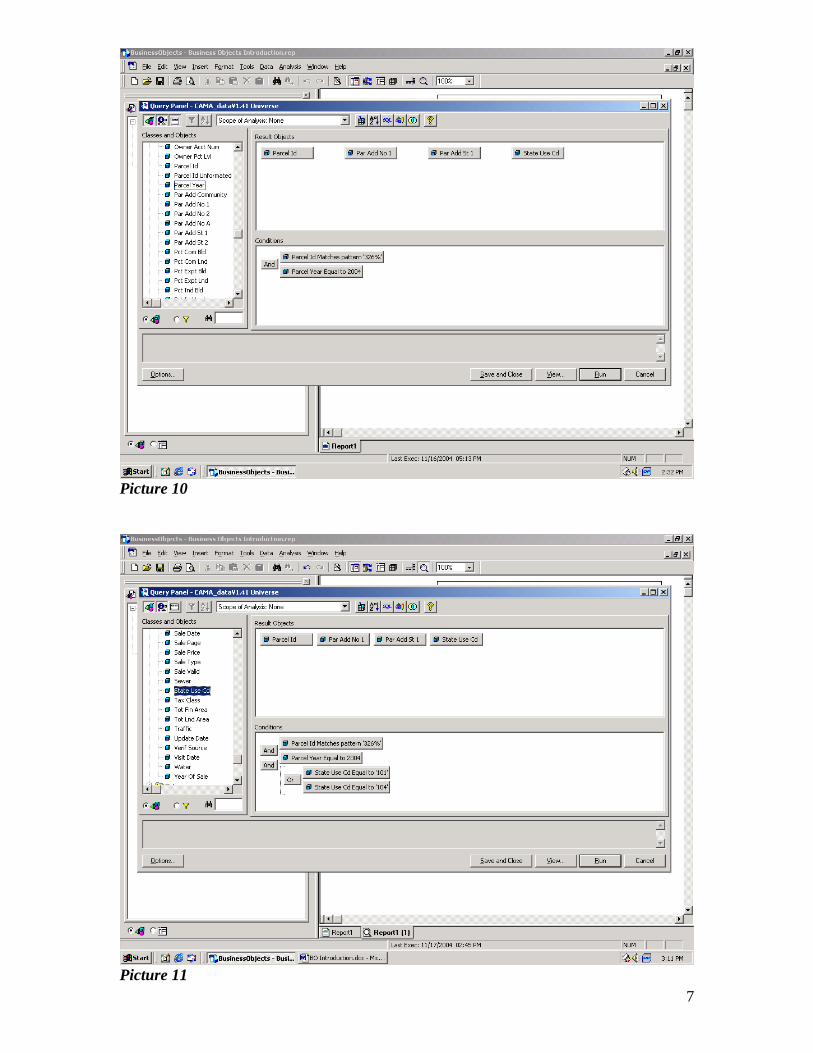
Picture 9 The user can make more than one “condition” statement and can use either an “and” statement or an “or” statement. Business Objects defaults to “and” statements. The user simply picks the next desired field (object) from the database and assigns an “operator” from the list provided and finishes the statement by providing an answer to the chosen field. The user can construct as many “condition” statements as needed to get the desired output. In the example provided, the user has chosen “Parcel Year” = 2005 (see Picture 10). In order to toggle between an “and” or “or” statement the user needs to double click on the “and/or” box (see Picture 11).
6
Picture 10
Picture 11 7
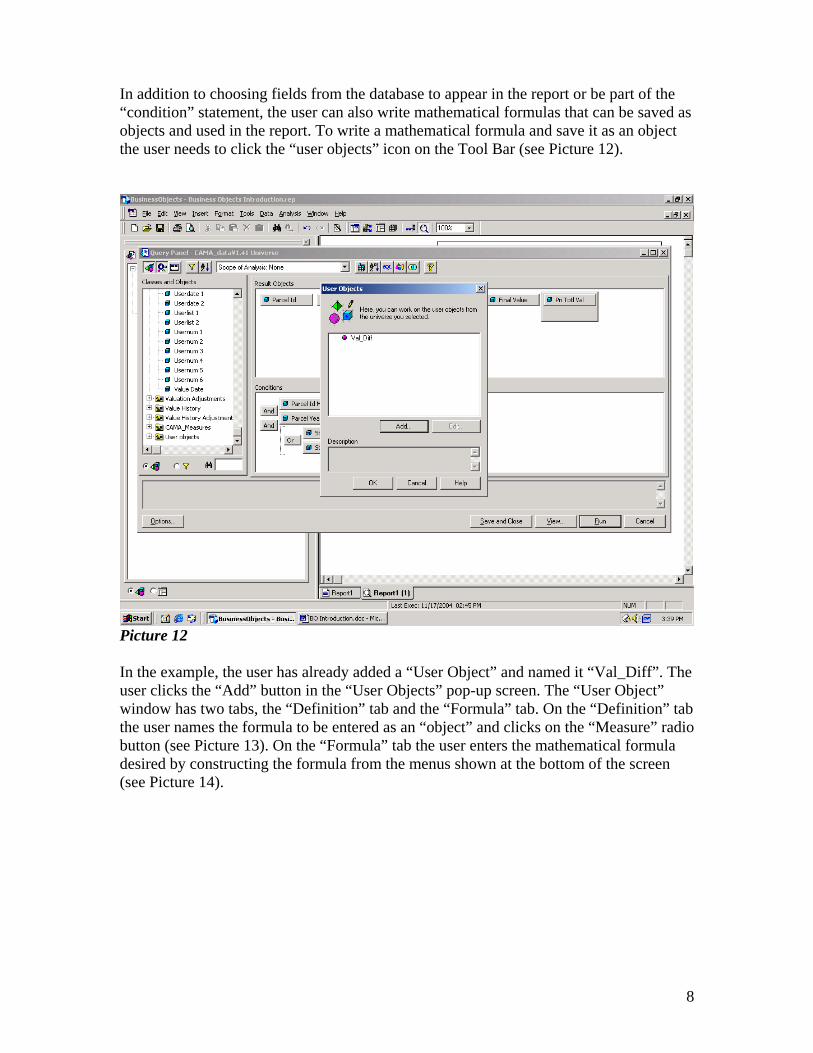
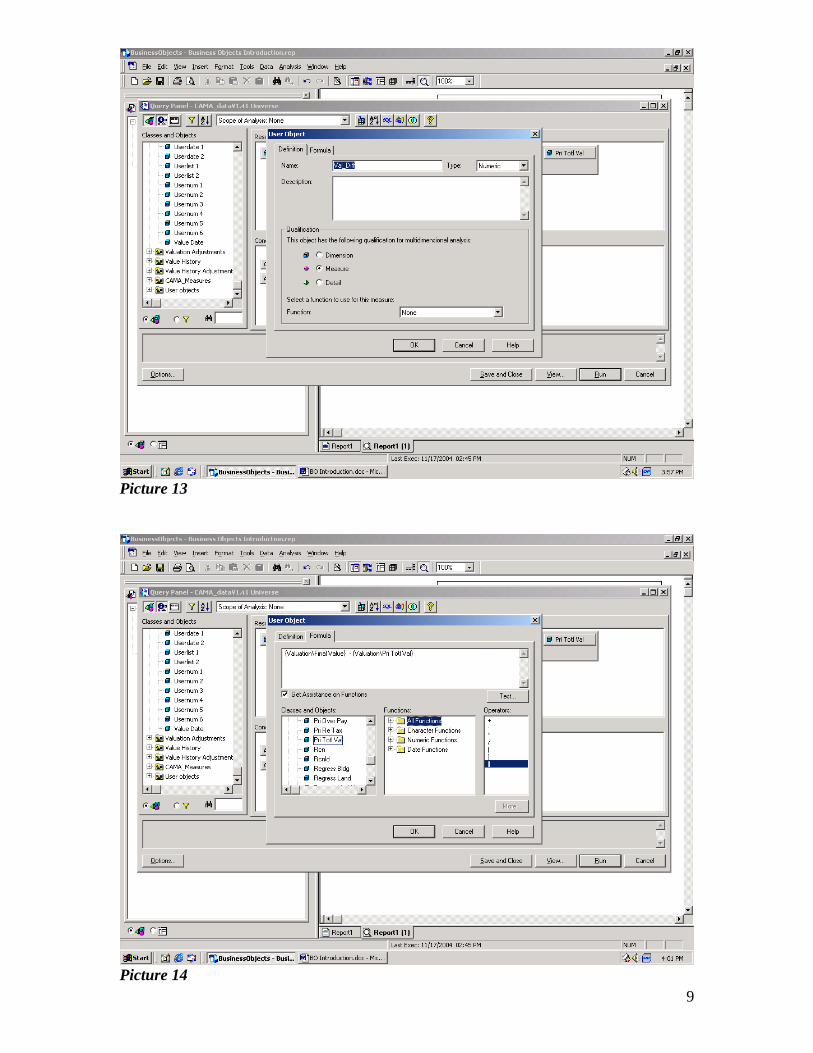
In addition to choosing fields from the database to appear in the report or be part of the “condition” statement, the user can also write mathematical formulas that can be saved as objects and used in the report. To write a mathematical formula and save it as an object the user needs to click the “user objects” icon on the Tool Bar (see Picture 12).
Picture 12 In the example, the user has already added a “User Object” and named it “Val_Diff”. The user clicks the “Add” button in the “User Objects” pop-up screen. The “User Object” window has two tabs, the “Definition” tab and the “Formula” tab. On the “Definition” tab the user names the formula to be entered as an “object” and clicks on the “Measure” radio button (see Picture 13). On the “Formula” tab the user enters the mathematical formula desired by constructing the formula from the menus shown at the bottom of the screen (see Picture 14).
8
Picture 13
Picture 14 9
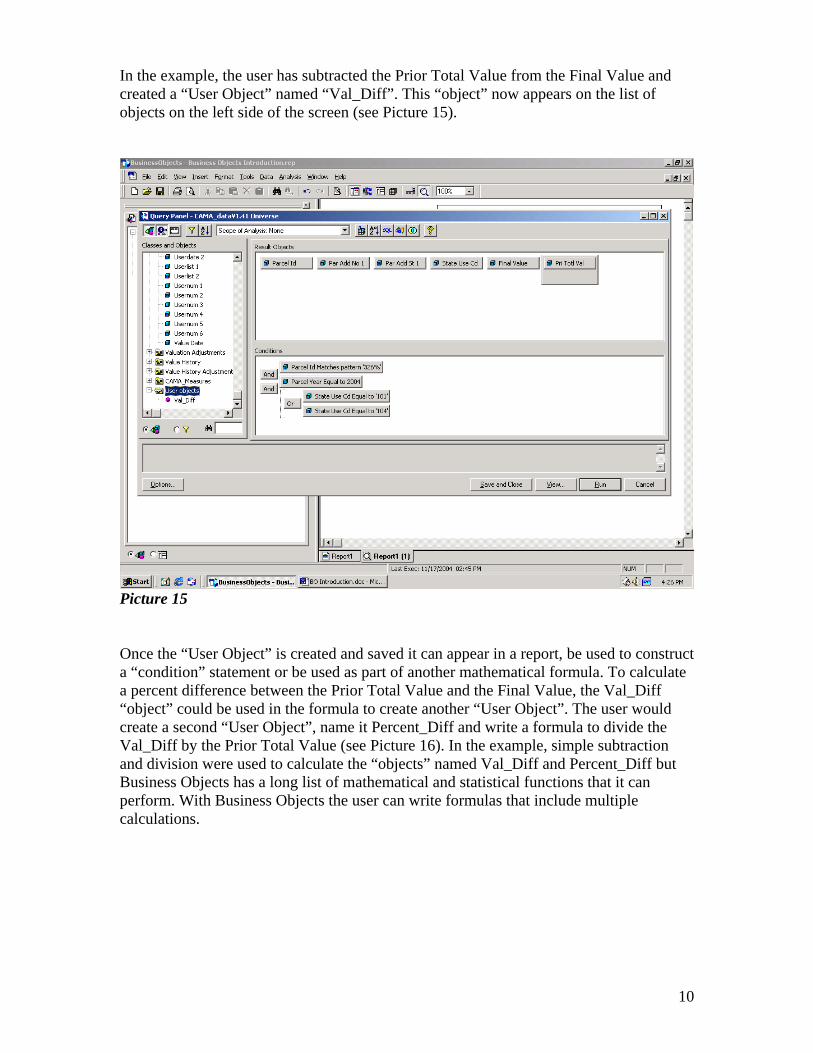
In the example, the user has subtracted the Prior Total Value from the Final Value and created a “User Object” named “Val_Diff”. This “object” now appears on the list of objects on the left side of the screen (see Picture 15).
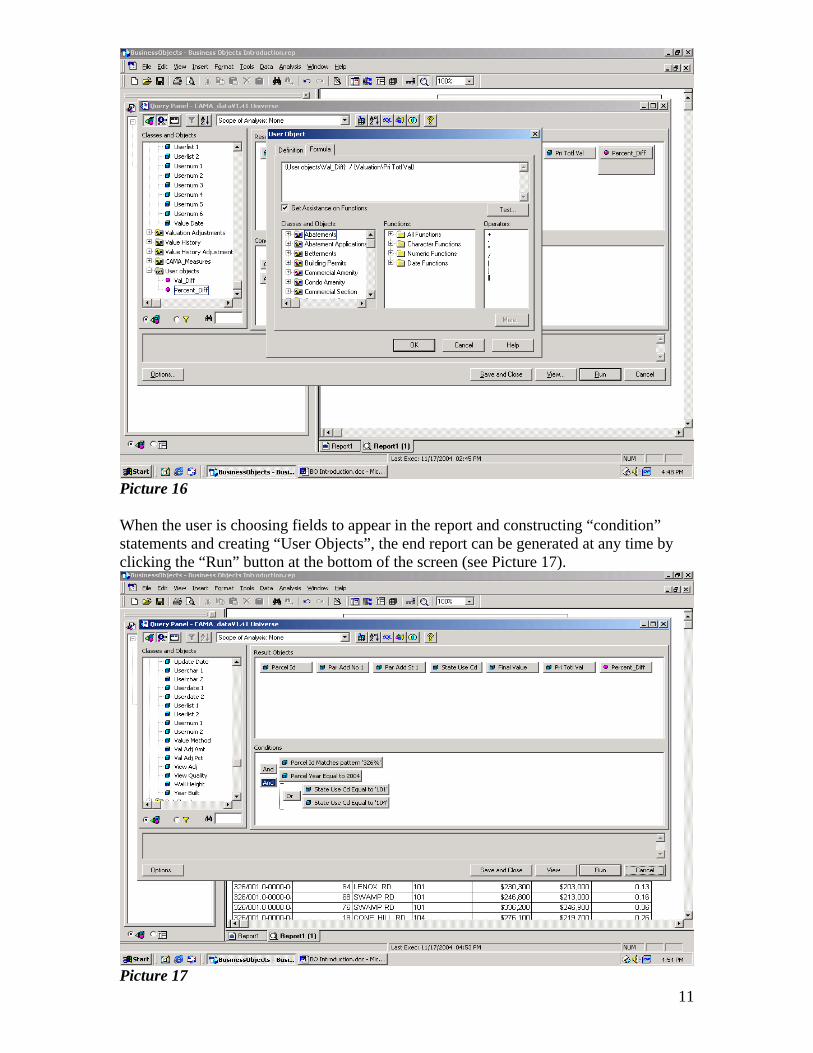
Picture 15 Once the “User Object” is created and saved it can appear in a report, be used to construct a “condition” statement or be used as part of another mathematical formula. To calculate a percent difference between the Prior Total Value and the Final Value, the Val_Diff “object” could be used in the formula to create another “User Object”. The user would create a second “User Object”, name it Percent_Diff and write a formula to divide the Val_Diff by the Prior Total Value (see Picture 16). In the example, simple subtraction and division were used to calculate the “objects” named Val_Diff and Percent_Diff but Business Objects has a long list of mathematical and statistical functions that it can perform. With Business Objects the user can write formulas that include multiple calculations.
10
Picture 16 When the user is choosing fields to appear in the report and constructing “condition” statements and creating “User Objects”, the end report can be generated at any time by clicking the “Run” button at the bottom of the screen (see Picture 17).
11Picture 17
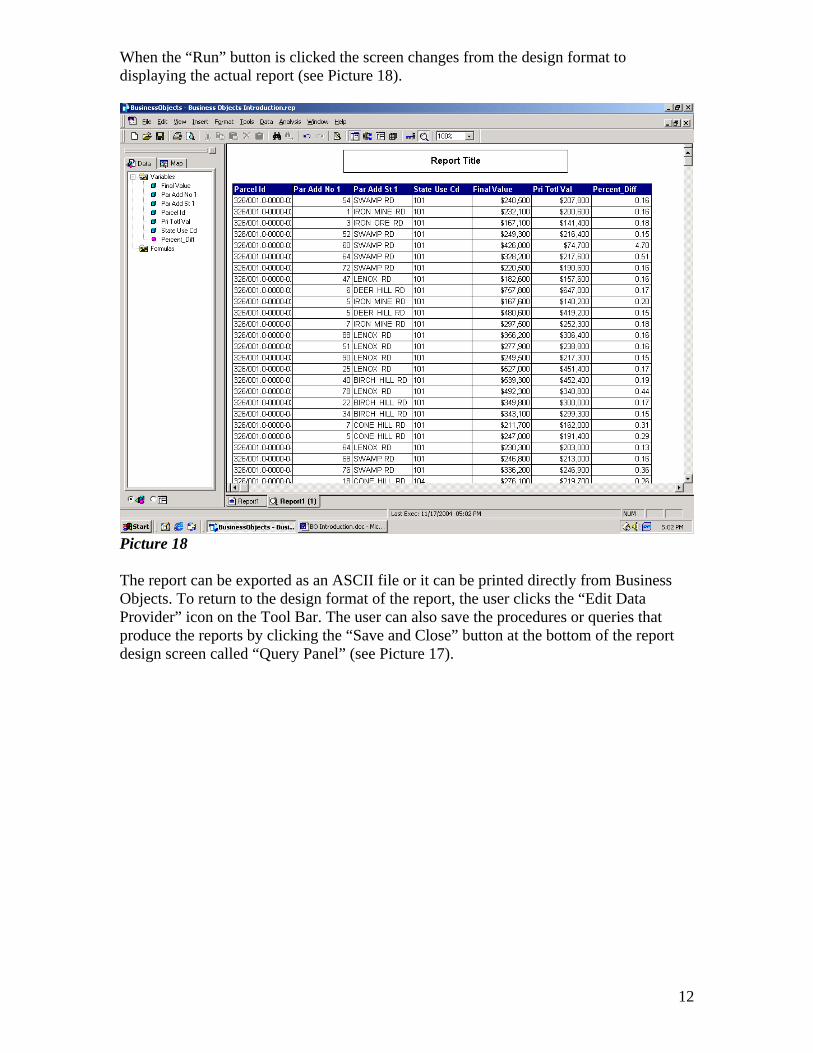
When the “Run” button is clicked the screen changes from the design format to displaying the actual report (see Picture 18).
Picture 18 The report can be exported as an ASCII file or it can be printed directly from Business Objects. To return to the design format of the report, the user clicks the “Edit Data Provider” icon on the Tool Bar. The user can also save the procedures or queries that produce the reports by clicking the “Save and Close” button at the bottom of the report design screen called “Query Panel” (see Picture 17).