Introduction to Collaborative Conceptual Modelling Barry Newell a,b and Katrina Proust a,c Working Paper August 2012 a Fenner School of Environment and Society, ANU b Research School of Engineering, ANU C National Centre for Epidemiology and Population Health, ANU E: [email protected], katrina.proust @anu.edu.au Preferred Citation: Newell, B., and Proust, K., 2012, Introduction to Collaborative Conceptual Modelling, Working Paper, ANU Open Access Research. https://digitalcollections.anu.edu.au/handle/1885/9386
Transcript
Introduction to Collaborative Conceptual Modelling
Barry Newella,b and Katrina Prousta,c
Working Paper August 2012
a Fenner School of Environment and Society, ANU b Research School of Engineering, ANU C National Centre for Epidemiology and Population Health, ANU
E: [email protected], katrina.proust @anu.edu.au Preferred Citation: Newell, B., and Proust, K., 2012, Introduction to Collaborative Conceptual Modelling, Working Paper, ANU Open Access Research. https://digitalcollections.anu.edu.au/handle/1885/9386
Newell & Proust 2012 Introduction to CCM
2
INTRODUCTION Rising populations, consumerism, urbanism, and globalisation are leading to more extensive and tighter feedback connections within the human-Earth system, making it more and more difficult to understand its dynamics and anticipate its response to management actions. The point has now been reached where it is necessary to take a dynamical systems approach in attempts to develop adaptive strategies that can bring human activities into harmony with planetary processes. The behaviour of a complex system emerges from the feedback interactions between its parts. It is not possible to improve the performance of such a system by attempting to improve the performance of its parts taken separately. The standard management response to complex problems is to “carve them at the joints” and solve the resulting smaller problems separately. This strategy will not work in complex human-environment systems—actions taken to solve the separate smaller problems will interact to produce outcomes that are both unexpected and unwanted. For this reason, silo-based approaches to adaptation are likely to be maladaptive. But holistic approaches are also prone to failure. Anyone attempting to account for all the interactions in a complex system will be buried under an avalanche of details and data. The challenge for would-be-adapters is to learn just enough, about the way that feedback operates in their system-of-interest, that they can identify and explain its main effects. A feedback-systems view can help them to avoid unwanted policy outcomes, despite having to work with constant change and significant levels of ignorance and uncertainty. In this paper we introduce an approach that we have developed to help a research or policy-making group to come to terms with the feedback dynamics of their system-of-interest. This approach, which we call Collaborative Conceptual Modelling (CCM), has grown out of some 30 years of theoretical studies and practical collaborative work with a wide range of community, student, academic, and professional groups. CCM has a strong theoretical base. It blends and balances insights and tools that have been developed, by many research groups, over decades of investigation into the nature and behaviour of complex adaptive systems and the nature of human understanding and decision making. The name ‘Collaborative Conceptual Modelling’ has been chosen to emphasise several ideas that are foundational to our approach. First, we intend the term ‘modelling’ to be interpreted broadly. It covers the construction of cause-effect models that range from very simple, tacit mental models, through influence diagrams, causal-loop diagrams and stock-and-flow maps, to sophisticated computer-based dynamical models. Second, the term ‘conceptual’ serves to pick out a particular subset of the possible cause-effect models. While detailed, high-order models are important in some system-dynamics investigations, in CCM we focus on the progressive development of influence diagrams, causal-loop diagrams, and low-order stock-and-flow models1 (Proust and Newell 2006; Ghaffarzadegan et al 2011). The aim of a CCM exercise is to articulate, mesh, and extend the mental models of the members of an adaptive group, rather than 1 The ‘order’ of a system dynamics model is the number of state variables (stocks) that it contains. We consider a low-order model to be one that has ≤ 5 state variables. Such a model can have many cause-effect links and, when simulated, can display quite complex behaviour.
Newell & Proust 2012 Introduction to CCM
3
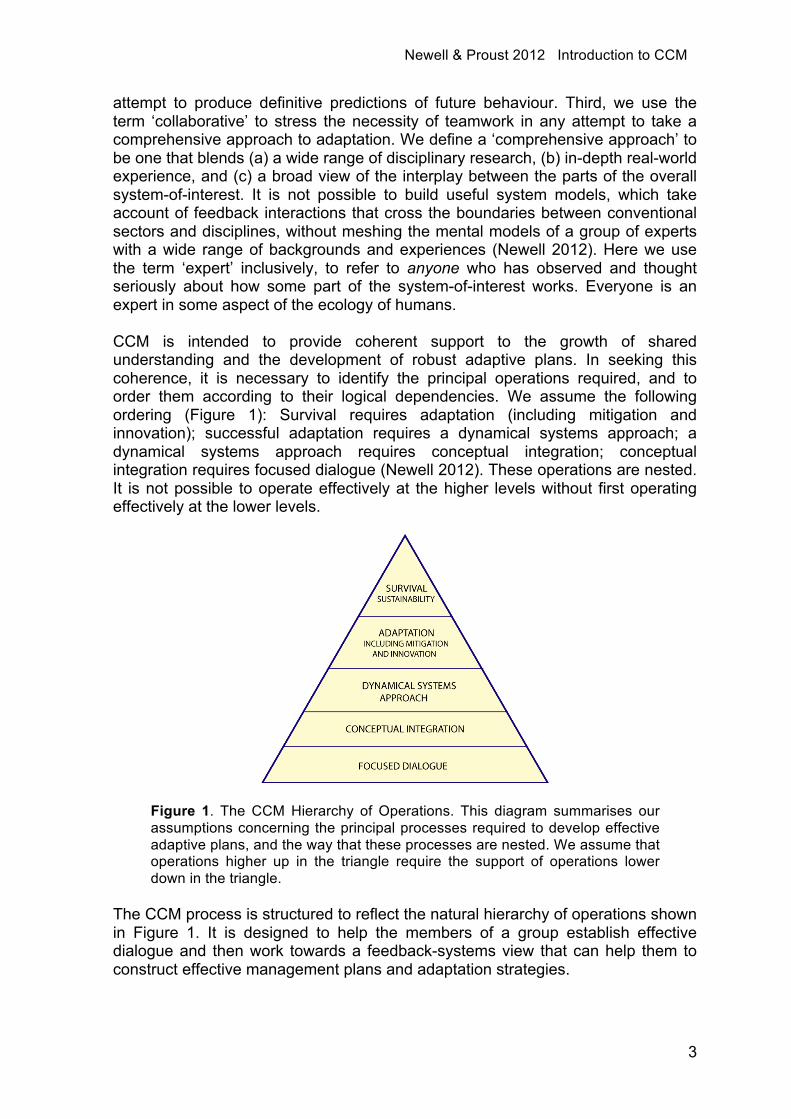
attempt to produce definitive predictions of future behaviour. Third, we use the term ‘collaborative’ to stress the necessity of teamwork in any attempt to take a comprehensive approach to adaptation. We define a ‘comprehensive approach’ to be one that blends (a) a wide range of disciplinary research, (b) in-depth real-world experience, and (c) a broad view of the interplay between the parts of the overall system-of-interest. It is not possible to build useful system models, which take account of feedback interactions that cross the boundaries between conventional sectors and disciplines, without meshing the mental models of a group of experts with a wide range of backgrounds and experiences (Newell 2012). Here we use the term ‘expert’ inclusively, to refer to anyone who has observed and thought seriously about how some part of the system-of-interest works. Everyone is an expert in some aspect of the ecology of humans. CCM is intended to provide coherent support to the growth of shared understanding and the development of robust adaptive plans. In seeking this coherence, it is necessary to identify the principal operations required, and to order them according to their logical dependencies. We assume the following ordering (Figure 1): Survival requires adaptation (including mitigation and innovation); successful adaptation requires a dynamical systems approach; a dynamical systems approach requires conceptual integration; conceptual integration requires focused dialogue (Newell 2012). These operations are nested. It is not possible to operate effectively at the higher levels without first operating effectively at the lower levels.
Figure 1. The CCM Hierarchy of Operations. This diagram summarises our assumptions concerning the principal processes required to develop effective adaptive plans, and the way that these processes are nested. We assume that operations higher up in the triangle require the support of operations lower down in the triangle.
The CCM process is structured to reflect the natural hierarchy of operations shown in Figure 1. It is designed to help the members of a group establish effective dialogue and then work towards a feedback-systems view that can help them to construct effective management plans and adaptation strategies.
Newell & Proust 2012 Introduction to CCM
4
THE CCM PROCESS The CCM process represents our attempt to balance strong guiding principles with flexibility of application. There are a number of ways to implement each activity in the process. Selected activities can be downplayed or augmented depending on the particular needs of a specific group. Ideally, a CCM group will begin by “following the script” and then, as their understanding grows, they will take control of the process and tailor it to meet their own perceived needs. CCM methods are based on insights developed by research in applied history (Proust 2004), complex adaptive systems (Axelrod and Cohen 1999), resilience thinking (Walker and Salt 2006), system dynamics (Sterman 2000; Meadows 2009), and cognitive science (Lakoff and Johnson 1980; Newell 2012). Concepts from system dynamics (hereinafter SD) are particularly important because of their practicality. In addition, an SD approach provides a powerful, fresh view of many management challenges because of its focus on feedback and endogenously generated forces (Richardson 2011). CCM takes SD tools, such as influence diagrams, causal-loop diagrams, and stock-and-flow maps and models, and embeds them in protocols that guide a group through the process of wrestling with the complexity of their system-of-interest. In Figure 2 we display the ‘poster’ that we use to summarise the structure of the CCM process. The poster serves as a road map. It can be used to give group members an initial understanding of the scope and structure of CCM, and to indicate what parts of the process will be covered in a given workshop or research project. The six boxes arrayed down the centre of the poster represent ‘co-evolving’ activities (see following sections). The activities are co-evolving in the sense that, while there is an overall need for a group to progress from Activity 1 through to Activity 6, it is often necessary to loop back and revisit earlier activities in the light of new understanding. The black downward-pointing arrows provide a sense of progress towards the goal of effective adaptive plans. The grey upward-pointing arrows are intended to indicate the co-evolving nature of the activities. The text and small diagrams displayed down the sides of the poster summarise key concepts and protocols. The text and photograph shown in the top right-hand corner serve as reminders of the crucial role that applied history plays in dynamical studies. The activities are divided into two phases whose scope is indicated by the square brackets in the poster. Phase I comprises Activities 1 to 3. These activities are designed to foster focused dialogue and conceptual integration (Newell et al. 2005; Newell 2012). In many cases Phase I will be sufficient—Activities 1 through 3 can help a group to make considerable progress in their development of new, shared understandings. Phase II comprises Activities 4 to 6. These activities are designed to support the group’s efforts to (a) develop a better understanding of the dominant dynamics of their system-of-interest, (b) identify leverage points for management interventions that can lead to effective adaptation, and (c) construct scenarios or other narratives that describe possible futures and that can guide policy making. Phase II is more challenging that Phase I, and requires a greater commitment of time and some level of modelling expertise.
Newell & Proust 2012 Introduction to CCM
5
Figure 2. The structure of the Collaborative Conceptual Modelling approach
Newell & Proust 2012 Introduction to CCM
6
CCM ACTIVITY 1 Discuss problem or situation of concern
Focus Question: What is the challenge? It is usual to start an investigation by discussing the problem or situation of concern. In a CCM study this activity has several signature characteristics: First, as indicated by the focus question, the emphasis is on the ‘challenge’ rather than ‘the problem’. This is done to keep the initial discussions more general than is often the case when the members of a group seek a tightly defined research question on which to base their collaborative work. Hasty acceptance of a specific research question can lead, for example, to premature convergence on a superficial problem, or to a focus on symptoms instead of fundamental problems. It can also give a misleading sense of unity among group members who, in reality, do not yet understand each other’s point-of-view. Second, in CCM there is an emphasis on new understandings emerging from the synergistic meshing of old understandings. The basic idea is that, in attempts to discover “the simplicity on the other side of complexity”, it is necessary to begin with the widest possible view of the system-of-interest. This means that the group must move beyond merely respecting each other’s point-of-view to actually using everyone’s point-of-view. This process is facilitated by initially maintaining a broad focus on the challenges facing the group—that is, by delaying the identification of specific problems to be solved. Third, because CCM is necessarily focused on system dynamics, group members are encouraged to discuss the challenge in terms of stocks-and-flows and feedback (Sterman 2000; Meadows 2009). Stock-and-flow concepts are introduced early in the CCM process. This helps participants to understand the nature of system variables (Activity 3). We have found that group members who have a clear understanding of the nature of stocks, and of the distinction between stocks and flows, are able to produce influence diagrams with well chosen, well expressed variables. Such diagrams can represent a definite step towards a better, shared understanding of the existing (or desired) feedback structure of the system-of-interest. Fourth, because system-dynamics concepts are unfamiliar to many people, CCM projects have an unavoidable educational component. A shared understanding of basic dynamical concepts is necessary if group members are to develop a richer, more reliable view of the operation of cause-and-effect in their system-of-interest. The pedagogical approach we use in CCM workshops is based on carefully designed conceptual metaphors (Lakoff and Johnson 1980). See Newell (2012) for a discussion of the role of conceptual metaphor in the development of shared understanding. One of the principal reasons for adopting SD methods as the basis of CCM practice is the visual, intuitive nature of the stock-and-flow metaphor. The Water Tank Metaphor (Figure 3 and Table 1), together with the familiar Bathtub Metaphor, is of central importance in CCM discussions.
Newell & Proust 2012 Introduction to CCM
7
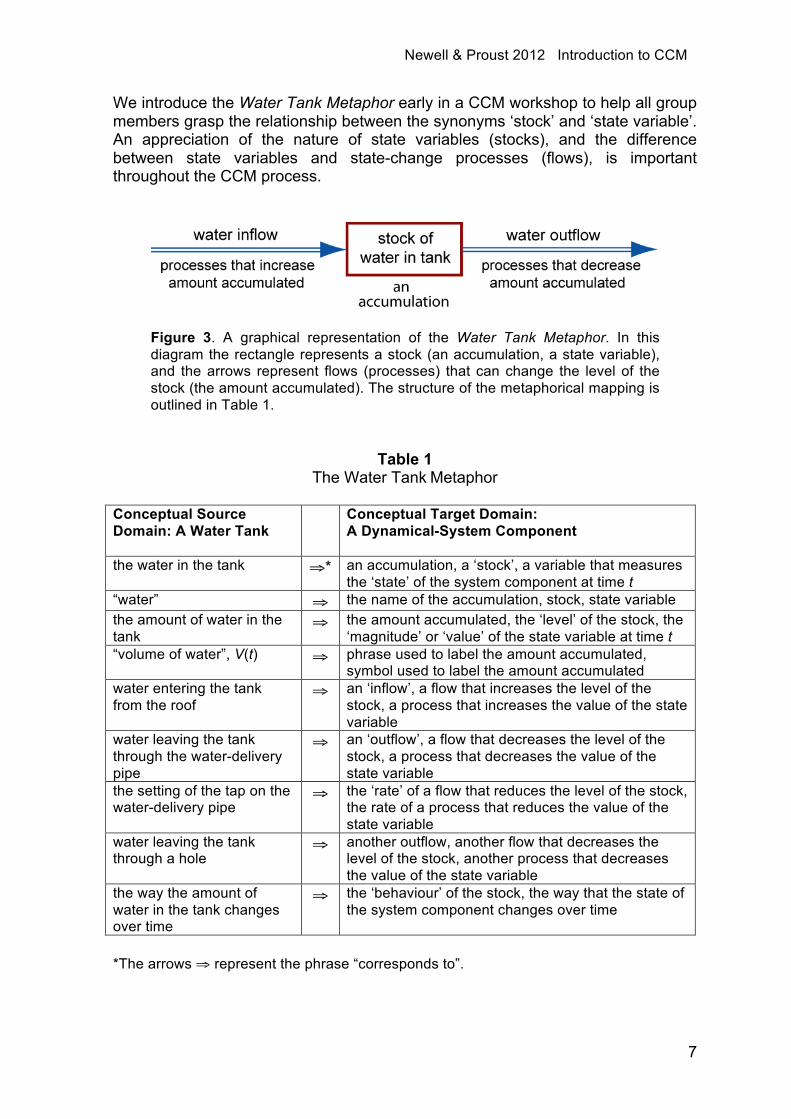
We introduce the Water Tank Metaphor early in a CCM workshop to help all group members grasp the relationship between the synonyms ‘stock’ and ‘state variable’. An appreciation of the nature of state variables (stocks), and the difference between state variables and state-change processes (flows), is important throughout the CCM process.
Figure 3. A graphical representation of the Water Tank Metaphor. In this diagram the rectangle represents a stock (an accumulation, a state variable), and the arrows represent flows (processes) that can change the level of the stock (the amount accumulated). The structure of the metaphorical mapping is outlined in Table 1.
Table 1 The Water Tank Metaphor
Conceptual Source Domain: A Water Tank
Conceptual Target Domain: A Dynamical-System Component
the water in the tank ⇒* an accumulation, a ‘stock’, a variable that measures the ‘state’ of the system component at time t
“water” ⇒ the name of the accumulation, stock, state variable the amount of water in the tank
⇒ the amount accumulated, the ‘level’ of the stock, the ‘magnitude’ or ‘value’ of the state variable at time t
“volume of water”, V(t) ⇒ phrase used to label the amount accumulated, symbol used to label the amount accumulated
water entering the tank from the roof
⇒ an ‘inflow’, a flow that increases the level of the stock, a process that increases the value of the state variable
water leaving the tank through the water-delivery pipe
⇒ an ‘outflow’, a flow that decreases the level of the stock, a process that decreases the value of the state variable
the setting of the tap on the water-delivery pipe
⇒ the ‘rate’ of a flow that reduces the level of the stock, the rate of a process that reduces the value of the state variable
water leaving the tank through a hole
⇒ another outflow, another flow that decreases the level of the stock, another process that decreases the value of the state variable
the way the amount of water in the tank changes over time
⇒ the ‘behaviour’ of the stock, the way that the state of the system component changes over time
*The arrows ⇒ represent the phrase “corresponds to”.
Newell & Proust 2012 Introduction to CCM
8
CCM ACTIVITY 2 Gather historical data to reveal patterns
of change over space and time Focus Question: What is the story? The main aim of CCM is to help a group to improve their understanding of the way that their system-of-interest is likely to respond to alternative management actions. That is, to understand better the dynamics of their system—how it can be expected to change state in response to specific interventions. A crucial step in building this understanding is to examine how the system has behaved in the past. In CCM we use the label ‘Dynamical History’ to refer to historical studies that are designed to unearth the stock-and-flow feedback structures that have driven system behaviour over time. Any attempt to understand change requires a base in historical data. At one end of the scale, oral histories and simple ‘cause-and-effect stories’ can be developed collaboratively in a workshop situation. Group members’ knowledge can be meshed by constructing a timeline (Figure 4). Studies of documentary sources can reveal the cultural and social drivers of behaviour, thus providing the human dimension so often missing in traditional scientific and economic studies. At the other end of the scale, the assembly of quantitative historical data can be a critical step in the study of the dynamics of a human-environment system. Dynamical History investigations can contribute information about the sources of dynamic complexity (delays and feedback effects), the multiple consequences of past actions (Figure 5a), and the multiple drivers of current situations (Figure 5b). They can help a group to build an understanding of historical contingency and path dependence, and to define baseline conditions for tracking change. The nature of human-environment interactions demands that decision makers tackle issues with strong biophysical, social, cultural, political, economic, technical and perceptual dimensions. Simultaneously, they must face the contemporary consequences of past decisions. Policy-making timescales can be long. First, it usually takes time for communities to recognise that a problem exists. Then, management responses are often delayed (and fail to take account of cross-sector feedback loops). More time elapses before the expected outcomes of the management responses begin to appear. The full spectrum of outcomes develops only slowly, commonly taking decades (Figure 5). Finally, there is a good chance that some of the unintended outcomes (which are often due to unnoticed cross-sector feedback) will undercut the desired outcomes, and the whole cycle will have to begin again. The histories of problems arising from unwanted outcomes typically extend beyond the working life of practitioners, beyond even the administrative life of government agencies (Proust 2008). In such circumstances it is very difficult for decision makers, and the communities they serve, to learn from experience. In reality, it is not possible to do just one thing in a complex system. It follows that an SD-based historical perspective is necessary in any serious attempt to come to terms with the challenges that this reality presents to managers.
Newell & Proust 2012 Introduction to CCM
9
Figure 4. A timeline summarising selected aspects of the early development of water-supply infrastructure in the Australian Capital Territory (Proust and Newell 2006).
Figure 5. You can’t do just one thing. These diagrams represent two hypothetical cases. Panel a: Multiple outcomes of past actions. The horizontal axis represents time and the vertical axis represents the change in the values of the variables (V1 to V3) that are affected by a particular management action. The curved lines represent time-series for each variable. The symbols t1, t2, and t3 represent the times at which the changes rise above the detection threshold. The intended outcome of the management action is an increase in the value of V1. The expected change is detected at t1, but then the values of V2 and V3 begin to increase and force down the value of V1. Panel b: Multiple drivers of current situations. The horizontal axis represents time and the vertical axis represents the values of four variables that are affected by different management actions. This diagram represents a situation where a significant event occurs at the time labelled “now”. The event is triggered when the four variables, W1 to W4, reach comparable levels and interact with each other. It can be extremely difficult to anticipate or explain such events. This is particularly the case when the changes in the values of the variables arise from four separate past actions (at times a1 to a4) that, in the manager’s mind, are unconnected.
CCM ACTIVITY 3 Integrate individuals’ mental models of cause and effect
Focus Question: Can I see how you think? CCM is designed to provide practical ways of meshing the disparate worldviews of individuals to produce new, emergent understandings. The aim is to generate comprehensive worldviews that have a combination of breadth and depth that is typically beyond the reach of individuals working alone. It is a foundational principle of CCM that no one person can see the ‘whole elephant’.
The ancient story of the blind men and the elephant serves to remind us why we need to see the world through each other’s eyes. Because they each felt a different part of the elephant, and could not see the whole animal, each of the blind men conceived it differently. They immediately fell to arguing about its nature. It’s a spear! It’s a snake! It’s a tree! It’s a rope! Meanwhile the elephant walked slowly away to find a quieter place to browse.
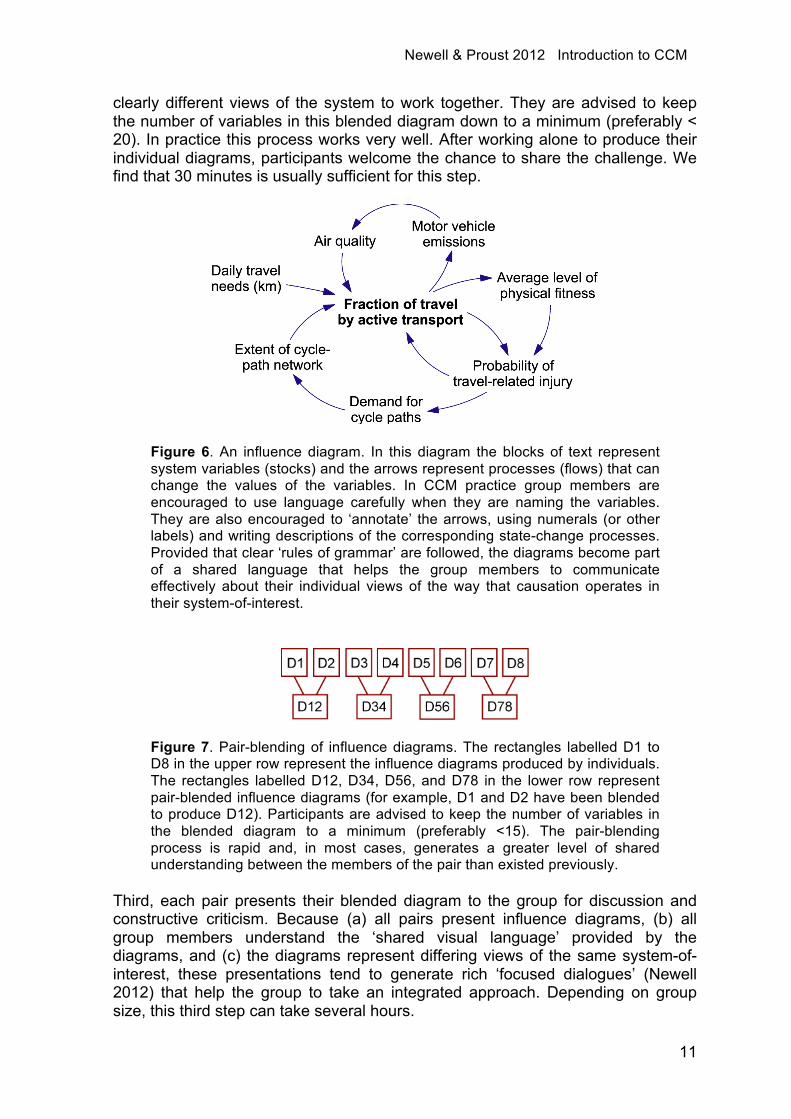
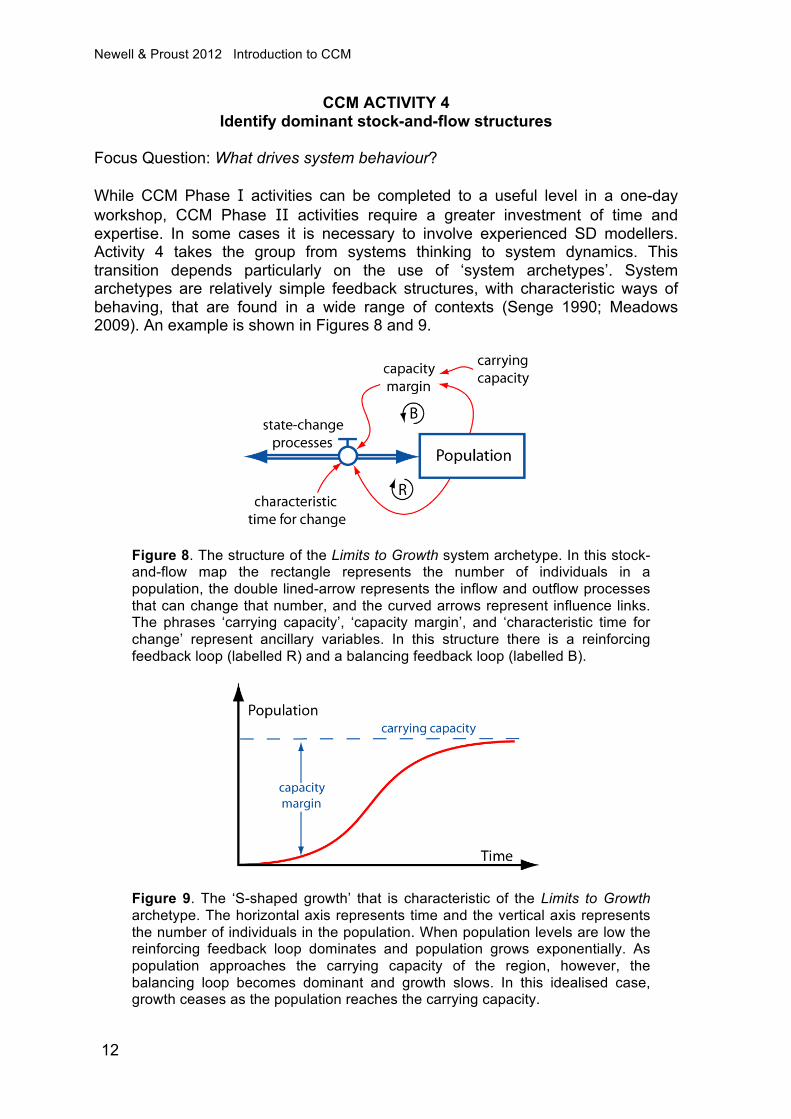
Our limited ability to see the whole is one of the main impediments to the development of societies that are conflict-free, equitable and adaptive. We can increase our visual acuity most efficiently by working together. The approach used in Activity 3 is designed to help a CCM group to define the state-space boundary of their system-of-interest, and develop a genuine shared understanding of the interactions that drive its behaviour. The activity depends on the use of a process that we call ‘pair-blending’ (Newell & Proust 2009). CCM ‘pair-blending‘ provides a way to compare and contrast group members’ understanding of the dynamics of their system-of-interest. There are three steps: First, each person constructs an individual influence diagram (Figure 6). The challenge is to describe a causal structure that, in his or her opinion, plays a dominant role in the behaviour of the system. Participants are encouraged to regard their influence diagrams as tentative ‘dynamic hypotheses’, rather than ‘true’ descriptions of the structure of the system. They are, nevertheless, asked to adhere to a set of rules for the construction of their diagrams. The diagrams are built around a specific focus variable, following a procedure similar to that recommended by Vennix (1996: 120). Considerable stress is laid on the importance of expressing variable names clearly, using nouns or noun phrases to indicate that the entities so labelled are stocks (state variables) that are capable of a change of level (increase or decrease). The arrows represent flows. It is a CCM motto that “the actions are in the arrows”. Participants are also asked to keep the number of variables to a minimum (preferably <10), and to attempt to identify possible feedback loops in their selected sub-system. In a typical workshop, no more than 15 minutes is allowed for this step. Second, group members work in pairs to simplify their individual diagrams and combine them to form a single, blended diagram that incorporates the essential features of their two worldviews (Figure 7). We use the individual diagrams to decide who should be in each pair. Where possible we ask participants who have
Newell & Proust 2012 Introduction to CCM
11
clearly different views of the system to work together. They are advised to keep the number of variables in this blended diagram down to a minimum (preferably < 20). In practice this process works very well. After working alone to produce their individual diagrams, participants welcome the chance to share the challenge. We find that 30 minutes is usually sufficient for this step.
Figure 6. An influence diagram. In this diagram the blocks of text represent system variables (stocks) and the arrows represent processes (flows) that can change the values of the variables. In CCM practice group members are encouraged to use language carefully when they are naming the variables. They are also encouraged to ‘annotate’ the arrows, using numerals (or other labels) and writing descriptions of the corresponding state-change processes. Provided that clear ‘rules of grammar’ are followed, the diagrams become part of a shared language that helps the group members to communicate effectively about their individual views of the way that causation operates in their system-of-interest.
Figure 7. Pair-blending of influence diagrams. The rectangles labelled D1 to D8 in the upper row represent the influence diagrams produced by individuals. The rectangles labelled D12, D34, D56, and D78 in the lower row represent pair-blended influence diagrams (for example, D1 and D2 have been blended to produce D12). Participants are advised to keep the number of variables in the blended diagram to a minimum (preferably <15). The pair-blending process is rapid and, in most cases, generates a greater level of shared understanding between the members of the pair than existed previously.
Third, each pair presents their blended diagram to the group for discussion and constructive criticism. Because (a) all pairs present influence diagrams, (b) all group members understand the ‘shared visual language’ provided by the diagrams, and (c) the diagrams represent differing views of the same system-of-interest, these presentations tend to generate rich ‘focused dialogues’ (Newell 2012) that help the group to take an integrated approach. Depending on group size, this third step can take several hours.
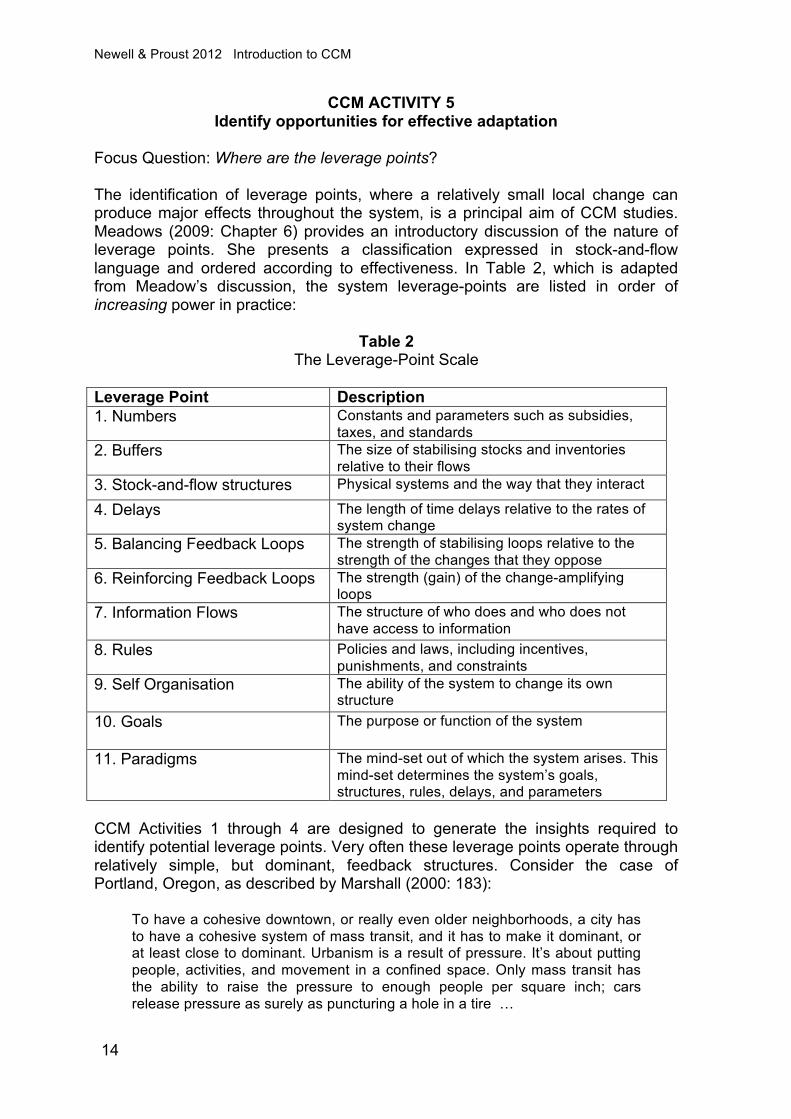
Focus Question: What drives system behaviour? While CCM Phase I activities can be completed to a useful level in a one-day workshop, CCM Phase II activities require a greater investment of time and expertise. In some cases it is necessary to involve experienced SD modellers. Activity 4 takes the group from systems thinking to system dynamics. This transition depends particularly on the use of ‘system archetypes’. System archetypes are relatively simple feedback structures, with characteristic ways of behaving, that are found in a wide range of contexts (Senge 1990; Meadows 2009). An example is shown in Figures 8 and 9.
Figure 8. The structure of the Limits to Growth system archetype. In this stock-and-flow map the rectangle represents the number of individuals in a population, the double lined-arrow represents the inflow and outflow processes that can change that number, and the curved arrows represent influence links. The phrases ‘carrying capacity’, ‘capacity margin’, and ‘characteristic time for change’ represent ancillary variables. In this structure there is a reinforcing feedback loop (labelled R) and a balancing feedback loop (labelled B).
Figure 9. The ‘S-shaped growth’ that is characteristic of the Limits to Growth archetype. The horizontal axis represents time and the vertical axis represents the number of individuals in the population. When population levels are low the reinforcing feedback loop dominates and population grows exponentially. As population approaches the carrying capacity of the region, however, the balancing loop becomes dominant and growth slows. In this idealised case, growth ceases as the population reaches the carrying capacity.
Newell & Proust 2012 Introduction to CCM
13
In Activity 4, the historical data, influence diagrams, and shared understanding developed in CCM Phase I are used to identify system archetypes that have the potential to provide the endogenous explanations of system behaviour that are the main aim of an SD study. Conceptual models, which express the group’s dynamic hypotheses concerning the way that their system-of-interest operates, are then constructed by elaborating one or more of the candidate archetypes. Depending on the needs of the group, these conceptual models can be presented as causal-loop diagrams, stock-and-flow maps, or low-order system-dynamics (LOSD) models. The process of identifying feedback structures that are relatively simple, but that are dynamically dominant, is a reductive process. In CCM we use a three-stage procedure, which we call ‘Feedback-Guided Analysis’, to ensure that this reduction preserves key feedback structures (Figure 10; and Proust et al 2012): 1. Overview Template. Disaggregate the overall human-environment (HE) complex into
major sub-systems, and identify the main feedback links that affect sub-system states. Develop an influence diagram that represents this cross-sector feedback structure in a way that captures the high-level focus of the particular CCM study. Use this diagram to guide subsequent discussions and detailed modelling.
2. Problem Space. Develop an intermediate-level version of the overview template that
projects it down into the domain of the type of management problems of concern to the group. Replace (a) variables that refer to major-sub-system states, with (b) state variables that capture the generic form of the target management problems.
3. System-of-Interest. Generate a low-level version of the problem-space template that is
tightly focused on a specific management problem in a particular system-of-interest. This step requires the identification of (a) specific state variables, and (b) the particular interactions that can take place between these variables.
Figure 10. Feedback-Guided Analysis. The upper box represents the production of a high-level overview template, the middle boxes represent the production of problem-space versions of the template, and the lower boxes represent the production of specific instances of one of the problem-space templates. Note that a single overview template can be projected into many problem spaces, and a problem-space template can be projected into the context of many specific systems-of-interest. An application of this modelling procedure is described by Proust et al (2012).
Newell & Proust 2012 Introduction to CCM
14
CCM ACTIVITY 5 Identify opportunities for effective adaptation
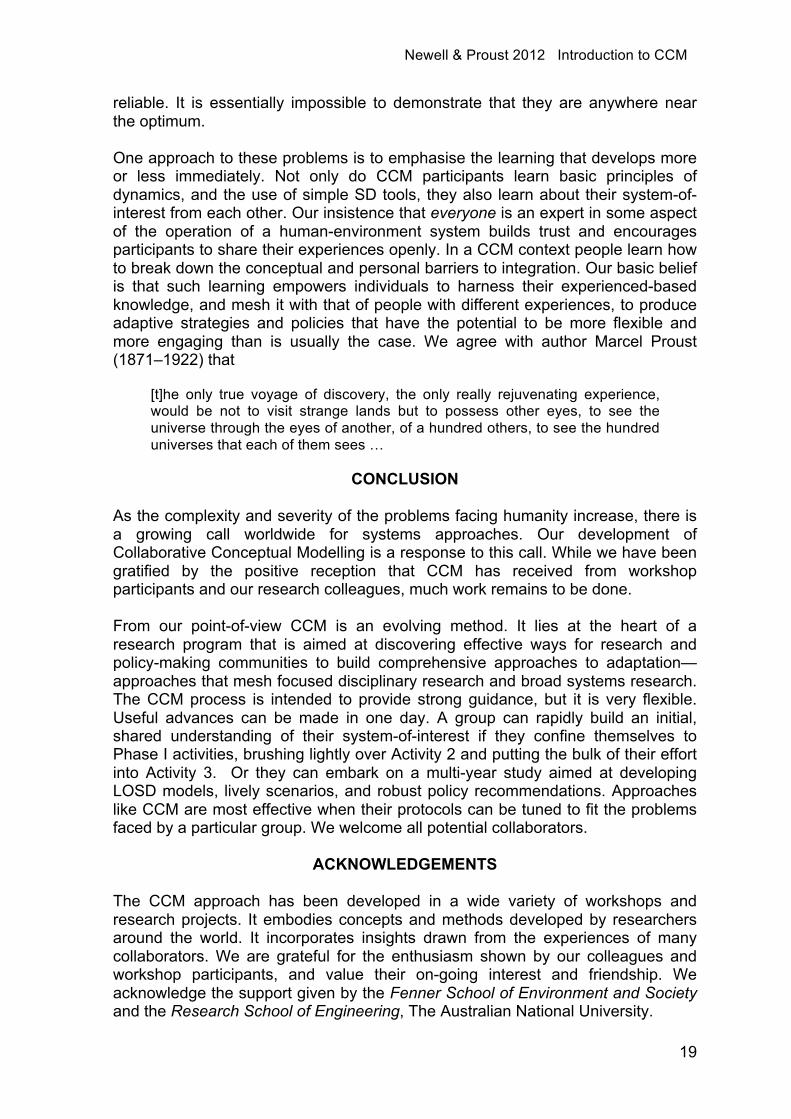
Focus Question: Where are the leverage points? The identification of leverage points, where a relatively small local change can produce major effects throughout the system, is a principal aim of CCM studies. Meadows (2009: Chapter 6) provides an introductory discussion of the nature of leverage points. She presents a classification expressed in stock-and-flow language and ordered according to effectiveness. In Table 2, which is adapted from Meadow’s discussion, the system leverage-points are listed in order of increasing power in practice:
Table 2 The Leverage-Point Scale
Leverage Point Description 1. Numbers Constants and parameters such as subsidies,
taxes, and standards 2. Buffers The size of stabilising stocks and inventories
relative to their flows 3. Stock-and-flow structures Physical systems and the way that they interact
4. Delays The length of time delays relative to the rates of system change
5. Balancing Feedback Loops The strength of stabilising loops relative to the strength of the changes that they oppose
6. Reinforcing Feedback Loops The strength (gain) of the change-amplifying loops
7. Information Flows
The structure of who does and who does not have access to information
8. Rules Policies and laws, including incentives, punishments, and constraints
9. Self Organisation
The ability of the system to change its own structure
10. Goals
The purpose or function of the system
11. Paradigms The mind-set out of which the system arises. This mind-set determines the system’s goals, structures, rules, delays, and parameters
CCM Activities 1 through 4 are designed to generate the insights required to identify potential leverage points. Very often these leverage points operate through relatively simple, but dominant, feedback structures. Consider the case of Portland, Oregon, as described by Marshall (2000: 183):
To have a cohesive downtown, or really even older neighborhoods, a city has to have a cohesive system of mass transit, and it has to make it dominant, or at least close to dominant. Urbanism is a result of pressure. It’s about putting people, activities, and movement in a confined space. Only mass transit has the ability to raise the pressure to enough people per square inch; cars release pressure as surely as puncturing a hole in a tire …
Newell & Proust 2012 Introduction to CCM
15
Portland increased its urban pressure by prohibiting, in the mid-1970s, the construction of more parking spaces. This was a master stroke, a strategy opposite that of most other places. Other cities perversely required the construction of parking spaces. If you built an office building, you were required to build an even larger parking box beside it to house the cars…. And even without laws, office builders would usually construct parking so their customers or workers would have an easy way of getting to and from their offices or stores. By prohibiting the construction of parking, Portland managed to reverse this dynamic. It was a pressure builder. Any new businesses or stores or homes would have to make do with the parking that was there. This pushed people onto the buses and eventually onto the light rail line. Of course, without a growth boundary businesses and stores might have just left downtown altogether. But with the growth boundary, it was not as easy to move outward, even though a significant chunk of open land remained within it. The boundary kept the pattern of development still relatively constrained.
The causal-loop diagram shown in Figure 11 represents a simple dynamic hypothesis concerning the behaviour of the Portland community. The structure shown is an example of the Success to the Successful system archetype (Senge 1990: 385). This archetype consists of opposing reinforcing feedback loops. Loops R1 and R2 act to reduce dependence on private motor vehicles and are opposed by Loop R3. This system is bi-stable. It can drive the community’s dependence on private vehicles either up or down. By electing to reduce the number of parking spaces, the city’s policy makers reduced the strength of Loop R3, relative to the strength of Loops R1 and R2, and so reduced the use of cars in the city centre. Of course, as Marshall points out, the existing public transport network was an essential factor in the equation. While the number of parking spaces appears to be an example of Meadow’s least-effective leverage point, in this case it is effective because it works through a powerful reinforcing-feedback structure.
Figure 11. Parking Space as Leverage. In this causal-loop diagram the blocks of text represent system variables and the arrows represent cause-effect links. The arrows have ‘polarities’ assigned. A plus sign (+) indicates that an increase/decrease in the magnitude of the variable at the tail of the arrow will cause the magnitude of the variable at the head of the arrow rise above/fall below the value that it otherwise would have had (all else being equal). Conversely, a minus sign (-) indicates that an increase/decrease in the magnitude of the variable at the tail of the arrow will cause the magnitude of the variable at the head of the arrow fall below/rise above the value that it otherwise would have had (Sterman 2000: Chapter 5).
Newell & Proust 2012 Introduction to CCM
16
CCM ACTIVITY 6 Use improved understanding of system behaviour
to develop ‘memories of the future’
Focus Question: Can we have new eyes? CCM Activity 6 is designed to help group members to explore and explain the policy implications of their new dynamic hypotheses. A powerful way to do this is to construct what we can call ‘systemic scenarios’. Scenarios are usually built following the approach developed by the Royal Dutch/Shell Group in the 1980s (Schwartz 1991; van der Heijden 1996; de Geus 1997). In a typical four-scenario study the process involves a number of well defined steps: Compile a list of critical variables; rank the variables according to their importance and uncertainty; plot the variables in the {importance, uncertainty} plane; select two variables (or clusters of variables) that are important but uncertain, and use them as the axes of a 2 x 2 matrix of scenarios; elaborate the scenarios and write narratives for each; develop management strategies, paying particular attention to opportunities, barriers, and critical success factors. The development of a systemic scenario follows these standard steps, but places more emphasis than usual on the dynamics of the group’s system-of-interest. Such an approach can help group members to develop ‘feedback eyes’. Feedback effects, such as those generated by the Policy Resistance and Fixes that Fail system archetypes, can undercut apparently sound polices (Sterman 2000; Meadows 2009). An ability to see such feedback structures, and so anticipate unwanted system effects, can reduce the chances that managers will be surprised. In CCM Activity 6 scenario development builds on the insights generated in the Phase I activities (Figure 12). The low-order stock-and-flow maps and models constructed in Activity 4 add to these initial insights and provide a way to take account of accumulation and feedback effects. Finally, the identification of potential leverage points, as undertaken in Activity 5, supports the development of effective management strategies. These analysis processes are time consuming and require a dedicated effort by a core group. But there is some flexibility. If time is limited it is possible to go straight from Phase I activities to Activity 6, bypassing Activities 4 and 5. If this shortcut is taken, however, it is likely that the group will end up with less insightful policy recommendations than they otherwise could have formulated. Scenario development helps management teams to glimpse possible alternative futures, so increasing their ability to recognise and avoid potential management pitfalls (de Geus 1997: 45). The phrase “memories of the future” was coined by neurobiologist David Ingvar (1985). It refers to peoples’ ability to imagine possible future outcomes of present-day actions, and then use memories of these imagined futures to increase their sensitivity to the critical variables. Provided that group members can base their imagined futures on sound dynamic hypotheses, they should be able to reduce policy surprise and so increase the robustness of their adaptive strategies.
Newell & Proust 2012 Introduction to CCM
17
Figure 12. The structure of CCM Activity 6 and its dependence on the information flowing from Activities 3, 4, and 5.
Newell & Proust 2012 Introduction to CCM
18
DISCUSSION The main aim of a CCM endeavour is not prediction but understanding. Anyone who would take a systems approach to policy design faces a ‘complexity dilemma’. On the one hand, it is not possible to understand the dynamics of a human-environment system by breaking it up and studying its parts one by one. On the other hand, any attempt to understand the entire system, taken as a whole, is bound to fail—the level of complexity and uncertainty is simply too great. Even if a fully detailed model could be built, its behaviour would be as difficult to understand as that of the real-world system. An escape from this dilemma requires a way to distil out the essential dynamics of a given situation or management challenge. That this is possible is demonstrated by the existence of system archetypes that have only two or three state variables but that have wide explanatory power (Senge 1990; Sterman 2000; Meadows 2009). It is consistent, also, with ecological observations that have led to the formulation of the ‘rule of hand’ (Walker et al 2006):
Although social-ecological systems are self-organized through interactions among large numbers of biotic and abiotic variables, the most important changes can be understood by analyzing a few, typically no more than five, key variables ... This is the ‘rule of hand.’ More complex models are not necessary to explain the key interesting patterns and, in fact, are likely to mask them. This is both because generally humans can only understand low-dimensional systems and because, empirically, it appears that only a few variables are ever dominant in observed system dynamics. The essential dynamics of all the case studies in this special issue involved fewer than five key variables at any one scale.
CCM is intended to support the development of simple models of this type. That is, its protocols are designed to help a group to identify low-order feedback structures that can dominate the behaviour of their system-of-interest. Each such structure represents a ‘dynamic hypothesis’ concerning the behaviour of the system. Simulation of low-order system-dynamics (LOSD) models provides a very effective way to (a) carry out sensitivity test on the underlying dynamic hypothesis, (b) explore the dynamics of the LOSD model, (c) produce a suite of model-based systemic scenarios, (d) explain the reasoning behind policy recommendations, and (e) support education in system dynamics. One of the challenges that must be met in any attempt to take a comprehensive approach to policy making, is the difficulty of demonstrating that the adopted methods work as intended. One problem is that the full spectrum of outcomes that flow from a single management action can take decades to develop (Figure 5). Another is that a collaborative effort will have a variety of impacts on the mind-sets of the collaborators, and the eventual effect on their behaviour can be slow to appear. This is particularly true when, as in the case of CCM, the aim is to mesh a range of mental models and observational data. Even if the participants in such an endeavour express satisfaction with their progress, and can demonstrate a significantly increased understanding and acceptance of each other’s point of view, it is difficult to know to what extent the resulting systemic policies are
Newell & Proust 2012 Introduction to CCM
19
reliable. It is essentially impossible to demonstrate that they are anywhere near the optimum. One approach to these problems is to emphasise the learning that develops more or less immediately. Not only do CCM participants learn basic principles of dynamics, and the use of simple SD tools, they also learn about their system-of-interest from each other. Our insistence that everyone is an expert in some aspect of the operation of a human-environment system builds trust and encourages participants to share their experiences openly. In a CCM context people learn how to break down the conceptual and personal barriers to integration. Our basic belief is that such learning empowers individuals to harness their experienced-based knowledge, and mesh it with that of people with different experiences, to produce adaptive strategies and policies that have the potential to be more flexible and more engaging than is usually the case. We agree with author Marcel Proust (1871–1922) that
[t]he only true voyage of discovery, the only really rejuvenating experience, would be not to visit strange lands but to possess other eyes, to see the universe through the eyes of another, of a hundred others, to see the hundred universes that each of them sees …
CONCLUSION
As the complexity and severity of the problems facing humanity increase, there is a growing call worldwide for systems approaches. Our development of Collaborative Conceptual Modelling is a response to this call. While we have been gratified by the positive reception that CCM has received from workshop participants and our research colleagues, much work remains to be done. From our point-of-view CCM is an evolving method. It lies at the heart of a research program that is aimed at discovering effective ways for research and policy-making communities to build comprehensive approaches to adaptation—approaches that mesh focused disciplinary research and broad systems research. The CCM process is intended to provide strong guidance, but it is very flexible. Useful advances can be made in one day. A group can rapidly build an initial, shared understanding of their system-of-interest if they confine themselves to Phase I activities, brushing lightly over Activity 2 and putting the bulk of their effort into Activity 3. Or they can embark on a multi-year study aimed at developing LOSD models, lively scenarios, and robust policy recommendations. Approaches like CCM are most effective when their protocols can be tuned to fit the problems faced by a particular group. We welcome all potential collaborators.
ACKNOWLEDGEMENTS The CCM approach has been developed in a wide variety of workshops and research projects. It embodies concepts and methods developed by researchers around the world. It incorporates insights drawn from the experiences of many collaborators. We are grateful for the enthusiasm shown by our colleagues and workshop participants, and value their on-going interest and friendship. We acknowledge the support given by the Fenner School of Environment and Society and the Research School of Engineering, The Australian National University.
Newell & Proust 2012 Introduction to CCM
20
REFERENCES
Axelrod, R., and Cohen, M.D., 1999, Harnessing Complexity: Organizational Implications of a Scientific Frontier (The Free Press: New York).
de Geus, A., 1997, The Living Company: Growth, Learning and Longevity in Business (Nicholas Brealey: London).
Ghaffarzadegan, N., Lyneis, J., and Richardson, G.P., 2011, How small system dynamics models can help the public policy process, System Dynamics Review, 27 (1), 22-44.
Ingvar, D.H., 1985, “Memory of the future”: an essay on the temporal organization of conscious awareness, Human Neurobiology, 4 (3), 127-136.
Lakoff, G., and Johnson, M., 1980, Metaphors We Live By (University of Chicago Press: Chicago).
Marshall, A., 2000, How Cities Work: Suburbs, Sprawl, and the Roads Not Taken (University of Texas Press: Austin).
Meadows, D., 2009, Thinking in Systems: A Primer (Earthscan: London).
Newell, B., 2012, Simple Models, Powerful Ideas: Towards effective integrative practice, Global Environmental Change, 22 (3), 776-783. DOI: 10.1016/j.gloenvcha.2012.03.006
Newell, B., Crumley, C.L., Hassan, N., Lambin, E.F., Pahl-Wostl. C., Underdal, A., and Wasson, R., 2005, A conceptual template for integrative human-environment research, Global Environmental Change, 15 (4), 299-307. DOI: 10.1016/j.gloenvcha.2005.06.003.
Newell, B., and Proust, K., 2009, I See How You Think: Using Influence Diagrams to Support Dialogue. ANU Centre for Dialogue. http://www.anu.edu.au/dialogue/2009/I%20See%20How%20You%20Think.pdf
Proust. K., 2004, Learning from the Past for Sustainability: Towards an Integrated Approach (PhD Thesis, The Australian National University, Canberra).
Proust, K., 2008, Salinity in Colonial Irrigation: British India and South-Eastern Australia, Australian Geographer, 39 (2), 131-147.
Proust, K., and Newell, B., 2006, Catchment & Community: Towards a management focused dynamical study of the ACT water system, Final Report, Actew Project WF-30038. http://www.water.anu.edu.au/pdf/publications/2006/Proust_Newell06.pdf
Proust, K., Newell, B., Brown, H., Capon, A., Browne, C., Burton, A., Dixon, J., Mu, L., Zarafu, M., 2012, Human Health and Climate Change: Leverage Points for Adaptation in Urban Environments, International Journal of Environmental Research and Public Health, 9 (6), 2134-2158.
Richardson, G.P., 2011, Reflections on the foundations of system dynamics, System Dynamics Review, 27 (3), 219-243.
Senge, P.M., 1990, The Fifth Discipline: The Art & Practice of The Learning Organization (Random House: Sydney).
Schwartz, P., 1991, The Art of the Long View: Planning for the Future in an Uncertain World (Currency: New York).
Sterman, J.D., 2000, Business Dynamics: Systems Thinking and Modeling for a Complex World (Irwin McGraw-Hill: Boston).
van der Heijden, K., 1996, Scenarios: The Art of Strategic Conversation (Wiley: Chichester).
Vennix, J.A.M., 1996, Group Model Building: Facilitation Team Learning Using System Dynamics (Wiley: Chichester).
Walker, B., and Salt, D., 2006, Resilience Thinking: Sustaining Ecosystems and People in a Changing World (Island Press: Washington).
Walker, B.H., Gunderson, L.H., Kinzig, A.P., Folke, C., Carpenter, S.R., and Schultz, L., 2006, A handful of heuristics and some propositions for understanding resilience in social-ecological systems, Ecology and Society 11 (1): 13.