TABLE OF CONTENTS Abstract Introduction Operation of Non-Contact AnalyzerUltrasound Propagation in Non-Contact Mode Application of Non-Contact Ultrasound Velocity-Density Characterization in Green and Sintered Ceramics and Powder Metals Estimation of Material Quality when Velocity orDensity cannot be Measured Defect Detection in Green and Sintered Ceramics and Powder Metals Surface Characterization Non-Contact Ultrasound Attenuation and Velocity Imaging Conclusions Who is Secondwave? References NDT.net - June 2000, Vol. 5No. 06 Introduction to Contact-Free Ultrosonic Characterization and Analysis of Consolidated Materials M.C. Bhardwaj I. Neeson G. Stead SecondWave Systems, 1020 E. Boal Avenue, Boalsburg, PA 16827 USA Corresponding Author Contact : Email: [email protected], Web: http://www.secondwavesystems.com Abstract Adhering to the objectives of non-destructive materials characterization, a contact-less --air-coupled -- method of ultrasound is highl y desirable. However, exorbitant acoustic impedance mis-match between the coupling airand the test media presents a natural impediment to NCU . This impedance mis -match c an be as high as seven orders of magni tude for some materials . Therefore, high frequency Non-Conta ct Ultrasound (NCU ) propagation in materials has been re garded as an impos sibi li ty. On t he ot her ha nd, low frequenc y ultrasound -- 25kHz to 100kHz -- can be propagated through materials i n non-conta ct mode. However, these frequencies are practically useless for the interrogation of most materials where the industry demands high resol ution and high detec tabili ty. Rece nt adva nces in high transduction high frequency piezoelectric transducers (200kHz to 5MHz) and an exc eptionally hig h dynamic range nanosec ond accuracy ultrasonic system have advanced the NCU practice to levels that rival conventional contact method. In this paper we provide an introduction to NCU and present examples of green and sintered ceramics and composi tes a nalysi s. Appli cations of NCU are considered t o be truly sig nifi cant forcost-effective manufacturing of h ig h reliabi li ty mate rials . Introduction It is now well-es tablished that if ultrasound c an be propagated in a gi ven medium than signi ficant information about t hat medium can be deciphered, Table I. [1][2][3] the inversi ty of compositi on and micros tructure of cera mi cs, powder meta ls, and composites, materials s uitable acoustics and techniques have been developed during the last 10 years for accurate non-destructive characterization of these materials .[4][5][6][7][8] U ltrasound method is nondestructive in na ture, but the mecha nism ofultrasound propagation in the t est materials invol ves the use of liquids such as, water, oil, gels , etc. S pecifically , these liquids are used between the tra nsducer and t he test material for effici ent ultrasound propagation. From a practical standp oint, li quid contact with some materials is either not desirable, orwould destroy green, porous, liqui d-sensiti ve, a nd c ontinuousl y formed materials. In orde r to circumvent this problem, it is imperative to eliminate transducer, or any other type of contact with the test materials . Achievement of NCU fi rst requires the generation of very high transduction transducers to o vercome the exorbitant acoustic impedance barrier between air and most materials. In troduct ion t o Con tact-Free Ultrosonic Char ac ter iz at ion an d Analysis of ... http: //www. ndt.n et /article/v05n 06 /bhardwaj/b hardwaj.htm 1 of 11 22/09/2009 21:40
AbstractIntroductionOperation of Non-Contact Analyzer Ultrasound Propagation in Non-Contact ModeApplication of Non-Contact Ultrasound
Velocity-Density Characterization in Green andSintered Ceramics and Powder Metals
Estimation of Material Quality when Velocity or Density cannot be MeasuredDefect Detection in Green and SinteredCeramics and Powder MetalsSurface CharacterizationNon-Contact Ultrasound Attenuation and VelocityImaging
ConclusionsWho is Secondwave?References
NDT.net - June 2000, Vol. 5 No. 06
Introduction to Contact-Free Ultrosonic Characterization and
Analysis of Consolidated Materials
M.C. Bhardwaj
I. NeesonG. Stead
SecondWave Systems, 1020 E. Boal Avenue, Boalsburg, PA 16827 USA
Adhering to the objectives of non-destructive materials
characterization, a contact-less --air-coupled -- method
of ultrasound is highly desirable. However, exorbitant
acoustic impedance mis-match between the coupling air
and the test media presents a natural impediment to
NCU. This impedance mis-match can be as high as
seven orders of magnitude for some materials.
Therefore, high frequency Non-Contact Ultrasound
(NCU) propagation in materials has been regarded as an
impossibility. On the other hand, low frequency
ultrasound -- 25kHz to 100kHz -- can be propagated through materials in non-contact mode. However,
these frequencies are practically useless for the interrogation of most materials where the industry
demands high resolution and high detectability. Recent advances in high transduction high frequency
piezoelectric transducers (200kHz to 5MHz) and an exceptionally high dynamic range nanosecond
accuracy ultrasonic system have advanced the NCU practice to levels that rival conventional contact
method. In this paper we provide an introduction to NCU and present examples of green and sintered
ceramics and composites analysis. Applications of NCU are considered to be truly significant for
cost-effective manufacturing of high reliability materials.
Introduction
It is now well-established that if ultrasound can be propagated in a given medium than significant
information about that medium can be deciphered, Table I. [1][2][3] the inversity of composition and
microstructure of ceramics, powder metals, and composites, materials suitable acoustics and techniques
have been developed during the last 10 years for accurate non-destructive characterization of thesematerials.[4][5][6][7][8] Ultrasound method is nondestructive in nature, but the mechanism of
ultrasound propagation in the test materials involves the use of liquids such as, water, oil, gels, etc.
Specifically, these liquids are used between the transducer and the test material for efficient ultrasound
propagation. From a practical standpoint, liquid contact with some materials is either not desirable, or
would destroy green, porous, liquid-sensitive, and continuously formed materials. In order to
circumvent this problem, it is imperative to eliminate transducer, or any other type of contact with the
test materials.
Achievement of NCU first requires the generation of very high transduction transducers to overcome
the exorbitant acoustic impedance barrier between air and most materials.
duction to Contact-Free Ultrosonic Characterization and Analysis of ... http://www.ndt.net/article/v05n06/bhardwaj/bhar
Fig 2: 3.0MHz non-contact transducers separated by
10mm ambient air. Bandwidth: 2.0MHz (75%)
Sensitivity: -64dB. SNR: 30dB.
MEASUREMET
CATEGORYMEASURED PARAMETERS APPLICATIOS
Time Domain
Times-of-flight and velocities of
longitudinal, shear, and surface
waves.
Density, thickness, defect detection,
elastic and mechanical properties,
interface analysis, anisotropy,
proximity & dimensional analysis,
robotics, remote sensing, etc.
Attenuation Domain
Fluctuations in reflected and
transmitted signals at a given
frequency and beam size
Defect characterization, surface and
internal microstructure, interface
analysis, etc.
Frequency Domain
Frequency-dependence of
ultrasound attenuation, or
ultrasonic spectroscopy
Microstructure, grain size, grain
boundary relationships, porosity,
surface characterization, phase
analysis, etc.
Image Domain
Time-of-flight, velocity, and
attenuation mapping as functions
of discrete point analysis by
raster C-scanning or by synthetic
aperture techniques.
Surface and internal imaging of
defects, microstructure, density,
velocity, mechanical properties, true
2-D and
3-D imaging.Table I: Ultrasonic Measurements and their Applications.
After 20 years of intense R&D, piezoelectric transducers between <100kHz to ~5MHz have been
successfully produced (international patents pending). Figures 1 and 2 show time, frequency,
sensitivity, and signal to noise ratio data for 200kHz and 3MHz non-contact transducers in ambient air.
The most significant aspect of this development is the very high sensitivity of our new transducers. For
example, a comparison of these transducers in air and conventional contact transducers in water (with
all other conditions remaining the same), shows that the sensitivity of the former is only 30dB below
the latter from 100kHz to 3MHz. This is not only significant from the standpoint of transduction in air,
but also for the applications of these transducers for NCU propagation in solids. By utilizing
conventional ultrasonic pulsers these and capacitance air-coupled transducers showed the feasibility for several industrial and bio-medical applications. [9][10][11]
Fig 1: 200kHz non-contact transducers separated by
100mm ambient air.Bandwidth: 100kHz (50%)
Sensitivity: -46dB. SNR: 46dB
However, in order to obtain non-contact ultrasound performance analogous to conventional liquid-
coupled ultrasound more than high transduction transducers are needed. For example, if we have an
ultrasonic excitation and amplification system that would provide 100dB extra gain (30dB to
duction to Contact-Free Ultrosonic Characterization and Analysis of ... http://www.ndt.net/article/v05n06/bhardwaj/bhar
compensate for contact-non-contact mismatch and 70dB to over come air-material acoustic impedance
mismatch), only then we can have a non-contact ultrasound performance similar to that of the
conventional contact mode.
In 1997 the non-contact transducer development was complemented by the creation of a dedicated
ultrasonic non-contact analyzer, the NCA 1000 (U.S. patent pending), Fig. 3. This system is based upon
the synthesis of a computer generated chirp with transducer characteristics and advanced signal
processing. Ultimately, the NCA 1000 provides >150dB dynamic range, a nano-second accuracy, and
high speeds for data acquisition. As will be seen in the subsequent sections, these features aresignificant for the execution of NCU analogous to the conventional contact or immersion mode of
testing.
Operation of Non-Contact Analyzer
After routine calibration for air velocity and times of flight in air column and from material surfaces,
the NCA 1000 determines the test material thickness and velocity simultaneously, Fig. 4. For
non-dispersive and low acoustic impedance materials, this system also determines their densities by
measuring the true attenuation in materials. In order to evaluate the surface and internal microstructure
of materials, the NCA 1000 provides a mechanism for ultrasonic spectroscopy, Fig. 5. Test materials
can also be imaged in non-contact mode by integrating this system with appropriate transducer
scanning system. Parameters measured and functions performed by NCA 1000 are shown in Table II,
relative to their significance in materials characterization.
Fig 3: Non-Contact
Analyzer NCA 1000
shown with transducersand test material (left)
Fig 4: NCA 1000
screen displaying the
velocity and thicknessof a test material
Fig 5: NCA 1000
screen ultrasonic
spectroscopy mode.
Ultrasound Propagation in Non-Contact Mode
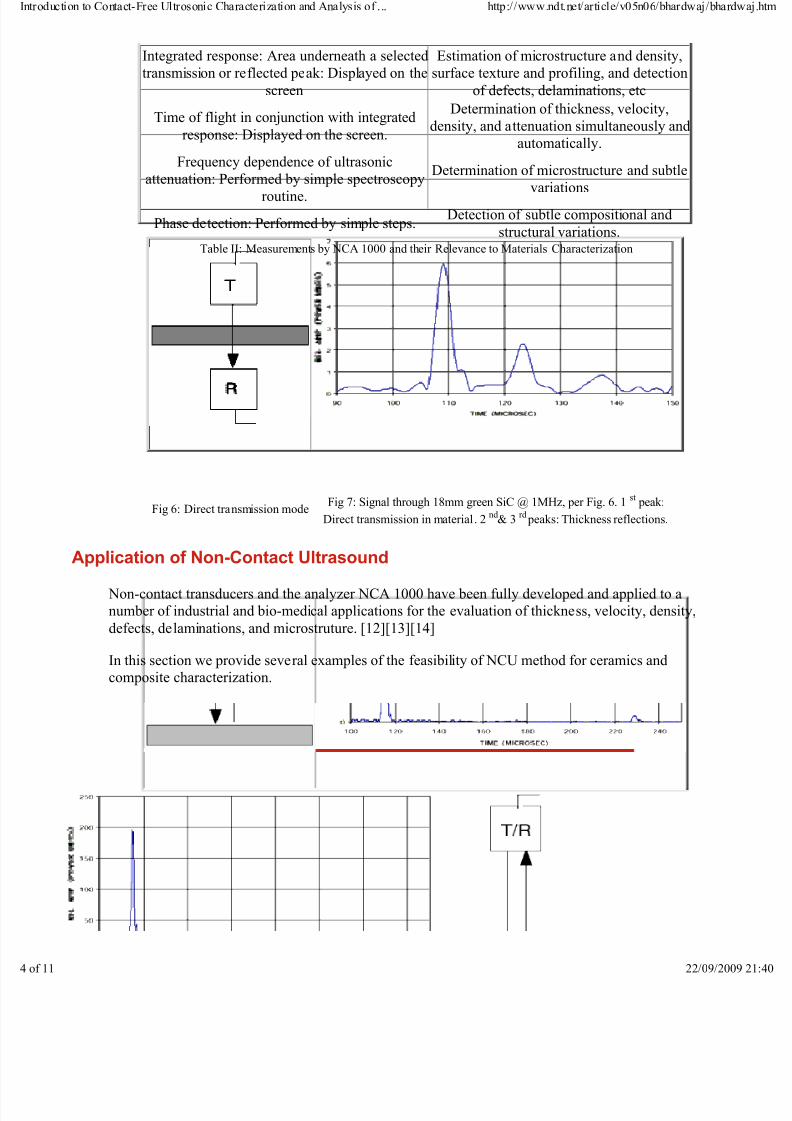
In most cases it is desirable to operate the NCA 1000 in direct transmission mode, Fig. 6 and 7. In this
mode a material can be characterized for thickness, velocity, density, defects, and microstructure.
When the material surface needs to be evaluated, this system can be operated in direct reflection mode,
Fig. 9 and 10. In this case reflectivity of ultrasound is directly related to the surface roughness or its
microstructure. When a test material is accessible only from one side, the NCA 1000 can also be
operated in T-R (Transmitter-Receiver) reflection mode, Fig. 11 and 12. It should be stated that
operation in this mode is arduous since the optimization of reflected signal from the test materialthickness is a sensitive function of the incident angles of two transducers, which (angles) tend to be
very small in magnitude.
MEASURED PARAMETERS/FUCTIOSRELATIOSHIP WITH MATERIAL
CHARACTERISTICS
Times of flight: Displayed on the screen.Determination of thickness and velocity
simultaneously and automatically.
duction to Contact-Free Ultrosonic Characterization and Analysis of ... http://www.ndt.net/article/v05n06/bhardwaj/bhar
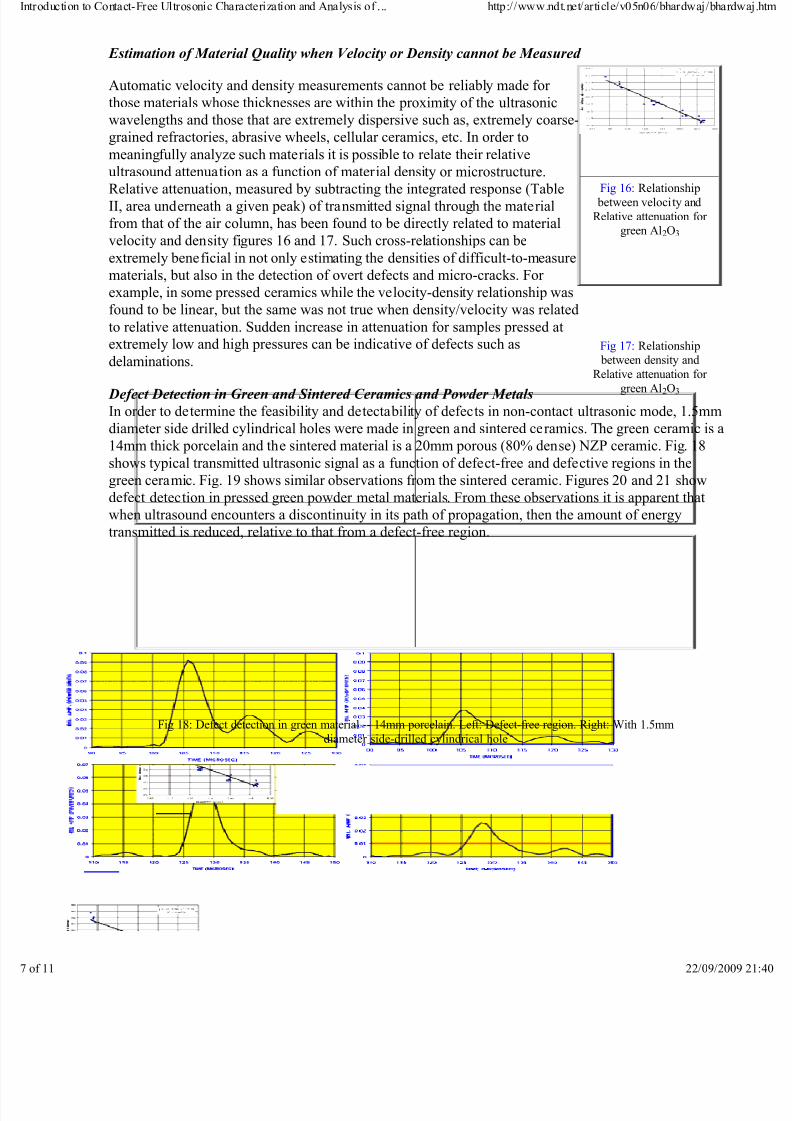
Estimation of Material Quality when Velocity or Density cannot be Measured
Automatic velocity and density measurements cannot be reliably made for
those materials whose thicknesses are within the proximity of the ultrasonic
wavelengths and those that are extremely dispersive such as, extremely coarse-
grained refractories, abrasive wheels, cellular ceramics, etc. In order to
meaningfully analyze such materials it is possible to relate their relative
ultrasound attenuation as a function of material density or microstructure.
Relative attenuation, measured by subtracting the integrated response (TableII, area underneath a given peak) of transmitted signal through the material
from that of the air column, has been found to be directly related to material
velocity and density figures 16 and 17. Such cross-relationships can be
extremely beneficial in not only estimating the densities of difficult-to-measure
materials, but also in the detection of overt defects and micro-cracks. For
example, in some pressed ceramics while the velocity-density relationship was
found to be linear, but the same was not true when density/velocity was related
to relative attenuation. Sudden increase in attenuation for samples pressed at
extremely low and high pressures can be indicative of defects such as
delaminations.
Defect Detection in Green and Sintered Ceramics and Powder Metals
In order to determine the feasibility and detectability of defects in non-contact ultrasonic mode, 1.5mm
diameter side drilled cylindrical holes were made in green and sintered ceramics. The green ceramic is a
14mm thick porcelain and the sintered material is a 20mm porous (80% dense) NZP ceramic. Fig. 18
shows typical transmitted ultrasonic signal as a function of defect-free and defective regions in the
green ceramic. Fig. 19 shows similar observations from the sintered ceramic. Figures 20 and 21 show
defect detection in pressed green powder metal materials. From these observations it is apparent that
when ultrasound encounters a discontinuity in its path of propagation, then the amount of energy
transmitted is reduced, relative to that from a defect-free region.
Fig 18: Defect detection in green material -- 14mm porcelain. Left: Defect-free region. Right: With 1.5mm
diameter side-drilled cylindrical hole
duction to Contact-Free Ultrosonic Characterization and Analysis of ... http://www.ndt.net/article/v05n06/bhardwaj/bhar
Fig 19: Defect detection in sintered material - 20% porous NZP. Left: Defect-free region. Right: With 1.5mm
diameter side-drilled cylindrical hole
Fig 20: Defect detection in green metal powder compacts - 10mm copper powder. Left: Defect-free region. Right:
Defective region (defect size unknown)
Fig 21: Defect detection in green tungsten-molybdenum x-ray tube target - 20mm thick. Left: Defect-free region.
Right: Region with 1.6mm side-drilled cylindrical hole
Surface Characterization
When ultrasound is reflected from the surface of a material, Fig. 8, its strength can be indicative of
surface density, inter-granular relationships, roughness, etc. The reflectivity of ultrasound at a given
frequency varies as a function of scattering. Relatively speaking, the higher the scatter (coarse-grainedsurfaces), the lower will be the reflectivity. NCA 1000 measures this signal strength in terms of
integrated response of the reflected peak, Table II. In order to exhibit the sensitivity of non-contact
ultrasound for surface characterization several SiC abrasive disks, varying in particle size, were used as
surface reflectors. By using a 2MHz and 12.5mm active area diameter non-contact transducer placed
10mm away from the reflecting surface, the integrated response from SiC disk surfaces was measured.
A similar measurement from the polished surface of carbon steel was assumed as a reference. Fig. 22
shows reflectivity of ultrasound from SiC surfaces as a function of polished steel surface reference.
Fig 22: Reflectivity of 2MHz ultrasound from SiC surfaces varying
in particle size
duction to Contact-Free Ultrosonic Characterization and Analysis of ... http://www.ndt.net/article/v05n06/bhardwaj/bhar
Non-contact ultrasound is a new method, which has been the dream of materials and ultrasound
scientists and engineers. In this paper we have provided an introduction to high frequency non-contact
ultrasound. The analytical functions of NCA 1000 provide thickness, velocity, time of flight,
attenuation, integrated response, and phase analysis of any medium through which ultrasound can be
propagated. that sense our presentation rivals not only conventional liquid-coupled ultrasound, but also
other wave based characterizing methods. Non-contact ultrasound presents an affirmative alternative to
hazardous and expensive X-ray, NMR, and Laser methods for materials characterization.
In this paper we have also given several examples of green and sintered ceramics and powder metalcharacterization for velocity, density, surface texture, and imaging. For these applications our
transducers and systems have been fully integrated in off-line and on-line applications in manufacturing
and laboratory environments. We also believe that in the hands of materials manufacturing and
developing experts this development will find numerous uses of value to our increasingly complex
world.
Who is Secondwave?
SecondWave is a new company devoted to the cause of materials processing, quality, and reliability
by utilizing novel O-COTACT ULTRASOUD. We provide analytical systems, transducers,
accessories, technical services, and dissemination of know-how in non-destructive evaluation,non-invasive, and sensing applications in materials and bio-medical industries. Ultrasonic
transducers and the CA 1000 system are now fully developed products and commercially available.
SecondWave is owned by Ultran Laboratories, Inc. and V Instruments, Ltd. Ultran specializes in
transducers, materials know how, and characterization; VI in instrumentation, systems, and signal
processing. SecondWave is the recipient of more 50 years of combined unparalleled experience of
Ultran and VI. We convert transducers and systems into applications-oriented solutions for our
customers. This approach allows Ultran and VI to concentrate on R&D and manufacturing. We
encourage you to contact us with your specific questions.
References
A. Vary, editor in "Materials Analysis by Ultrasonics," Noyes Data Corporation, New Jersey (1987).1.
A. Vary and J. Snyder, editors in "Nondestructive Testing of High-Performance Ceramics," Proceedings
of a conference, Am.Cer.Soc., Westerville, OH (1987).
2.
C.H. Schilling and J.N. Gray, "Nondestructive Evaluation of Ceramics," Proceedings Am.Cer.Soc., V
89 (1998).
3.
Bhardwaj, M.C., "High-Resolution Ultrasonic Nondestructive Characterization," Cer. Bull., v. 69, n. 9,
(1990).
4.
Bhardwaj, M.C. and Bhalla, A., "Ultrasonic Characterization of Ceramic Superconductors," J.Mat. Sci.
Lett., v. 10 (1991).
5.
Bhardwaj, M.C., "Evolution, Practical Concepts and Examples of Ultrasonic NDC," Ceramic
Monographs, Supplements to Interceram 41 (1992) [7/8] #4.5 and 42 (1993) [1] #4.5 -Handbook of
Ceramics, Verlag Schmidt GmbH, Frieburg, Germany
6.
Kulkarni, N., Moudgil, B. and Bhardwaj, M., "Ultrasonic Characterization of Green and Sintered
Ceramics: I, Time Domain," Am. Cer. Soc., Cer. Bull, Vol. 73, No. 6, (1994).
7.
Kulkarni, N., Moudgil, B. and Bhardwaj,M., "Ultrasonic Characterization of Green and Sintered
Ceramics: II, Frequency Domain," Am. Cer. Soc., Cer. Bull, Vol. 73, No. 7, (1994).
8.
Schindel, D.W., Hutchins, D.A., Zou, L., and Sayer, M., "The Design and Characterization of