23
Introduction to Data Analytics School on Scientific Data Analytics and Visualization Roberta Turra, Cineca 8 June 2015
Introduction to Data Analytics
School on Scientific Data Analytics and Visualization
Roberta Turra, Cineca
8 June 2015
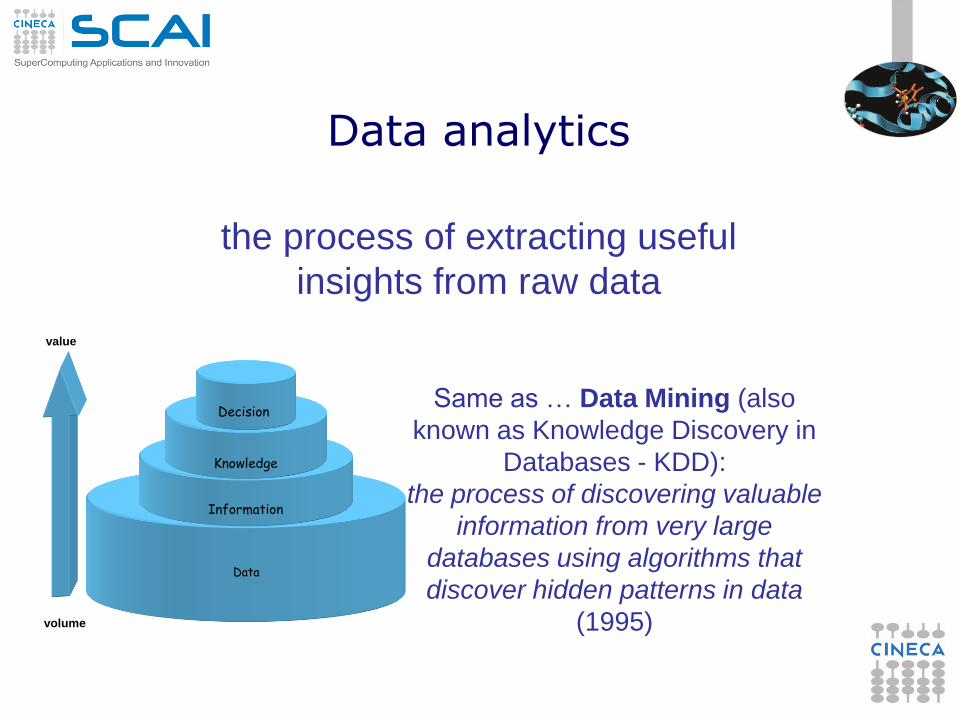
Data analytics
the process of extracting useful
insights from raw data
volume
value
Data
Information
Knowledge
Decision
Same as … Data Mining (also
known as Knowledge Discovery in
Databases - KDD):
the process of discovering valuable
information from very large
databases using algorithms that
discover hidden patterns in data
(1995)
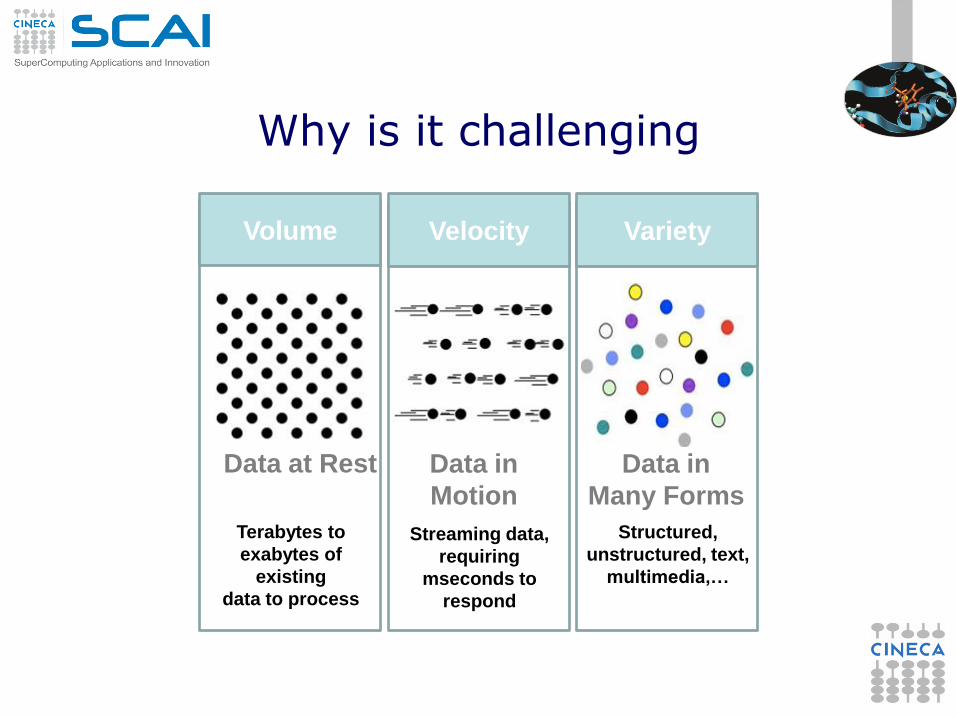
Why is it challenging
Volume Velocity Variety
Data at Rest
Terabytes to
exabytes of
existing
data to process
Data in
Motion
Streaming data,
requiring
mseconds to
respond
Data in
Many Forms
Structured,
unstructured, text,
multimedia,…

Going back to the definition …
the process of extracting valuable information
from raw data using algorithms that discover
hidden patterns
It’s an explorative approach or data driven approach
in contrast with “traditional” data analysis (statistics) that could also
be hypothesis driven

Topics
Data analytics
data
process
pre-processing
algorithms / techniques
applications
Data
The number and rate of data produced
in any particular discipline now exceed
our ability to effectively treat and
analyse them
Sources: digital instruments
high resolution cameras
medical scanners
simulations
transactional data
social media
…
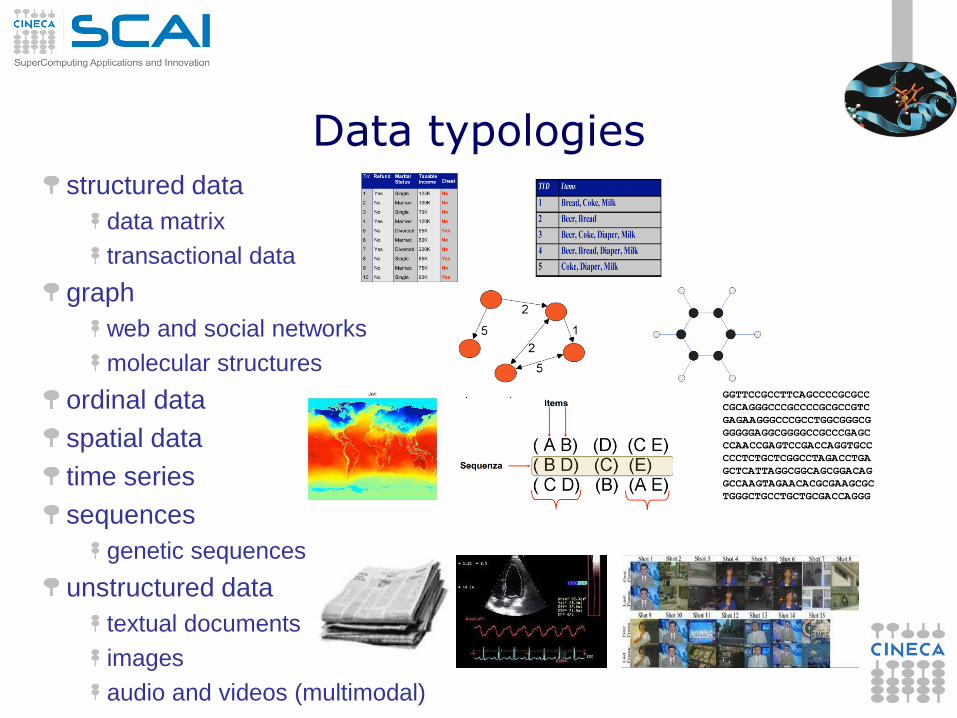
Data typologies
structured data
data matrix
transactional data
graph
web and social networks
molecular structures
ordinal data
spatial data
time series
sequences
genetic sequences
unstructured data
textual documents
images
audio and videos (multimodal)
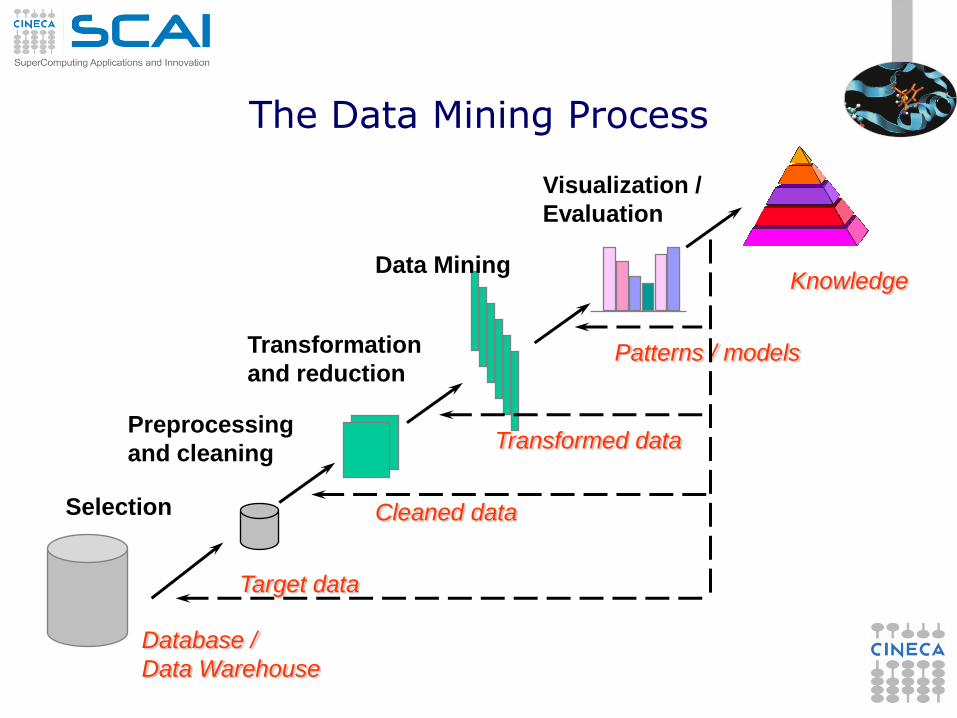
The Data Mining Process
Database /
Data Warehouse
Target data
Selection
Transformed data
Transformation
and reduction
Cleaned data
Preprocessing
and cleaning
Patterns / models
Data Mining Knowledge
Visualization /
Evaluation
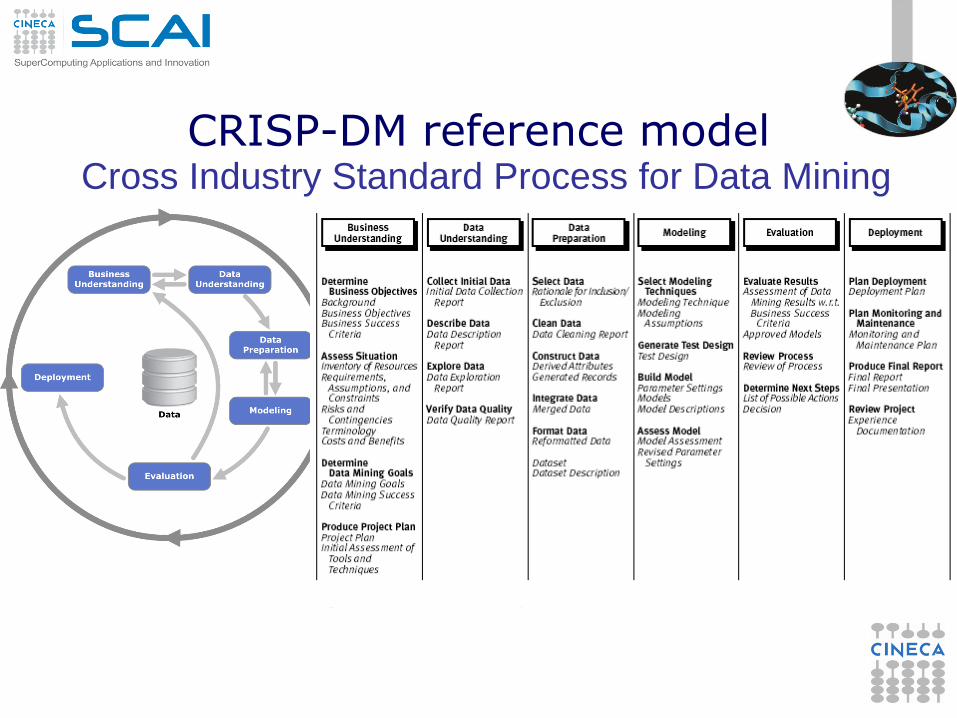
CRISP-DM reference model Cross Industry Standard Process for Data Mining

Is it still the reference model? (1)
New challenges The CRISP model reflects a data management perspective
where all relevant information can be stored and cleaned
before any further manipulation. This assumption might be
easily violated in all those cases where the data flow is too
massive to allow an exhaustive storage
(filtering/compressing data on the fly to allow that would
require some awareness of the analyses expected afterward)
or when there are timeliness constraints.
The CRISP model suggests a flat approach. Mastering the
data variety and complexity requires several levels of
analysis, combining the results of various processing tools to
obtain complex patterns or models, to form hierarchical
dependencies among the steps performed.
Is it still the reference model? (2)
New challenges In complex applications, the design of an analytical process
is actually a multi-disciplinary effort that involves actors with
different backgrounds.
The computational complexity requires new scalable
algorithms and the distribution of workloads on clusters (eg
MapReduce) or on cloud.
Big Data Analytics often involve the use of personal data,
ranging from medical records to location information, activity
records on social networks, web navigation and searching
history, etc. All this calls for mechanism that ensure that the
information flow employed in the analyses does not harm the
privacy of individuals.
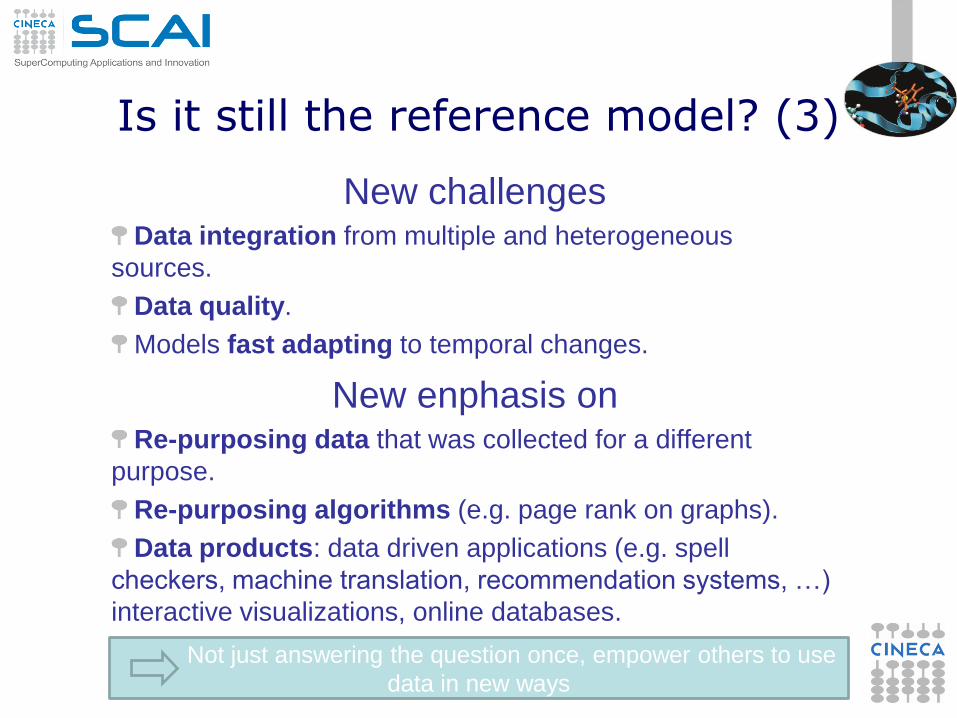
Is it still the reference model? (3)
New challenges Data integration from multiple and heterogeneous
sources.
Data quality.
Models fast adapting to temporal changes.
New enphasis on Re-purposing data that was collected for a different
purpose.
Re-purposing algorithms (e.g. page rank on graphs).
Data products: data driven applications (e.g. spell
checkers, machine translation, recommendation systems, …)
interactive visualizations, online databases.
Not just answering the question once, empower others to use
data in new ways
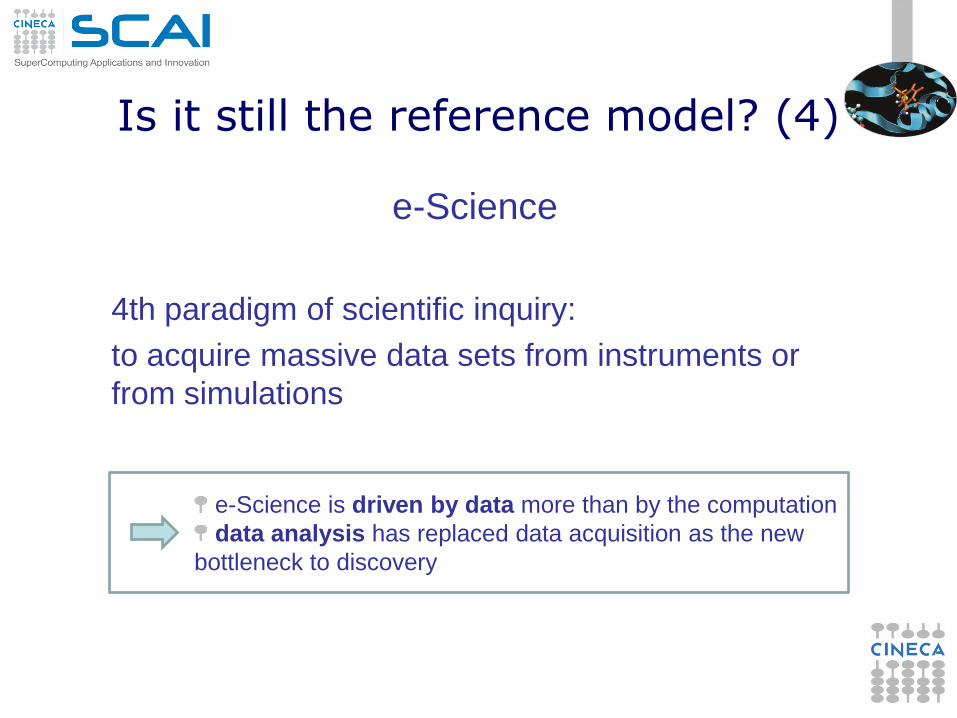
Is it still the reference model? (4)
e-Science
4th paradigm of scientific inquiry:
to acquire massive data sets from instruments or
from simulations
e-Science is driven by data more than by the computation
data analysis has replaced data acquisition as the new
bottleneck to discovery
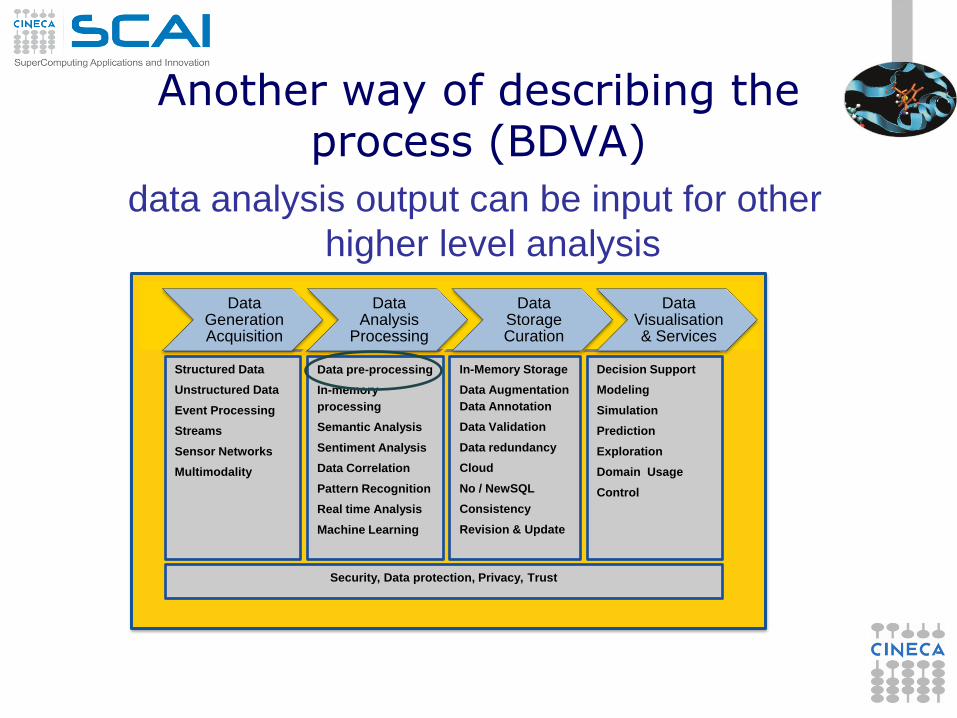
Data
Generation
Acquisition
Data
Analysis
Processing
Data
Storage
Curation
Data
Visualisation
Usage & Services
Structured Data
Unstructured Data
Event Processing
Streams
Sensor Networks
Multimodality
Data pre-processing
In-memory
processing
Semantic Analysis
Sentiment Analysis
Data Correlation
Pattern Recognition
Real time Analysis
Machine Learning
In-Memory Storage
Data Augmentation
Data Annotation
Data Validation
Data redundancy
Cloud
No / NewSQL
Consistency
Revision & Update
Decision Support
Modeling
Simulation
Prediction
Exploration
Domain Usage
Control
Security, Data protection, Privacy, Trust
Data Generation Acquisition
Data Analysis
Processing
Data Storage Curation
Data Visualisation & Services
Another way of describing the process (BDVA)
data analysis output can be input for other
higher level analysis
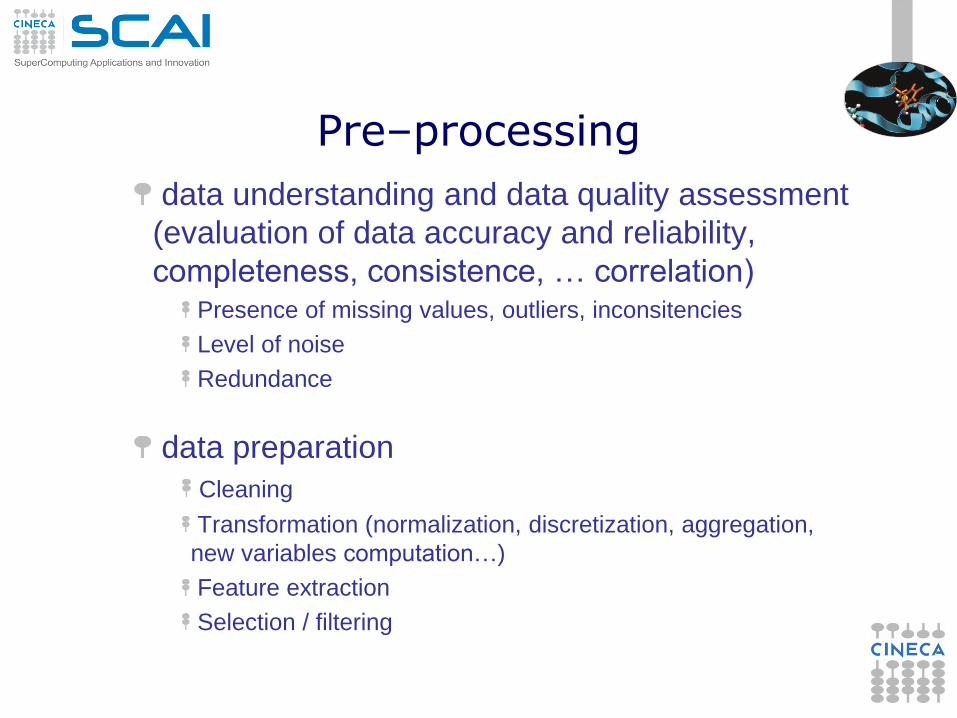
Pre–processing
data understanding and data quality assessment
(evaluation of data accuracy and reliability,
completeness, consistence, … correlation) Presence of missing values, outliers, inconsitencies
Level of noise
Redundance
data preparation
Cleaning
Transformation (normalization, discretization, aggregation,
new variables computation…)
Feature extraction
Selection / filtering

Pre–processing
Why is it useful - a few examples L’Equité: high peak of 96 years old insured
missing birth dates had been codified 1/1/1900
Trento University: a high number of students with very low
grades in the high school diplomas
grades in the high school diplomas have undergone a scale
change (from 60 as a maximum to 100)
Local Health Service: high consumpion of cardiovascular
drugs in diabetics
the quantity of active ingredient for cardiovascular drugs was in
milligrams (instead of grams)
Eurostat: visual patterns of outliers
the Country was a key variable in international trade outliers
identification
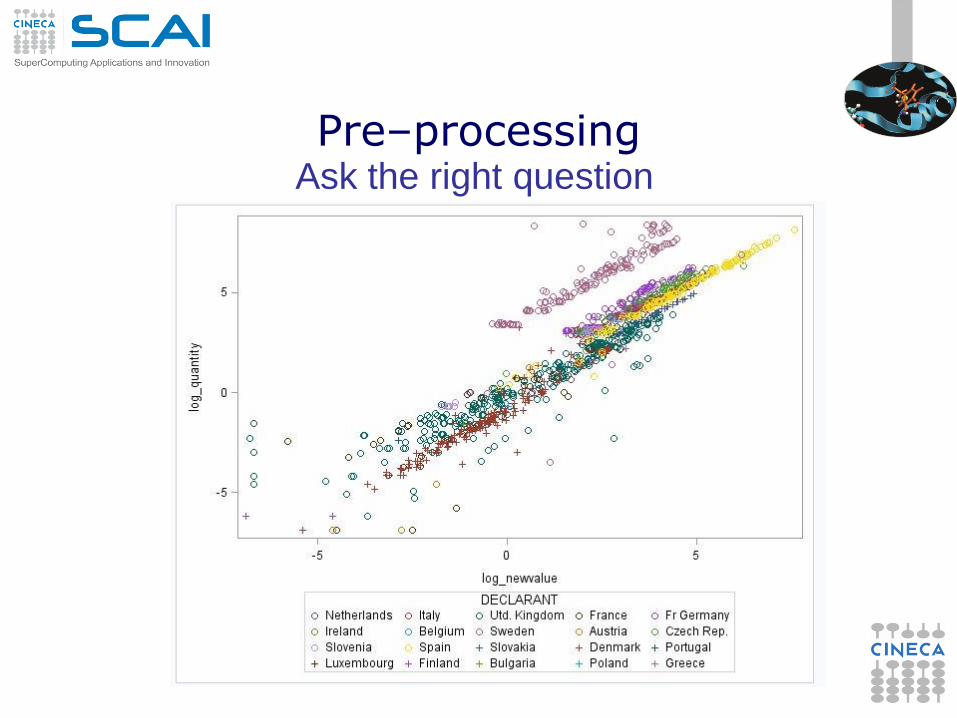
Pre–processing Ask the right question
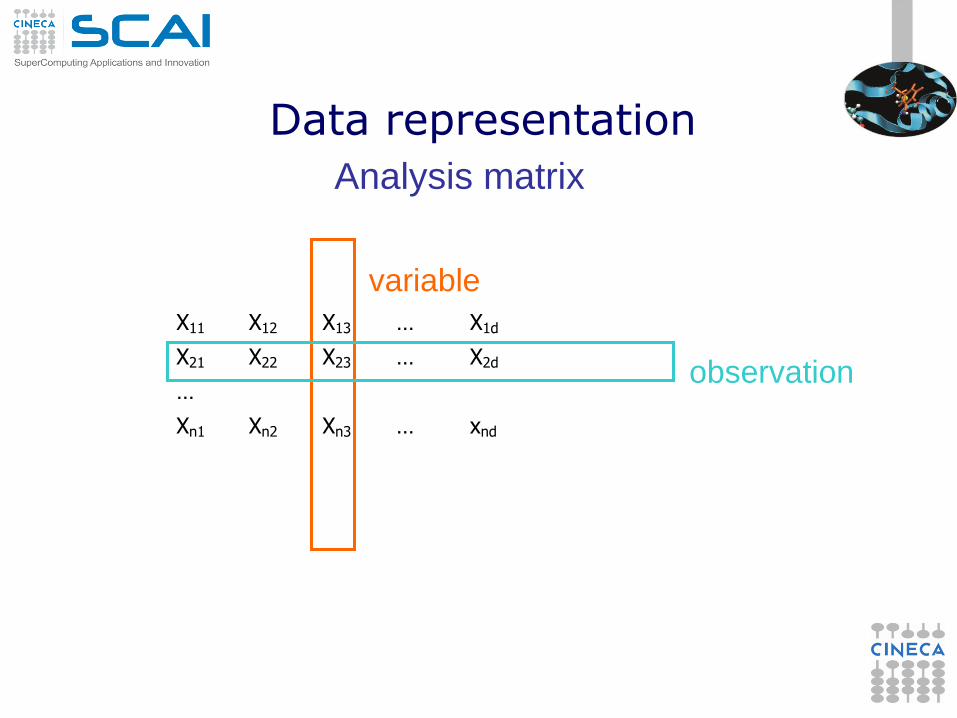
X11 X12 X13 … X1d
X21 X22 X23 … X2d
…
Xn1 Xn2 Xn3 … xnd
variable
observation
Data representation
Analysis matrix
19
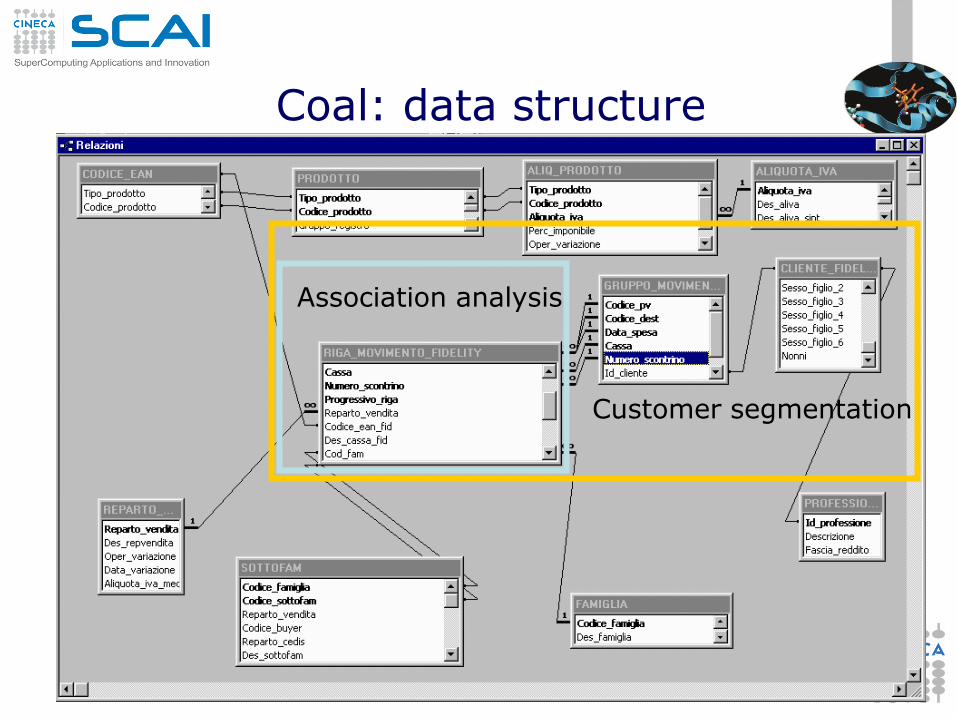
Coal: data structure
Association analysis
Customer segmentation

“active”
variables
“descriptive”
variables
Coal: customer segmentation matrix variables describing the buyer behavior:
items list (only the characterizing, distinguishing items)
number of receipts
average number of items per receipt
average expense
percentage of items having a promotion
socio-demographic variables:
genre
age
job
marital status
number of sons
number of children
cats
dogs

Presenza di indebito utilizzo
Importo totale del credito compensato Importo massimo del credito utilizzato
Stato del modello
Regione
Regione
Importo totale del credito compensato
Tasks and techniques
descriptive
clustering k-means
relational analysis
Self Organizing Maps
…
association rules
sequential patterns
graph and network analysis
…
B
40 A
30
predictive
classification (machine learning) Naive Bayes
Decision Trees
Neural Networks
KNN
Rocchio
Support Vectors Machine
…
regression
Unsupervised learning training samples have no class information
guess classes or clusters in the data
Supervised learning use training samples with known classes
to classify new data
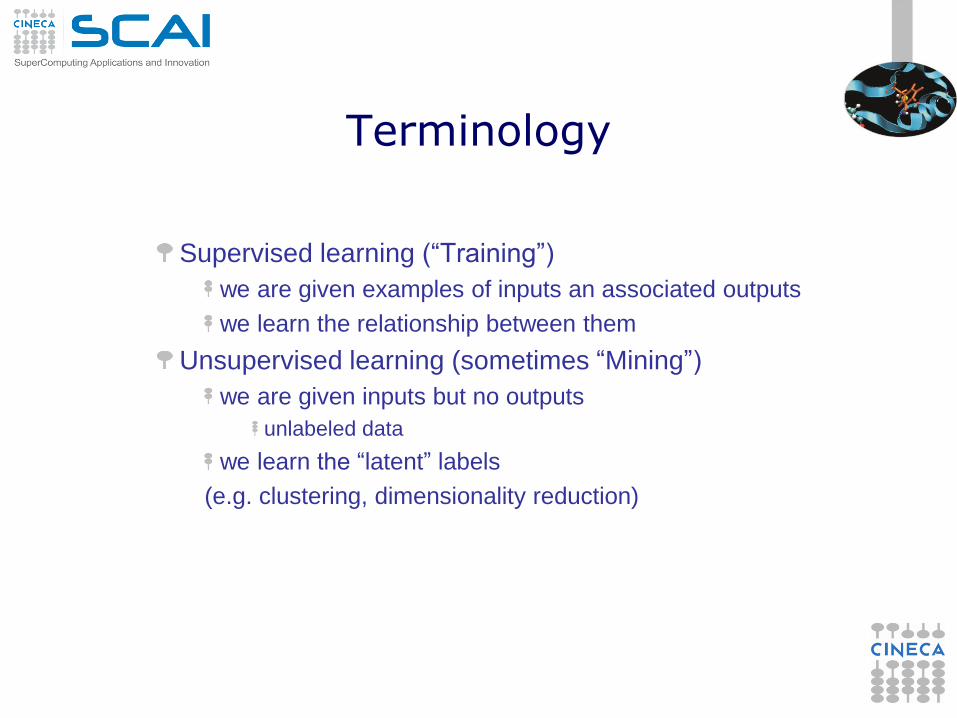
Terminology
Supervised learning (“Training”)
we are given examples of inputs an associated outputs
we learn the relationship between them
Unsupervised learning (sometimes “Mining”)
we are given inputs but no outputs
unlabeled data
we learn the “latent” labels
(e.g. clustering, dimensionality reduction)
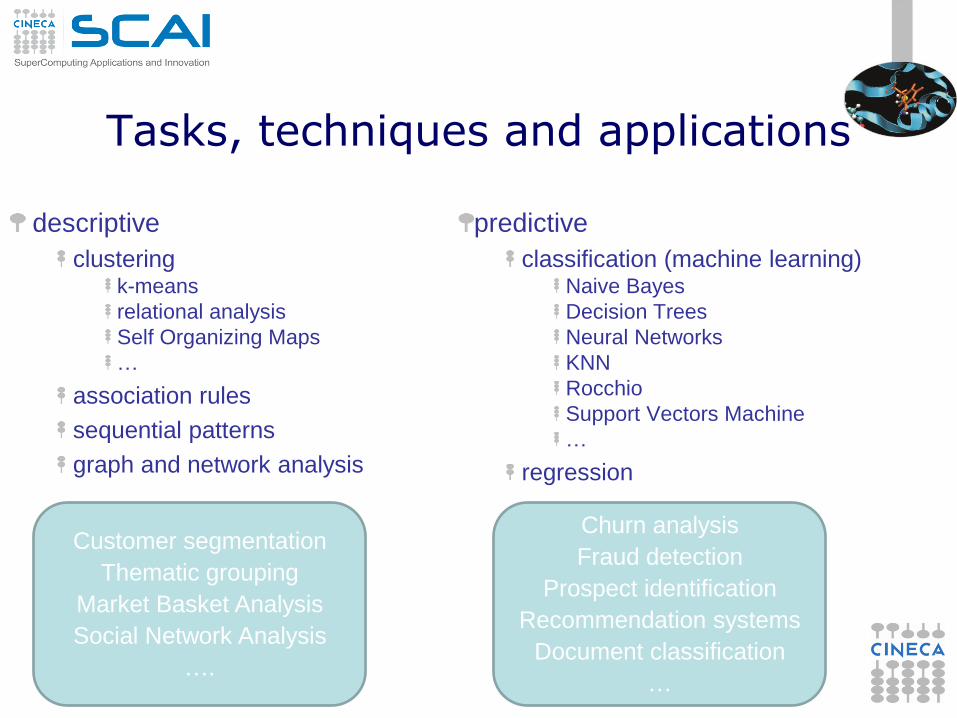
Tasks, techniques and applications
descriptive
clustering k-means
relational analysis
Self Organizing Maps
…
association rules
sequential patterns
graph and network analysis
…
predictive
classification (machine learning) Naive Bayes
Decision Trees
Neural Networks
KNN
Rocchio
Support Vectors Machine
…
regression
Customer segmentation
Thematic grouping
Market Basket Analysis
Social Network Analysis
….
Churn analysis
Fraud detection
Prospect identification
Recommendation systems
Document classification
…


