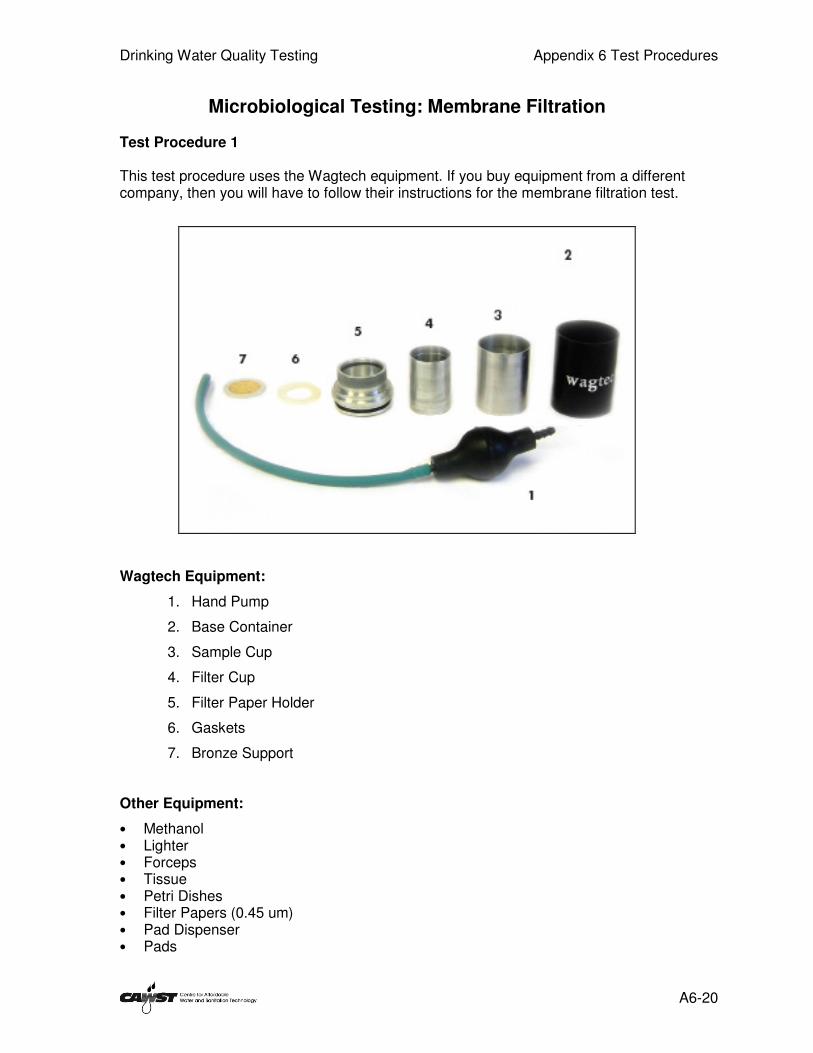
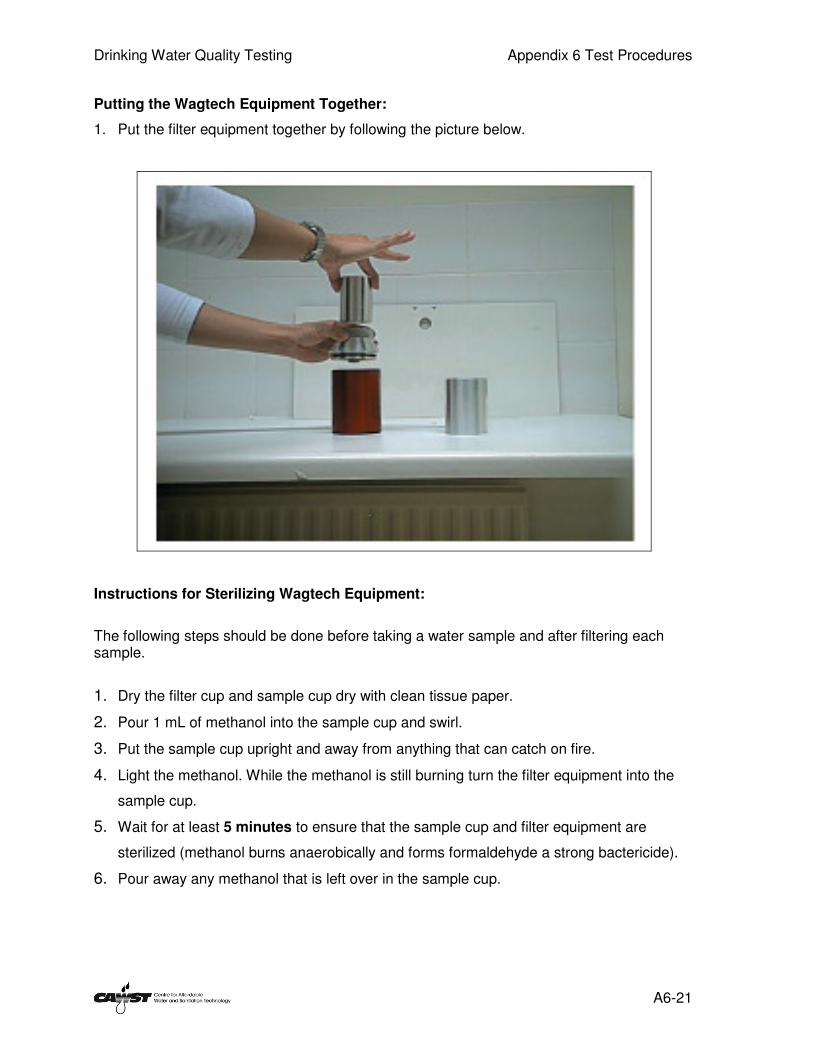
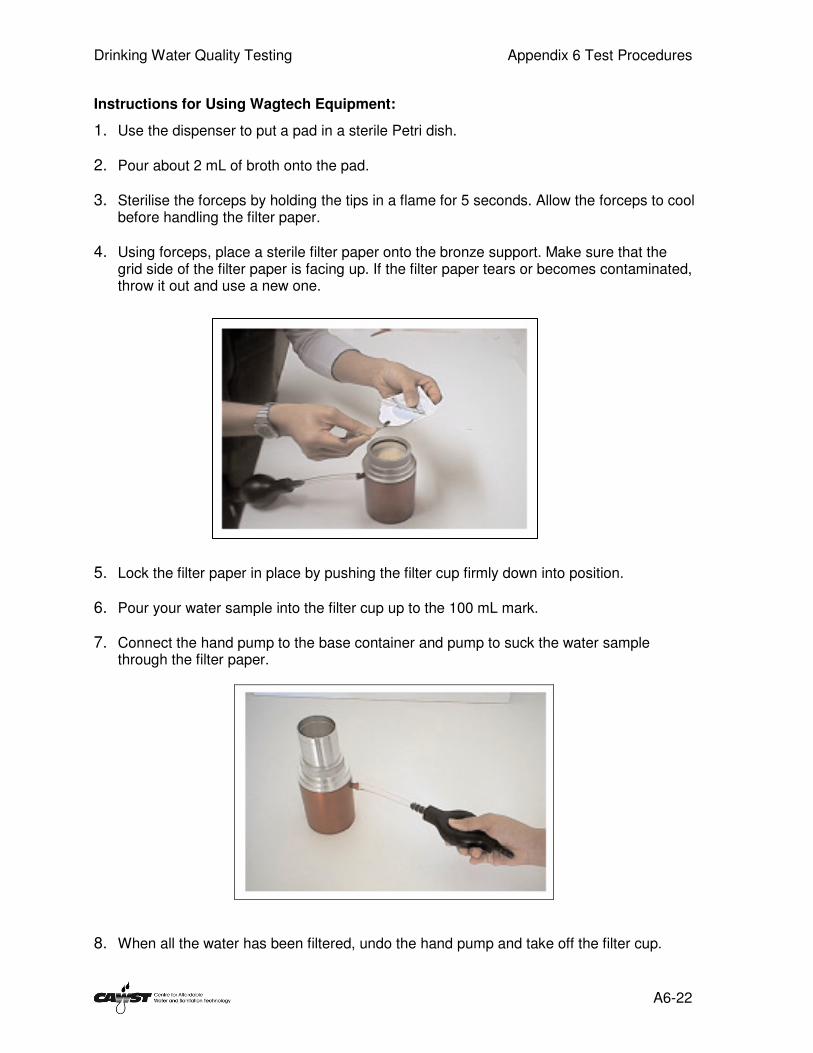
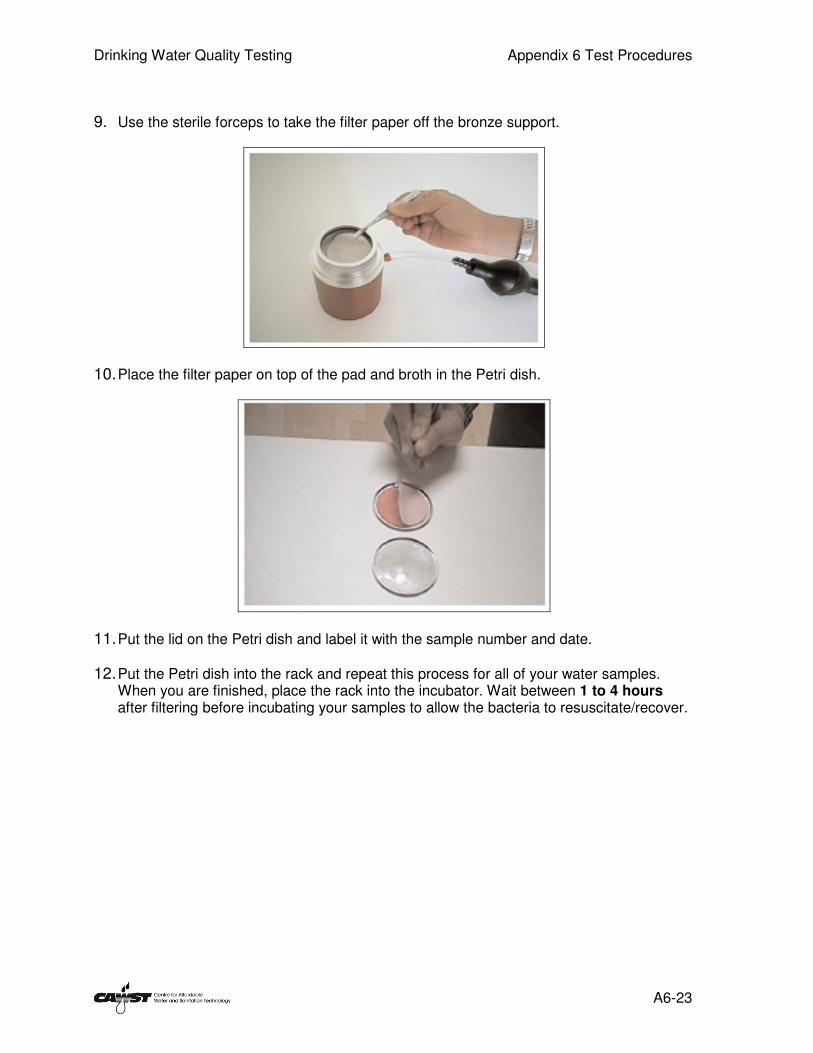
INTRODUCTION TO DRINKING WATER QUALITY TESTING _____________________________________ A CAWST TRAINING MANUAL A CAWST TRAINING MANUAL A CAWST TRAINING MANUAL A CAWST TRAINING MANUAL June June June June 2009 Edition 2009 Edition 2009 Edition 2009 Edition
Transcript
INTRODUCTION TO
DRINKING WATER QUALITY TESTING
_____________________________________
A CAWST TRAINING MANUALA CAWST TRAINING MANUALA CAWST TRAINING MANUALA CAWST TRAINING MANUAL
CAWST is a Canadian non-proft organization focused on the principle that clean water changes lives. Safe water and basic sanitation are fundamentals necessary to empower the world’s poorest people and break the cycle of poverty. CAWST believes that the place to start is to teach people the skills they need to have safe water in their homes. CAWST transfers knowledge and skills to organizations and individuals in developing countries through education, training and consulting services. This ever expanding network can motivate individual households to take action to meet their own water and sanitation needs. One of CAWST’s core strategies is to make knowledge about water common knowledge. This is achieved, in part, by developing and freely distributing education materials with the intent of increasing its availability to those who need it most. This document is open content and licensed under the Creative Commons Attribution Works 3.0 Unported License. To view a copy of this license, visit http://creativecommons.org/licenses/by/3.0/ or send a letter to Creative Commons, 171 Second Street, Suite 300, San Francisco, California 94105, USA. You are free to: • Share — to copy, distribute and transmit this document • Remix — to adapt this document. We would appreciate receiving a copy of any
changes that you’ve made to improve this document. Under the following conditions: • Attribution. You must give CAWST credit for this document (but not in any way
that suggests that CAWST endorses you or your use of this document). CAWST and its directors, employees, contractors, and volunteers do not assume any responsibility for and make no warranty with respect to the results that may be obtained from the use of the information provided.
Drinking Water Quality Testing Table of Contents
i
Table of Contents Acronyms
Glossary Section 1 Introduction of Drinking Water Quality Testing
1.1 Drinking Water Quality 1.2 Community and Household Water Treatment 1.3 Need for Drinking Water Quality Testing 1.4 Drinking Water Quality Guidelines and Standards 1.5 Drinking Water Quality Testing Options 1.6 Lessons Learned 1.7 Summary of Key Points 1.8 References
Section 2 Planning for Water Quality Testing
2.1 The Planning Process 2.2 Summary of Key Points
Section 3 Water Sampling and Quality Control
3.1 Determining the Sample Size 3.2 Choosing a Sample Method 3.3 How to Collect Water Samples 3.4 How to Transport Water Samples 3.5 How to Dilute a Water Sample 3.6 Ensuring Quality Control 3.7 Checklist for Field Work 3.8 Health and Safety 3.9 Summary of Key Points
3.10 References
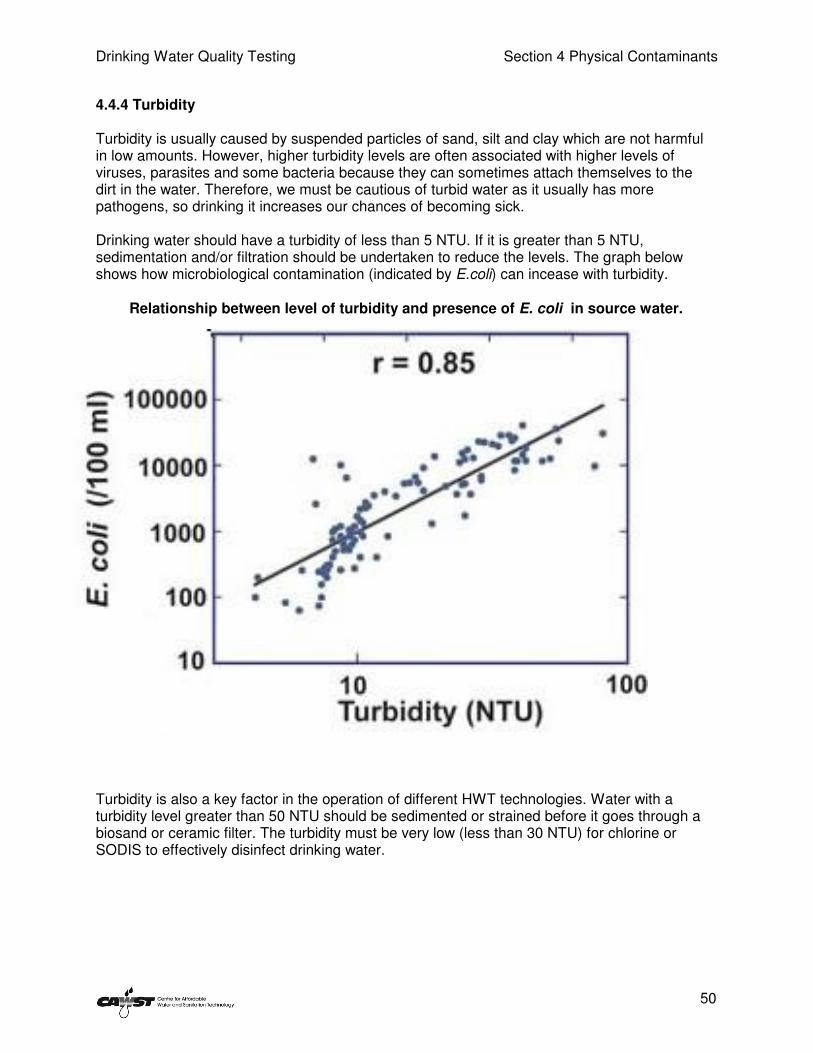
Section 4 Testing for Physical Contaminants 4.1 WHO Guidelines for Physical Parameters 4.2 Potential Health Effects 4.3 Test Methods 4.4 Interpreting Test Results 4.5 Summary of Key Points 4.6 References
Section 5 Testing for Chemical Contaminants
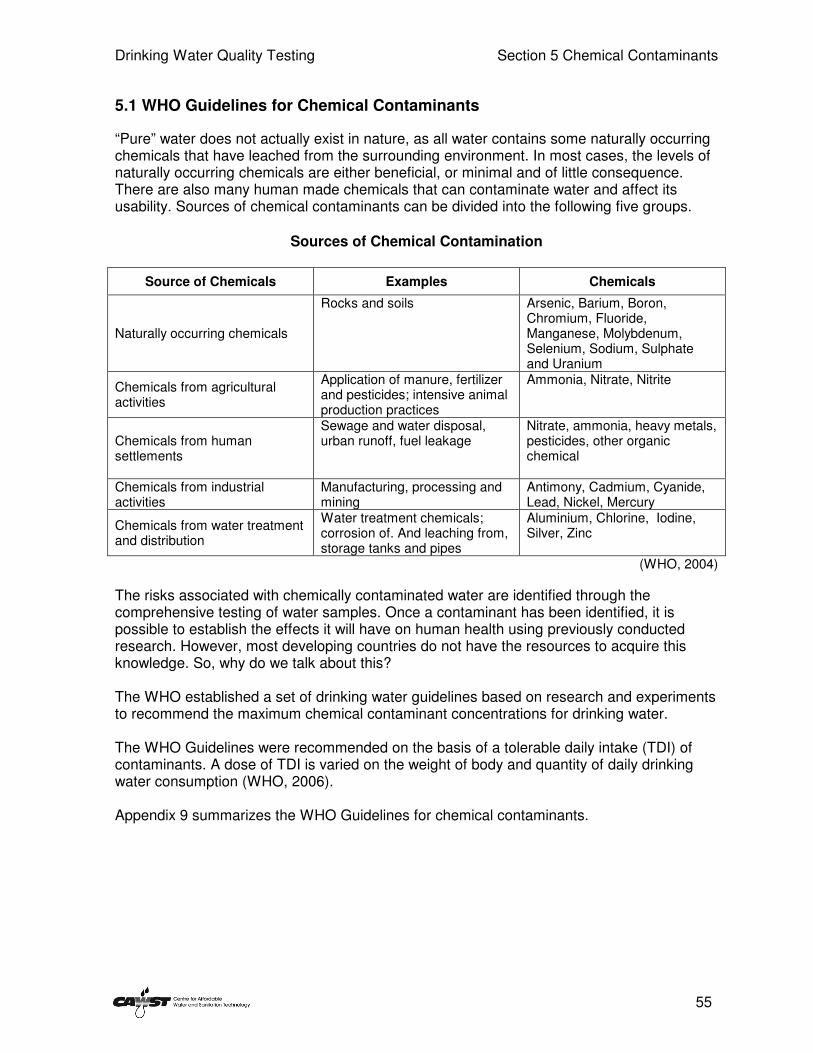
5.1 WHO Guidelines for Chemical Contaminants 5.2 Common Chemicals Parameters for Testing 5.3 Test Methods 5.4 Interpreting Test Results 5.5 Summary of Key Points 5.6 References
Drinking Water Quality Testing Table of Contents
ii
Section 6 Testing for Microbiological Contaminants
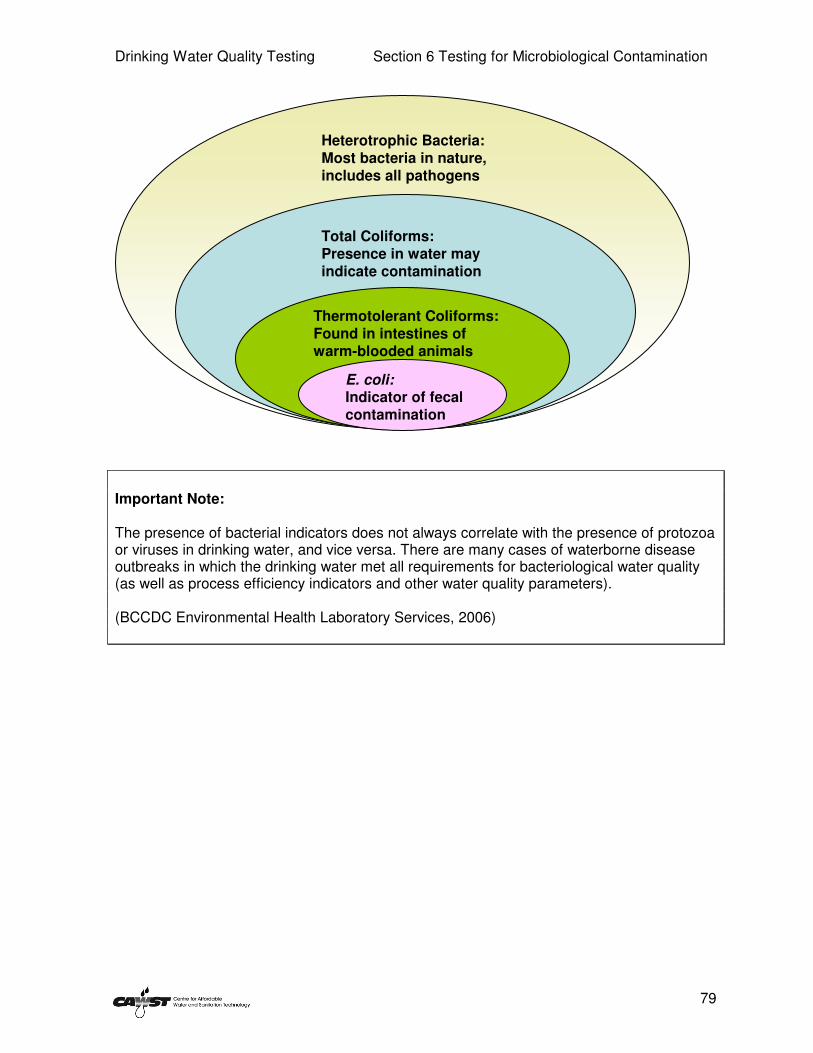
6.1 WHO Guidelines for Microbiological Contaminants 6.2 Potential Health Effects 6.3 Infectious Dose 6.4 Indicator Organisms 6.5 Test Methods 6.6 Interpreting Test Results 6.7 Summary of Key Points 6.8 References
Section 7 Interpreting Test Results
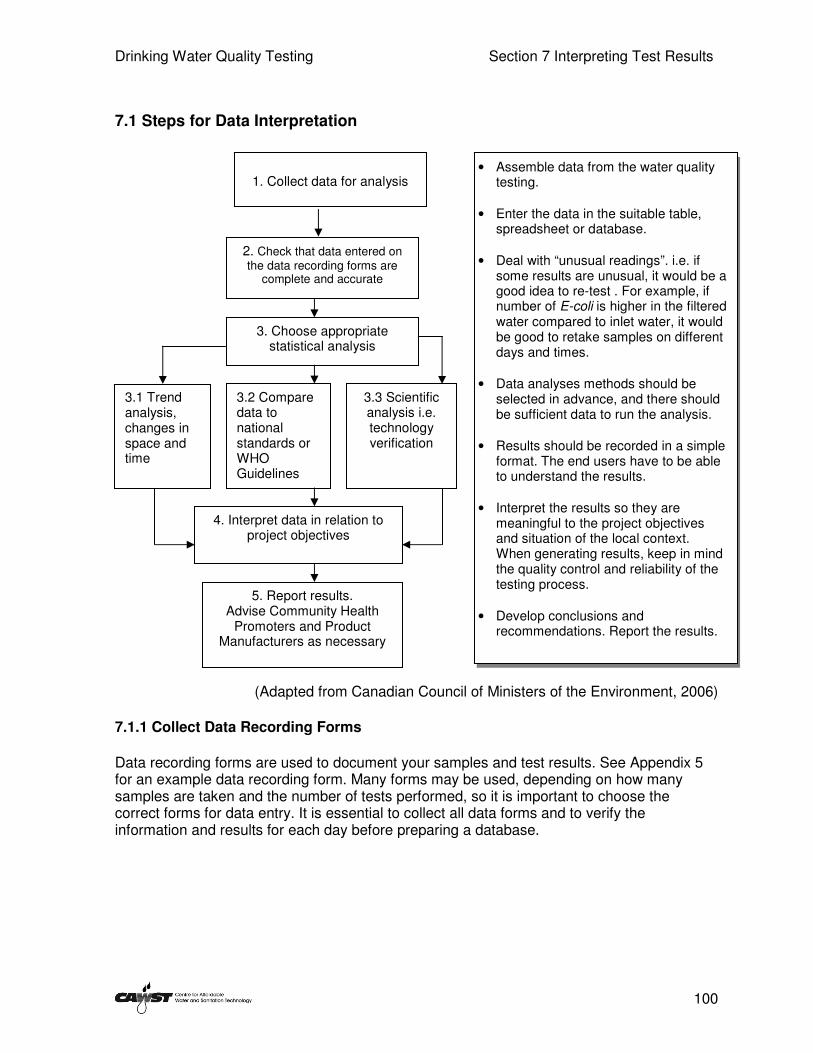
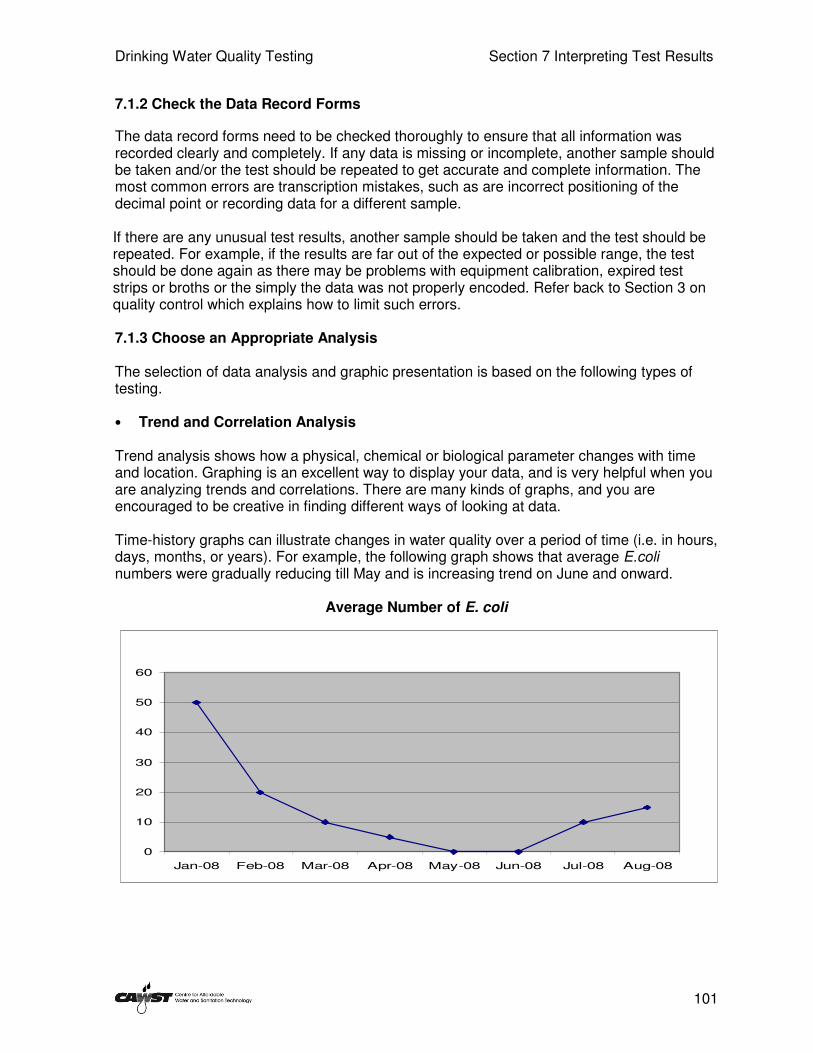
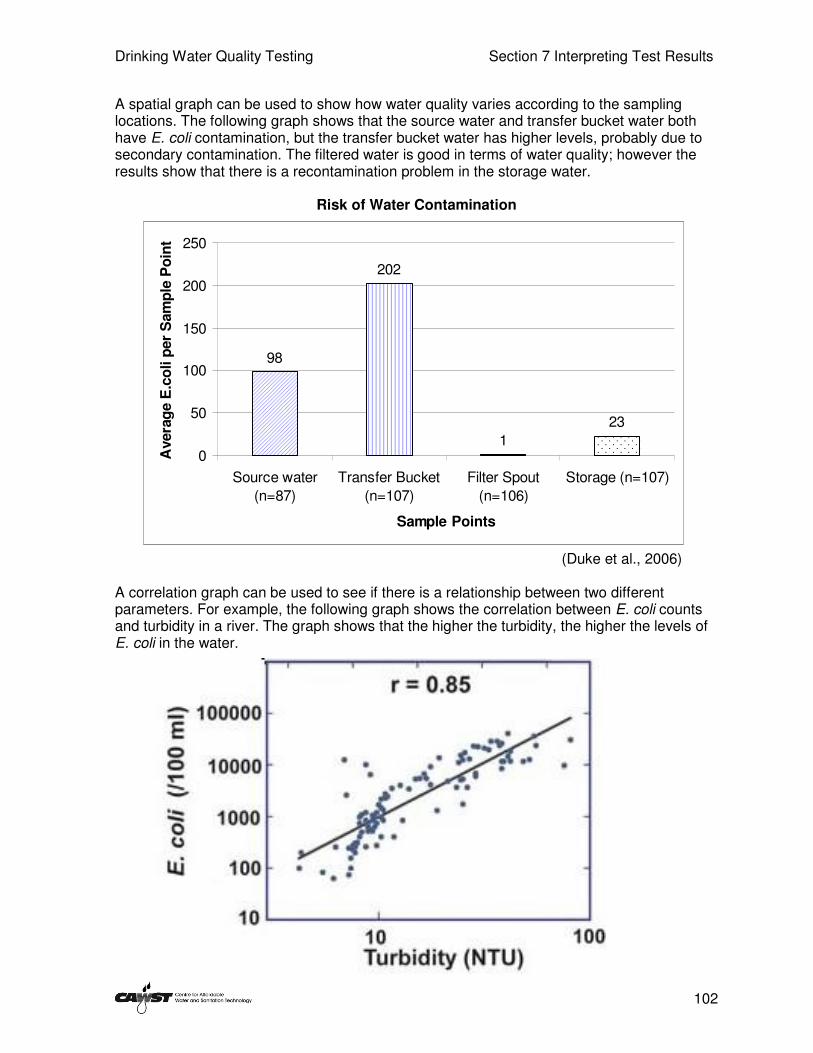
7.1 Steps for Data Interpretation 7.2 Interpreting Laboratory Reports 7.3 Summary of Key Points 7.4 References
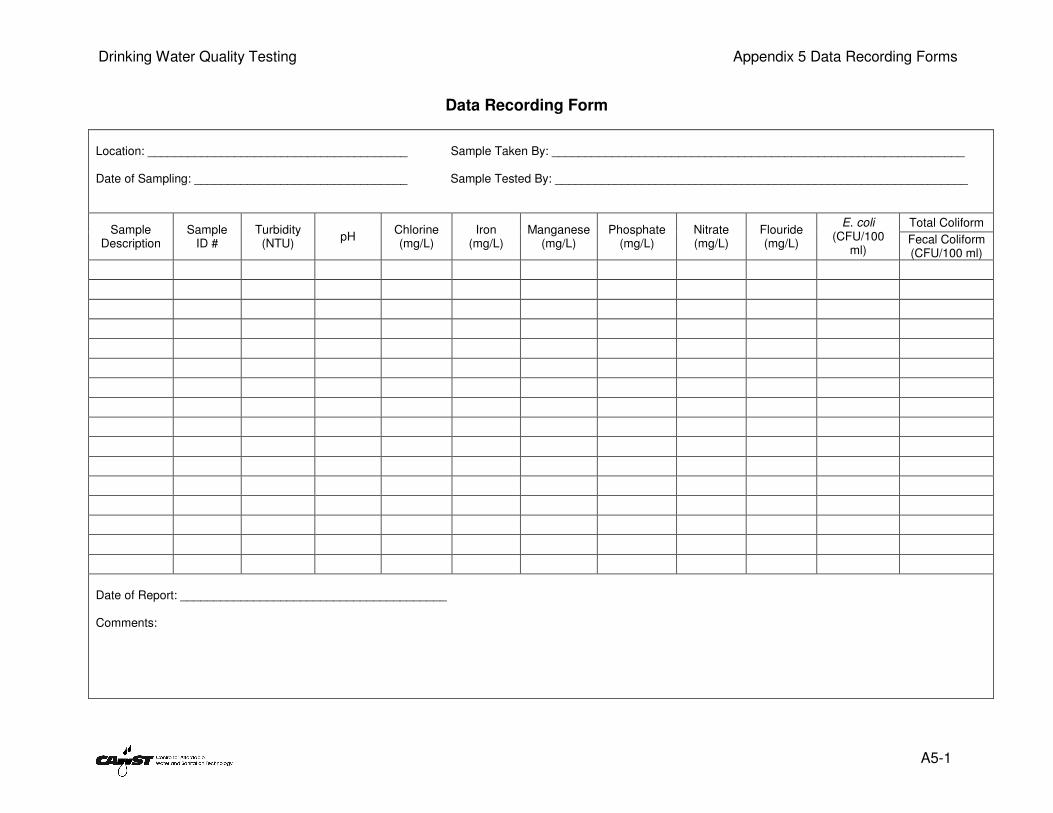
Appendices Appendix 1 Equipment and Materials Appendix 2 Establishing a Laboratory Appendix 3 Determining the Sample Size Appendix 4 Quality Control Appendix 5 Data Recording Forms Appendix 6 Single Parameter Testing Procedures Appendix 7 Example Test Report Appendix 8 Culture Media for Microbiological Testing Appendix 9 WHO Guidelines and Health Effects of Chemical Contaminants
Drinking Water Quality Testing Acronyms and Glossary
iii
Acronyms BSF biosand filter
CAWST Centre for Affordable Water and Sanitation Technology
CFU colony forming units
EC electrical conductivity
ENPHO Environment and Public Health Organization
FRC free residual chlorine
HWTS household water treatment and safe storage
MF membrane filtration
MPN most probable number
NGO non-governmental organization
nd no date
NOP not operating properly
NPS nutrient pad set
NTU nephelometric turbidity units
P-A presence-absence
PET polyethylene perephthalate
PPB parts per billion
PPM parts per million
SODIS solar disinfection
TCU true colour units
TDI tolerable daily intake
TDS total dissolved solids
TNTC too numerous to count
UN United Nations
UNDP United Nations Development Programs
UNICEF United Nations Children’s Education Fund
US EPA United States Environmental Protection Agency
WHO World Health Organization
Drinking Water Quality Testing Acronyms and Glossary
iv
Glossary Adsorption The adherence of gas molecules, ions, microorganism or molecules in solution to the surface of a solid. Agar A semi-solid gel mixture containing nutrients for culturing microorganisms. Algae Aquatic species that encompass several groups of relatively simple living aquatic organisms that capture light energy through photosynthesis, using it to convert inorganic substances into organic matter. Anaerobic Pertaining to, taking place in, or caused by the absence of oxygen. Aquifer A geologic formation, group of formations, or part of a formation that contains sufficient saturated sand or gravel (permeable material) to yield significant quantities of water to springs and wells. Bacteria Single-celled microscopic organisms. Basic The opposite of acidic; water that has pH greater than 7. Biological Any substance derived from animal products or other biological sources. Biodegradation Transformation of a substance into new compounds through biochemical reactions or actions of microorganisms such as bacteria. Blue-baby syndrome A condition most common in young infants and certain elderly people that can be caused by ingestion of high amounts of nitrate, which results in the blood losing its ability to effectively carry oxygen.
Broth A broth is a liquid mixture containing nutrients for culturing microorganisms. Chemical Involving or resulting from a reaction between two or more substances. Chlorine A: Combined chlorine Chlorine that is present in water that is combined with other chemicals. B: Free chlorine Chlorine present in water that is not combined with other chemicals and available to disinfect any additional contaminants introduced to the water. C: Total chlorine Combined chlorine + Free chlorine Coliform A group of generally harmless bacteria which may be faecal or environmental in origin. Colony (bacterial) A cluster of bacteria growing on the surface of or within a solid media, usually cultured from a single cell and appears as a circular dot on the media. Concentration The ratio of the quantity of any substance present in a sample of given volume or a given weight compared to the volume or weight of the sample (e.g. mg/L, µg/L, ppm, ppb). Constituent A chemical or biological substance in water, sediment, or living organism of the area that can be measured by an analytical method. Contamination Degradation of water quality compared to original or natural conditions due to human or natural activity.
Culture Media Combination of nutrients and reagents used to culture microorganisms (e.g. broths, agars) Criterion A standard of judgment or a rule for evaluating or testing something. Discharge The volume of fluid passing a point per unit of time, commonly expressed in m
3/second, L/minute.
Dissolved oxygen Oxygen dissolved in water; one of the most important indicators of the condition of a water body. Dissolved oxygen is necessary for the life of fish and most other aquatic organisms. Dissolved solids An expression for the amount of solids which are contained in a liquid in a dissolved form. Effluent Outflow from a particular source, such as stream that flows from a lake or liquid waste that flows from a factory or sewage treatment plant. Fecal bacteria Microscopic single-celled organisms found in the wastes or warm blooded animals. Their presence indicates contamination by the wastes of warm-blooded animals and the possible presence of pathogenic organisms. Filter paper A porous paper used in the membrane filtration technique through which the sample is filtered and which retains the bacteria. Pore sizes for fecal bacteria are between 0.45 and 0.7
Drinking Water Quality Testing Acronyms and Glossary
v
Fresh water Water that contains less than 1,000 mg/L of dissolved solids such as salt. Guideline A recommended limit that should not be exceeded; guidelines are not intended to be standards of practice, or to give rise to a legal duty or obligation, but in certain circumstances they could assist in evaluation and improvement. Ion A positively or negatively charged atom or group of atoms. Leaching The removal of materials in solution from soil or rock; also refers to movement of pesticides or nutrients from land surface to ground water. Membrane Filtration Water quality testing method used to measure microbiological contamination by enumeration of indicator bacteria colony forming units Nonpoint source contaminant A substance that pollutes or degrades water that comes from agricultural runoff, the atmosphere, roadways, and other diffuse sources. Nephelometric Turbidity Unit (NTU) Unit of measure for the turbidity of water. Essentially, a measure of the cloudiness of water as measured by a nephelometer. Turbidity is based on the amount of light that is reflected off particles in the water.
Organic Containing carbon, but possibly also containing hydrogen, oxygen, chlorine, nitrogen, and other elements. Pathogen Any living organism that causes disease. pH A scale representation of the amount of hydrogen ions in solution reflecting acidity or alkalinity. Photometer Digital device used to measure the concentration of a parameter (chemical, physical) in a sample. Physical A material thing which can be touched and seen, rather than an idea or spoken words Point-source contaminant Any substance that degrades water quality and originates from discrete locations such as discharge pipes of latrines or septic tanks, drainage ditches or well concentrated livestock operation. Potable water Water that is safe and has a good taste for human consumption. Pollution Undesirable state of the natural environment being contaminated with harmful substances as a consequence of human activities or natural calamities. Qualitative Distinguishing substances based on their quality using words. Ex: color, smell, hardness.
Quantitative Distinguishing substances based on their quantity using measurements. Ex: mass, number, height. Runoff The flow of precipitation or snowmelt that appears in streams or surface-water bodies. Standard A mandatory limit that must not be exceeded; standards often reflect a legal duty or obligation. Suspended solids Solids that are not in true solution and that can be removed by filtration. Such suspended solids usually contribute directly to turbidity. Defined in waste management, these are small particles of solid pollutants that resist separation by conventional methods. Turbidity The amount of solid particles that are suspended in water and that cause light rays shining through the water to scatter. Thus, turbidity makes the water cloudy or even opaque in extreme cases. Turbidity is measured in nephelometric turbidity units (NTU). Water quality A term used to describe the chemical, physical, and biological characteristics of water, usually in respect to its suitability for a particular purpose.
Drinking Water Quality Testing Section 1 Introduction
1
1 Introduction to Drinking Water Quality Testing
Having safe drinking water and basic sanitation is a human need and right for every man, woman and child. People need clean water and sanitation to maintain their health and dignity. Having better water and sanitation is essential in breaking the cycle of poverty since it improves people’s health, strength to work, and ability go to school. Yet 884 million people around the world live without improved drinking water and 2.5 billion people still lack access to improved sanitation, including 1.2 billion who do not have a simple latrine at all (WHO/UNICEF, 2008). Many of these people are among those hardest to reach: families living in remote rural areas and urban slums, families displaced by war and famine, and families living in the poverty-disease trap, for whom improved sanitation and drinking water could offer a way out. . The World Health Organization (WHO) estimates that 88% of diarrheal disease is caused by unsafe water, inadequate sanitation and poor hygiene. As a result, more than 4,500 children die every day from diarrhea and other diseases. For every child that dies, countless others, including older children and adults, suffer from poor health and missed opportunities for work and education.
The global water crisis claims more lives through disease than any war claims through guns (UNDP, 2006).
In 2000, the United Nations created the Millennium Development Goals (MDGs) to improve the quality of life for people all over the world. The following are the eight MDGs that are to be achieved by the year 2015: 1. Eliminate extreme poverty and hunger. 2. Achieve universal primary education. 3. Promote gender equality and empower women. 4. Reduce child mortality. 5. Improve maternal health. 6. Combat HIV/AIDS, malaria and other diseases. 7. Ensure environmental sustainability.
(c) Reduce the proportion of people without sustainable access to safe drinking water and basic sanitation by half.
8. Develop a global partnership for development. The WHO/UNICEF Joint Monitoring Programme for Water Supply and Sanitation (JMP) is the official United Nations organization responsible for monitoring progress towards the MDG targets for improved drinking water and sanitation.
Drinking Water Quality Testing Section 1 Introduction
2
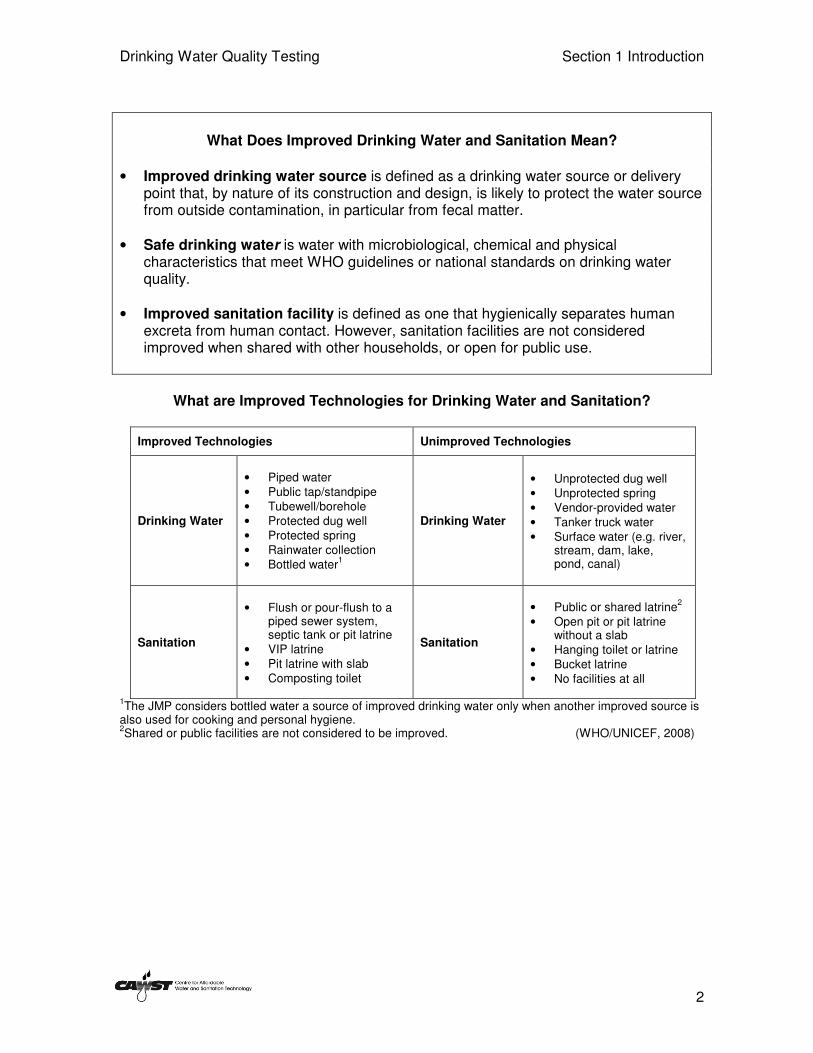
What Does Improved Drinking Water and Sanitation Mean?
• Improved drinking water source is defined as a drinking water source or delivery point that, by nature of its construction and design, is likely to protect the water source from outside contamination, in particular from fecal matter.
• Safe drinking water is water with microbiological, chemical and physical
characteristics that meet WHO guidelines or national standards on drinking water quality.
• Improved sanitation facility is defined as one that hygienically separates human
excreta from human contact. However, sanitation facilities are not considered improved when shared with other households, or open for public use.
What are Improved Technologies for Drinking Water and Sanitation?
Improved Technologies Unimproved Technologies
Drinking Water
• Piped water • Public tap/standpipe • Tubewell/borehole • Protected dug well • Protected spring • Rainwater collection • Bottled water
1
Drinking Water
• Unprotected dug well • Unprotected spring • Vendor-provided water • Tanker truck water • Surface water (e.g. river,
• Hanging toilet or latrine • Bucket latrine • No facilities at all
1The JMP considers bottled water a source of improved drinking water only when another improved source is
also used for cooking and personal hygiene. 2Shared or public facilities are not considered to be improved. (WHO/UNICEF, 2008)
Drinking Water Quality Testing Section 1 Introduction
3
1.1 Drinking Water Quality We find our drinking water from different places depending on where we live in the world. Three sources that are used to collect drinking water are: 1. Ground water – Water that fills the spaces between rocks and soil making an aquifer.
Ground water depth and quality varies from place to place. About half of the world’s drinking water comes from the ground.
2. Surface water – Water that is taken directly from a stream, river, lake, pond, spring or
similar source. Surface water quality is generally unsafe to drink without treatment. 3. Rainwater – Water that is collected and stored using a roof top, ground surface or
rock catchment. The quality of rain water collected from a roof surface is usually better than a ground surface or rock catchment.
Water is in continuous movement on, above and below the surface of the earth. As water is recycled through the earth, it picks up many things along its path. Water quality will vary from place to place, with the seasons, and with various kinds of rock and soil which it moves through. For the most part, it is natural processes that affect water quality. For instance, water moving through underground rocks and soils may pick up natural contaminants, even with no human activity or pollution in the area. In addition to nature's influence, water is also polluted by human activities, such as open defecation, dumping garbage, poor agricultural practices, and chemical spills at industrial sites. Even though water may be clear, it does not necessarily mean that it is safe for us to drink. It is important for us to judge the safety of water by taking the following three qualities into consideration: 1. Microbiological – bacteria, viruses, protozoa, and worms 2. Chemical – minerals, metals and chemicals 3. Physical – temperature, colour, smell, taste and turbidity Safe drinking water should have the following microbiological, chemical and physical qualities: • Free of pathogens • Low in concentrations of toxic chemicals • Clear • Tasteless and colourless (for aesthetic purposes) When considering drinking water quality, in most cases microbiological contamination is the main concern since it is responsible for the majority of illnesses and deaths related to drinking unsafe water.
Drinking Water Quality Testing Section 1 Introduction
4
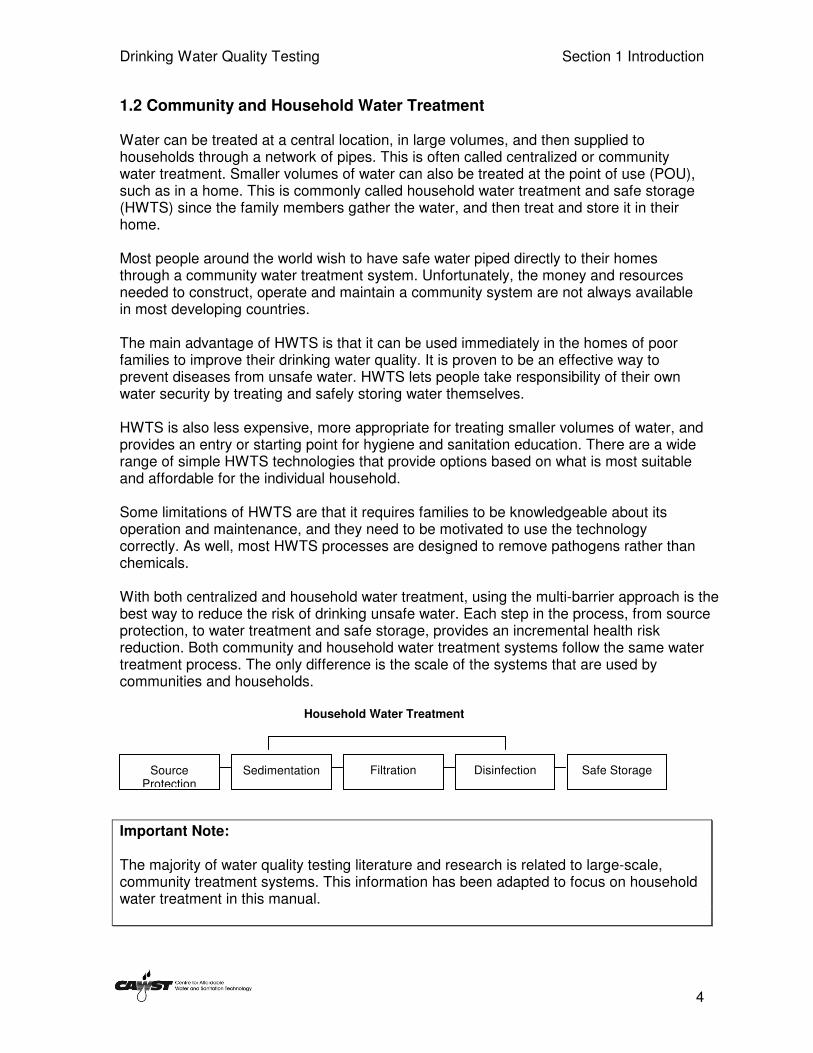
1.2 Community and Household Water Treatment Water can be treated at a central location, in large volumes, and then supplied to households through a network of pipes. This is often called centralized or community water treatment. Smaller volumes of water can also be treated at the point of use (POU), such as in a home. This is commonly called household water treatment and safe storage (HWTS) since the family members gather the water, and then treat and store it in their home. Most people around the world wish to have safe water piped directly to their homes through a community water treatment system. Unfortunately, the money and resources needed to construct, operate and maintain a community system are not always available in most developing countries. The main advantage of HWTS is that it can be used immediately in the homes of poor families to improve their drinking water quality. It is proven to be an effective way to prevent diseases from unsafe water. HWTS lets people take responsibility of their own water security by treating and safely storing water themselves. HWTS is also less expensive, more appropriate for treating smaller volumes of water, and provides an entry or starting point for hygiene and sanitation education. There are a wide range of simple HWTS technologies that provide options based on what is most suitable and affordable for the individual household. Some limitations of HWTS are that it requires families to be knowledgeable about its operation and maintenance, and they need to be motivated to use the technology correctly. As well, most HWTS processes are designed to remove pathogens rather than chemicals. With both centralized and household water treatment, using the multi-barrier approach is the best way to reduce the risk of drinking unsafe water. Each step in the process, from source protection, to water treatment and safe storage, provides an incremental health risk reduction. Both community and household water treatment systems follow the same water treatment process. The only difference is the scale of the systems that are used by communities and households. Household Water Treatment
Important Note: The majority of water quality testing literature and research is related to large-scale, community treatment systems. This information has been adapted to focus on household water treatment in this manual.
Sedimentation
Filtration
Disinfection
Safe Storage
Source Protection
Drinking Water Quality Testing Section 1 Introduction
5
1.3 Need for Drinking Water Quality Testing The following are common reasons to do water quality testing at the household level:
• ensure safe drinking water • identify problems • adopt precautionary measures • raise awareness • determine the effectiveness of the HWTS process • select an appropriate water source • influence government to supply safe water Household water treatment and safe storage is becoming a popular option for obtaining safe water. Different processes and technologies such as the biosand filter, ceramic filter, solar disinfection (SODIS) and chlorination are being introduced from different governmental and non-governmental organizations (NGOs). Water quality tests are very useful in understanding the difference between source water, treated water and stored water quality.
1.4 Drinking Water Quality Guidelines and Standards
What is the Difference between Guidelines and Standards?
Standard – a mandatory limit that must not be exceeded; standards often indicate a legal duty or obligation. Guideline – a recommended limit that should not be exceeded; guidelines are not intended to be standards of practice, or indicate a legal duty or obligation, but in certain circumstances they could assist in evaluation and improvement.
The World Health Organization (WHO) is part of the United Nations (UN) and it focuses on international public health. The WHO writes the Guidelines for Drinking Water Quality (2006) to help make sure that people are drinking safe water around the world. The WHO Guidelines explain that safe drinking water will not make people sick at any time throughout their life, including when they are young, old or sick. Safe drinking water should be good to use for all of our personal needs, including drinking, cooking, and washing. The WHO Guidelines cover microbiological, chemical and physical qualities. However, it is stressed that microbiological quality is the most important since this is biggest cause of illness and death around the world.
Drinking Water Quality Testing Section 1 Introduction
6
Although there are several contaminants in water that may be harmful to humans, the first priority is to ensure that drinking water is free of pathogens that cause disease.
(WHO, 2006)
The implementation of the WHO Guidelines for Drinking Water Quality varies among countries. There is no single approach that is used worldwide. The Guidelines are recommendations to work towards and they are not mandatory limits. Countries can take the WHO Guidelines into consideration along with the local environmental, social, economic and cultural conditions. This may lead to countries developing their own national standards that are quite different the WHO Guidelines. There is an overwhelming need to increase the availability of safe drinking water in ways that are in line with the WHO Guidelines. To meet this worldwide demand, a variety of household water treatment and safe storage technologies are being promoted as effective, appropriate, acceptable and affordable practices to improve drinking water quality.
Testing can be done to determine if pathogens are present in the drinking water. However, occasional tests conducted on a water supply may provide a false sense of security or inconclusive results as water quality can vary widely and rapidly. Regular testing can also be time consuming and expensive. It should be undertaken only when needed to influence practical decisions with respect to supply or treatment. The general health, well-being or energy levels of the local population can also provide some insight into the quality of the drinking water. However, it is important to remember that diarrhoeal diseases can also result from poor food and personal hygiene.
1.5 Drinking Water Quality Testing Options
Establishing water quality testing as part of your project depends on your objectives and availability of resources. The following are some guiding questions for you to ask when starting out to help select appropriate water quality test methods: • Why do you need to conduct water quality testing?
o Baseline information o Planning and policy development o Management and operational information o Other purposes
• What water quality information is required?
Historically, conventional laboratories were mainly used to carry out water quality testing. Now there is a wide variety of good testing kits and products available in the commercial market that allows you to conduct water quality testing on your own without relying on a laboratory. The following sections present the different methods that are available:
Drinking Water Quality Testing Section 1 Introduction
7
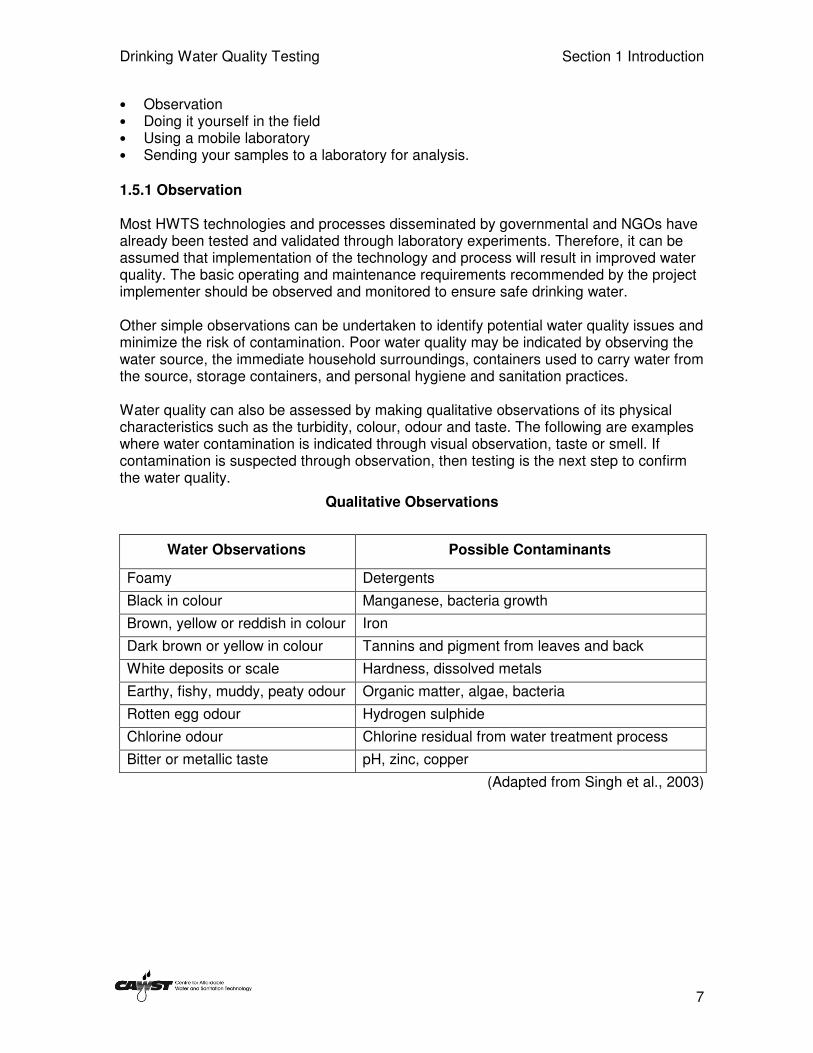
• Observation • Doing it yourself in the field • Using a mobile laboratory • Sending your samples to a laboratory for analysis. 1.5.1 Observation Most HWTS technologies and processes disseminated by governmental and NGOs have already been tested and validated through laboratory experiments. Therefore, it can be assumed that implementation of the technology and process will result in improved water quality. The basic operating and maintenance requirements recommended by the project implementer should be observed and monitored to ensure safe drinking water. Other simple observations can be undertaken to identify potential water quality issues and minimize the risk of contamination. Poor water quality may be indicated by observing the water source, the immediate household surroundings, containers used to carry water from the source, storage containers, and personal hygiene and sanitation practices. Water quality can also be assessed by making qualitative observations of its physical characteristics such as the turbidity, colour, odour and taste. The following are examples where water contamination is indicated through visual observation, taste or smell. If contamination is suspected through observation, then testing is the next step to confirm the water quality.
Qualitative Observations
Water Observations Possible Contaminants
Foamy Detergents
Black in colour Manganese, bacteria growth
Brown, yellow or reddish in colour Iron
Dark brown or yellow in colour Tannins and pigment from leaves and back
White deposits or scale Hardness, dissolved metals
Chlorine odour Chlorine residual from water treatment process
Bitter or metallic taste pH, zinc, copper
(Adapted from Singh et al., 2003)
Drinking Water Quality Testing Section 1 Introduction
8
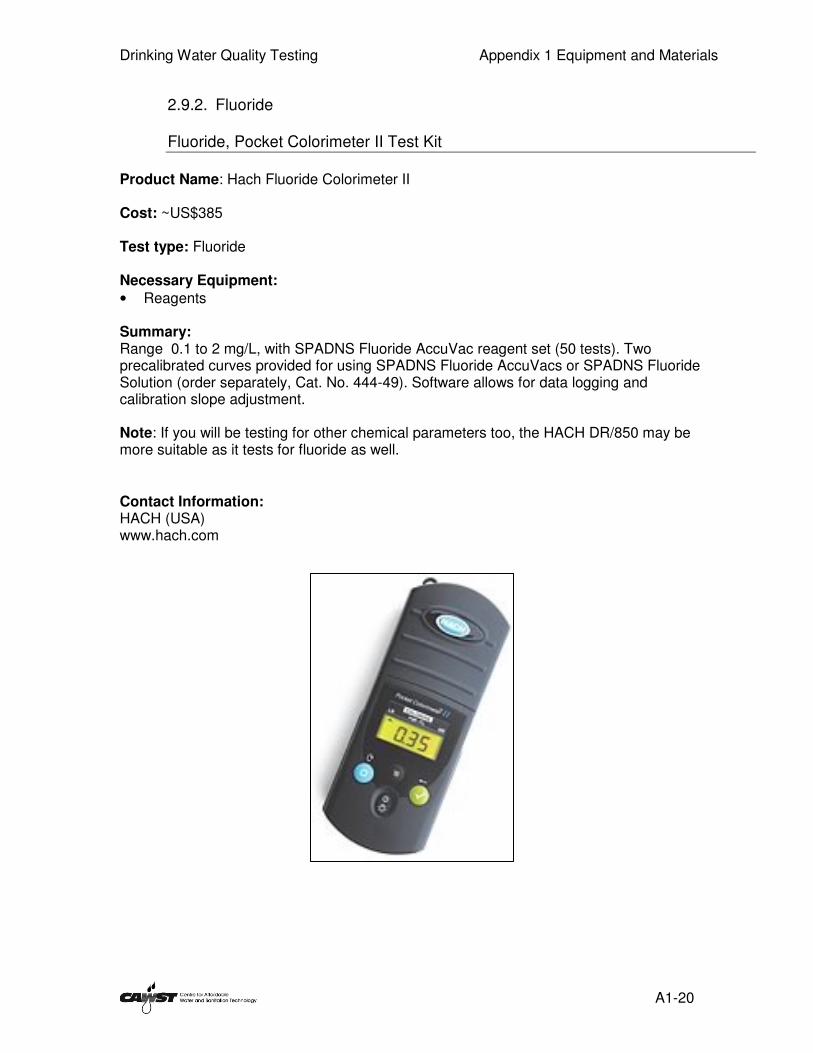
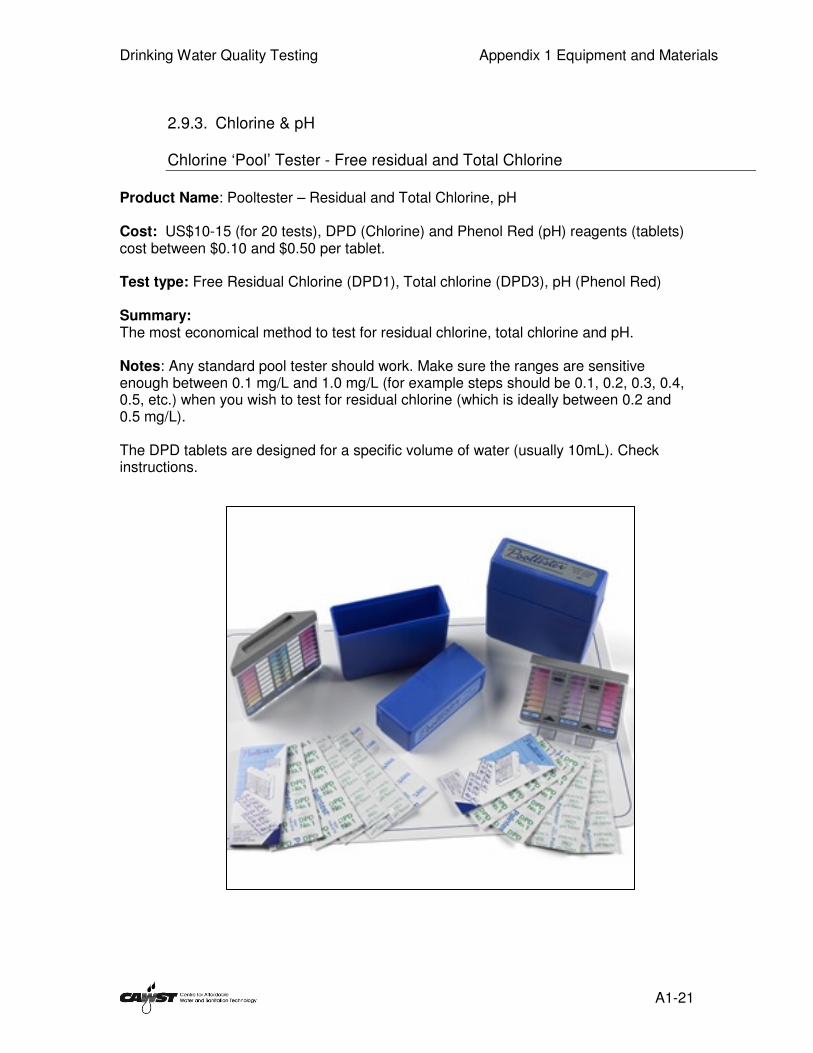
1.5.2 Portable Testing Kits
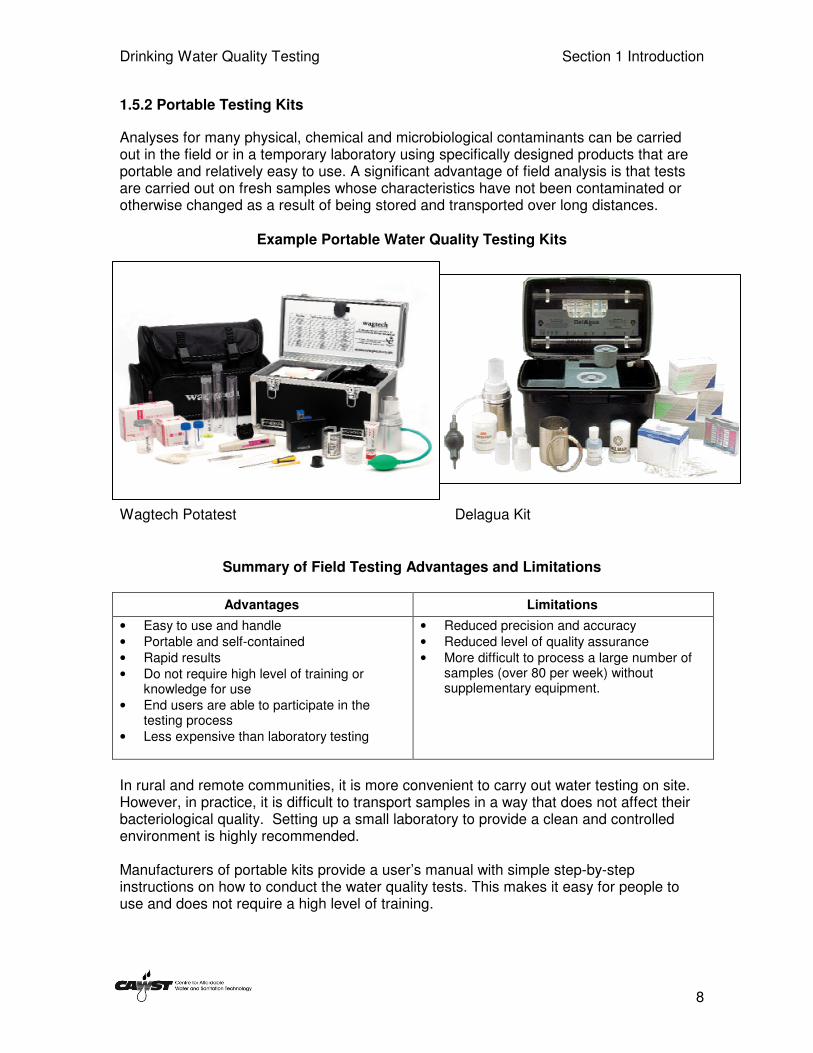
Analyses for many physical, chemical and microbiological contaminants can be carried out in the field or in a temporary laboratory using specifically designed products that are portable and relatively easy to use. A significant advantage of field analysis is that tests are carried out on fresh samples whose characteristics have not been contaminated or otherwise changed as a result of being stored and transported over long distances.
Example Portable Water Quality Testing Kits
Wagtech Potatest Delagua Kit
Summary of Field Testing Advantages and Limitations
Advantages Limitations
• Easy to use and handle • Portable and self-contained • Rapid results • Do not require high level of training or
knowledge for use • End users are able to participate in the
testing process • Less expensive than laboratory testing
• Reduced precision and accuracy • Reduced level of quality assurance • More difficult to process a large number of
samples (over 80 per week) without supplementary equipment.
In rural and remote communities, it is more convenient to carry out water testing on site. However, in practice, it is difficult to transport samples in a way that does not affect their bacteriological quality. Setting up a small laboratory to provide a clean and controlled environment is highly recommended. Manufacturers of portable kits provide a user’s manual with simple step-by-step instructions on how to conduct the water quality tests. This makes it easy for people to use and does not require a high level of training.
Drinking Water Quality Testing Section 1 Introduction
9
Portable water testing kits can also be a useful tool to raise awareness about water quality. Community Health Promoters or field staff can use water quality testing to help bring about positive changes in the hygiene and sanitation behaviour of many individuals. Many tests show visual results which help people to improve their understanding of their water quality. Portable water quality test kits should have the following characteristics: • Easy to use with simple instructions • Small and easy to transport • No restrictions on air transport • Fast results • Limited requirement for distilled or deionized water • Dilution not necessary • Does not require calibration • Robust (limited effects from UV light; shock; humidity or temperature) • Can test several parameters • Easy to repair or replace • Limited consumables or consumables are easy to obtain • Reasonable cost of equipment and consumables Appendix 1: Equipment and Products provides more information on the above portable tests kits as well as other equipment and materials generally used by different government and NGOs. 1.5.3 Mobile Laboratory Testing It is possible to set up a laboratory in a suitable motor vehicle, e.g. truck or van. In effect, this is a variant of field testing, but may provide better facilities than test kits. In practice, it is only feasible where projects are scattered in different locations and they have common water quality monitoring. Government agencies and research centres responsible for monitoring and water quality testing sometimes use mobile laboratories for periodic water quality testing. The vehicle is usually the most costly piece of equipment.
Drinking Water Quality Testing Section 1 Introduction
10
1.5.4 Laboratory Testing Water quality testing can also be carried out in a laboratory. This method requires facilities, trained technician, equipment and other supporting materials. Laboratory testing can be useful if you are only taking a small number of samples and your project is located close to an urban area where a laboratory is present.
Summary of Laboratory Testing Advantages and Limitations
Advantages Limitations
• Controlled environment • High level of precision and accuracy • High level of quality assurance • More consistent results • More samples can be processed in a
shorter time • Accepted by international standards
• Relatively expensive • Requires trained and skilled technicians • Usually located in urban areas, may require
samples to be transported over long distances
• Some laboratories may have very limited options of test methods
Governments and university researchers often use laboratories for water quality testing. This is due to the fact that laboratories provide more accurate and precise results, which are often required for quality control and monitoring. Laboratory testing is preferred when carrying out technology verification and preparing water quality guidelines. UNICEF also recommends that some complex chemicals such as antimony, barium, cadmium, mercury, molybdenum, selenium and uranium should be tested at a laboratory in order to achieve a reliable result. The cost of a laboratory sample tests varies depending on the following parameters:
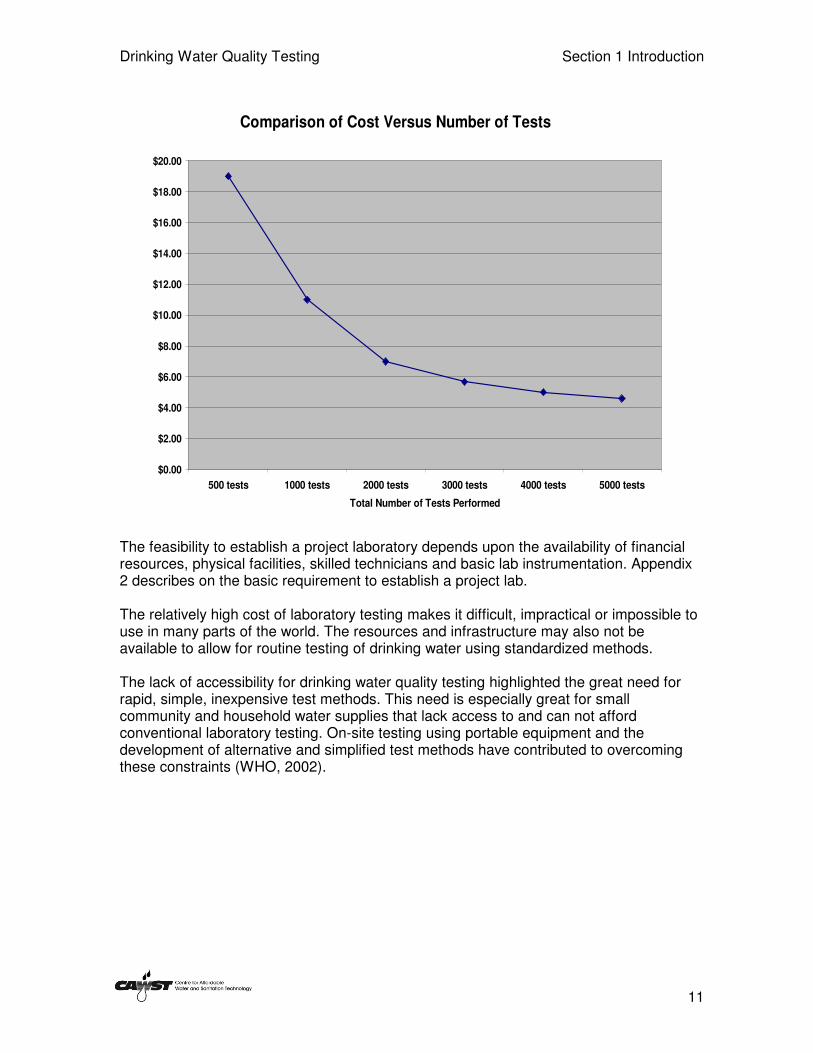
• Geographical location of the laboratory • Types of chemical or biological contaminants • Quantity of sample tests • Accuracy and precision level required The costs are usually reduced as the numbers of tests increase. The following graph shows a reduction costs when the number of tests is increased. This was based on setting up a semi-permanent laboratory using reusable glassware (Baker, 2006).
Drinking Water Quality Testing Section 1 Introduction
The feasibility to establish a project laboratory depends upon the availability of financial resources, physical facilities, skilled technicians and basic lab instrumentation. Appendix 2 describes on the basic requirement to establish a project lab. The relatively high cost of laboratory testing makes it difficult, impractical or impossible to use in many parts of the world. The resources and infrastructure may also not be available to allow for routine testing of drinking water using standardized methods. The lack of accessibility for drinking water quality testing highlighted the great need for rapid, simple, inexpensive test methods. This need is especially great for small community and household water supplies that lack access to and can not afford conventional laboratory testing. On-site testing using portable equipment and the development of alternative and simplified test methods have contributed to overcoming these constraints (WHO, 2002).
Drinking Water Quality Testing Section 1 Introduction
12
1.5.5 Selecting Drinking Water Quality Test Methods Selecting a test method depends on the purpose of the test and how the results are going to be used. There is no single test to determine the safety of drinking water. Deciding on an appropriate method is based on the following considerations: • Objectives of your testing program. • The range of concentrations of the contaminants that need to be determined
o Detection limits depend on the type of method; both low and high concentrations can be tested with more accuracy in a laboratory.
• The accuracy and precision required o The greater accuracy and precision required, the greater the analytical
complexity and cost • The maximum time period between sampling and analysis • Technical skills required • Cost of equipment and materials for each test In the case where different methods can achieve the above requirements, the ultimate choice may be dictated by familiarity with the method and/or the availability of necessary equipment.
1.6 Lessons Learned Smaller projects that are just getting off the ground do not usually do water quality testing. Many project implementers have shown initial interest in water quality testing; however they end up finding that it can be an onerous and expensive task. The cost (about US$2-4 per test) is not affordable for many project implementers who want to conduct water quality testing on a regular basis. Some larger projects have found portable water testing to be useful in determining the effectiveness of the technology and for monitoring and evaluating its implementation. These project implementers may have their own laboratory set up and have received training on water quality testing. Sometimes project implementers do random testing that is not part of a regular and structured monitoring program. Doing occasional or random tests may provide a false sense of security or inconclusive results as water quality can vary widely and rapidly. Laboratory testing is preferred when carrying out technology verification and preparing water quality guidelines. UNICEF recommends that some complex chemicals such as antimony, barium, cadmium, mercury, molybdenum, selenium and uranium should be tested by a laboratory to achieve a reliable result. However, testing specifically for these chemicals is not usually a concern for the majority of HWTS projects.
Drinking Water Quality Testing Section 1 Introduction
13
Water quality testing has been used by some projects as an effective tool to raise awareness about the importance of safe water in rural communities. It can be an effective tool for Community Health Promoters or field staff to help bring about positive changes in people’s hygiene and sanitation behaviours. Users have a chance to participate in the testing process and they can visually see the results. However the results should be interpreted and presented properly to the users to avoid misunderstandings and possible negative behaviour change. For example, showing treated water as being positive for contamination (despite considerable improvement compared to the original source) may discourage the household from using their water.
1.7 Summary of Key Points
• Water quality can be defined by three broad categories: physical, chemical and biological attributes.
• The WHO Guidelines for Drinking Water Quality defines safe water as a not
representing any significant risk to health over the lifetime of consumption. • Adoption of the WHO Guidelines for Drinking Water Quality varies among countries
and regions. There is no single approach that is used worldwide. • Although there are several contaminants in water that may be harmful to humans, the
first priority is to ensure that drinking water is free of microorganisms that cause disease (pathogens)
• Common reasons to conduct water quality testing at the household level are to:
o ensure safe drinking water o identify problems o adopt precautionary measures o raise awareness o determine the effectiveness of HWT technologies o select an appropriate water source o influence government to supply safe water
• There are four broad options for water quality testing: observation, testing using
portable (field) kits, mobile laboratory testing and specialized laboratory testing. • There is no single test to determine the safety of drinking water.
Drinking Water Quality Testing Section 1 Introduction
14
1.8 References Baker D. (2006). Water Lab Equipment, Unpublished document. Centre for Affordable Water and Sanitation Technology, Calgary, Canada. Singh, G. and Singh J. (2003). Water Supply and Sanitation Engineering, Standards Publisher Distributors, India. UNICEF (2003). Water Quality Assessment and Monitoring, Technical Bulletin No.6. Available at: www.supply.unicef.dk/catalogue/bulletin6.htm World Health Organization (2001). Water Quality: Guidelines, Standards and Health. Edited by Lorna Fewtrell and Jamie Bartram. IWA Publishing, London, UK. Available at: www.who.int/water_sanitation_health/dwq/whoiwa/en/index.html World Health Organization (2006). Guidelines for Drinking-Water Quality: Incorporating First Addendum. Vol. 1, Recommendations, Third Edition. WHO, Geneva, Switzerland. Available at: www.who.int/water_sanitation_health/dwq/gdwq3rev/en/index.html World Health Organization (2008). Guidelines for Drinking-Water Quality: Second Addendum. Vol. 1, Recommendations, Third Edition. WHO, Geneva, Switzerland. Available at: www.who.int/water_sanitation_health/dwq/secondaddendum20081119.pdf World Health Organization and United Nations Children’s Fund (2004) Meeting the MDG Drinking Water and Sanitation Target: A Mid-Term Assessment of Progress. UNICEF, New York, USA and WHO, Geneva, Switzerland. Available at www.unicef.org/wes/files/who_unicef_watsan_midterm_rev.pdf World Health Organization and United Nations Children’s Fund (2005). WHO/UNICEF Joint Monitoring Programme for Water Supply and Sanitation. Water for Life: Making it Happen. UNICEF, New York, USA and WHO, Geneva, Switzerland. Available at: www.who.int/water_sanitation_health/monitoring/jmp2005/en/index.html
World Health Organization and United Nations Children’s Fund (2008). Progress on Drinking Water and Sanitation: Special Focus on Sanitation. UNICEF, New York, USA and WHO, Geneva, Switzerland. Available at: www.wssinfo.org/en/40_MDG2008.html
Drinking Water Quality Testing Section 1 Introduction
15
Assignment: Selecting Water Quality Test Methods
1. Why do you want to conduct water quality testing for your project? 2. Which testing options do you think will be the most appropriate for your project? Why?
Drinking Water Quality Testing Section 1 Introduction
16
Assignment: Answers 1. The following are common reasons to do water quality testing at the household level:
• ensure safe drinking water • identify problems • adopt precautionary measures • raise awareness • determine the effectiveness of the HWTS process • select an appropriate water source • influence government to supply safe water 2. Project specific answers. If you have any questions ask your facilitator.
Drinking Water Quality Testing Section 2 Planning
17
2 Planning for Water Quality Testing It is essential to have a detailed plan for water quality testing. Planning in advance and thinking through the process will save time, lower costs, satisfy stakeholders, and prevent surprises during the project. Moreover, it gives a basis for the financial and human resources that will be needed to carry out your testing. It is important to follow the plan once it has been developed, although some changes will inevitably be required as events unfold. The planning process presented in this section follows well-established practices. This process may require more time than expected to develop objectives, put together your team, identify the testing parameters, and prepare a budget.
2.1 The Planning Process Planning for a water quality testing should be done by the people who will be involved in the project. The following steps can be undertaken as a facilitated group activity before the testing begins to ensure that the planning is thorough and complete. Time invested in planning is essential for conducting efficient and useful water quality tests. 1. Review the need for testing 2. Develop your objectives 3. Identify test parameters 4. Identify test methods 5. Determine the key milestones 6. Identify your activities 7. Set out responsibilities 8. Develop time and cost estimates
2.1.1 Review the Need for Testing As discussed in Section 1, you should review the need for water quality testing within the context of your project and its objectives. People often start out by implementing a pilot project in a community to demonstrate the performance and acceptability of HWTS. There are different criteria to measure performance, including:
• Quantity of treated water • User’s satisfaction • Robustness • Ease of maintenance and operation • Affordability • Availability • User’s perception on taste, smell and color In some situations, you may also want to determine the effectiveness of HWTS in terms of its physical, chemical and microbiological contaminant removal. There are other situations that may require some assessment of HWTS: end user request, donor request, government verification, or research purposes. This is where water quality testing can be a useful tool.
Drinking Water Quality Testing Section 2 Planning
18
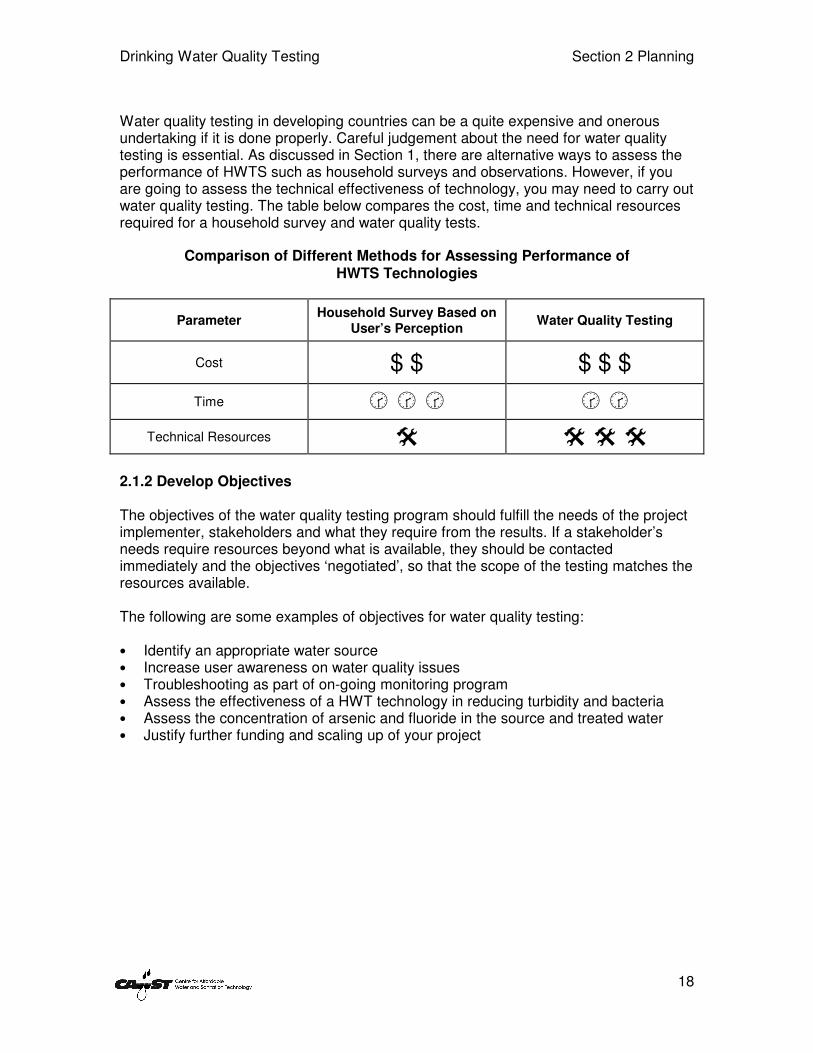
Water quality testing in developing countries can be a quite expensive and onerous undertaking if it is done properly. Careful judgement about the need for water quality testing is essential. As discussed in Section 1, there are alternative ways to assess the performance of HWTS such as household surveys and observations. However, if you are going to assess the technical effectiveness of technology, you may need to carry out water quality testing. The table below compares the cost, time and technical resources required for a household survey and water quality tests.
Comparison of Different Methods for Assessing Performance of HWTS Technologies
Parameter Household Survey Based on
User’s Perception Water Quality Testing
Cost $ $ $ $ $
Time � � � � �
Technical Resources � � � � 2.1.2 Develop Objectives The objectives of the water quality testing program should fulfill the needs of the project implementer, stakeholders and what they require from the results. If a stakeholder’s needs require resources beyond what is available, they should be contacted immediately and the objectives ‘negotiated’, so that the scope of the testing matches the resources available. The following are some examples of objectives for water quality testing: • Identify an appropriate water source • Increase user awareness on water quality issues • Troubleshooting as part of on-going monitoring program • Assess the effectiveness of a HWT technology in reducing turbidity and bacteria • Assess the concentration of arsenic and fluoride in the source and treated water • Justify further funding and scaling up of your project
Drinking Water Quality Testing Section 2 Planning
19
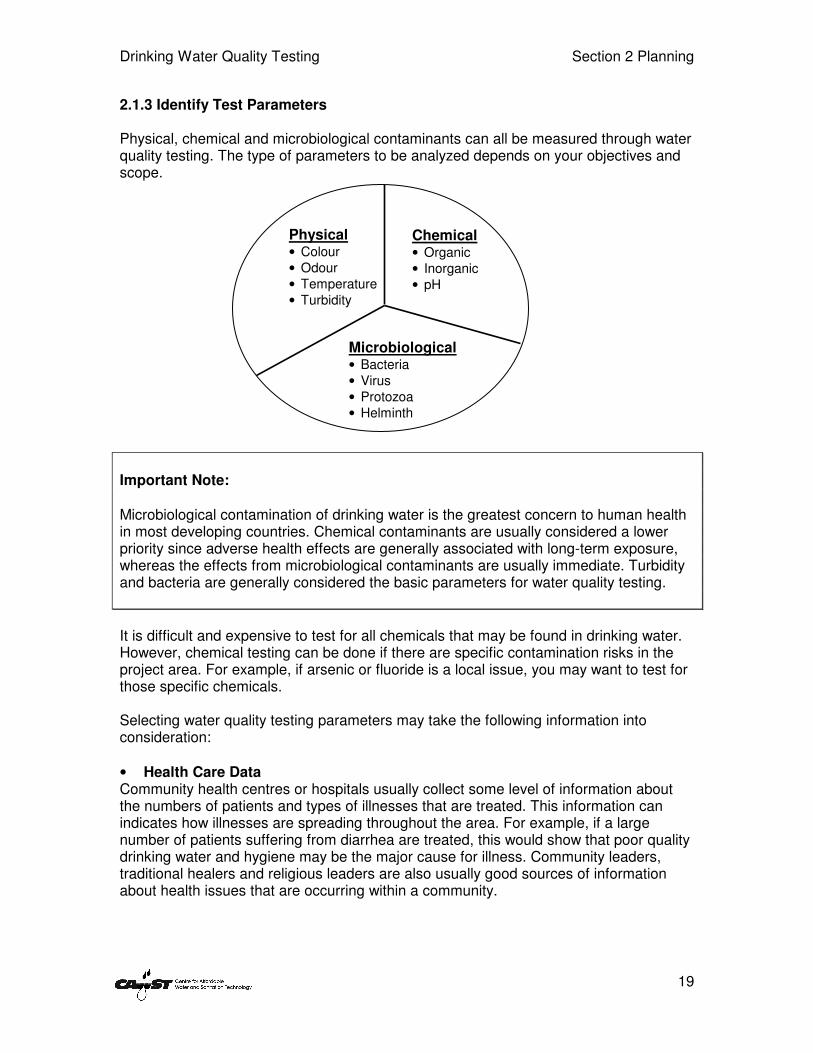
2.1.3 Identify Test Parameters Physical, chemical and microbiological contaminants can all be measured through water quality testing. The type of parameters to be analyzed depends on your objectives and scope.
Important Note: Microbiological contamination of drinking water is the greatest concern to human health in most developing countries. Chemical contaminants are usually considered a lower priority since adverse health effects are generally associated with long-term exposure, whereas the effects from microbiological contaminants are usually immediate. Turbidity and bacteria are generally considered the basic parameters for water quality testing.
It is difficult and expensive to test for all chemicals that may be found in drinking water. However, chemical testing can be done if there are specific contamination risks in the project area. For example, if arsenic or fluoride is a local issue, you may want to test for those specific chemicals. Selecting water quality testing parameters may take the following information into consideration: • Health Care Data Community health centres or hospitals usually collect some level of information about the numbers of patients and types of illnesses that are treated. This information can indicates how illnesses are spreading throughout the area. For example, if a large number of patients suffering from diarrhea are treated, this would show that poor quality drinking water and hygiene may be the major cause for illness. Community leaders, traditional healers and religious leaders are also usually good sources of information about health issues that are occurring within a community.
Physical • Colour • Odour • Temperature • Turbidity
Drinking Water Quality Testing Section 2 Planning
20
• End Users’ Request End users may show interest in the effectiveness and reliability of a HWT technology. Sometimes they want to be able to see the pathogens to better understand the process. In this situation, it can be beneficial to do microbiological testing to demonstrate the presence of pathogens in the water. • Natural Disasters Natural disasters such as flooding, earthquakes and landslides often cause contamination of water sources. Deterioration of the water source can affect the effectiveness of different HWT technologies. Depending on the type and intensity of the natural disaster, it may be a good idea to conduct water quality testing.
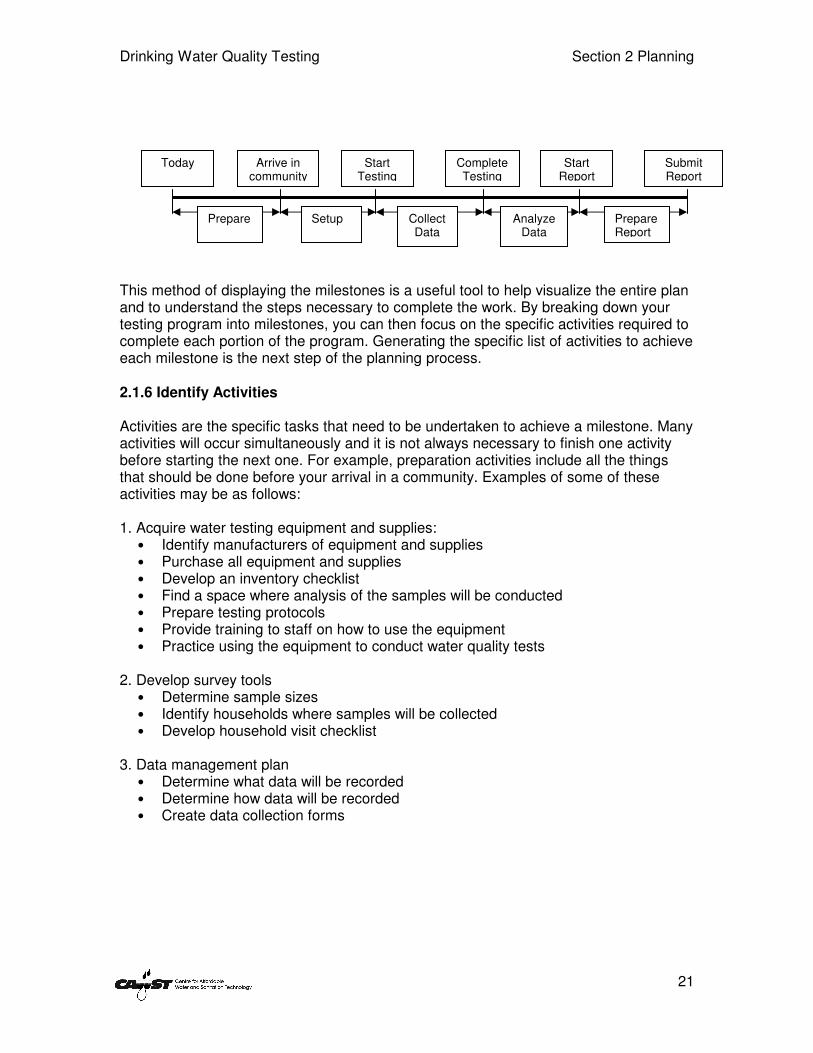
• Geographic Location Due to natural geological formations, some regions may be prone to arsenic, fluoride or other chemical contamination. In these areas, it may be a good idea to conduct water quality testing. Also, you may want to do testing near industrial or agricultural operations where there may be by-products that may cause water contamination. • Secondary Information Government agencies, research centres or international organizations may carry out a national or regional survey and report on the surface and ground water quality. This type of information provides a general idea of the local situation, which helps to determine the type of tests and parameters required for the area. 2.1.4 Identify Test Methods As mentioned in Section 1, there are many testing methods, tools and kits available to do microbiological, physical and chemical testing. Once you have selected which parameters you will be testing for, you will need to select which methods are more suitable to achieve your objectives. Sections 4, 5 and 6 provide a more in-depth understanding on different test methods for physical, chemical and microbiological parameters. 2.1.5 Determine Key Milestones The concept of milestones in the planning process was originally derived from engineering highways. A milestone or kilometre sign was placed along a road at regular intervals. This gave the traveler a better idea of the path being followed and the remaining distance to the desired destination. Similarly, a milestone within the planning process indicates what achievements are needed to be reached in order to meet the final goal. In planning your milestones, it is best to begin with the end in mind. Working back in time, determine the key milestones that have to be accomplished prior to completing the final report. The example below shows the key milestones on top and the major activities below starting from today and extending to the completion of the water quality testing program.
Drinking Water Quality Testing Section 2 Planning
21
This method of displaying the milestones is a useful tool to help visualize the entire plan and to understand the steps necessary to complete the work. By breaking down your testing program into milestones, you can then focus on the specific activities required to complete each portion of the program. Generating the specific list of activities to achieve each milestone is the next step of the planning process. 2.1.6 Identify Activities Activities are the specific tasks that need to be undertaken to achieve a milestone. Many activities will occur simultaneously and it is not always necessary to finish one activity before starting the next one. For example, preparation activities include all the things that should be done before your arrival in a community. Examples of some of these activities may be as follows: 1. Acquire water testing equipment and supplies:
• Identify manufacturers of equipment and supplies • Purchase all equipment and supplies • Develop an inventory checklist • Find a space where analysis of the samples will be conducted • Prepare testing protocols • Provide training to staff on how to use the equipment • Practice using the equipment to conduct water quality tests
2. Develop survey tools
• Determine sample sizes • Identify households where samples will be collected • Develop household visit checklist
3. Data management plan
• Determine what data will be recorded • Determine how data will be recorded • Create data collection forms
Today Arrive in community
Start Testing
Complete Testing
Start Report
Submit Report
Prepare Setup Collect Data
Analyze Data
Prepare Report
Drinking Water Quality Testing Section 2 Planning
22
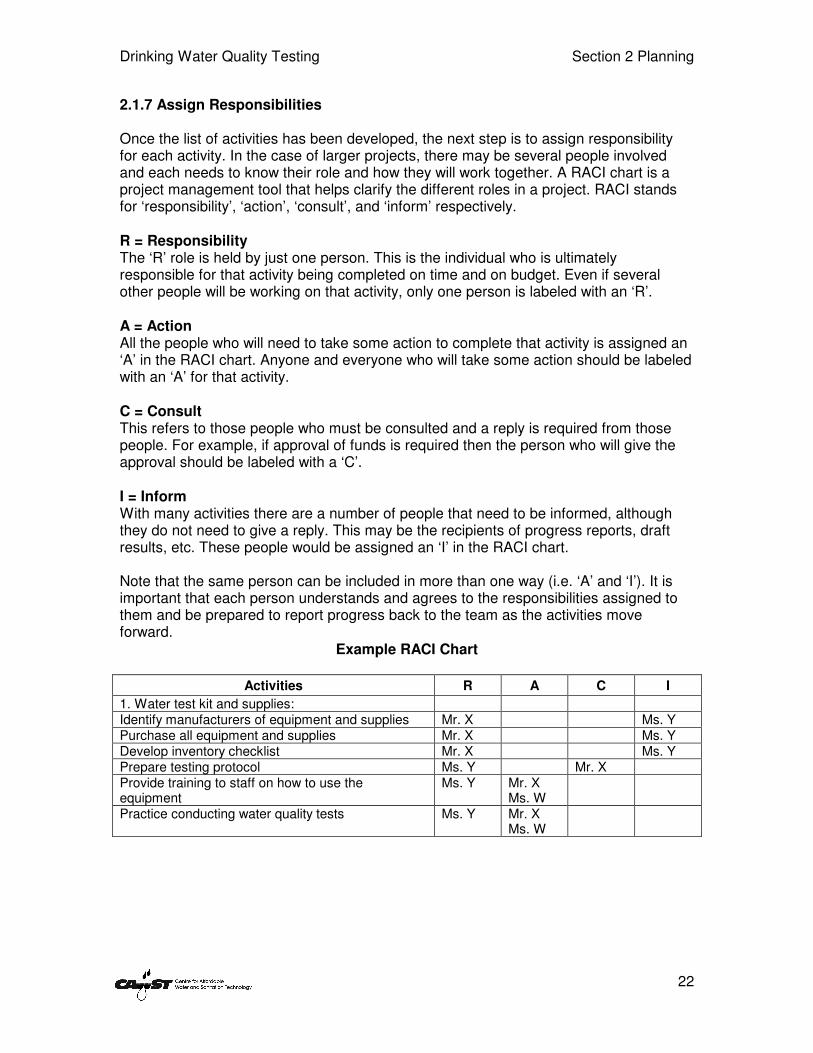
2.1.7 Assign Responsibilities Once the list of activities has been developed, the next step is to assign responsibility for each activity. In the case of larger projects, there may be several people involved and each needs to know their role and how they will work together. A RACI chart is a project management tool that helps clarify the different roles in a project. RACI stands for ‘responsibility’, ‘action’, ‘consult’, and ‘inform’ respectively. R = Responsibility The ‘R’ role is held by just one person. This is the individual who is ultimately responsible for that activity being completed on time and on budget. Even if several other people will be working on that activity, only one person is labeled with an ‘R’. A = Action All the people who will need to take some action to complete that activity is assigned an ‘A’ in the RACI chart. Anyone and everyone who will take some action should be labeled with an ‘A’ for that activity. C = Consult This refers to those people who must be consulted and a reply is required from those people. For example, if approval of funds is required then the person who will give the approval should be labeled with a ‘C’. I = Inform With many activities there are a number of people that need to be informed, although they do not need to give a reply. This may be the recipients of progress reports, draft results, etc. These people would be assigned an ‘I’ in the RACI chart. Note that the same person can be included in more than one way (i.e. ‘A’ and ‘I’). It is important that each person understands and agrees to the responsibilities assigned to them and be prepared to report progress back to the team as the activities move forward.
Example RACI Chart
Activities R A C I
1. Water test kit and supplies: Identify manufacturers of equipment and supplies Mr. X Ms. Y Purchase all equipment and supplies Mr. X Ms. Y Develop inventory checklist Mr. X Ms. Y Prepare testing protocol Ms. Y Mr. X Provide training to staff on how to use the equipment
Ms. Y Mr. X Ms. W
Practice conducting water quality tests Ms. Y Mr. X Ms. W
Drinking Water Quality Testing Section 2 Planning
23
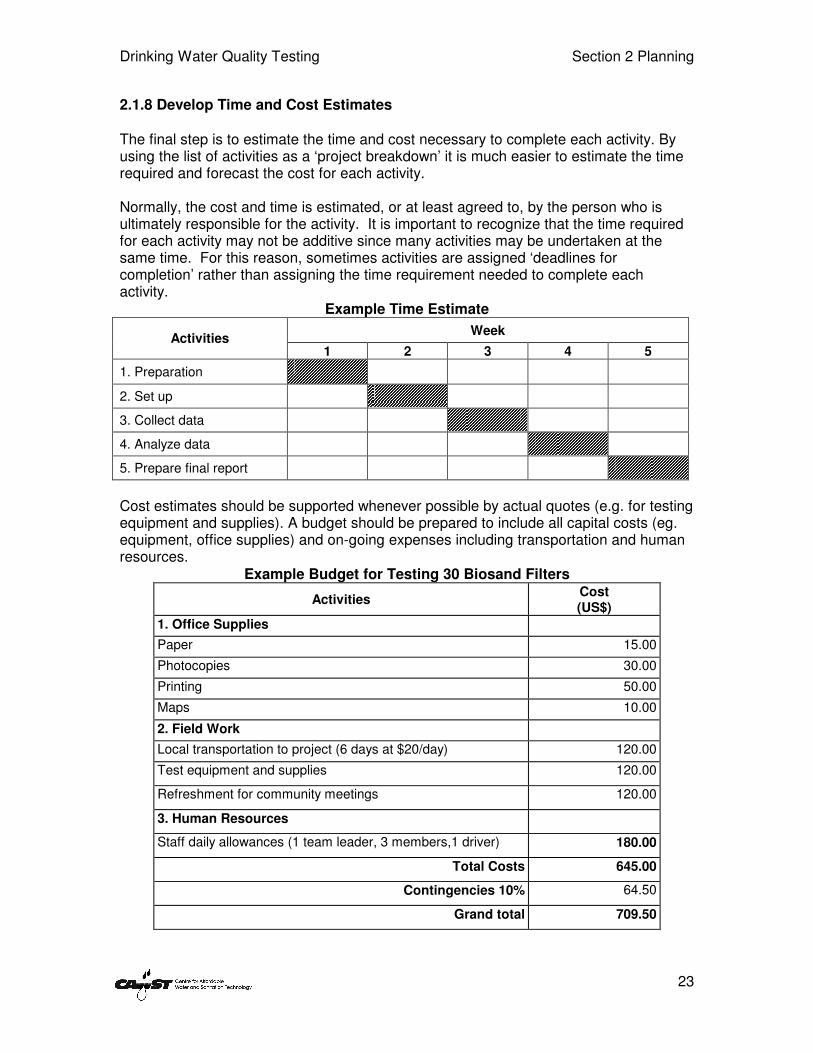
2.1.8 Develop Time and Cost Estimates The final step is to estimate the time and cost necessary to complete each activity. By using the list of activities as a ‘project breakdown’ it is much easier to estimate the time required and forecast the cost for each activity. Normally, the cost and time is estimated, or at least agreed to, by the person who is ultimately responsible for the activity. It is important to recognize that the time required for each activity may not be additive since many activities may be undertaken at the same time. For this reason, sometimes activities are assigned ‘deadlines for completion’ rather than assigning the time requirement needed to complete each activity.
Example Time Estimate
Week Activities
1 2 3 4 5
1. Preparation
2. Set up
3. Collect data
4. Analyze data
5. Prepare final report
Cost estimates should be supported whenever possible by actual quotes (e.g. for testing equipment and supplies). A budget should be prepared to include all capital costs (eg. equipment, office supplies) and on-going expenses including transportation and human resources.
Example Budget for Testing 30 Biosand Filters
Activities Cost (US$)
1. Office Supplies
Paper 15.00
Photocopies 30.00
Printing 50.00
Maps 10.00
2. Field Work
Local transportation to project (6 days at $20/day) 120.00
Test equipment and supplies 120.00
Refreshment for community meetings 120.00
3. Human Resources
Staff daily allowances (1 team leader, 3 members,1 driver) 180.00
Total Costs 645.00
Contingencies 10% 64.50
Grand total 709.50
Drinking Water Quality Testing Section 2 Planning
24
2.2 Summary of Key Points • A detailed plan for water quality testing is essential. • Planning in advance and thinking through the process will save time, lower costs,
satisfy stakeholders, and prevent surprises during the project. Moreover, it gives an idea of the financial and human resources that will be needed to carry out your testing.
• The main steps in the planning process are as follows:
1. Review the need for testing 2. Develop your objectives 3. Identify test parameters 4. Identify test methods 5. Determine the key milestones 6. Identify your activities 7. Set out responsibilities 8. Develop time and cost estimates
Drinking Water Quality Testing Section 2 Planning
25
Assignment: Prepare a Water Quality Testing Plan 1. Explain why you need to conduct water quality testing for your project. What are
your specific objectives? 2. Identify the key milestones required to meet your objectives. 3. Identify the specific activities that need to be undertaken to accomplish each
milestone. Answers: Question 1 (See Section 2.1.2) Question 2 (See Section 2.1.5) Question 3 (See Section 2.1.6)
Drinking Water Quality Testing Section 3 Water Sampling and Quality Control
26
3 Water Sampling and Quality Control The following section discusses how many water samples you need to take depending on your needs; how to collect and transport water samples from different sources; different measures that you can take to ensure quality control; and the importance of health and safety.
3.1 Determining the Sample Size
The following guidelines can help you to determine the sample size required for large and small projects. Small Projects (less than 100 households)
The sample size depends on the purpose of the water quality testing.
• For a trend analysis, 10-20% of households can be used as the sample size. If
resources are available, it would be good to test all the households in a small project. • For a statistical analysis, a minimum of 30 units is needed for sampling. For example,
30 children at a school, 30 filters in the village, or 30 households in the community.
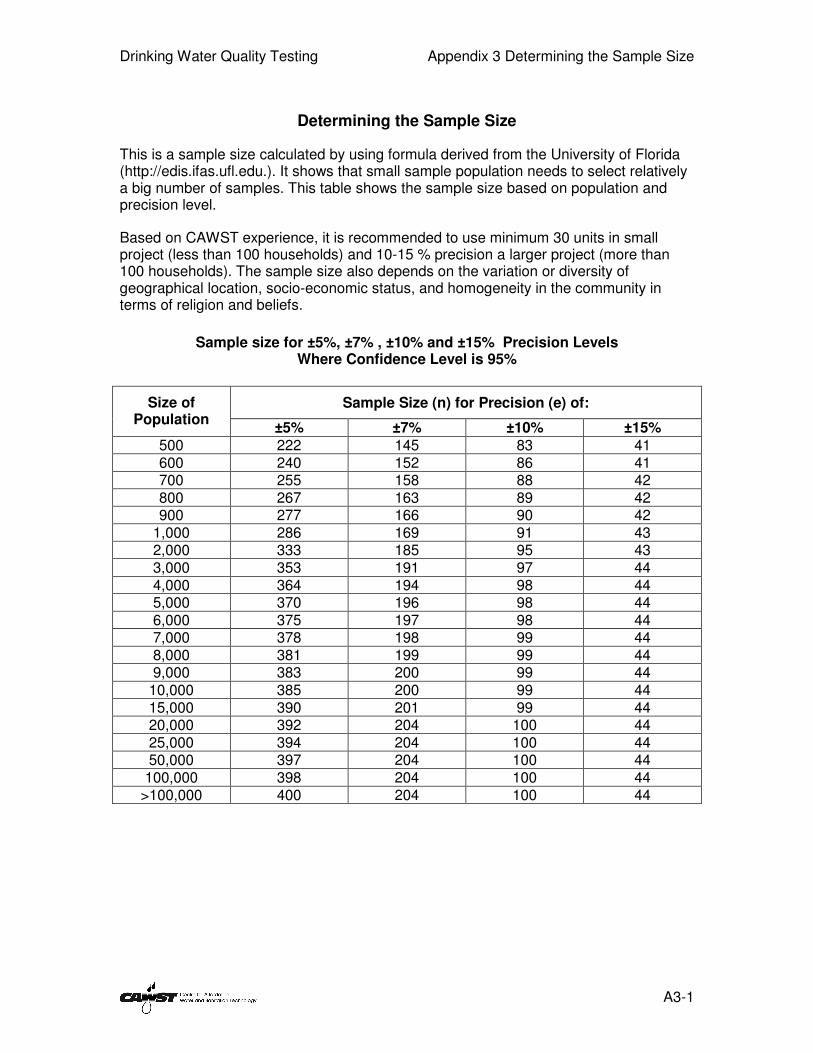
Large Projects (greater than 100 households) Geographical location and socioeconomic status should be considered during the sample selection. Before determining the sample size, the area should be divided into different geographical areas, such as high land, low land, or coastal areas, to get an accurate representation. Households should also be classified based on socioeconomic status such as high, medium, and low income. In general, 5-10% of the total households can be taken as a sample from each geographical area and each socioeconomic group. Appendix 3 explains sample size calculations by using a formula derived from the University of Florida. It shows that a small sample population requires the selection of a relatively large number of samples. The table in the appendix shows the sample size based on population and precision level. Based on CAWST’s experience, for large project, it is recommended that a 15-20% precision level be used for the sample size. Moreover, sample size depends on the variation or diversity of geographical location, socioeconomic status, and homogeneity in the community in terms of religion and beliefs.
“Sample size is primarily determined by money and politics, not statistics.”
~ Dr. Lawrence Grummer-Strawn, CDC (nd)
Drinking Water Quality Testing Section 3 Water Sampling and Quality Control
27
3.2 Choosing a Sampling Method Basically there are two types of sampling methods: probability and non-probability. • Probability sampling: every unit of the population has an equal chance (probability)
of being selected in the sample. • Non-probability sampling: does not use random selection. 3.2.1 Probability Sampling methods • Simple Random Sampling In this method, every unit of the population has an equal chance of being selected in the sample. A sample unit can be drawn either by using a random numbers table or by drawing a unit from the list of the total population. In this context, total population means the group of people, items or units under the study or research. We can use different methods to randomly select the participants, such as drawing names or numbers from a hat, or using a computerized random number generator (www.random.org).
For example, your sample size is 50 from a total population of 200 households. Write the name of each household in a separate piece of paper and put it into a container. Randomly select 50 names from the hat.
• Systematic Sampling In this method, a sample unit can be taken at particular intervals. The interval can be calculated by dividing the total number of units in the population by the number of units to be selected (sample size).
The following is an example of systematic sampling: • Your sample size is 100 households from a total population of 1000 households • 1000 divided by 100 = 10 households • from a list of the 1000 households, begin at a random household on the list, and
select every 10th household to be sampled
• Cluster Sampling In this method, the population is divided into clusters or groups, and some of these are then chosen by simple random sampling or by an alternative method. It is a good method to use for large projects. Samples taken from households of the same street or households with the same tribe are an example of cluster sampling. The population is divided into clusters,
Drinking Water Quality Testing Section 3 Water Sampling and Quality Control
28
For example, an organization wishes to find out the effectiveness of a technology in the project area. It would be too costly and take too long to survey every household in the project. Instead, 50 households are randomly selected from all households using a local pond as their water source. These households using a pond water source are considered as a cluster sampling.
• Stratified Random Sampling Stratified sampling methods are generally used when the population is heterogeneous. To choose a stratified random sample, divide the population into groups of individuals that are similar in some way that is important to the response.
For example, if you were interested in assessing the rate of technology adoption in terms of social status, select samples through stratified random sampling. In this context, the total population can be stratified by their economic status such as low income, medium income and high income.
3.2.2 Non-probability Sampling Methods Non-probability sampling does not use random selection. In this method, generalization of the findings is not possible because the sample is not representative of population. • Convenience Sampling Convenience sampling does not produce a representative sample of the population because people or items are only selected for a sample if they can be accessed easily and conveniently.
For example, this may include the first ten people meeting in a temple or the first row of people in a meeting.
• Purposive Sampling A purposive sample is one in which an evaluator tries to create a representative sample without actually sampling at random. One of the most common uses of purposive sampling is in selecting a group of geographical areas to represent a larger area.
For example, it is not feasible to do a house-to-house survey covering the whole country. Due to financial constraints only a small number of towns and cities can be sampled; therefore you might choose these in a purposive way.
Drinking Water Quality Testing Section 3 Water Sampling and Quality Control
29
• Quota Sampling Quota sampling is a type of stratified sampling in which selection within the strata is non-random.
For example, you have small project of 100 biosand filters and want to asses their effectiveness after 2 years. Your quota for the sample is 10%. Therefore, you only need to sample 10 filters to meet this quota. = 10% of 100 (sample size) = 10 filters
• Snowball Sampling This method is often used when you are trying to reach populations that are inaccessible or hard to find. The evaluator has a certain criteria they have to meet to be considered as a sample.
Drinking Water Quality Testing Section 3 Water Sampling and Quality Control
30
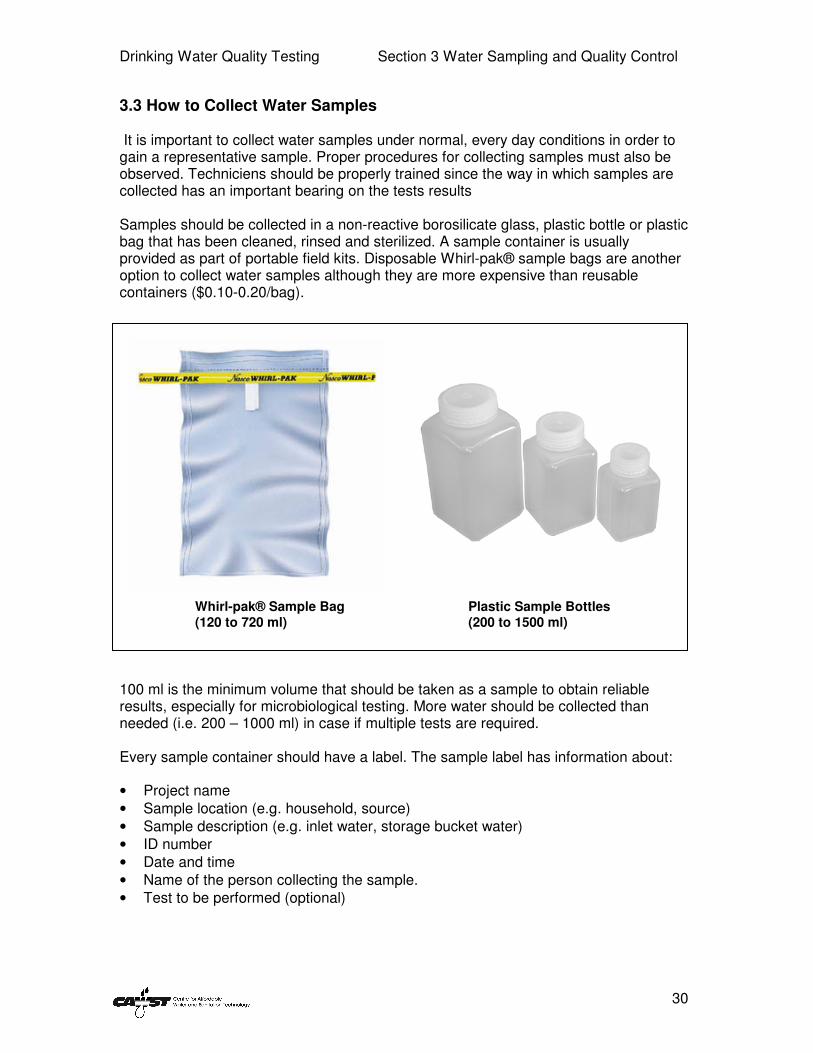
3.3 How to Collect Water Samples It is important to collect water samples under normal, every day conditions in order to gain a representative sample. Proper procedures for collecting samples must also be observed. Techniciens should be properly trained since the way in which samples are collected has an important bearing on the tests results Samples should be collected in a non-reactive borosilicate glass, plastic bottle or plastic bag that has been cleaned, rinsed and sterilized. A sample container is usually provided as part of portable field kits. Disposable Whirl-pak® sample bags are another option to collect water samples although they are more expensive than reusable containers ($0.10-0.20/bag). Whirl-pak® Sample Bag Plastic Sample Bottles (120 to 720 ml) (200 to 1500 ml)
100 ml is the minimum volume that should be taken as a sample to obtain reliable results, especially for microbiological testing. More water should be collected than needed (i.e. 200 – 1000 ml) in case if multiple tests are required. Every sample container should have a label. The sample label has information about:
• Project name • Sample location (e.g. household, source) • Sample description (e.g. inlet water, storage bucket water) • ID number • Date and time • Name of the person collecting the sample. • Test to be performed (optional)
Drinking Water Quality Testing Section 3 Water Sampling and Quality Control
31
You need to take care to avoid contaminating the container and the water sample. General procedures for collecting drinking water samples are as follows: • Do not touch inside of the sample container • Do not rinse the sample container • Do not put the cap of sample container on the ground while sampling • Always label the container before sampling
(Adapted from WHO, 1997). You can reuse heat resistant plastic and glass sample containers but you will need to sterilize them in an autoclave or a pressure cooker. If these are not available, you can boil them and let them dry with their lid partially closed until they cool down, then close tight to avoid contamination. If another person is assigned to take a water sample, you must tell them about: • The purpose for which the analysis is required • The location, number and type of samples required • The accuracy and precision of analysis required • The required reporting forms 3.3.1 Sampling a Surface Water Source You should try to obtain samples that are representative of the source of the drinking water supply. Do not take samples that are too near the bank, too far from the point of draw off, or at a depth above/below the point of draw off. Water quality can change depending on the time of day or season. It is important to sample at the same time of day and record the weather conditions when you are taking your sample. It may be possible to take samples by hand if it is easy to get the water. In many cases it may be inconvenient or dangerous to enter the water source such as river, pond or canal. In these cases, you may need to tie your container to a piece of wire or rope and throw it into the water. To sample the water: • Grasp the sample container firmly and dip the open mouth of the container into the
water. • Submerge the container about 30 cm below the surface of the water and scoop up
the water sample. This scooping action ensures that no external contamination enters the sample container.
• Lift the sample container carefully and place on a clean surface where it cannot be knocked over.
In areas where the water is moving water (e.g. rivers and streams) the sample should be taken against the direction of flow.
Drinking Water Quality Testing Section 3 Water Sampling and Quality Control
32
3.3.2 Sampling an Open Well
• Fasten a cable, rope or string to the sample container. • Lower the sample container into the well or tank, taking care not to allow the
container to touch the walls of the structure where it may pick up dirt. • Submerge the container to a depth of 30 cm. Lift the sample container carefully and
place on a clean surface.
3.3.3 Sampling a Pump
• Pump water to waste for 5-10 minutes or until the water temperature has stabilized. • Take a water sample with the sample container.
3.3.4 Sampling a Tap
• Remove any attachments (e.g. nozzles, pipes) from the tap. • Carefully clean and disinfect the inside and outside of the tap. • Open the tap and let water flow for 2-3 minutes before taking a sample. This
ensures that any deposits in the pipes are washed out. • Take a water sample with the sample container.
3.3.5 Sampling a Storage Container
• Pre-treatment Your technique will also depend on type of storage container. If possible, lower the sample container into the tank, taking care not to allow the container to touch the walls of the container where it may pick up dirt. Submerge the container to a depth of 30 cm. Lift the sample container carefully and place on a clean surface.
• Post-treatment Carefully take off the lid (if available) of the stored container and pour water into the sample container. Do not use the ladle or dipping cup that the household may use as it may introduce contamination which is not from the storage container.
3.3.6 Sampling a HWT Technology
Many project implementers are concerned about the effectiveness of their HWT technology and want to make sure that it is effectively removing pathogens from drinking water. In this case, it is only worthwhile to carry out water quality testing if the technology is being operated and maintained properly. We already know that any technology will not produce good quality water if it is not being used correctly, so it is not worth spending money on water quality testing. Therefore any HWT technology which is not fulfilling the normal operating conditions should be recorded as “not operating properly (NOP)” and no samples should be taken.
Drinking Water Quality Testing Section 3 Water Sampling and Quality Control
33
The following 8 conditions for a biosand filter must be checked before taking a water sample: • Filter is being used for more than one month since installation • Diffuser is in good condition and placed properly • Flow rate is equal to or less than 0.6 L/minute • Water level is 5 cm above the sand • Top of sand is level • Inlet water turbidity is less than 50 NTU • Filter is used daily • No leaks To take a sample from a biosand filter, first clean and disinfect the outlet pipe. Pour a bucket of water into the filter until it is full. Take a sample of the outlet water into the sample container. Note that the sample you are taking is actually the water that has been sitting in the filter during the pause period and it may not match the source of the water that was just poured into the filter. The following 3 conditions for a ceramic filter must be checked before taking a water sample: • No visible cracks or breaks in the ceramic filter container • Flow is not more than 2 L/hour To take a sample from a ceramic filter, first clean and disinfect the tap. Open the tap and fill the sample container. The following 5 conditions for SODIS must be checked before taking a water sample: • Bottles are made of clear, PET plastic • Size of bottles is not greater than 10 cm (4”) in diameter • Bottles have a lid and does not leak • Bottles are not scratched and/or dirty • Bottles are kept at least 6 hours or more in the sun
3.4 How to Transport Water Samples Bacteria do not generally survive well in water due to a variety of factors. It is well known that the numbers of bacteria within a water sample rapidly decline 24 hours after it has been collected. Temperature can also affect die off within the water sample, with higher temperatures leading to greater die offs. Samples should be collected and placed on ice in an insulated container if they cannot be tested immediately; preferably held at <10 °C during transit. Samples should be tested the same day and refrigerated overnight if necessary. If the time between collection and test exceeds 6 hours, the final report should include information on the conditions and duration of sample transport. Samples exceeding 30 hours holding time (from collection to testing) should not be tested (BCCDC, 2006; Bartram et al., 1996).
Drinking Water Quality Testing Section 3 Water Sampling and Quality Control
34
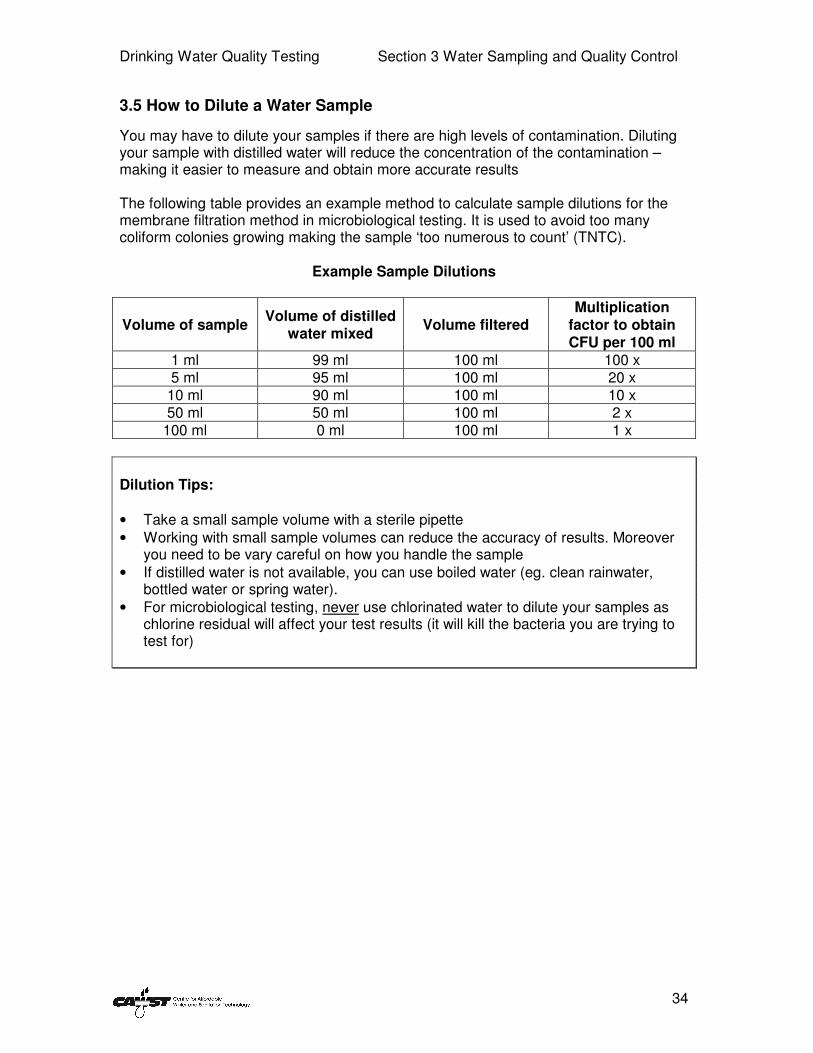
3.5 How to Dilute a Water Sample
You may have to dilute your samples if there are high levels of contamination. Diluting your sample with distilled water will reduce the concentration of the contamination – making it easier to measure and obtain more accurate results The following table provides an example method to calculate sample dilutions for the membrane filtration method in microbiological testing. It is used to avoid too many coliform colonies growing making the sample ‘too numerous to count’ (TNTC).
Example Sample Dilutions
Volume of sample Volume of distilled
water mixed Volume filtered
Multiplication factor to obtain CFU per 100 ml
1 ml 99 ml 100 ml 100 x 5 ml 95 ml 100 ml 20 x 10 ml 90 ml 100 ml 10 x 50 ml 50 ml 100 ml 2 x
100 ml 0 ml 100 ml 1 x
Dilution Tips: • Take a small sample volume with a sterile pipette • Working with small sample volumes can reduce the accuracy of results. Moreover
you need to be vary careful on how you handle the sample • If distilled water is not available, you can use boiled water (eg. clean rainwater,
bottled water or spring water). • For microbiological testing, never use chlorinated water to dilute your samples as
chlorine residual will affect your test results (it will kill the bacteria you are trying to test for)
Drinking Water Quality Testing Section 3 Water Sampling and Quality Control
35
3.6 Ensuring Quality Control
When we carry out repeated tests many times on the same sample of water, it will rarely happen that we get the same results each time. This is due to the inherent variability associated with all analytical techniques. Therefore, the result of a water quality test is only a best-estimate or approximation of the true value of what is being measured. It is not possible to tell if a test result is exactly right. Scientific research studies often explain the level of precision including details of the statistical analysis that was conducted on the results. Statistical analysis of test results is a complex subject and falls outside the scope of this manual. This section, therefore presents only a simplified discussion of the most important aspects of quality control during sampling and testing. There are two types of errors which commonly contribute during water quality testing: random and systematic. Random errors (often related to precision) occur from many different non-measurable contributing sources. The following are the potential sources of random error: • Non-detectable variance in individual measurements used in the overall
measurement such as volume, mass and scale values • Fluctuations in light intensity, temperature, humidity, power supply and
electromagnetic effects • Human variance • Non-detectable deterioration in resources - human (alertness/fatigue), equipment
(calibration/standardization) and chemicals (quality) Systematic errors (often related to bias) occur from different measurable sources or valuable judgment which can be determined, reduced and in some cases eliminated. Systematic errors usually produce a bias (or shift) of the result from the true value. The sources of such error can be associated with the measurement technique such as poor training of the analysts and poor calibration of equipment. The major strategies for reducing the role of random and systematic errors are:
• Increase sample size – a larger sample will yield more precise estimates of population parameters
• Reduce measurement variability by using strict measurement protocols, better instrumentation, or averages of multiple measurements
• Improve sampling procedures – a more refined sampling strategy (e.g., stratified random sampling combined with the appropriate analytic techniques can often reduce sampling variability compared to simple random sampling)
• Use water quality testing forms to record the name of samples and other values Regardless if you are conducting field or laboratory testing, a quality control system should be designed from the planning stage to help reduce errors. Your system will be simpler for field testing, but it should have a basic set of operating principles, practices and actions necessary to remove or reduce errors caused by personnel, equipment, supplies and analytical methodology. In general a quality control system should include the following:
Drinking Water Quality Testing Section 3 Water Sampling and Quality Control
36
• Staff organization and responsibilities • Documenting all policies, procedures and methods for laboratory activities. • Proper training for anyone taking water samples or conducting tests (e.g.
Community Health Promoters, Product Manufacturers) • Maintenance of equipment including calibration • Validating test methods so that the capability of each method is known in terms of
accuracy, precision, working range and detection levels. • Maintaining all sampling records and test results • Ensuring that results are reported clearly
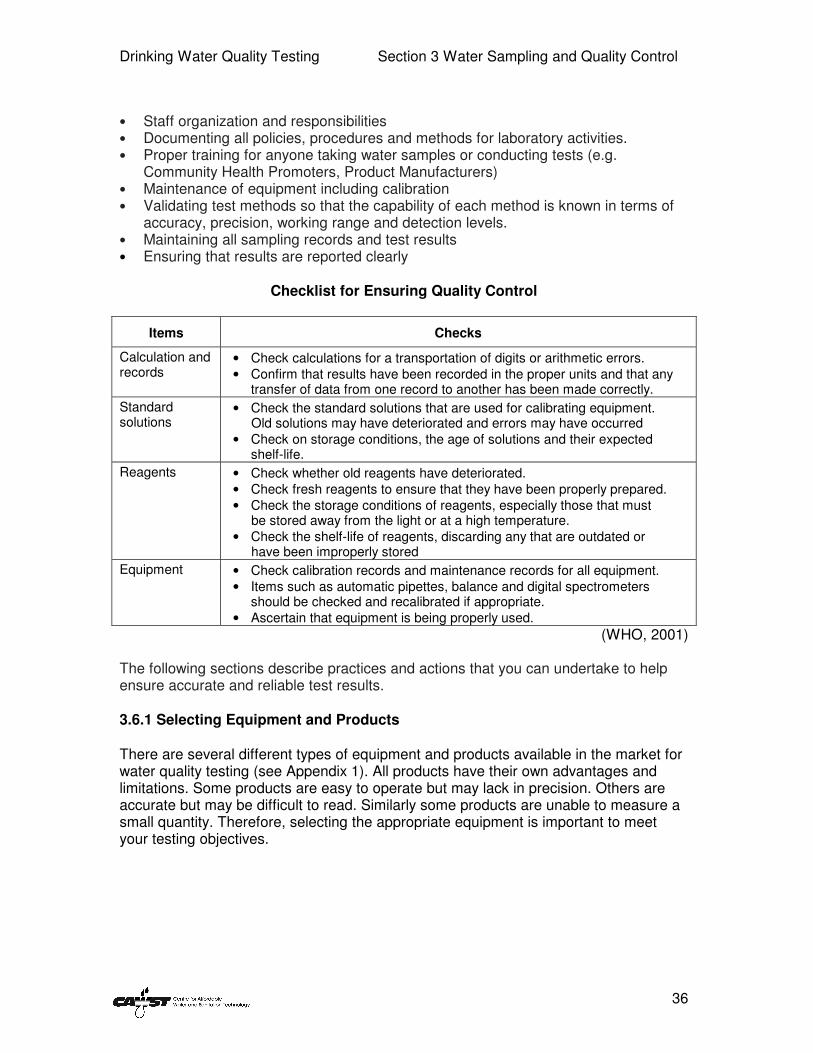
Checklist for Ensuring Quality Control
Items Checks
Calculation and records
• Check calculations for a transportation of digits or arithmetic errors. • Confirm that results have been recorded in the proper units and that any
transfer of data from one record to another has been made correctly.
Standard solutions
• Check the standard solutions that are used for calibrating equipment. Old solutions may have deteriorated and errors may have occurred • Check on storage conditions, the age of solutions and their expected
shelf-life.
Reagents • Check whether old reagents have deteriorated. • Check fresh reagents to ensure that they have been properly prepared. • Check the storage conditions of reagents, especially those that must be stored away from the light or at a high temperature. • Check the shelf-life of reagents, discarding any that are outdated or have been improperly stored
Equipment • Check calibration records and maintenance records for all equipment. • Items such as automatic pipettes, balance and digital spectrometers
should be checked and recalibrated if appropriate. • Ascertain that equipment is being properly used.
(WHO, 2001) The following sections describe practices and actions that you can undertake to help ensure accurate and reliable test results. 3.6.1 Selecting Equipment and Products There are several different types of equipment and products available in the market for water quality testing (see Appendix 1). All products have their own advantages and limitations. Some products are easy to operate but may lack in precision. Others are accurate but may be difficult to read. Similarly some products are unable to measure a small quantity. Therefore, selecting the appropriate equipment is important to meet your testing objectives.
Drinking Water Quality Testing Section 3 Water Sampling and Quality Control
37
1 2 3 4 5 6 7 8 9 10 11 12 13 14
Example A supplier produces test strips for measuring pH. Two products are available. One with a range between pH 1 to 14 and another with a range of 6.5 to 10.0. As drinking water usually lies between 6.5 and 8.5 the second strip is more suited to our work and provides better precision. Product 1 Product 2
3.6.2 Equipment Calibration It is important to calibrate equipment according to the manufacturer’s specifications to get good results. Most electronic equipment will require some sort of calibration. Commonly used equipment that requires proper calibration include pH meters, turbidimeters, and photometers. Before starting microbiological testing, it is important the check and calibrate the temperature of the incubator. The incubation temperature is dependent upon the type of media and the test to be carried out. Therefore understanding the procedure and recommendations of different methods is essential to get accurate results. These procedures and recommendations can be obtained by the product manufacturer. Some portable test kits can be easily calibrated according to the specific test needs. Manufacturers usually supply the instructions for calibration. It is recommended that the temperature of the incubator be checked before a batch of testing. The calibration process can take up to 2 hours.
Important Note: Incubators operating over the recommended temperature range can give you completely inaccurate results.
3.6.3 Quality of Consumables and Culture Media Most consumables and culture media have a shelf-life and should be used before they expire. Some need to be stored in a refrigerator while others need to be kept in a cool and dry place. You should follow the manufacturer’s instructions help to protect the life of the reagents and their effectiveness.
Drinking Water Quality Testing Section 3 Water Sampling and Quality Control
38
Reliability of the reagents and media is important so you may also want to test them with a known level of contamination. You should also check the following prior to using them: • Expiry date • Date manufactured • Condition upon delivery • Reagent’s catalogue and instruction Large projects should monitor the quality of reagents, media and membranes on a regular basis. Whenever you need to order new products, it is a good idea to compare them with those currently in use. Appendix 4 describes more about the quality control for culture media. 3.6.4 Unequal Distribution of Microorganisms in a Water Sample One factor that can significantly affect test results is the uneven distribution of microorganisms in any one water source and even within one water sample. This happens because bacteria like to clump together and may also stick to the sides of your sample container. It is not uncommon for independent tests performed from a single water sample, and using the same test method, to produce slightly different results. Test results are most variable when microorganisms are present in very low concentrations (BCCDC, 2006).
Important Note: It is recommended to thoroughly shake any water sample for at least 10 seconds before testing to help ensure an even distribution of microorganisms throughout the water.
3.6.5 Secondary Contamination Water samples for microbiological testing need to be handled carefully to avoid secondary contamination. The following steps should be undertaken to enhance the quality of test results.
• Wash hands before starting work • Regularly clean your working area with disinfectant • Put testing equipment in a clean place • Never touch the inside of equipment (e.g. sample containers, Petri dishes, test
tubes) • Never eat, drink or smoke when carrying out tests • Wear gloves if you have any open wounds • If testing from more than one source at the same time, test the least contaminated
samples first (e.g. test filtered water first, then storage water, and test source water last)
Drinking Water Quality Testing Section 3 Water Sampling and Quality Control
39
Equipment must be cleaned and sterilized thoroughly before each use to avoid secondary contamination and ensure accurate results. Manufacturers usually include instructions on how to sterilize their equipment. Some methods for disinfecting equipment in the field are: • Dry heat: The flame from a gas cigarette-lighter, for example, can be used to
disinfect forceps used for holding membrane filter paper. It must be a butane or propane gas lighter, not one that uses gasoline or similar liquid fuel or matches, which would blacken the forceps.
• Formaldehyde: This gas is a powerful bactericide. It is generated by the combustion
of methanol (but no other alcohol) in a closed space where oxygen becomes depleted. In the field, this is a convenient way to disinfect the filtration apparatus between uses. Wait 5 minutes to ensure sterilization.
• Disinfecting reusable materials: Reusable materials, such as Petri dishes (glass or
metal), may be disinfected by putting them in boiling water for 15 minutes, by heating them at 180
oC for 30 minutes in an oven, or by heating in a pressure cooker for at
least 20 minutes. • Never use bleach, chlorine or disinfectants that may leave a residue without properly
rinsing (with distilled water) or boiling the equipment afterwards. The residue may affect results by inhibiting or killing the bacteria you are trying to test for.
(Adapted from WHO, 1996)
3.6.6 Multiple Sampling Duplicate or triplicate samples can be collected to enhance the reliability of the test. They are independent samples taken from the same location at approximately the same time. It is recommended to collect duplicate or triplicate samples at a rate of 5% (see box below); however it depends on the availability of resources (WHO, 1996).
Example of duplicate sampling at 5% A rate of 5% duplicate samples means you need to duplicate every 1 in 20 samples. So if you plan to test 100 samples of water, you will need to take a duplicate sample of sample number 20, 40, 60, 80 and 100. So you will end up with 5 more samples to test. It is important that you collect the duplicate in a different container as this will help identify possible errors in sample collection.
Drinking Water Quality Testing Section 3 Water Sampling and Quality Control
40
3.6.7 Controls: Blank Sampling and True Positives Blank samples help with quality control to make sure that secondary contamination is not taking place. Method blanks and, where possible, field blanks should be tested with your samples. A method blank uses distilled water, although boiled water can be used if distilled water is not available. You test the method blank the same as your field samples. If the method blank shows any results from the test, then you know that there was some secondary contamination. A field blank is distilled water that has been bottled in the laboratory, transported with sample bottles to the site, preserved and transported back with the other samples for testing.
Important Note: It is recommended to use blank samples 5% of the time during the testing process. This means you have to add 1 blank sample in every 20 samples
A true positive sample is the opposite of a blank sample. You use (or create) a sample which you are certain has fecal contamination. A long stick in a pit latrine or any other method should help you create the sample (remember 1g of feces contains over millions of coliform bacteria). Be careful not to cross-contaminate your other samples with this highly contaminate sample. Make sure to filter this sample last. If no growth occurs in this sample there may be a problem with your culture media or incubator. 3.6.8 Reading Test Results Correct reading of the test results is also important for quality control. Reading results can be subjective depending on the individual who is doing the test. For example, chemical tests that use test strips need to have an accurate colour match which relies on a visual observation. People who are conducting microbiological testing should be trained on how to properly read the results since they can be more complicated to interpret. Section 6 provides more information on how to read microbiological test results.
Drinking Water Quality Testing Section 3 Water Sampling and Quality Control
41
3.7 Checklist for Field Work The following are things to remember to bring when you go to the field to take water samples and conduct tests. For sampling
• Sample bottles (sterilized), labels and marker pens • Transport containers and ice packs to keep the samples cool • Spares of all above items For documentation
• Pens • Sample labels • Field notebook • Data sheet For testing
• List of tests to be performed on site • Test procedures and equipment manuals • Testing equipment • Consumables (including distilled water, pH buffers, standards and blanks) • Check and calibrate any electronic meters (pH, turbiditimeter and incubator) • First-aid kit
3.8 Health and Safety It is important to work safely and avoid injuries while carrying out water quality testing. It is the responsibility of the project implementer to provide safety equipment, but it is the responsibility of each individual to use the equipment properly and to request equipment if it is not available. It is also the responsibility of project implementer to provide safety training to anyone involved in water sampling and testing. In addition, the technician should understand any special hazards and risks associated with specific chemicals such as arsenic and methanol and follow the prescribed safety precautions. Samples and any waste generated during the testing process may contain pathogens or chemicals that may be harmful to health and must be properly and safely disposed. See section 6 on how to dispose of waste.
Drinking Water Quality Testing Section 3 Water Sampling and Quality Control
42
3.9 Summary of Key Points • The sample size will differ between small and large projects. • There are two types of sampling methods: probability and non-probability. • The goal of water sampling is to collect the sample under normal, every day
conditions in order to gain a representative sample of the water source. • Many project implementers are concerned about the effectiveness of a HWT
technology and want to make sure that it is effectively removing pathogens from drinking water. It is only worthwhile to carry out water quality testing if the technology is being operated and maintained properly. Samples should not be taken from any HWT technology which is not fulfilling the normal operating conditions.
• The numbers of bacteria within a water sample rapidly decline 24 hours after it has
been collected. Samples should be collected and placed on ice in an insulated container if they cannot be analyzed immediately. Samples should be analyzed the same day and refrigerated overnight if necessary. Samples exceeding 30 hours holding time (from collection to testing) should not be tested.
• There is an inherent variability associated with all analytical techniques. Therefore,
the result of a water quality test is only a best-estimate or approximation of the true value of being measured.
• There are two types of errors which commonly contribute during water quality
testing: random errors and systematic errors. • Regardless if you are conducting field or laboratory testing, a quality control system
should be designed to help reduce errors. • It is not uncommon for independent tests performed from a single water sample,
and using the same test method, to produce slightly different results. Test results are most variable when microorganisms are present in very low concentrations.
• It is the responsibility of the project implementer to provide safety equipment and
training to anyone involved in water sampling and testing.
Drinking Water Quality Testing Section 3 Water Sampling and Quality Control
43
Quality Control Summary
During sampling
• Label the bottle before taking a water sample • Do not touch the inside of the bottle • Do not rinse the bottle • Do not put the bottle cap on the ground while sampling During testing
• Wash hands before starting work • Regularly clean your working area with disinfectant • Put testing equipment in a clean place • Never eat, smoke or drink when carrying out water quality tests • Cover wounds with a waterproof dressing or wear gloves • Never touch the inside of equipment – sample containers, Petri dishes, measuring
containers • Calibrate equipment according to directions • Check to ensure reagents have not expired During sterilization • Sterilize equipment between uses • Boil metal or glass equipment for 15 minutes OR • Heat in pressure cooker for 20 minutes OR • Heat in oven at 180°C for 30 minutes Microbiological testing
• Never touch part of the filtration apparatus such as the bronze disc and the collar • Do not touch colonies with your fingers or with everyday objects such as pens and
pencils that you may use again for other purposes • Do not carry out microbiological tests in areas of food preparation • Open Petri dishes for a minimum time possible • If testing more than one type of water sample at the same time, test least
contaminated first (e.g. treated water, stored water, transport water, source water) • Properly dispose all waste materials • Use multiple samples Health and Safety
• Provide safety training for technicians • Provide safety equipment for technicians • Identify any special hazards/risks associated with the tests you are conducting (i.e.
arsenic, methanol) • Properly dispose of waste that may contain pathogens and/or chemicals
Drinking Water Quality Testing Section 3 Water Sampling and Quality Control
44
3.10 References BCCDC Environmental Health Laboratory Services (2006). Safe Drinking Water: Public Health Laboratory Surveillance Update. British Columbia, Canada. Available at: www.vch.ca/environmental/docs/water/safe_drinking_water.pdf Life Water International (2004). Water Quality Testing: A Key to Avoiding Health Risks Simple Test procedures for Rural Drinking Water Sources. Life Water International. San Luis Obispo, USA. Available at: www.medrix.org/SafeWater/Lifewater%20WaterTesting%20040625.pdf Schoenbach, V.J., Schildkraut, J. and W. Rosamond (2004) Sources of Error. Available at: www.epidemiolog.net/evolving/SourcesofError.pdf Thompson T, Farwell J., Kunikane S., Jackson D., Appleyard S.,Callan P, Bartram J and P. Kingston (2007). Chemical Safety of Drinking-water: Assessing Priorities for Risk Management, World Health Organisation, Geneva Switzerland. Available at: http://whqlibdoc.who.int/publications/2007/9789241546768_eng.pdf
World Health Organization (1997). Guidelines for Drinking Water Quality, Volume 3, Surveillance and Control of Community Supplies, Geneva. Available at: www.who.int/water_sanitation_health/dwq/gdwq2v1/en/index2.html
Drinking Water Quality Testing Section 4 Physical Contaminants
45
4 Testing for Physical Contaminants The physical characteristics of drinking water are usually things that we can measure with our own senses: turbidity, colour, taste, odour and temperature. In general, we judge drinking water to have good physical qualities if it is clear, tastes good, has no smell and is cool.
4.1 WHO Guidelines for Physical Parameters The appearance, taste and odour of drinking water should be acceptable to the consumer. The table below shows the WHO Guidelines for Drinking Water Quality for physical parameters.
WHO Guidelines for Drinking Water Quality: Physical
Parameter WHO Guideline
Colour Aesthetic value of < 15 True Colour Units (TCU)
Odour Aesthetic only, no health based value is proposed
Temperature Aesthetic only, no health based value is proposed
Turbidity < 5 NTU
(WHO, 2007)
4.2 Potential Health Effects Physical contaminants generally do have not direct health effects themselves; however, their presence may relate to a higher risk of microbiological and chemical contamination which may be harmful to human health. For example, increased turbidity levels are often associated with higher levels of disease-causing pathogens such as viruses, parasites and some bacteria (WHO, 2007).
4.3 Test Methods Drinking water samples can be tested for the following physical parameters: colour, odour, taste, temperature and turbidity. A data recording form for water quality testing is available in Appendix 5. 4.3.1 Colour Colour in drinking water may be due to the presence of coloured organic substances and certain metals such as iron, manganese and copper. In general, colour of a water sample is evaluated by simple visual observation. It can also be measured by visual comparison with a series of standard solutions. 4.3.2 Odour and Taste In general, odour and taste are evaluated by observation. When smelling a water sample from an unknown source, do not breathe the odour in directly. Use your hand to gently waft the vapours towards your nose. Never drink a sample from an unknown source.
Drinking Water Quality Testing Section 4 Physical Contaminants
46
4.3.3 Temperature A thermometer is used to measure the temperature of water. 4.3.4 Turbidity Turbidity is the cloudiness of water that is caused by suspended particles. An increase in turbidity means that there is increased cloudiness. Turbidity is usually caused by suspended particles of sand, silt and clay.
Nephelometers measure the intensity of light scattered by the suspended particles. The result is a measurement of turbidity in nephelometric turbidity units (NTU). The WHO Guideline for turbidity in drinking water is less than 5 NTU. A simple test to measure the turbidity is to use a 2 L clear plastic bottle filled with the sample water. Place this on top of large print such as the CAWST logo on this manual. If you can see this logo looking down through the top of the bottle, the water probably has a turbidity of less than 50 NTU. Turbidity tubes are another easy and cheap way to visually estimate NTU. DelAgua and Wagtech portable test kits provide turbidity tubes or you can build one yourself using the following instructions. Equipment required (makes three tubes):
• 8 foot clear plastic tube (e.g. tubes used to hold fluorescent light bulbs)
• 3 - 1 9/16 to 1 5/8 inch Plexiglas discs
• 3 - 1½ inch white Plexiglas discs
• Sharp knife or scissors
• Black permanent marker or electrical tape
• Plexiglas sealant
• Measuring tape or ruler 1. Using the knife-cut the 8 foot plastic tube into three equal lengths (32 inches). 2. Insert the 1 9/16 to 1 5/8 inch white Plexiglas disc into one end and seal with Plexiglas
sealant. If disc has a center hole, plug it with sealant. (Note: this will likely have to be treated with sealant more than once to fill all spaces. An easy way to check to see if more sealant is necessary, is to blow into the tube at the opposite end of the disc and feel if air escapes near the end with the disc inserted into it.)
3. Using the black marker or electrical tape, color half of the white Plexiglas disc or color two opposite quadrants black, similar to a secchi disc.
4. Drop the white and black disc into the tube. 5. Starting from the top of the target draw a line around the tube, leaving a space in the
circular line for a label. 6. As shown in the illustration, draw lines at the heights above the target according to the
following table.
Drinking Water Quality Testing Section 4 Physical Contaminants
47
Note that turbidity unit labels are not always equally spaced, therefore you cannot estimate NTUs between lines on the turbidity tube (Peterson, nd). Line Heights on Plastic Tube
Line Distance above target
(inches) Turbidity Units
(approximate NTU)
1 2.875 200
2 4.5 100
3 7.5 50
4 12.25 20
5 17 15
6 20.75 10
There are also different types of electronic turbidimeters that you can buy from companies like Hach and Wagtech. A turbidimeter is operated by a battery or power supply and it gives the digital reading of the turbidity level. Although it is more expensive and vulnerable to damage, the turbidimeter gives more accurate results. It has the capacity to measure a wide range of turbidiy levels and is useful to measure filtered water which may have levels less than 10 NTU.
Wagtech Turbidimeter
(Wagtech, nd)
Drinking Water Quality Testing Section 4 Physical Contaminants
48
4.4 Interpreting Test Results In general, we judge drinking water to have good physical qualities if it is clear, tastes good, has no smell and is cool. 4.4.1 Colour Levels of colour above 15 TCU can be detected in a glass of water by most people, although it generally does not pose a health threat. Colour may occur in drinking water for any one or more of several reasons. It may be due to the presence of: • Natural organic matter and vegetation, such as leaves and bark • Metals such as iron, manganese and copper, which are abundant in nature and are
naturally coloured (see section 5.6 for more information about testing chemicals) • Highly coloured industrial waste, the most common of which are pulp and paper and textile
waste
Colour Observations
Observations Possible Contaminants
Foamy Detergents
Black Manganese, bacteria growth
Brown, yellow or red Iron
Dark brown or yellow Tannins and pigment from vegetation
White deposits or scale Hardness, dissolved metals
(Adapted from Singh et al., 2003)
The colour of surface water is mainly due to natural organic matter. In general, hard surface water is less coloured than soft surface water. The colour of groundwater is usually due to it’s the presence of metals, such as iron, manganese and copper. In some areas, especially those associated with limestone, the colour of groundwater from both shallow
and deep
wells may be
from natural organic matter (Health Canada, 1995). The presence of colour in water may have an effect on the measurement of turbidity. As well, moderate colour in certain types of water may have an adverse effect upon the removal of turbidity by coagulation and sedimentation (Health Canada, 1995). Water that is coloured with organic matter can also reduce the effectiveness of disinfection with chlorine and make it difficult to produce free residual chlorine.
Drinking Water Quality Testing Section 4 Physical Contaminants
49
4.4.2 Odour and Taste Although taste and odour are not parameters of health concern, they are perhaps the most important characteristics of drinking water from the point of view of the user. It is next to impossible to convince people that water is safe to drink if it either tastes or smells bad. Bad taste and odour may cause people to reject the water in favour of another. A common example is chlorine. People often dislike the taste and smell of over-chlorinated water (in the context of a new water supply or household chlorination initiative) and will prefer to go back to a possibly contaminated drinking water source. Guidance in proper dosage and awareness raising should always accompany supply of chlorinated water. Newly drilled boreholes in ground with high concentration of iron, or which have not been properly disinfected after drilling can develop a smell and taste over time. The well could eventually be abandonded. A similar scenario can occur with saline (salty) aquifers. Althought taste and odour themselves do not pose a health threat, they may indicate chemical or biological contamination, especially when a change happens quickly. Poor taste or odour may suggest the need for more testing.
Odour Observations
Odour Observations Possible Contaminants
Earthy, musty, mouldy
• Most frequently observed
• May be detected only after addition of chlorine
• Can be produced by specific bacteria called actinomycetes
• Very low concentrations can lead to complaints
Grass, hay, straw, wood • Often associated with algal by-products and sometimes described as decayed vegetation
Marshy, swampy, septic,
sewage, rotten egg
• Very offensive
• Sulphur that is natural or human made
Chlorine • Chlorine residual after disinfection
(Adapted from Government of PEI, nd)
4.4.3 Temperature Temperature does not carry any significance in terms of contaminaton. However, we generally prefer cool water over warm water. High water temperature (20-30°C) can also enhance the growth of microorganisms and may lead to taste, odour, colour and corrosion problems. The most desirable temperature for drinking water is between 4
oC to 10
oC (39-50
oF) and
temperatures above 25oC (77
oF) are usually objectionable.
Drinking Water Quality Testing Section 4 Physical Contaminants
50
4.4.4 Turbidity Turbidity is usually caused by suspended particles of sand, silt and clay which are not harmful in low amounts. However, higher turbidity levels are often associated with higher levels of viruses, parasites and some bacteria because they can sometimes attach themselves to the dirt in the water. Therefore, we must be cautious of turbid water as it usually has more pathogens, so drinking it increases our chances of becoming sick. Drinking water should have a turbidity of less than 5 NTU. If it is greater than 5 NTU, sedimentation and/or filtration should be undertaken to reduce the levels. The graph below shows how microbiological contamination (indicated by E.coli) can incease with turbidity.
Relationship between level of turbidity and presence of E. coli in source water.
Turbidity is also a key factor in the operation of different HWT technologies. Water with a turbidity level greater than 50 NTU should be sedimented or strained before it goes through a biosand or ceramic filter. The turbidity must be very low (less than 30 NTU) for chlorine or SODIS to effectively disinfect drinking water.
Drinking Water Quality Testing Section 4 Physical Contaminants
51
4.5 Summary of Key Points • The physical characteristics of drinking water are usually things that we can measure with
our own senses: turbidity, colour, taste, odour and temperature. • In general, we judge drinking water to have good physical qualities if it is clear, tastes good,
has no smell and is cool.
• Physical contaminants generally do have not direct health effects themselves; however, their presence may relate to a higher risk of microbiological and chemical contamination which may be harmful to human health.
• Turbidity is the cloudiness of water that is caused by suspended particles of sand, silt and clay which are not harmful in low amounts. Higher turbidity levels are often associated with higher levels of viruses, parasites and some bacteria. Since pathogens are the main source of water-related diseases, we must be cautious of turbid water.
• The turbidity of the source water is also a key factor in the operation of different HWT technologies. Water with a turbidity level greater than 50 NTU should be sedimented or strained before it goes through a biosand or ceramic filter. The turbidity must be very low (less than 30 NTU) for chlorine or SODIS to effectively disinfect drinking water.
Drinking Water Quality Testing Section 4 Physical Contaminants
52
4.6 References Government of Prince Edward Island (nd). Taste and Odour. Environment, Engergy and Forestry, Canada. Available at: www.gov.pe.ca/envengfor/index.php3?number=43848&lang=E Health Canada (1995). Colour, Water Quality, Environmental and Workplace Health. Available at: www.hc-sc.gc.ca/ewh-semt/pubs/water-eau/colour-couleur/index_e.html Peterson, J. (nd) UWEX Environmental Resources Center, University of Wisconsin-Madison, USA. Available at: http://clean-water.uwex.edu/wav/monitoring/turbidity/tubedirections.htm Wagtech International (2006). An Introduction to Portable Water Quality Testing. Avalable at: www.wagtech.co.uk World Health Organization (2007). Chemical Safety of Drinking-water: Assessing Priorities for Risk Management. Geneva, Switzerland. Available at: http://whqlibdoc.who.int/publications/2007/9789241546768_eng.pdf
Drinking Water Quality Testing Section 4 Physical Contaminants
53
Assignment: Self Assessment
1. What is the WHO guideline for turbidity? What are higher turbidity levels are often
associated with?
2. a) What should be done to water with a turbidity level greater than 50 NTU? b) For chlorine and SODIS to effectively work, what should the level of turbidity be? 3. a) What is the main concern with water that has a bad taste or odor. b) How do you interpret the water quality if you smell a rotten egg odour? 4. a) Why might color occur in drinking water? b) What does a yellow or reddish colour indicate? Answers: Question 1 (See Section 4.4.4) Question 2 (See Section 4.4.4) Question 3 (See Section 4.4.2) Question 4 (See Section 4.4.1)
Drinking Water Quality Testing Section 5 Chemical Contaminants
54
5 Testing for Chemical Contaminants Water may contain chemicals which can be beneficial or harmful to our health. Many chemicals find their way into our drinking water supply through different natural processes and human activities. Naturally occurring chemicals, such as arsenic, fluoride, sulfur, calcium and magnesium, are generally found in groundwater. Human activities can add other chemicals such as nitrogen, phosphorous and pesticides to our ground, surface and rain water. Many developing countries are experiencing a rise in industrial activity with no strict compliance to environmental rules and regulations. As a result, water sources are increasingly becoming contaminated with industrial chemical waste.
While microbiological contamination is the largest public health threat, chemical contamination can be a major health concern in some cases. Water can be chemically contaminated through natural causes (e.g. arsenic, fluoride) or through human activity (e.g. nitrate, heavy metals, pesticides).
(UNICEF, 2008)
The health concerns related to chemicals in drinking water are mainly those that cause adverse effects after long term exposure. The severity of these health effects depends upon the chemical and its concentration, as well as the length of exposure. There are only a few chemicals that can lead to health problems after a single exposure, except through massive accidental contamination of a drinking water supply (WHO, 2006). There are many chemicals that may occur in drinking water; however only a few cause health effects on a large-scale. Arsenic and fluoride are usually the chemicals that we are most concerned about in developing countries. Other chemicals, such as nitrates and nitrites, lead and uranium may also be an issue under certain conditions (WHO, 2006).
Often chemical contamination goes unnoticed until disease occurs due to chronic exposure. By this time it can be too late to regain health by changing water sources, hence water should be tested for chemicals from the outset.
(UNICEF, 2008)
Natural chemical contamination rarely changes over time for a particular water source. Hence, testing for chemical contamination is done less frequently or only during commissioning of a new water source. HWT technologies may not be able to remove all chemical contaminants from drinking water. Therefore, water quality testing carried out at the water source can help to identify an effective and appropriate HWT technology for a particular area.
Drinking Water Quality Testing Section 5 Chemical Contaminants
55
5.1 WHO Guidelines for Chemical Contaminants
“Pure” water does not actually exist in nature, as all water contains some naturally occurring chemicals that have leached from the surrounding environment. In most cases, the levels of naturally occurring chemicals are either beneficial, or minimal and of little consequence. There are also many human made chemicals that can contaminate water and affect its usability. Sources of chemical contaminants can be divided into the following five groups.
Sources of Chemical Contamination
Source of Chemicals Examples Chemicals
Naturally occurring chemicals
Rocks and soils Arsenic, Barium, Boron, Chromium, Fluoride, Manganese, Molybdenum, Selenium, Sodium, Sulphate and Uranium
Chemicals from agricultural activities
Application of manure, fertilizer and pesticides; intensive animal production practices
Ammonia, Nitrate, Nitrite
Chemicals from human settlements
Sewage and water disposal, urban runoff, fuel leakage
Nitrate, ammonia, heavy metals, pesticides, other organic chemical
Chemicals from industrial activities
Manufacturing, processing and mining
Antimony, Cadmium, Cyanide, Lead, Nickel, Mercury
Chemicals from water treatment and distribution
Water treatment chemicals; corrosion of. And leaching from, storage tanks and pipes
Aluminium, Chlorine, Iodine, Silver, Zinc
(WHO, 2004)
The risks associated with chemically contaminated water are identified through the comprehensive testing of water samples. Once a contaminant has been identified, it is possible to establish the effects it will have on human health using previously conducted research. However, most developing countries do not have the resources to acquire this knowledge. So, why do we talk about this? The WHO established a set of drinking water guidelines based on research and experiments to recommend the maximum chemical contaminant concentrations for drinking water. The WHO Guidelines were recommended on the basis of a tolerable daily intake (TDI) of contaminants. A dose of TDI is varied on the weight of body and quantity of daily drinking water consumption (WHO, 2006). Appendix 9 summarizes the WHO Guidelines for chemical contaminants.
Drinking Water Quality Testing Section 5 Chemical Contaminants
56
5.2 Common Chemical Parameters for Testing Some of the most common chemical parameters with their associated health effects are presented in the following paragraphs. Appendix 9 summarizes the WHO Guidelines for chemical contaminants and their health effects. 5.2.1 Arsenic Arsenic can naturally occur in ground water and some surface water. It is one of the greatest chemical problems in developing countries. The WHO considers arsenic to be a high priority for screening in drinking water sources (WHO, 2006). High levels of arsenic can be found naturally in water from deep wells in over 30 countries, including India, Nepal, Bangladesh, Indonesia, Cambodia, Vietnam, Lao PDR, Mexico, Nicaragua, El Salvador and Brazil. In south Asia alone, it is estimated that 60 to 100 million people are affected by unsafe levels of arsenic in their drinking water. Bangladesh is the most severely affected, where 35 to 60 million of its 130 million people are exposed to arsenic-contaminated water. It is possible that arsenic may be found in other locations as more extensive testing is done. Arsenic is poisonous, so if people drink water or eat food contaminated with arsenic for several years, they develop chronic health problems called arsenicosis. Melanosis is the first symptom of drinking arsenic contaminated water over a few years. Melanosis is light or dark spots on people’s skin, often on the chest, back, or palms. The next step is that hardening skin bulges develop on people’s palms and feet – called keratosis. Drinking high amounts of arsenic for a longer time may cause cancer in the lungs, bladder, kidney, skin, liver, and prostate. Arsenic may also cause vascular diseases, neurological effects, and infant developmental defects. Arsenicosis can be partially reversed and treated in the early stages, by making sure people stop drinking arsenic contaminated water and by improving their nutrition. There is currently no effective cure for arsenic poisoning. The only prevention is to drink water that has safe levels of arsenic. According to the UNDP (2006), the projected human costs over the next 50 years include 300,000 deaths from cancer and 2.5 million cases of arsenic poisoning. 5.2.2 Chlorine
Chlorine is widely used to disinfect drinking water as the final step in the water treatment process. Chemical disinfection using chlorine has the benefits of being relatively quick, simple, and inexpensive. It also allows a residual amount of chlorine to remain in the water to provide some protection against subsequent contamination.
Drinking Water Quality Testing Section 5 Chemical Contaminants
57
Three things can happen when chlorine is added to water: 1. Some chlorine reacts with the organic matter and pathogens and kills them. This portion
of the added chlorine is said to be consumed. 2. Some chlorine reacts with other organic matter and forms new chlorine compounds. This
portion is called combined chlorine. 3. Excess chlorine that is not consumed or combined and remains in the water is known as
free residual chlorine (FRC). The objective of chlorination is to add enough chlorine to leave 0.2 – 0.5 mg/L FRC after half an hour contact time. Factors influencing the effectiveness of chlorine as a disinfectant are concentration, contact time, pH, temperature and the presence of organic matter in the water. All of these factors can vary day to day and in different seasons.
5.2.3 Fluoride Fluoride can naturally occur in groundwater and some surface water. Drinking water is normally the major source of fluoride exposure, with exposure from diet and from burning high fluoride coal also major contributors in some regions. High levels of fluoride can be found naturally in many areas of the world including, Africa, the Eastern Mediterranean and southern Asia. One of the best known high fluoride areas extends from Turkey through Iraq, Iran, Afghanistan, India, northern Thailand and China. However, there are many other areas with water sources that contain high fluoride levels and which pose a risk to those drinking the water, notably parts of the rift valley in Africa. It is possible that fluoride may be found in other locations as more extensive testing is done. A small amount of fluoride in water is generally good for strengthening people’s teeth and preventing decay. Fluoride is added to some city water systems and certain consumer products to protect teeth such as toothpastes and mouthwashes. Small amounts of fluoride are generally good for people’s teeth. But at higher amounts over time, it can cause dental fluorosis and damage people’s teeth by staining and pitting. Over many years, fluoride can build up in people’s bones, leading to skeletal fluorosis characterized by stiffness and joint pain. In severe cases, it can cause changes to the bone structure and crippling effects. Infants and young children are most at risk from high amounts of fluoride since their bodies are still growing and developing. There is currently no effective cure for fluorosis – the only prevention is to drink water that has safe levels of fluoride. 5.2.4 Nitrates and Nitrites Nitrate and nitrite are naturally occurring chemicals in the environment that are part of the nitrogen cycle. Nitrate is commonly used in fertilizers and for agriculture and nitrite is used as food preservatives, especially in processed meat. Nitrate in ground water and surface water is normally low but can reach high levels if there is leaching or runoff from agricultural fertilizers or contamination from human and animal feces. Nitrite is formed as a consequence of microbial activity and may be intermittent.
Drinking Water Quality Testing Section 5 Chemical Contaminants
58
High nitrate and nitrite levels can cause serious illness by acute exposure. The main health concern is methaemoglobinaemia, or blue baby syndrome, which occurs in infants that are bottle fed with formula prepared with drinking water. It causes them to have difficulty breathing and their skin turns blue from a lack of oxygen. It is a serious illness that can sometimes lead to death. 5.2.5 Iron Iron can be naturally found in groundwater and some surface water (such as creeks, rivers and some shallow dug wells). There are areas of the world that have naturally high amounts of iron in their groundwater. Iron can also be found in drinking water that is passed through rusty steel or cast iron pipes. Iron can come in two forms in water: dissolved and suspended. If groundwater comes from a deep tube well, the iron may be dissolved and not visible. However, once the iron is exposed to air, it usually turns the water black or orange colour. If surface water has iron in it, it will be a red-orange colour from the iron that is suspended in the water. Drinking water with high concentrations of iron will not make people sick. Iron, however, can change the colour of water and it may cause people to not use it and choose another, possibly contaminated, water source instead. 5.2.6 Manganese Manganese can be naturally found in groundwater and surface water, and it usually occurs with iron. However, human activities may also be responsible for manganese contamination in water in some areas. Manganese can come in two forms in water: dissolved and suspended. If groundwater comes from a deep tube well, the manganese may be dissolved and not visible. In surface water, manganese can be dissolved or suspended. Water with high levels of suspended manganese usually has a black colour or black flakes in it. People need small amounts of manganese to keep healthy and food is the major source for people. However, too little or too much manganese can cause adverse health effects. High levels of manganese, however, can turn water a black colour and it may cause people to not use it and choose another, possibly contaminated, water source instead. 5.2.7 Lead Lead contamination usually comes from human rather than natural sources. Mining activities and abandoned mine pits can result in lead contamination of surrounding sources. The use of lead pipes can also result in elevated lead levels in drinking water. Long-term exposure to low lead levels can cause adverse neurological effects, especially in infants, young children and pregnant women. Lead exposure is most serious for infants and young children because they absorb lead more easily than adults and are more susceptible
Drinking Water Quality Testing Section 5 Chemical Contaminants
59
to its harmful effects. Even low level exposure may harm the intellectual development, behaviour, size and hearing of infants (Environment Canada, 2004). 5.2.8 pH pH is a measure of the acidity or alkalinity of the water. The pH for drinking water generally lies between 6.5 and 8.0. Water at 25°C (80° F) with a pH less than 7.0 is considered acidic, while a pH greater than 7.0 is considered basic (alkaline). When a pH level is 7.0, it is considered neutral. The pH of the water in a stream, river, lake or underground flow will vary depending on a number of conditions: the source of the water; the type of soil, bedrock and vegetation through which it travels; the types of contaminants the water encounters in its path; and even the amount of mixing and aeration due to turbulence in its flow. The effects of a specific type of water pollution on living plants and animals can vary greatly.
No health-based guideline value is proposed for pH by the WHO. Although pH usually has no direct impact on consumers, it is one of the most important water quality parameters for HWT. For example, for effective disinfection with chlorine, the pH should preferably be less than 8.
Drinking Water Quality Testing Section 5 Chemical Contaminants
60
5.2.9 Total Dissolved Solids (TDS)
Total dissolved solids (TDS) are made up of inorganic salts (mainly sodium chloride, calcium, magnesium, and potassium) and small amounts of organic matter that are dissolved in water. There are areas of the world that have naturally high amounts of TDS in their drinking water. TDS in drinking water comes from natural sources, sewage, urban runoff and industrial wastewater. Brackish or saline aquifers can exist naturally or develop overtime in coastal regions with sea water infiltration due to lowering of aquifer depths. Drinking water with high concentrations of total dissolved solids will not make people sick. Although there are no direct health concerns, TDS concentrations greater than 1,200 mg/L (e.g. brackish or saline water) cause a bitter or salty taste. Some people can taste salt in drinking water at levels around 500 mg/L, and it may cause them to not use it and choose another, possibly contaminated, water source instead. Water with extremely low TDS concentrations (e.g. rainwater) may also be unacceptable because of its flat taste. Electrical conductivity (EC) of a substance is defined as its ability to conduct or transmit electricity. The presence of chemicals (such as calcium and magnesium ions) gives water the ability to conduct electricity. Testing for EC does not give specific information about the chemicals present in water, but it gives an estimation of TDS. Thus, the EC of water is an indirect measure of dissolved chemicals.
TDS (mg/L or ppm) = EC (µS/cm) x 0.67
Drinking Water Quality Testing Section 5 Chemical Contaminants
61
5.3 Test Methods
There are several factors to be taken into consideration when choosing an appropriate testing method, including: • available resources • required level of sensitivity and specificity • technical skills • geographical location • type and purpose of the results required Laboratory and field testing are the two main methods used by government and non-governmental organisations. NGO’s tend to favor a portable field kit for their chemical testing, whereas governmental institutes, research centers and universities generally prefer to use laboratory testing which can provide more accurate results. The following table lists the recommendations made by UNICEF for appropriate test methods and equipment.
Recommended Test Methods for Different Chemicals
Chemical Recommended Test Methods
pH Test strips, digital meter Ammonia Test strips, laboratory Antimony Laboratory Arsenic Laboratory, Gutzeit Method (Digital and visual Arsenator) Barium Laboratory Boron Laboratory Cadmium Laboratory Chlorine (free) Comparator, test Strips, photometer Chloride Test strips, laboratory Chromium Pocket colorimeter, photometer Copper Colour disc, colorimeter, laboratory Cyanides Colour disc, colorimeter, laboratory Fluoride Colorimeter, Photometer Iron Colour disc, photometer, colorimeter Lead Colorimeter, laboratory Manganese Colorimeter, photometer Mercury Laboratory Molybdenum Laboratory Nickel Colorimeter, laboratory Nitrates Test strips, colour disc, colorimeter, photometer Nitrites Test strips, colour disc, colorimeter, photometer Silver Laboratory Selenium Laboratory TDS Digital meter Uranium Laboratory
(UNICEF, 2003)
Drinking Water Quality Testing Section 5 Chemical Contaminants
62
5.3.1 Laboratory Test Methods The following methods are generally used to test chemical contaminants in the laboratory. • Colorimetric Method This method is based on measuring the intensity of colour of a reaction product or a coloured target chemical. The optical absorbance is measured using light of a suitable wavelength. The concentration is determined by means of a calibration curve obtained using known concentrations of the determinant. • Atomic Absorption Spectrometer (AAS) This method is used to analyze the presence of metals. Atomic Absorption Spectrometry (AAS) is based on the phenomenon that free atoms in the ground state can absorb light of a certain wavelength. Each element has its own specific absorption, meaning no other elements absorb this wavelength when light is passed through the atom in its vapour state. As this absorption of light depends on the concentration of atoms in the vapour, the concentration of the target element in the water sample can be determined. • Chromatography This is a separation method based on the affinity difference between two phases: stationary and mobile. A sample is injected into a column either packed or coated with the stationary phase, and separated by the mobile phase based on the difference in interaction (distribution or adsorption) between compounds and the stationary phases. Compounds with a low affinity for the stationary phase move more quickly through the column and remove earlier. A suitable detector measures the compounds that are removed from the column. There are many types of chromatography: ion chromatography, liquid chromatography and gas chromatography, which are used to identify metallic, inorganic and organic compounds. 5.3.2 Field Test Methods
There are different ways to test chemical contaminants in the field. The most popular are test strips, colour comparators, colorimeters, and digital meters. • Test (Reagent) Strips There are many different types of test strips available to measure different chemical contaminants. They are generally convenient and easy to use for technical and non-technical people; provide quick results; and are the cheapest way to do field testing. The main limitation of test strips is that they are less accurate since they require a visual interpretation of the results. Test strips typically have a plastic handle with a reagent area at one end. Typically, you dip the reagent area into a water sample, remove it, and compare the color of the reagent area with a color chart. Some test strips work by presence/absence of a color change at a threshold concentration.
Drinking Water Quality Testing Section 5 Chemical Contaminants
63
Sometimes people ignore the instructions for the specific test strip that they are using. This is the major pitfall, and can lead to incorrect results. There are two things to keep in mind: the activation method and the read time. These are given on the bottle label and in the product insert. It is important to use the required activation mode for the test strip you are using. Different strips require dipping the strip in the sample, or swishing the strip back and forth in the sample, or holding the reagent area in a stream of sample. Also, test strips require different times that you must wait before you compare the strip to the colour chart. Using the wrong activation method or reading your resulting too early or late for that strip may lead to incorrect results (Morris and Sweazy, nd). Test strips are available to measure pH and a variety of chemicals including arsenic, chlorine and manganese.
Test Strip Tips: Understanding the limits and concentration ranges of the parameters you are testing is essential when selecting testing equipment and consumables. Make sure to purchase the test strip that is most suited to your purpose. Different ranges can exist for the same parameter. For example you can find pH strips ranging from 1 to 14 (with increments of 1), or 4.5 to 9.0 (with increments of 0.5 or even 0.25). The latter is the most suitable for drinking water quality testing since we are generally looking for pH around 7 rather than at the extreme ends of the scale. Test strips are available in individual packaging which can be useful as deterioration can occur with humidity, heat, dust and light.
Merckoquant test strips
The reagent area is dipped into the water sample.
After the reaction time has passed, the colour of the reagent area is compared with the colour chart on the package to determine the concentration.
Drinking Water Quality Testing Section 5 Chemical Contaminants
64
• Colour Disc Comparator There are different types of colour disc comparators that are available. The comparator is used in conjunction with a range of interchangeable colour discs. These colour discs are used to compare the colour produced for each chemical test, against the standard test colours provided on the disc. Colour discs are available for a range of chemical water testing parameters such as chlorine, fluoride, nitrate, iron and manganese. Colour comparators can sometimes be more accurate than test strips, but they are more expensive, require more materials, and still require a visual determination of the chemical concentration. • Colorimeter and Photometer Colorimeters and photometers use a light source to measure the chemical concentration in a water sample. Compared to test strips, they offer more accurate and repeatable results since the concentration is given as a digital reading. As well, colorimeters and photometers can read a large variety of chemicals in a water sample as well as a wider numerical range within each parameter. However, they are more expensive, need a power source, and require training to ensure they are being used properly. Portable colorimeters and photometers are available from various suppliers. • Digital Meters Some portable field kids include various digital meters to measure parameters like pH and EC. They are relatively easy to use and can provide more accurate measurements than other methods, such as test strips. The main disadvantages are the need for calibration and general fragility of electronic equipment.
• Arsenic Test Kits
Field testing for arsenic used to be challenging and required complicated and often inaccurate test kits. New kits have been developed making field testing easier and more accurate. Nevertheless, most kits are not accurate below 100 µg/L. Most kits follow the sample principal which relies on the Gutzeit Method (UNICEF, 2008). The Wagtech Digital Arsenator (initially used by UNICEF in India) is simple and easy to operate and includes reagents to test for 420 water samples. It can measure the critical range of 2 to 100 ppb. Environment and Public Health Organization (ENPHO) based in Nepal has also developed an arsenic field test kit. The kit is easy to use, portable and provides rapid results. Each kit provides the reagents to test 50 water samples. The arsenic concentration is determined by comparing the intensity of the stain with a colour chart. Refer to Appendix 1 for a list of available kits for arsenic and other chemical parameters.
Drinking Water Quality Testing Section 5 Chemical Contaminants
65
5.4 Interpreting Test Results Evaluating what levels of contamination is acceptable, and understanding the nature of problems caused by different contaminants, are the basic considerations in interpreting the test results. Water that has been contaminated with chemicals exceeding the national standards or WHO Guidelines for Drinking Water Quality should not be used for domestic purposes, if at all possible. Any chemical concentration above 10% of the national standards or WHO Guidelines increases the risk for serious health effects. Therefore, appropriate local or national authorities should be notified as early as possible so that further investigation can occur, and possible solutions to the problem can be implemented. The WHO Guidelines for Drinking Water Quality do not include some chemicals such as iron, calcium, sodium, magnesium and zinc. This is due to the fact that they pose no health risk at the levels generally found in drinking water. 5.4.1 Arsenic The World Health Organization (WHO) considers arsenic to be a high priority for testing in drinking water sources. The WHO suggests that drinking water should have less than 0.01 mg/L of arsenic. (0.01 mg/L is the same as 10 µg/L or 10 ppb.)
WHO Guideline for Drinking Water < 0.01 mg/L
Many countries have their own standards which are less strict, ranging from 0.025 mg/L to 0.05 mg/L (25-50 ppb). Many Southeast Asian countries that have an arsenic problem have adopted a temporary standard of 0.05 mg/L because it is difficult to test accurately to 0.01 mg/L and to treat water to meet that standard. Households that use drinking water with arsenic concentrations greater than 10 µg/L (or 0.1 mg/L, 10 ppb), should treat their water using an appropriate HWT, like the Kanchan filter, to reduce the levels, or use an alternative water source if at all possible. Unfortunately most field kits are not very accurate at ranges below 100 µg/L. UNICEF suggests using them in a positive/negative format with a reference value of 50 µg/L, which is the drinking-water standard in many countries (the WHO Recommendation is 10 µg/L). Furthermore, groundwater can evolve as the water level changes in the aquifer. Arsenic contamination can therefore develop over time. In Arsenic affected areas, a well initially tested as negative should be tested again later. 5.4.2 Chlorine Chlorine is widely used to disinfect drinking water as the final step in the water treatment process. The objective of chlorination is to add enough chlorine to leave 0.2 – 0.5 mg/L free residual chlorine after half an hour contact time.
Drinking Water Quality Testing Section 5 Chemical Contaminants
66
5.4.3 Fluoride The WHO suggests that drinking water should have 0.5 – 1.0 mg/L to protect teeth. Many cities around the world add fluoride to their drinking water to reach this level. Higher amounts of fluoride between 1.5 – 4.0 mg/L can cause dental fluorosis. Very high amounts of fluoride greater than 10.0 mg/L can lead to skeletal fluorosis. This is why the WHO suggests that drinking water should not have more than 1.5 mg/L of fluoride.
WHO Guideline for Drinking Water < 1.5 mg/L
Currently research is being conducted to develop HWT technologies that can effectively remove fluoride from drinking water. In the meantime, household that use drinking water with concentrations greater than 1.5 mg/L should try to use an alternative water source if at all possible. 5.4.4 Nitrate and Nitrite The WHO suggests that drinking water should have less than 50 mg/L of nitrate to protect against methaemoglobinaemia in bottle-fed infants (short term exposure). In most countries, nitrate levels in surface water are not more than 10 mg/L, although nitrate levels in well water often exceed 50 mg/L (WHO, 2006). Nitrite levels should be less than 3 mg/litre to protect infants from methaemoglobinaemia (short-term exposure). There is a provisional guideline for long term nitrite exposure set at less than 0.3 mg/L. The guideline value is considered provisional because of the uncertainty of the chronic health effects and our susceptibility to it.
WHO Guideline for Nitrate < 50 mg/L
WHO Guideline for Nitrite < 3 mg/L (short-term exposure)
WHO Provisional Guidelines for Nitrite < 0.2 mg/L (long-term exposure)
Concentrations greater than 44.3 mg/L nitrate causes 97% of reported illness. High nitrate levels are often associated with higher levels of microbiological contamination since the nitrates may have come from manure or sewage.
Drinking Water Quality Testing Section 5 Chemical Contaminants
67
5.4.5 Iron The WHO does not have a suggested guideline for iron in drinking water since it does not have any adverse health effects. Usually, people do not like the taste of drinking water that has more than 0.3 mg/L of iron. Concentrations between 1.0 – 3.0 mg/L can be acceptable for people drinking anaerobic well water. Iron levels above 0.3 mg/L can stain water pipes and clothes during washing.
No WHO Guideline for Drinking Water
Levels above 0.3 mg/L can stain laundry. Usually there is no noticeable taste below 0.3 mg/L, and concentrations between 1.0 – 3.0 mg/L can be acceptable for people drinking anaerobic well water. 5.4.6 Manganese The WHO suggests that drinking water should not have more than 0.4 mg/L of manganese. Usually, people do not like the taste of drinking water that has more than 0.15 mg/L of manganese. Also, amounts above 0.15 mg/L can stain water pipes, clothes during washing, and food during cooking. Even levels of manganese below 0.05 mg/L may form black coatings on distribution pipes that come off into water as small black flakes. The presence of manganese in water may also lead to the accumulation of microbial growths in the water distribution system.
WHO Guideline for Drinking Water < 0.4 mg/L
Levels above 0.15 mg/L can stain laundry and plumbing fixtures and causes a bad taste. Even levels below 0.05 mg/L may form coatings on water distribution pipes that may slough off as black precipitates. As with iron, the presence of manganese in water may lead to the accumulation of microbial growths in the water distribution system. 5.4.7 Lead Households that use drinking water with concentrations greater than 0.01 mg/L should try to use an alternative water source if at all possible.
Drinking Water Quality Testing Section 5 Chemical Contaminants
68
5.4.8 pH Readings beyond the range of 6.5 - 8.5 give an indication that there are dissolved chemicals present. In this scenario it is recommended to use an alternate water source if at all possible. The optimum range for chlorine disinfection is between pH 5.5 and 7.5; disinfection is not reliable when the pH of the water is above 9. If the pH is above the recommended range then the quantity of chlorine added can be increased and the contact time should be lengthened. A higher FRC level (0.6 mg/L) should be used for pH levels between 8 and 9. 5.4.9 Electrical Conductivity and Total Dissolved Solids The WHO does not have a suggested guideline for total dissolved solids in drinking water since it does not have any adverse health effects. Usually, people do not like the taste of drinking water that has 500 mg/L of TDS. High levels of TDS can stain water pipes and clothes during washing. It can also cause scale to form in water distribution pipes and in water heater devices that come off as white flakes.
Testing for EC does not give specific information about the chemicals present in water, but it gives an estimation of the TDS. More specific testing must be done to discover which chemicals are present. TDS concentrations greater than 1200 mg/L (e.g. saline water) may cause an objectionable taste. Water with extremely low TDS concentrations (e.g. rainwater) may also be unacceptable because of its flat taste (WHO, 2006).
Drinking Water Quality Testing Section 5 Chemical Contaminants
69
5.6 Summary of Key Points
• Sources of chemical contaminants can be divided into the following five groups:
• Naturally occurring • From agricultural activities • From human settlements • From industrial activities • From water treatment and distribution
• The effect of chemical contaminants on human health depends on the following factors:
• Type of contaminant and its concentration • Length and frequency of exposure • The user’s age and physical health condition • Immunity level
• The chemical contaminants of most concern worldwide are:
• The following factors to be taken into consideration when choosing an appropriate
chemical testing method:
• Available sources • Technical skills • Geographical location • Type and purpose of the results required
• Water that has been contaminated with chemicals exceeding the national standards or
WHO Guidelines for Drinking Water Quality should not be used for domestic purposes, if at all possible.
Drinking Water Quality Testing Section 5 Chemical Contaminants
70
5.7 References Environment Canada (2004). Canadian Water Quality Guidelines. Available at: www.ec.gc.ca/ceqg-rcqe/English/Ceqg/Water/default.cfm#dri Morris, D. and J. Sweazy (nd). Technical Bulletin: The Advantages and Pitfalls of Reagent Strips in Dialysis, Other Medical, and Non-Medical Applications. Stericheck, Environmental Test Systems. Available at: www.sterichek.com/articles.asp?AID=7&l= UNICEF (2003). Water Quality Assessment and Monitoring, Technical Bulletin No.6. Available at: www.supply.unicef.dk/catalogue/bulletin6.htm UNICEF (2008), UNICEF Handbook on Water Quality. Available at: www.unicef.org/wes/files/WQ_Handbook_final_signed_16_April_2008.pdf United States Environmental Protection Agency (2006). Consumer Fact Sheet on Nitrates/Nitrites. Available at: www.epa.gov/safewater/dwh/c-ioc/nitrates.html United State Environmental Protection Agency (2006). Drinking Water and Health: What You Need to Know. Available at: www.epa.gov/safewater/dwh/index.html University of Adelaide (2006). School of Chemistry and Physics. Available at: www.chemistry.adelaide.edu.au Wagtech International (n.d.). An Introduction to Portable Water Quality Testing. Available at: www.wagtech.co.uk Water Quality Association (n.d.). Water Classifications.Available at: www.pacificro.com/watercla.htm World Health Organization (2006). Guidelines for Drinking Water Quality, Third Edition. Geneva, Switzerland. Available at: www.who.int/water_sanitation_health/dwq/gdwq3rev/en/index.html World Health Organization (2007).Chemical Safety of Drinking Water: Assessing Priorities for Risk Management. Geneva, Switzerland. Available at: http://whqlibdoc.who.int/publications/2007/9789241546768_eng.pdf
Drinking Water Quality Testing Section 5 Chemical Contaminants
71
Assignment: Self Assessment
1. a) What does pH indicate? b) What does the pH of water depend on? c) What does a pH reading of 9 indicate? 2. a) What are TDS and what are the sources of? b) What does a TDS reading of 1300 mg/L indicate? 3. a) What factors should be taken into consideration when choosing an appropriate testing method? b) If you were going to test for pH and fluoride what tests methods could you choose?
4. What would you suggest if the test result of source water shows an arsenic contamination between 30-40 ppb?
Answers: Question 1 (See Section 5.2.8) Question 2a (See Section 5.2.9) Question 2b (See Section 5.4.9) Question 3 (See Section 5.3) Question 4 (See Sections 5.2.1 and 5.4.1)
Drinking Water Quality Testing Section 6 Testing for Microbiological Contamination
72
6 Testing for Microbiological Contamination
Water naturally contains a diverse population of living organisms, such as aquatic plants, animals, algae, bacteria, parasites and viruses. Some of these organisms are harmless and others can be harmful to humans. Those of greatest concern to us are pathogens, or disease causing organisms. We sometimes refer to these pathogens as microorganisms, microbes or bugs, depending on the local language and country. In the 21
st century, contaminated water is the world’s second biggest killer of children. Every
year some 1.5 million people die as a result of diarrhea and other diseases caused by unclean water and poor sanitation. Close to half of all people in developing countries suffer at any given time from a health problem caused by water and sanitation deficits (UNDP, 2006). The WHO Guidelines for Drinking Water Quality highlight that infectious diseases caused by pathogenic bacteria, viruses, protozoa and helminths are common in drinking water and inflict widespread health effects. Although there are several contaminants in water that may be harmful to humans, the first priority is to ensure that drinking water is free of microorganisms that cause disease (WHO, 2006). Therefore, the primary objective of HWTS should be the removal of pathogens in the water to levels that do not cause infection in the local population. Testing can be done to determine if pathogens are present in the drinking water. However, other indicators of the effectiveness of the water treatment, such as the incidence of diarrheal diseases, can also be important and sometimes more significant than the actual water quality indicators. The general health, well-being or energy levels of the local population can also provide some insight into the quality of the community water supply.
Drinking Water Quality Testing Section 6 Testing for Microbiological Contamination
73
6.1 WHO Guidelines for Microbiological Contaminants
The WHO Guidelines for Drinking Water Quality recommend that all water intended for drinking should have zero fecal contamination in any 100 ml sample. However, many countries have developed their own water quality standards which may differ from the WHO Guidelines. For example, in 2007 Nepal developed national drinking water standards where total coliform should be zero at least 95% of the time. The risk of fecal contamination in drinking water using E. coli as an indicator is shown in the following table. Many relief agencies also use these values to determine when water treatment is required in emergency situations (adapted from Médecins Sans Frontières, 1994).
Fecal Contamination in Drinking Water and its Associated Risk
E. coli level (CFU/100 ml sample)
Risk1 Recommended Action
2
0-10 Reasonable quality Water may be consumed as it is
10-100 Polluted Treat if possible, but may be consumed as it is
100-1000 Dangerous Must be treated
> 1000 Very Dangerous Rejected or must be treated thoroughly
(1 WHO,1997,
2 Harvey, 2007)
Routine water quality testing techniques are not available for viruses, protozoa and helminths. The WHO Guidelines recommend protection of the water source and treatment to remove them from drinking water. The degree of treatment required is a function of the source water (i.e. ground or surface water) and level of fecal contamination.
Drinking Water Quality Testing Section 6 Testing for Microbiological Contamination
74
6.2 Potential Health Effects Diseases associated with water can be categorized depending on the source of the pathogen and the route by which we come into contact with the pathogen.
Diseases Associated with Water Contaminated with Pathogens
Possible Diseases Source How We Get Sick How to Stop Getting
Sick
Diarrhea, cholera, typhoid, shigellosis, hepatitis A and E
Water-borne Drinking water with pathogens
Improve drinking water quality by removing or killing pathogens.
Trachoma, scabies Water-washed
Pathogens touch the skin or eye
Provide enough water needed for basic hygiene. Improve basic hygiene practices.
Schistosomiasis, guinea worm
Water-based
Pathogens go through the skin
Do not bath or swim in water that is known to be contaminated. Improve water quality by removing or killing source of pathogens.
Malaria, dengue, yellow fever, filariasis, river blindness, sleeping sickness
Water-insect vector
Pathogens are passed on by insects that breed or live in water, such as mosquitos
Prevent insects from breeding in water. Use pesticides to control insects. Prevent insects from biting by using bednets and wearing long clothes.
Drinking Water Quality Testing Section 6 Testing for Microbiological Contamination
75
Pathogens found in water can also be divided into four main categories: bacteria, viruses, protozoa, and helminths (worms). 6.2.1 Bacteria Bacteria are the most common microorganisms found in human and animal feces. Drinking water contaminated by feces is the primary cause of water-borne infections. This is often called the fecal-oral route of transmission since the source of the pathogens is human or animal feces. With some bacteria, only a few are needed to make us sick. The most common water-borne diseases caused by bacteria are diarrhea (also known as gastroenteritis), cholera and typhoid. About 1.5 million people die every year from diarrheal diseases, including cholera (WHO/UNICEF, 2005). It is estimated that 88% of diarrheal disease is caused by unsafe water, inadequate sanitation and poor hygiene (WHO, 2004). Cholera remains a global threat and is one of the key indicators of social development. While cholera is no longer a threat to countries with basic hygiene standards, it remains a challenge in countries where access to safe drinking water and adequate sanitation is limited. Between 100,000 and 300,000 cases are reported each year, with over 94% of the cases in Africa. These numbers are underestimated, as many countries in the Indian subcontinent and southeast Asia do not report their cholera cases. A recent estimate puts the number of people who die from cholera each year at about 120,000, and the total number of yearly cholera cases worldwide at 3 to 5 million. Almost every developing country in the world faces cholera outbreaks or the threat of a cholera epidemic (WHO, 2009). Similar to cholera, typhoid is prevalent in countries that lack access to safe drinking water and sanitation. Every year, there are an estimated 22 million cases of typhoid worldwide resulting in 216,000 deaths (WHO, 2009a). 6.2.2 Viruses Viruses are the smallest of the pathogens. Viruses are unable to replicate by themselves and must invade a host cell to make more viruses. This disrupts the functions or causes the death of the host cell. It is difficult and expensive for us to study viruses so we know less about them than other pathogens. Viruses that are transmitted by water can cause diarrhea, hepatitis A and E. However, viruses generally produce milder symptoms than bacteria. Hepatitis A occurs sporadically worldwide and is common throughout the developing world with 1.5 million cases every year (WHO, 2004). There are other viruses that are transmitted by vectors that depend on water to survive. For example, mosquitoes spread diseases such as Dengue Fever, Rift Valley Fever, Japanese Encephalitis, West Nile Fever, Ross River Fever, Equine Encephalitis, and Chikungunya. Most of these diseases occur in tropical and sub-tropical areas.
Drinking Water Quality Testing Section 6 Testing for Microbiological Contamination
76
Human immunodeficiency virus (HIV) and viruses causing the common cold cannot be transmitted through water since it does not provide a suitable environment for the viruses to survive.
6.2.3 Protozoa Protozoa are single-celled organisms and some can stay alive without a host. Some protozoa are able to form cysts which allow the organism to stay dormant and survive in harsh environments. The protozoa cysts become active once the environmental conditions become more favourable. Cryptosporidium is an example of a protozoa that can from a cyst which is resistant to chlorine disinfection. There are several different types of protozoa that may cause illness, such as amoeba, cryptosporidium and giardia. On a worldwide basis, infections of amoebic dysentery are the most common resulting in about 500 million cases each year. These protozoa live predominantly in tropical areas. Malaria is also a parasitic infection that is passed on by mosquitoes. Approximately 900,000 people die each year of malaria, 90% of which are children under the age of five. There are estimated to be 247 million episodes of malaria every year, mostly occurring in sub-Saharan Africa (WHO, 2009b). 6.2.4 Helminths Helminths, more commonly known as worms or flukes, require a host body to survive and are generally passed in human and animal feces. Both helminths and protozoa are considered to be parasites. They spend part of their life in hosts that live in water before being transmitted to humans. Many types of worms can live for several years and weaken their host by using up their food. Common types of helminths that cause illness in developing countries include round worms, pin worms, hook worms and guinea worms. The WHO estimates that 133 million people suffer from intestinal worms each year. These infections can lead to severe consequences such as cognitive impairment, severe dysentery or anaemia, and cause approximately 9,400 deaths every year (WHO, 2000). Schistosomiasis, also known as bilharzia, is caused by the trematode flatworm. This is widespread disease that affects about 200 million people worldwide. Although it has a relatively low mortality rate, schistosomiasis causes severe symptoms in millions of people. The disease is often associated with large scale water resource projects, such as the construction of dams and irrigation canal which provide ideal breeding grounds for the flatworm.
Drinking Water Quality Testing Section 6 Testing for Microbiological Contamination
77
6.3 Infective Dose The minimum number of pathogens needed to make somebody sick is called the infective dose. The presence of a pathogen in water does not always mean that it will make someone sick. The infective dose is different depending on the type of pathogen. Generally, bacteria have a higher infective dose than viruses, protozoa and worms. This means that with some bacteria, larger numbers need to be ingested to cause illness relative to other pathogens. Infants, young children, the sick and elderly generally have a lower infective dose than an average adult. This means that they are most at risk and more likely to die from water related diseases. Over 90% of deaths from diarrheal diseases in developing countries occur in children under 5 years old (WHO, 2007).
Dose of Microorganisms Needed to Produce Infection in Humans ID501
Disease Pathogen Type of Pathogen Disease-Producing
Dose
Shigellosis Shigella spp. Bacteria 10 - 1000
Typhoid fever Salmonella typhi Bacteria 100,000
Cholera Vibrio cholerae Bacteria 100,000,000
(Adapted from Ryan et al., 2003)
1 Infective dose is the dose necessary to cause disease in 50% of the exposed individuals, hence ID50. These numbers should be viewed with caution and cannot be directly used to assess risk since they are often extrapolated from epidemiologic investigations, best estimates based on a limited data base from outbreaks, worst case estimates, or other complex variables (US FDA).
Drinking Water Quality Testing Section 6 Testing for Microbiological Contamination
78
6.4 Indicator Organisms Testing for every pathogen in water would be both time consuming, complicated and expensive. Alternatively, the presence or absence of certain bacterial indicator organisms is used to determine the safety of the water. The use of bacteria as indicators dates back to 1885 where they were used in the first routine bacteriological examination of water quality in London, England (WHO, nd). Since then indicator tests have been found to be cheaper, easier to perform and yield faster results, compared to direct pathogen testing. Indicator organisms should ideally possess the following characteristics: • Present whenever pathogens are present • Present in the same or higher numbers than pathogens • Specific for fecal or sewage pollution • At least as resistant as pathogens to conditions in natural water environments, and water
purification and disinfection processes • Non-pathogenic • Not reproduce in water
(WHO, nd). There is no universal indicator to ensure that water is pathogen free, but there are several types of indicators, each with certain characteristics. The choice of indicator depends on the relationship between the indicator and pathogens. Coliform bacteria are most commonly used as indicators because they exist in high ratios to pathogens making them easier to detect in a water sample. However, some bacterial pathogens may exist in higher ratios than the coliform indicators, such as Yersinia. Besides coliform indicators, fecal streptococci and enterococci have also been proposed as indicators of fecal contamination of water. Total coliforms, thermotolerant coliforms (also called fecal coliforms) and Escherichia coli (more commonly referred to as E. coli) are the main indicator groups. As shown in the following diagram, thermotolerant coliforms are a sub-type of total coliforms and E. coli is a member of the thermotolerant group.
Drinking Water Quality Testing Section 6 Testing for Microbiological Contamination
79
Important Note: The presence of bacterial indicators does not always correlate with the presence of protozoa or viruses in drinking water, and vice versa. There are many cases of waterborne disease outbreaks in which the drinking water met all requirements for bacteriological water quality (as well as process efficiency indicators and other water quality parameters). (BCCDC Environmental Health Laboratory Services, 2006)
Total Coliforms: Presence in water may indicate contamination
Thermotolerant Coliforms: Found in intestines of warm-blooded animals
E. coli:
Indicator of fecal contamination
Heterotrophic Bacteria: Most bacteria in nature, includes all pathogens
Drinking Water Quality Testing Section 6 Testing for Microbiological Contamination
80
6.4.1 Total Coliforms Total coliforms have been used as an indicator of drinking water since the early 1900s and are commonly used in testing wastewater effluent (EPA, 2006). There is some debate internationally about the public health significance of this bacterial indicator group in drinking water since they are not specific indicators of fecal pollution. An understanding of the basic definition of this group of bacteria, however, is important to assessing possible risks as poor drinking water quality is associated with the presence of these organisms. Originally, total coliforms included four groups of bacteria: Escherichia, Klebsiella, Enterobacter and Citrobacter. These four groups are found in the feces of warm-blooded animals, including humans. However, recent scientific evidence has shown that total coliforms actually include a much broader grouping of bacteria than the four original groups. In fact, to date there are now nineteen recognized groups of bacteria that fall under total coliforms, of which only ten of these groups have actually been associated with feces. Several environmental species included as total coliforms are associated with soil, vegetation, or water sediments. Thus, not all total coliforms represent bacteria coming from the feces. Recent research has also demonstrated that some groups of total coliforms that are found in the feces of animals are also capable of replicating in nutrient rich environments. This makes it difficult to assess whether the water in which total coliforms were detected was contaminated with feces or not. Overall, the total coliform group has become a less specific measure of public health risk. In fact, the group violates the two basic criteria for a good indicator, these being the requirement for the microorganism to only be associated with the feces of animals and to be incapable of replicating in the environment. (BCCDC Environmental Health Laboratory Services, 2006) 6.4.2 Thermotolerant (Fecal) Coliforms Thermotolerant coliforms are a sub-group of the total coliform group. They used to be commonly referred to as fecal coliforms since they are found in warm-blooded animals (i.e. birds and mammals). Historically, fecal coliforms have been extensively used as bacterial indicators of fecal contamination. Among the coliforms in human feces, 96.4% are fecal coliforms. They are distinguished from total coliforms by their ability to grow at higher temperatures (42
oC - 44.5
oC), a useful trait for the laboratory. When compared to the
presence of total coliforms, the presence of fecal coliforms in a water sample adds significant weight to a possible health risk. With respect to total coliforms, thermotolerant coliforms are a more specific indicator of fecal contamination than total coliforms (EPA, 2006). More recently, E. coli has replaced thermotolerant coliforms as the preferred indicator since it is a more specific indicator of contamination by human or animal feces. (Adapted from BCCDC Environmental Health Laboratory Services, 2006)
Drinking Water Quality Testing Section 6 Testing for Microbiological Contamination
81
6.4.3 Escherichia coli (E. coli) E. coli is the most important indicator used in drinking water quality testing and has been used for over 50 years. It is a coliform bacteria found predominantly in the feces of warm-blooded animals. The majority of E. coli is harmless; however there are some strains (such as O157:H7) that are known to cause severe diarrhea and other symptoms. Most thermotolerant coliforms are actually E. coli. A study showed that over 96% of a thermotolerant (fecal) coliform sample was E. coli (Warren et al. 1978). It has similar biochemical properties to the other coliforms and is distinguished by the presence of the enzyme β-glucuronidase and galactosidase. Many different water testing methods make use of the presence of this enzyme for detection of E. coli in water samples. Over 95% of E. coli tested to date possesses this enzyme. Of note, most strains of O157:H7 do not produce this enzyme and is one of the very few that cannot be detected by β-glucuronidase-based methods. However, the likelihood that O157:H7 being the only E. coli strain present in a fecally contaminated water sample is remote. E. coli is to date one of the best indicators for fecal contamination. However, there is debate over E. coli’s ability to survive and replicate outside the host, particularly in warmer tropical climates. Recent studies have shown the capacity of E. coli to resist and grow in soils (Ishii et al, 2006, Solo-Gabriel et al., 2000, Fujioka et al., 1999). Nevertheless high quantities of E. coli will most probably indicate fecal contamination and hence the need for water source protection and/or treatment.
6.4.4 Fecal Streptococci and Enterococci
Parallel to the research conducted on coliforms, a group of bacteria known as fecal streptococci were also being investigated as important indicators. Enterococci are a subset of the fecal streptococci group. Four key points in favour of the fecal streptococci were:
• Relatively high numbers in the excreta of humans and other warm blooded animals
• Presence in wastewater and known polluted waters
• Absence from pure water and environments having no contact with human and animal life
• Persistence without multiplication in the environment (WHO, 2001)
Fecal streptococci and enterococci are generally absent from pure, unpolluted waters having no contact with human and animal life, with the exception being growth in soil and on plants in tropical climates. Thus for water quality purposes, they can be regarded as indicators of fecal pollution, although some could originate from other habitats, making them less reliable than E. coli as an indicator. They are also not as good a fecal indicator when pathogenic protozoa are present (US EPA, 2006). CAWST recommends that E. coli be used as the indicator organism for
microbiological testing.
Drinking Water Quality Testing Section 6 Testing for Microbiological Contamination
82
Microbiological Indicators Excreted in the Feces of Warm Blooded Animals (average numbers per gram wet weight)
Groups Thermotolerant Coliforms Fecal Streptococci
Farm Animals
Chicken 1,300,000 3,400,000
Cow 230,000 1,300,000
Duck 33,000,000 54,000,000
Horse 12,600 6,300,000
Pig 3,300,300 84,000,000
Sheep 16,000,000 38,000,000
Turkey 290,000 2,800,000
Domestic Pets
Cat 7,900,000 27,000,000
Dog 23,000,000 980,000,000
Humans 13,000,000 3,000,000
(Adapted from WHO, 2001)
Important Note: Bacterial indicators, such as E. coli, are not intended to be absolute indicators for the presence of pathogens. Rather the presence of these bacterial indicators in a water sample is consistent with the fact that the water was likely contaminated with feces and at a higher risk for causing disease. Fecally contaminated water may or may not have pathogenic microorganisms in it. Consequently, drinking bacterially-contaminated water may or may not cause disease. The concept of using bacteria as indicators of water quality and public health safety is based on risk by association. (BCCDC Environmental Health Laboratory Services, 2006)
Drinking Water Quality Testing Section 6 Testing for Microbiological Contamination
83
6.5 Test Methods There are three main testing methods to determine the presence of bacteria in water: • Presence/Absence (P-A) • Most Probable Number (MPN) • Membrane Filtration Traditionally, membrane filtration using international standardized methods was recommended to measure indicator bacteria in drinking water. This method requires trained technicians, equipment and other supporting materials available only in a laboratory or the use of a field analysis kit. The relatively high cost of laboratory testing makes it difficult, impractical or impossible to perform these tests in many parts of the world. The resources and infrastructure are simply not available to allow for routine testing of drinking water using internationally standardized methods. These constraints highlighted the great need for a rapid, simple, inexpensive test methods. This need is especially great for small community and household water supplies that lack access to and can not afford conventional laboratory testing. On-site testing using portable equipment and the development of alternative and simplified testing methods, such as P-A or MPN tests, have contributed to overcoming these constraints (Adapted from WHO, 2002). Different products for each of the test methods are now widespread and commercially available. Appendix 1 provides commercial equipment and product information. The following sections present the different test methods, outline how they are conducted, and discuss the advantages and limitations for each method.
Important Note: Results from one test methods are not directly comparable to another (e.g. MPN versus membrane filtration). Different types of test methods have different sensitivities for bacteria indicators. Although these tests are intended to target the same group of bacteria (i.e. total coliforms), their functionality is based on specific biochemical properties of the indicator bacteria. One method will, for example, detect more total coliforms than another. (Adapted from BCCDC Environmental Health Laboratory Services, 2006)
Drinking Water Quality Testing Section 6 Testing for Microbiological Contamination
84
6.5.1 Presence-Absence Presence-absence (P-A) is a qualitative test that depends on a colour change to indicate the presence of contamination. For this test, you simply mix the water sample (commonly 10 ml) with a special culture media, and incubate the mixture according to the manufacturer’s instructions. If the test turns out to be positive, meaning that the indicator bacteria is present, the water sample will change to a specific colour. The advantages of this method are that it is relatively inexpensive, quick and easy to use. The main limitation is that it will only measure quality; the results do not indicate the type and quantity of bacteria in the sample.
www.trafalgarscientific.co.uk
Summary of Presence-Absence Advantages and Limitations
Advantages Limitations
• Simple to understand and use (requires
minimal training) • Achieves results rapidly (within 24 hours) • Some tests do not require many items of
equipment (such as chemicals, power source, incubator etc.)
• Portable and durable in the field • Inexpensive for a limited number of tests
• Only provides qualitative results; does
not indicate the type and quantity of bacteria
• Not recommended by WHO for the analysis of surface water and untreated small community supplies
• Not able to determine the removal efficiency and effectiveness of HWT technologies
Important Note: P-A testing is designed to be used in situations where the water is most likely not polluted (i.e. the test result is negative) such as groundwater and community water supplies that are treated and piped to people’s homes. P-A testing is therefore a rapid test to simply verify the presence of coliform bacteria indicating fecal contamination of the water.
Drinking Water Quality Testing Section 6 Testing for Microbiological Contamination
85
Quantitative testing techniques like membrane filtration is preferred where a significant proportion of tests provide a positive reaction. If positive results are found using P-A testing, the water sample should be re-tested using either MPN or membrane filtration to confirm the level of contamination. P-A testing is of limited use with respect to HWT technologies like the biosand filter or ceramic filters. These technologies may not provide 100% efficiency for the removal of bacteria, so there is a chance that P-A tests will turn positive when testing the filtered water. This test will not indicate the level of contamination, despite the fact that it is improved quality compared to the original water source, or help to determine the removal efficiency of these technologies. There is a number of commercially available P-A products. The traditional tests are based on the principal that fecal bacteria produce hydrogen sulphide (H2S tests), more modern techniques use nutrient-indicators (ONPG and MUG) which react with specific coliform enzymes. The general process for using IDEXX Colilert® is as follows:
• A powdered reagent is added to a 10 ml sample • The sample is incubated at 35
oC for 24 hours
• The results are read: Colourless = negative, Yellow = total coliforms present, Yellow/fluorescent = fecal coliforms present (tested with a UV lamp).
The hydrogen sulphide test (H2S) is a P-A test that has been used for two decades to detect the presence of fecal pathogens. To check for the presence of H2S indicator bacteria in water, a strip of test paper is added to a water sample. If the test paper turns black, it means that H2S was produced, which in turn means that bacteria of fecal origin are present in the water sample. This is based on the assumption that fecal bacteria are the only H2S producing bacteria, which is not the case as sulphate-reducing bacteria (non-fecal origin) and water source naturally rich in sulfides (this is particularly true in groundwater) will also make the test turn positive (WHO, 2002). A level of caution is therefore required when using H2S methods.
Example H2S Test Bottles
Drinking Water Quality Testing Section 6 Testing for Microbiological Contamination
86
6.5.2 Most Probable Number Most Probable Number (MPN) indicates the bacteria density that is most likely to be present in the water sample. It is a statistical testing method based on the number of positive tubes of a water sample. P-A testing can be adapted to quantitatively determine the levels of total or fecal coliforms in a water sample. Multiple tubes (10 ml each) Multiple wells (1 ml each) In the case of multiple tubes: • The water sample is dispensed into 10 tubes (each of 10 ml and containing the
liquid/powder/solid form reagent) • The samples are incubated at 35
oC for 24 hours
• The number of positive tubes out of 10 is recorded The following table is used to determine the most probable number of coliform in the water sample
MPN Index
Number of Positive Tubes
0 1 2 3 4 5 6 7 8 9 10
MPN Index (CFU/100 ml)
<1.1 1.1 2.2 3.6 5.1 6.9 9.2 12.0 16.1 23.0 >23
MPN has become a popular screening method for total coliforms and E. coli since it is generally more sensitive than membrane filtration. It uses a lower incubation temperature, 35
oC instead of 44.5
oC, which is less stressful on the microorganisms.
Drinking Water Quality Testing Section 6 Testing for Microbiological Contamination
87
Summary of MPN Advantages and Limitations
Advantages Limitations
• Provides quantitative results • Relatively simple to understand and use
(requires some training) • Relatively inexpensive for occasional
testing • Can be used with turbid water • More sensitive than membrane filtration
• Requires more time for results (24 hours
to incubate samples) • More labour intensive than P-A testing • Requires some training • Requires more equipment than P-A
testing (e.g. power source, incubator, pipettes)
• Not practical if needing to test many (>10) samples at a time
6.5.3 Membrane Filtration Membrane filtration (MF) is the most accurate method to get an exact number of bacteria. This method is highly reproducible and can be used to test relatively large sample volumes. However, membrane filtration also has limitations, particularly when testing waters with high turbidity or large numbers of non-coliform (background) bacteria. Turbidity caused by the presence of algae or suspended particles may not let you test a sample volume sufficient to produce significant results. Low coliform estimates may be caused by the presence of high numbers of non-coliform bacteria or toxic metals or toxic organic compounds like phenols.
Summary of Membrane Filtration Advantages and Limitations
Advantages Limitations
• Provides quantitative results • Most accurate method to get number of
bacteria; results obtained directly by colony count
• Many samples can be tested at once • Internationally recognized test methods
• More labour intensive than P-A or MPN
testing • More complicated to understand and
read results; requires more training • Requires more equipment than P-A and
MPN testing (e.g. power source, incubator, pipettes, filter paper, Petri dishes)
• Less applicable to turbid waters • Cost of consumables is high in many
countries
Drinking Water Quality Testing Section 6 Testing for Microbiological Contamination
88
In the membrane filtration method, a 100 ml water sample is vacuumed through a filter using a small hand pump. After filtration, the bacteria remain on the filter paper which is then placed in a Petri dish with a nutrient solution (also known as culture media, broth or agar). The Petri dishes are placed in an incubator at a specific temperature and time which can vary according the type of indicator bacteria and culture media (e.g. total coliforms are incubated at 35
oC and fecal coliforms are incubated at 44.5
oC with some types of culture
media). After incubation, the bacteria colonies can be seen with the naked eye or using a magnifying glass. The size and colour of the colonies depends on the type of bacteria and culture media used. Some water testing field kits provide membrane filtration equipment, such as the Oxfam-Delagua Kit and the Wagtech Potatest Kit.
Important Note:
Good laboratory technique is essential when accuracy is important for membrane filtration. For reliable results, take care in sample collection and preservation, maintain a clean laboratory or work surface, use proper sterilization practices, and control the temperature on the incubator. See Section 3 Water Sampling and Quality Control for more details.
Filter Paper
There are different types of filter paper available in the market. The pore size is crucial to retain different types of bacteria. A pore size of 0.45µm is most commonly used.
Culture Media Bacteria cannot be seen with the human eye. In order to observe them they are “grown” under controlled conditions. Culture media are substances, in liquid, semi-solid or in solid form, which contain nutrients intended to support the growth of bacteria. Different media are used to grow different indicator bacteria. In most cases, the culture media is placed in a Petri dish and bacteria are transferred to the media. The Petri dish is then incubated so that the bacteria will replicate hundreds of thousands of times and eventually appear on the Petri dish as concentric circles called colonies (sing. colony). The number of colonies formed on the media is reported as colony forming units (CFU) per unit of volume of the water sample (i.e. 100 ml), hence CFU/100ml. Different culture media products have different storage requirements and shelf lives. Once opened the media is exposed to contamination and should be stored safely. Be sure to follow the manufacturer’s instructions on how to properly use the media.
Drinking Water Quality Testing Section 6 Testing for Microbiological Contamination
89
Nutrient Pads Broths and Agars
Nutrient Pads are prepared with dehydrated broths in plastic Petri dishes. They require rehydration with 2-3 ml of distilled water in each Petri dish. These Petri dishes cannot be reused. Notes: • Nutrient pads are practical, since they
minimize contamination and there is no preparation required
• They can be expensive for many tests and are bulky for transport
Broths can be found in powder form (requires preparation with distilled water) or liquid form (no preparation needed). Agars are broths in a gel form. They need to be prepared by mixing the agar powder with water and heating. When the temperature has reduced to 40-50۫C, but the media is still liquid, it is poured into Petri dishes. It will become a semi-solid gel at room temperature. Notes: • Liquid broths don’t require preparation • Powder broths are generally the most
economical for over 200 tests • Powders don’t require strict storage but
liquid broths need to be refrigerated • Agars require taller Petri dishes and
need to be prepared in advance. • Pre-poured Agar plates can also be
purchased but tend to be the most costly.
Different products have different storage requirements and shelf lives. Once opened the media is exposed to contamination and should be stored safely. Be sure to follow the manufacturer’s instructions. Appendix 1 contains a list of culture media products and their suppliers. Appendix 8 provides a table with the most commonly used culture media and their specifications.
Drinking Water Quality Testing Section 6 Testing for Microbiological Contamination
90
Colony Counting Techniques
After incubation, you need to remove the Petri dishes and count the colonies. You will count all colonies of a certain colour, depending on the indicator bacteria and the media used. Colonies may vary considerably in size. Generally, where there are a large number of colonies, they are smaller in diameter. Where colonies are fewer, they tend to be larger. This is because the colonies compete for nutrients and will grow larger when there is no competition.
Use the horizontal grid lines on the filter paper to help count large numbers of colonies. Examine and count all colonies with the particular colour you are looking for. Colonies shown in every grid square are to be counted. Go from top to bottom and left to right until all grid squares are covered.
You will report the number of colony forming units (CFU) per 100 ml of water sample. It is difficult to count more than 100 colonies. Petri dishes with more than 250 colonies can be reported as “too numerous to count” (TNTC). Some colonies may overlap thus creating counting errors. Dilutions can be made to avoid this. See Section 3.5 for instructions on how to dilute your water sample. Most culture media manufacturers provide an info sheet or troubleshooting guide which can help you in the counting process and identifying colonies.
Method for Counting Colonies Using a Grid
� �
� �
� �
� �
Count top to bottom by rows along grid lines
Count top to bottom by columns along grid lines
Drinking Water Quality Testing Section 6 Testing for Microbiological Contamination
91
The following are examples of different indicator bacteria colonies:
Thermotolerant (fecal) coliforms colonies appear as purple dots and total coliforms as pink dots using Coliscan broth.
E. coli colonies appear as blue dots using m-Coliblue broth. The red dots indicate total coliform colonies.
Safe Waste Disposal Bacterial cultures must be disposed of safely and properly as each colony is made up of millions of individual bacteria. Contaminated material, such as used Petri dishes, pads and filter paper, must be disinfected before disposal. This can be accomplished by using a chlorine solution. Use one of the following options: 1. Add liquid chlorine to each Petri dish until full, allow 10 to 15 minutes contact time with
the bleach, pour the liquid down the drain, dispose of the test containers in the normal waste
2. Or, place the Petri dishes, pads and filter paper into boiling water and heat for at least 30 minutes (Oxfam-DelAgua WaterTesting Kit-User Manual, nd). You may wish to do this outside as the smell may become uncomfortable.
3. Or, place Petri dishes, pads and filter paper open into a bucket which contains at least a quarter glass full of bleach (~70 ml) mixed with 2 litres of water. Allow at least 1 hour contact time, then dispose of the pads and membranes and boil the Petri dishes to fully disinfect and to wash off the bleach.
Always wash your hands thoroughly with soap after handling the contaminated waste and before touching the disinfected Petri dishes.
When testing for both total and fecal coliforms (or E. coli), remember that the total coliform count must include the fecal coliform (or E. coli) colonies. For example with m-ColiBlue broth, if you count 10 red colonies and 5 blue colonies (E. coli), then the total coliform count is 15, not 10, as E.coli is also part of the total coliform group.
Drinking Water Quality Testing Section 6 Testing for Microbiological Contamination
92
6.6 Interpreting Test Results
It is extremely important that sampling and testing be as precise and accurate as possible, so that the end results can be interpreted correctly. The results are based on the data recorded during the testing process. The use of a data recording form allows you to easily manage the data and helps you be as accurate as possible. See Appendix 7 for an example recording form. Recall that there is no universal indicator to ensure that water is pathogen free, but there are several different types, each with certain characteristics. The choice of indicator depends on the relationship between the indicator and bacteria. Coliform indicators are most commonly used because they exist in high ratios to pathogens making them easier to detect in a water sample. It should also be noted that a single negative sample is not necessarily indicative of unsafe water. Only a trend of data can be used to confirm the water quality. If the second sample does not contain E. coli or other indicator bacteria, a third sample should be collected. If the third sample contains E. coli or other bacteria, the user should be advised to treat their drinking water. Interpretation of Presence/Absence Results: If positive results are found using P-A testing, the water sample should be re-tested using MPN or membrane filtration to confirm the level of contamination. The WHO does not recommend P-A testing for the quantitative analysis of surface water, untreated small community supplies, or large supplies that may experience occasional operation and maintenance problems. P-A testing is of limited use with respect to HWT technologies like the biosand filter or ceramic filters. Since these technologies do not provide 100% efficiency for the removal of bacteria, there is a chance that P-A tests will turn positive when testing filtered water. This test will not indicate the level of contamination, despite the fact that it is improved quality compared to the original water source, or help to determine the removal efficiency of these technologies. Interpretation of Most Probable Number Results: The results from MPN tests give you the most probable number of CFU per 100 ml. Based on the different types of MPN tests (Idexx-Quanti Tray, ColiPlate-400 or the simple 10 tube test) different indexes are statistically calculated. It is important to determine the index that coincides with the test used for correct quantification of results. Refer to the WHO table below to determine the risk and recommended action based on the CFU/100 ml results.
Drinking Water Quality Testing Section 6 Testing for Microbiological Contamination
93
Interpretation of Membrane Filtration Results: The results you are interested in from the membrane filtration show the number of E. coli colony forming units in a 100 ml water sample. In the case of the household water treatment project, a comparison can be made between the source water, treated water and stored water after treatment. According to the WHO, the risk of fecal pollution using E. coli as an indicator is shown in the following table. Many relief agencies also use these values to determine when water treatment is required in emergency situations (adapted from Médecins Sans Frontières, 1994).
Fecal Pollution and its Associated Risk
E. coli level (CFU/100 ml sample)
Risk1 Recommended Action
2
0-10 Reasonable quality Water may be consumed as it is
11-100 Polluted Treat if possible, but may be consumed as it is
101-1000 Dangerous Must be treated
> 1000 Very Dangerous Rejected or must be treated thoroughly
(1 WHO,1997,
2 Harvey, 2007)
Drinking Water Quality Testing Section 6 Testing for Microbiological Contamination
94
6.7 Summary of Key Points
• The WHO Guidelines for Drinking Water Quality recommends that all water intended for drinking should have no fecal contamination in any 100 ml sample. However, many countries have developed their own water quality standards which may differ from the WHO Guidelines.
• According to the WHO, the risk of fecal pollution using E. coli as an indicator is shown in
the following table. Many relief agencies also use these values to determine when water treatment is required in emergency situations (adapted from Médecins Sans Frontières, 1994).
• Testing for every conceivable pathogen in water would be both time consuming, complicated and expensive. Alternatively, the presence or absence of certain bacterial indicator organisms is used to determine the safety of the water. The most commonly used indicator for fecal contamination is E. coli.
• There are three main testing methods to determine the presence of bacteria in water: Presence/Absence (P-A), Most Probable Number (MPN) and Membrane Filtration (MF). The choice of method will depend on many factors including the nature of the source(s) being tested, the frequency and extent of the testing program, the resources available and the purpose/objective of the testing.
• Different products for each of the methods are now widespread and commercially
available. Appendix 1 provides commercial equipment and product information. • P-A testing is of limited use with respect to HWT technologies like the biosand filter or
ceramic filters. Since these technologies do not provide 100% efficiency for the removal of bacteria, there is a chance that P-A tests will always turn positive when testing filtered water. This test will not indicate the level of contamination, despite the fact that it is improved quality compared to the original water source, or help to determine the removal efficiency of these technologies.
Drinking Water Quality Testing Section 6 Testing for Microbiological Contamination
95
6.8 References
Aliev S., Shodmonov P., Babakhanova N. and O. Schmoll (2006). Rapid Assessment of Drinking Water Quality in the Republic of Tajikistan, Country Report, Ministry of Health of the Republican of Tajikistan. Available at: www.untj.org/files/reports/RADWQ.pdf Baker D.L. and W.F. Duke (2006). Intermittent Slow Sand Filters for Household Use -A Field Study in Haiti, IWA Publishing, London, UK. BCCDC Environmental Health Laboratory Services (2006). Safe Drinking Water: Public Health Laboratory Surveillance Update. British Columbia, Canada. Available at: www.vch.ca/environmental/docs/water/safe_drinking_water.pdf Bartram J. and R. Balance (edited) WHO (1996). Water Quality Monitoring: A Practical Guide to the Design and Implementation of Freshwater Quality Studies and Monitoring Programmes, Published on behalf of United Nations Environment Programme and the World Health Organization and UNDP. Available at: www.who.int/water_sanitation_health/resourcesquality/wqmonitor/en/ Geldreich, E.E. (1978). Bacterial Populations and indicator concepts in feces, sewage, stormwater and solid wastes. In indicator of microbial water quality, WHO, 2001 pp.297. Available at: www.who.int/water_sanitation_health/dwq/iwachap13.pdf Canadian Council of Ministers of the Environment, A Water Quality Task Group (2006). A Canada-wide Framework for Water Quality Monitoring. Available at: www.ccme.ca/assets/pdf/wqm_framework_1.0_e_web.pdf Fujioka, R., C. Sian-Denton, M. Borja, J. Castro, and K. Morphew (1999). Soil: the environmental source of Escherichia coli and enterococci in Guam's streams. J. Appl. Microbiol. Symp. Suppl. 85:83S-89S Harvey, P. (2007). Well Factsheet: Field Water Quality Testing in Emergencies. Water, Engineering and Development Centre, Loughborough University, United Kingdom. Available at: www.lboro.ac.uk/orgs/well/resources/fact-sheets/fact-sheets htm/WQ%20in%20emergencies.htm Howard A.G. (2002). Water Quality Surveillance: A practical guide. WEDC, Loughborough University, UK. Available at: www.lboro.ac.uk/wedc/watermark/practical-guide/wqs-insides.pdf Ishii, S., W.B. Ksoll, R.E. Hicks, and M.J. Sadowsky (2006). Presence and growth of naturalized Escherichia coli in temperate soils from Lake Superior watersheds. Appl. Environ. Microbiol. 72 :612–621 Médecins Sans Frontières (1994). Public Health Engineering in Emergency Situations, Paris. Solo-Gabriele H.M., Wolfert M.A., Desmarais T.R. and C.J. Palmer (2000). Sources of Escherichia coli in a coastal subtropical environment. Appl Environ Microbiol. 2000.66(1)
Drinking Water Quality Testing Section 6 Testing for Microbiological Contamination
96
United Nations Development Programme (2006). Human Development Report 2006. Beyond scarcity: Power, poverty and the global water crisis. Available at: http://hdr.undp.org/hdr2006/ US Environment Protection Agency (2006). Distribution System Indicators of Drinking Water Quality. Office of Ground Water and Drinking Water, Standards and Risk Management Division, Washington DC, USA. Available at: www.epa.gov/safewater/disinfection/tcr/pdfs/issuepaper_tcr_indicators.pdf United States Geological Service (2003). Sample Collection Preservation and Storage. Available at: http://water.usgs.gov/owq/FieldManual/Chapter7-Archive/Chapter7.1/7.1.2.html University of Surrey (n.d.) Oxfam-DelAgua Water Testing Kit Manual. Robens Centre for Public and Environmental Health, UK. Available at: www.recpeh.com Warren, L. S., R. E. Benoit, and J. A. Jessee (1978). Rapid Enumeration of Fecal Coliforms in Water by a Colorimetric β-Galactosidase Assay. Applied and Environmental Microbiology 35(1):136-141. World Health Organization (1997). Guideline for Drinking Water Quality 2
nd Edition, Volume
3, Surveillance and Control of Community Supplies, Geneva. Available at: www.who.int/water_sanitation_health/dwq/gdwqvol32ed.pdf World Health Organization (2001). Water Quality: Guidelines, Standards and Health. Edited by Lorna Fewtrell and Jamie Bartram. IWA Publishing, London, UK. Available at: www.who.int/water_sanitation_health/dwq/whoiwa/en/index.html World Health Organization (2002). Evaluation of the H2S Method for Detection of Fecal Contamination of Drinking Water. Prepared by M. Sobsey and F. Pfaender, Department of Environmental Sciences and Engineering, School of Public Health, University of North Carolina, USA. Available at: www.who.int/water_sanitation_health/dwq/WSH02.08.pdf World Health Organization (2004). Water, Sanitation and Hygiene Links to Health: Facts and Figures. Website: www.who.int/water_sanitation_health/publications/facts2004/en/ World Health Organization (2006). Guidelines for Drinking Water Quality, Third Edition. Website: www.who.int/water_sanitation_health/dwq/gdwq3rev/en/index.html World Health Organization (2007). Cholera. Website: www.who.int/topics/cholera/about/en/index.html World Health Organization (2009a). Typhoid Fever in Diarrheal Diseases. Available at: http://www.who.int/vaccine_research/diseases/diarrheal/en/index7.html World Health Organization (2009b). Malaria Fact Sheet. Available at:http://www.who.int/mediacentre/factsheets/fs094/en/index.html World Health Organization (n.d). Microbiological Aspects, WHO Seminar Pack for Drinking Water Quality. Available at: www.who.int/water_sanitation_health/dwq/S03.pdf
Drinking Water Quality Testing Section 6 Testing for Microbiological Contamination
97
World Health Organization and UNICEF (2005). WHO/UNICEF Joint Monitoring Programme for Water Supply and Sanitation. Water for Life: Making it Happen. Website: www.who.int/water_sanitation_health/monitoring/jmp2005/en/index.html
Drinking Water Quality Testing Section 6 Testing for Microbiological Contamination
98
Assignment: Self Assessment
1. What are the characteristics that a bacterial indicator should have? 2. a) What are thermotolerant coliforms? b) High quantities of E. coli will most probably indicate what? 3. List and describe the 3 main microbiological testing methods. 4. a) How do you interpret the result, if your E. coli test result shows 9 CFU/100 ml sample? b) How do you interpret the result if your E. coli test shows more than 100 CFU/100 ml sample? c) How do you interpret your test result if it shows turbidity at 10-20 NTUs and an E. coli level of 9 CFU/100 ml sample? Answers: Question 1 (See Section 6.4) Question 2a (See Section 6.4.2) Question 2b (See Section 6.4.3) Question 3 (See Section 6.5) Question 4 (See Section 6.6)
Drinking Water Quality Testing Section 7 Interpreting Test Results
99
7 Interpreting Test Results
Data interpretation allows you to learn from the water quality test results, helps you improve your sampling program, and is really the reason you collected the data in the first place. You will need to take a good look at the numbers and try to make sense of them to develop your final conclusions and recommendations. Besides providing a report of the analysis for given contaminants, most water testing laboratories or portable test kits provide little explanation of the test results. The information provided in this section will help you understand and interpret physical, chemical and biological test results. Although we have separated physical, chemical and biological tests, it is useful to compare the results to determine any correlations.
There are three basic approaches for interpreting data generated from water quality tests: 1. The measured values of physical, chemical and biological contaminants can be compared to national water quality standards or the WHO Guidelines for Drinking Water Quality.
2. Data records can be reviewed to see how they change over time and location to identify any trends or correlations. 3. Scientific analysis can be done for academic purposes and scientific research.
Drinking Water Quality Testing Section 7 Interpreting Test Results
100
7.1 Steps for Data Interpretation
(Adapted from Canadian Council of Ministers of the Environment, 2006)
7.1.1 Collect Data Recording Forms
Data recording forms are used to document your samples and test results. See Appendix 5 for an example data recording form. Many forms may be used, depending on how many samples are taken and the number of tests performed, so it is important to choose the correct forms for data entry. It is essential to collect all data forms and to verify the information and results for each day before preparing a database.
3.1 Trend analysis, changes in space and time
• Assemble data from the water quality testing.
• Enter the data in the suitable table, spreadsheet or database.
• Deal with “unusual readings”. i.e. if some results are unusual, it would be a good idea to re-test . For example, if number of E-coli is higher in the filtered water compared to inlet water, it would be good to retake samples on different days and times.
• Data analyses methods should be selected in advance, and there should be sufficient data to run the analysis.
• Results should be recorded in a simple format. The end users have to be able to understand the results.
• Interpret the results so they are meaningful to the project objectives and situation of the local context. When generating results, keep in mind the quality control and reliability of the testing process.
• Develop conclusions and recommendations. Report the results.
1. Collect data for analysis
2. Check that data entered on the data recording forms are
complete and accurate
3. Choose appropriate statistical analysis
3.2 Compare data to national standards or WHO Guidelines
3.3 Scientific analysis i.e. technology verification
4. Interpret data in relation to project objectives
5. Report results. Advise Community Health
Promoters and Product Manufacturers as necessary
Drinking Water Quality Testing Section 7 Interpreting Test Results
The data record forms need to be checked thoroughly to ensure that all information was recorded clearly and completely. If any data is missing or incomplete, another sample should be taken and/or the test should be repeated to get accurate and complete information. The most common errors are transcription mistakes, such as are incorrect positioning of the decimal point or recording data for a different sample. If there are any unusual test results, another sample should be taken and the test should be repeated. For example, if the results are far out of the expected or possible range, the test should be done again as there may be problems with equipment calibration, expired test strips or broths or the simply the data was not properly encoded. Refer back to Section 3 on quality control which explains how to limit such errors. 7.1.3 Choose an Appropriate Analysis The selection of data analysis and graphic presentation is based on the following types of testing. • Trend and Correlation Analysis Trend analysis shows how a physical, chemical or biological parameter changes with time and location. Graphing is an excellent way to display your data, and is very helpful when you are analyzing trends and correlations. There are many kinds of graphs, and you are encouraged to be creative in finding different ways of looking at data. Time-history graphs can illustrate changes in water quality over a period of time (i.e. in hours, days, months, or years). For example, the following graph shows that average E.coli
numbers were gradually reducing till May and is increasing trend on June and onward.
Average Number of E. coli
Drinking Water Quality Testing Section 7 Interpreting Test Results
102
A spatial graph can be used to show how water quality varies according to the sampling locations. The following graph shows that the source water and transfer bucket water both have E. coli contamination, but the transfer bucket water has higher levels, probably due to secondary contamination. The filtered water is good in terms of water quality; however the results show that there is a recontamination problem in the storage water.
Risk of Water Contamination
(Duke et al., 2006) A correlation graph can be used to see if there is a relationship between two different parameters. For example, the following graph shows the correlation between E. coli counts and turbidity in a river. The graph shows that the higher the turbidity, the higher the levels of E. coli in the water.
98
202
1
23
0
50
100
150
200
250
Source water
(n=87)
Transfer Bucket
(n=107)
Filter Spout
(n=106)
Storage (n=107)
Sample Points
Avera
ge E
.co
li p
er
Sam
ple
Po
int
Drinking Water Quality Testing Section 7 Interpreting Test Results
103
• Comparison Analysis A comparison analysis is usually carried out to determine the existing situation compared with national standards or WHO Guidelines. This type of analysis is useful to compare the effectiveness of technology between different locations or user groups, such as high, medium and low-income households. • Scientific Analysis Scientific analysis can be done for academic purposes and scientific research. Water testing processes should be very comprehensive with a high number of tests that are repeated more than once. The results should be verified by statistical inferences such as confidence level, standard of error and t-test. This type of analysis focuses on high precision in the methodology.
The method of data analyses should be selected in advance to get a sufficient number of test results for the statistical analysis. In general 30 units (e.g. 30 filters, 30 households) are necessary for a statistical analysis. The type of statistical analysis should meet the needs of the audience who will be reviewing the results. If a water quality test is carried out upon the request of end users, statistical analysis should be simple and the results should be self explanatory. Statistical measures including percentage, frequency and average are better understood and can be graphed. Software is available to process numerical data and perform statistical tests. Spreadsheets, such as Microsoft Excel, can also have powerful graphical and statistical capability. 7.1.4 Interpret Data in Relation to the Objectives The objectives of the project and the water quality testing program need to be kept in mind when you are interpreting your test results. Different objectives will result in different interpretations of the data. The following are some examples of objectives for water quality testing: • Assess the effectiveness of a HWT technology in reducing turbidity and bacteria • Assess the concentration of arsenic and fluoride in the source and treated water • Assess the effectiveness of a HWT technology in the removal of physical, biological and
chemical contaminants to prepare policy guidelines • Assess the effectiveness of a HWT technology in the removal of chemical contaminants
to prepare national guidelines for drinking water quality Project implementers often carry out water quality testing to bring awareness in the community about the difference between contaminated water and treated water. In such situations, results may be presented immediately to the community without complete interpretation of the overall data. This situation can sometimes backfire if you generate a negative test result in front of the community without the ability to explain the result or perform any quality control to verify the test. This can easily create a negative impression about the project implementation and should be avoided if possible. If it is necessary to distribute early results, it is important to emphasize that they are incomplete and full results will be available after the data has been interpreted.
Drinking Water Quality Testing Section 7 Interpreting Test Results
104
7.1.5 Report the Results
The primary purpose of a report is to share your results, conclusions and recommendations to an audience. This information should be assembled in a well organized and easy to read format. It is particularly important to include graphs and tables to help make the report easy to understand. Reports should be made as early as possible so that corrective actions can be taken to ensure safe drinking water. It is also important to share the results with the users so that they are aware of how to operate their HWT technology properly. Reporting the results also gives feedback to improve the project implementation.
Important Note: As drinking water quality is a sensitive topic, simply providing the testing results without guidance and interpretation could lead to dangerous misinterpretations and inappropriate action or inaction (especially if the report is disseminated outside of the organisation). Water quality testing can be a great mobilisation tool as long as the results are interpreted and presented properly.
Appendix 7 gives an example of a water quality testing report.
7.2 Interpreting Laboratory Reports
If you send your water to a laboratory for testing, they will send you’re a report with the results. Most laboratories provide little additional explanation of test results beyond the units used or possibly a footnote in the event that a problem is identified. A laboratory report will normally contain a table of possible contaminants and physical characteristics for which your sample was tested, and the measured concentration of each. If you have any problems understanding the way information is presented on the laboratory report, you should contact the testing laboratory directly for explanation.
Drinking Water Quality Testing Section 7 Interpreting Test Results
105
Northeast Environmental Laboratory Inc. (nd)
Drinking Water Quality Testing Section 7 Interpreting Test Results
106
7.3 Summary of Key Points
• There are three basic approaches for interpreting data generated from water quality tests:
1. The measured values of physical, chemical and biological contaminants can be compared to national water quality standards or the WHO Guidelines for Drinking Water Quality.
2. Data records can be reviewed to see how they change over time and location to identify any trends or correlations. 3. Scientific analysis can be done for academic purposes and scientific research.
• The following are the general steps for data interpretation:
o Collect data recording forms o Check the data recording forms o Choose an appropriate analysis o Interpret data in relation to the objectives o Report the results
• When producing a water quality testing report, be sure to consider:
o The objectives of the testing o The audience for the report o The clarity of the report and interpretation of the results
Drinking Water Quality Testing Section 7 Interpreting Test Results
107
7.4 References
Baker D.L. and W. F. Duke (2006).Intermittent Slow Sand Filters for Household Use -A Field Study in Haiti, IWA Publishing, London, UK. Bartram J. and R. Balance (edited) (1996). Water Quality Monitoring: A Practical Guide to the Design and Implementation of Freshwater Quality Studies and Monitoring Programmes, Published on behalf of United Nations Environment Programme and the World Health Organization and UNDP. Available at: www.who.int/water_sanitation_health/resourcesquality/wqmonitor/en/ Bauman, E.R. 1962. Should Small Water Supplies be Superchlorinated?, Part II. Water and Sewage Works. (1):21-24. Canadian Council of Ministers of the Environment, A Water Quality Task Group (2006). A Canada-wide Framework for Water Quality Monitoring. Available at: www.ccme.ca/assets/pdf/wqm_framework_1.0_e_web.pdf Water Quality Standards and Interpretation (nd). Available at: http://co.laplata.co.us/water_well_web/Standards.pdf
Drinking Water Quality Testing Appendix 1 Equipment and Materials
A1-1
Equipment and Materials
A. PRODUCT INFORMATION SHEETS ......................................................................................... 2
1. Field Kits ................................................................................................................ 2
1.1. Wagtech Potatest and Oxfam-Delagua Kits ..................................................... 2
2.3. Culture media (broths and agars) for membrane filtration ................................ 9
2.4. Presence-Absence (P-A) and Most Probable Number (MPN) ........................ 10 2.4.1. P-A H2S Tests ...................................................................................................... 10 2.4.2. More specific P-A tests ........................................................................................ 11
2.5. Other Test Methods ....................................................................................... 12 2.5.1. 3M Petrifilm .......................................................................................................... 12
3. Chemical and Physical testing ............................................................................... 14
2.7. Test strips ...................................................................................................... 14
2.8. Colorimeters and Photometers....................................................................... 15 2.8.1. Wagtech Color comparator kit.............................................................................. 15 2.8.2. Hach Colorimeter DR/850 .................................................................................... 17
2.9. Parameter specific test kits ............................................................................ 18 2.9.1. Arsenic ................................................................................................................. 18 2.9.2. Fluoride ................................................................................................................ 20 2.9.3. Chlorine & pH....................................................................................................... 21
B. COST OF EQUIPMENT AND CONSUMABLES ...................................................................... 22
C. SUPPLIER CONTACT INFORMATION.................................................................................... 24
Drinking Water Quality Testing Appendix 1 Equipment and Materials
A1-2
A. Product Information Sheets
1. Field Kits 1.1. Wagtech Potatest and Oxfam-Delagua Kits
Wagtech Potatest Kit Oxfam DelAgua Kit
Wagtech International Wagtech Court Station Road Thatcham Berkshire RG19 4HZ - United Kingdom Tel +44 (0) 1635 872929 [email protected] www.wagtech.co.uk
Robens Centre for Public and Environmental Health - University of Surrey Guildford, GU2 5XH - United Kingdom Tel: +44 (0) 1483 689 209 Fax: +44 (0) 1483 689 971 [email protected] www.delagua.org
Test type: • E. coli, total coliforms using membrane filtration • Multiple physical and chemical parameters including pH, turbidity, chlorine • Flexible chemical testing options: comparator allows further testing of over 30 chemical
parameters if required (Wagtech only). Cost: ~ US$2300-2500 Necessary Equipment:
• Pressure cooker or portable sterilizer or access to an autoclave (e.g. in a hospital) • Methanol (approx 2 ml per test) • Distilled water • 1 litre measuring cylinder or beaker • Lighter Summary: The kit is designed for use in the field, but may also be used in a laboratory or other permanent location. The kit can be supplied with a range of accessories that will increase the scope of water quality monitoring programmes. Operating instructions detail all the necessary procedures for a complete bacteriological analysis.
Drinking Water Quality Testing Appendix 1 Equipment and Materials
A1-3
2. Microbiological Testing
2.1. Membrane filtration
Also see 1.1 Wagtech Potatest and Delagua Kits which provide membrane filtration
2.1.1. ColiQuant MF
Product Name: ColiQuant MF
Test type: • E. coli (fecal coliform) and enterobacter (non-fecal
coliform) using membrane filtration Cost: 20 tests - $211.50 (~ $10.60 each), refill 20 tests - $148.50 (~ $7.43 each) Necessary Equipment: • Incubator • Filter apparatus, broth, filter paper, pad, calibrated dropper (included) • Bleach (for disposal) • Alcohol • Sterile dilution water (if needed) • Permanent marker Summary: This product uses a Coliscan broth and is designed for the membrane filtration procedure. Colour charts are included to make the interpretation easier and the manual provides a variety of useful information. Notes: • Filter apparatus, filter papers and pads are included • Filter papers and filter pads are reusable (microwave for 2 minutes ) • Slow ordering process (approx. 8 weeks to arrive) • Disinfection of the apparatus is done with alcohol wipes (not by burning methanol) which
may leave some contamination • Expensive Manufacturer Information: Micrology Laboratories L.L.C. [email protected] www.micrologylabs.com
Distributors: ww.lamotte.com (USA) www.anachemia.com (North America) www.prolabmas.co.id (Indonesia)
Drinking Water Quality Testing Appendix 1 Equipment and Materials
A1-4
2.1.2. Filter Units
Nalgene Analytical Filter Units Wagtech Filters Holders
NALGENE Labware www.nalgenelabware.com International Tel: +1 585-899-7198 E-mail: [email protected] Fax: +1 585-899-7195 North America Tel: 1-800-625-4327 E-mail: [email protected] Fax: 585-586-8987 Europe Tel: +44 (0) 5602 750996 E-mail: [email protected] Fax: +45 4631 2099
Wagtech International Ltd Wagtech Court Station Road Thatcham Berkshire RG19 4HZ United Kingdom Tel: +44 (0) 1635 872929 Fax: +44 (0) 1635 862898 E-mail: [email protected] Website: www.wagtech.co.uk
Test type: Membrane filtration Cost: ~ US$7 each (Nalgene) Necessary Equipment:
• Membrane filters • Plastic vacuum pump Summary:
• For use with 47 mm membranes
Drinking Water Quality Testing Appendix 1 Equipment and Materials
A1-5
2.1.3. Membrane Filters, Absorbent pads
Membrane filters Absorbent pads
• Individually wrapped • Sometimes sold with absorbent pads • Also known as cellulose nitrate filters
or mix cellulose ester filters. • The most common size is 45mm
diameter (fits in standard filtration equipment, such as Wagtech Potest, Delagua Kits and Plastic filtration units) and pore size 0.45 µm for typical bacteriological testing of total and fecal coliforms.
• Best to use white/gridded membrane filters for drinking water quality testing
• Absorbent pads are required when
using liquid broths (not Agars). • They can be purchased:
o in plastic Petri dishes already impregnated with dehydrated broth or plain
o with membrane filters o separately (usually sold with a
dispenser)
Test type: Membrane filtration Cost: • Absorbent Pads and Membranes, ~ US$0.4 - $1 per pad and membrane
o Pack of 200, US$80 (Wagtech, UK) o Pack of 100, US$112 (Millipore, USA)
• Membranes filters, Pack of 600, US$246 (Millipore, USA) • Absorbent Pads, Pack of 30, ~US$7 Necessary Equipment:
• Filters holder Contact Information: There are many suppliers of membrane filters and absorbent pads. The most commonly known is Millipore (www.millipore.com) based in USA and Whatman (www.whatman.com) based in the UK, both with regional offices and distributors
Drinking Water Quality Testing Appendix 1 Equipment and Materials
A1-6
2.1.4. Petri Dishes
Disposable (polystyrene) pre-sterilized Petri dishes with absorbent pads. See nutrient pads (above) which also contain dehydrated culture media on the pad)
Disposable (polystyrene) pre-sterilized Petri dishes. To be used with agars or liquid broths (require absorbent pads)
Aluminum re-usable Petri dishes. Require sterilization before each use, and absorbent pads. For liquid broths. Not usually suitable for agars.
Petri dishes come in various types: • Plastic (polystyrene, polypropylene) or aluminum • Re-usable (usually the polypropylene and aluminum) or disposable (polystyrene) • Some are sold with absorbent pads for direct use with liquid broths (nutrient media) or
are already impregnated with dehydrated liquid media. Do not to reuse the polystyrene Petri dishes. Test type: Membrane filtration Cost: US$0.25-0.55 per dish (plastic), ~ US$2.70 per dish (aluminum) Necessary Equipment: • Sterilizer (for the re-usable dishes) • Marker
Summary: • Widely used in microbiology, the standard-size polystyrene Petri dishes are presterilized • The plastic ones are generally stackable for ease of use. • Plastic dishes (50 to 55mm diameter by 9 to 12 mm height) tend to be taller than the
aluminum ones (50mm diameter by 8mm height) Contact Information: There are many suppliers worldwide for plastic Petri dishes. Re-usable (aluminum) Petri dishes are more difficult to obtain. Try Wagtech and Delagua (see Section 1Field Kits).
Drinking Water Quality Testing Appendix 1 Equipment and Materials
A1-7
Drinking Water Quality Testing Appendix 1 Equipment and Materials
A1-8
2.2. Incubation
2.2.1. Semi-portable incubators
Hova-Bator Egg Incubator Wagtech
Portable Incubator Hach Portable Incubator
Cost: ~US$50 Benefits: • Very economical • Easy to use. • Large incubation space
(~ 40 Petri dishes) Limitations: • No thermostat • Air flow can dry up Petri
www.gqfmfg.com For international suppliers (Middle East, Brazil, Chile, Europe, Australia) see www.gqfmfg.com/store/international.asp
www.hach.com For international suppliers see www.hach-lange.com
Drinking Water Quality Testing Appendix 1 Equipment and Materials
A1-9
2.3. Culture media (broths and agars) for membrane filtration
Summary: • Culture media can come in different forms:
o Dehydrated media in powder form o Prepared media broths in glass or plastic bottles (20 to 100 ml) or 2 ml
ampoules o Pre-poured agar plates o Nutrient Pad Sets (Petri dishes with pre-impregnated dehydrated pads)
Refer to Appendix 8 Culture Media for more detailed information on the products
Suitable for Indicators* Culture Media Type
TC FC E. coli
Form / Container Notes Cost
m-Lauryl sulphate (MLSB)
Broth Nutri-Pad
X X • Powder (38.1g or 500g)
• Dehydrated pads
• Most economical broth
• More difficult to read
~ US$100 for 38.1g tub (250 tests) ~ US$75 for 500g tub (3280 tests) US$0.4/test
m-Endo Broth Agar Nutri-Pad
X X • Powder, Dehydrated pads
• Prepared (2 ml ampoules, 100 ml bottles)
• Agar plates
~ US$57 for 50pk of 2mL ampoules (HACH) $1.15/test ~ US$60 for 100mL bottle (Anachemia) $1.2/test ~ US$10/agar plate (Anachemia)
m-FC Broth Agar Nutri-Pad
X • Powder • Dehydrated
pads • Ampoules (2 ml)
~ US$20 for 20pk of 2mL ampoules (HACH) $1 per test (Same prices as m-Endo from Anachemia)
Modified m-TEC Agar X • Powder • Prepoured agar
plates
~US$65 for 15pk agar plates (HACH), $4.30/test
m-ColiBlue24 Broth Agar
X • Prepare (2 ml ampoules, 100 ml glass bottle)
• Agar plates
• Easy to read ~US$50 for 100mL bottle (50 tests) ~US$35 for 20pk glass ampoules US$1.0-1.5/test
Coliscan MF Broth Agar
X X • Liquid (20 ml plastic bottles) – frozen
• Easy to read
~ US$10 for one bottle (20 tests) $0.5/test
* TC – Total Coliforms, FC – Thermotolerant (Fecal) coliforms,
Drinking Water Quality Testing Appendix 1 Equipment and Materials
A1-10
2.4. Presence-Absence (P-A) and Most Probable Number (MPN)
2.4.1. P-A H2S Tests
ENPHO Coliform Presence-Absence Test HACH Pathoscreen
Cost: Rs45.00 per bottle ( ~ US$0.40/test) Contact Information: ENPHO 110/25 Adarsa Marga-1, Thapagaon, New Baneshwor Email: [email protected]
Cost: • US$38 for the kit (100 tests) ~ US$0.4/test Includes 100 reagent pillows, 100 sterile 20 ml sample bottles and case. • Extra 50 pillows for 100mL tests ~ US$40 • Extra 50 pillows for 20mL tests ~ US$30 (both extras require purchase of sterile bottles) Contact Information: HACH www.hach.com With various distributors worldwide http://www.hach.com/global-distributor-support
Test type: Fecal coliform (H2S producing bacteria) Necessary Equipment:
• Incubator • Permanent marker Summary: Coliform presence/absence test kit is used to detect the bacterial contamination of drinking water. Can also be used in MPN format (5 to 10 bottles per test). Test can take up to 48 hours to complete. Notes: • Easy to use and to read • Will turn positive for all H2S producing bacteria which produce within 24 hours • Positive reactions within 1 hour of incubation may come from sulphide rich water (false
positive) • Avoid using with groundwater as high possibility of naturally occurring sulphides
Drinking Water Quality Testing Appendix 1 Equipment and Materials
A1-11
2.4.2. More specific P-A tests
IDEXX Colilert HACH Presence-Absence
Test type: Coliforms and E. coli (presence/ absence) Cost: package of 20 tests- US$186 (~$9.30 each). This price includes shrink band containers which are usually purchased separately. Colilert reagent for 100 ml tests costs US$5.4/reagent (US$1080 for a pack of 200) Containers of 120 ml costs US$0.80/container (US$205 for 200) Incubation: 24 hours at 35 oC Contact Information: IDEXX Tel: 1-800-321-0207 Website: www.idexx.com/water
Test type: Coliforms and E. coli (presence/ absence) Cost: package of 50 tests - US$192 (~$3.84 each) Incubation: 24-48 hours at 35 oC Contact Information: HACH www.hach.com
Summary: The water sample is poured in a 20 ml or 100 ml sterile container, the reagent (powder) is then poured (IDEXX) or already contained in the vessel (HACH). These tests detect 1 CFU/ 100 ml. A positive coliform result will show a colour change from clear to yellow, and a positive E. coli result will show fluorescence under a UV long wavelength lamp. IDEXX and HACH w/ MUG P-A tests use the MUG reagent which produces a fluorogenic product (fluorescent) when it reacts with an enzyme specific to E. coli. Necessary Equipment: • Incubator • UV long wavelength lamp • Graduated cylinder • Bleach (for disposal) • Comparator colour guide • Permanent marker
Notes: • Easy to use • More specific than H2S tests • Significant amount of waste generated
Drinking Water Quality Testing Appendix 1 Equipment and Materials
A1-12
2.5. Other Test Methods
2.5.1. 3M Petrifilm
Product Name: Petrifilm Test type: E. coli, total coliforms. Petrifilms are also available for a variety of other contaminants. Cost: • 50 plates – $100 (~ $2 each) • 500 plates – $736.00 (~ $1.50 each) Necessary Equipment: • Pipette or calibrated dropper • Incubator • Bleach (for disposal) • Permanent marker • Filter apparatus and filter paper (optional) Summary: There are two procedures for water testing using Petrifilm, but neither are approved international methods. The first procedure recommends the water be filtered through a cellulose acetate filter and the filter be placed on the Petrifilm. This would allow a 100 ml sample to be tested. The filter paper is not included. For this procedure the gel needs to be prepared ahead of time adding a few extra hours on to the procedure time. If the water sample was really contaminated it could be a challenge to count all the bacteria colonies and the sample may have to be diluted. The second procedure (used by Robert Metcalf) tests a 1 ml sample by placing the sample directly on the Petrifilm. This procedure does not require that the gel be prepared ahead of time. The challenge with this procedure is that sample size is very small and discrepancy is very likely. With any sample larger than 1 ml the water leaks off the film. Notes:
• Not an approved international test method • Easy to use and to easy to transport (light and small) • No filtering apparatus required • Broth is non-toxic, can incubate with body heat Contact Information: For suppliers: www.3m.com For specific product information: www.3m.com/product/information/Petrifilm-Plate.html
Drinking Water Quality Testing Appendix 1 Equipment and Materials
• Permanent marker Summary: The 384 ml capacity is measured when the bag is closed and tab is folded over three times. Volume and dimensions are approximate; bags should not be used at temperatures above 82° C. Bags can be frozen to any temperature – careful handling required after freezing. All bags are sterilized after manufacturing. Notes: • Easy to use and transport
Contact Information: www.enasco.com/whirlpak
Drinking Water Quality Testing Appendix 1 Equipment and Materials
A1-14
3. Chemical and Physical Testing 2.7. Test strips
HACH Macherey-Nagel EMD
Range (Steps) Price Range Price Steps Price
Total
Hardness
0-425ppm (0,
25, 50, 120,
250, 425
ppm)
(see website)
XX/50 tests
0, 85, 170, 270,
360, 430 ppm US$50/100 tests
Total
Dissolved
Iron
XX/25 tests
Nitrate
0-50ppm (0,
1, 2, 5, 10,
20, 50 ppm)
0, 10, 25, 50, 100,
250, 500mg/L US$60/100 tests
0-4ppm (0,
0.15, 0.3, 1,
1.5, 3 ppm)
XX/25 tests
0, 1, 5, 10, 20,
40, 80mg/l
£23.94/100
tests
0, 0.1, 0.3, 0.6, 1,
2, 3 g/L US$56/100 tests
Nitrate and
Nitrite
Nitrite
0, 0.1, 0.3, 0.6,
1, 2, 3mg/l
£23.94/100
tests
0, 2, 5, 10, 20, 40,
80 ppm US$56/100 tests
Free &
Total
Chlorine
0-10ppm (0,
0.5, 1.0, 2.0,
4.0, 10.0
ppm)
XX/50 tests 0, 1, 3, 10, 30,
100mg/l
£50.17/100
tests
0, 0.5, 1, 2, 5, 10,
20 ppm US$100/75 tests
Free Chlorine
Total Chlorine
Total Hardness
Total Alkalinity
5 in 1
Water
Quality
Test pH
XX/50 tests
10-20 ppm
increments
XX/40 tests
0, 500, 1000,
1500,
2000>3000mg/l
£28.80/100
tests
0, 500, 1000,
1500, 2000, 3000
ppm
US$50/100 tests
Chloride
100-200 ppm
increments XX/40 tests
Total
alkalinity
0-240ppm (0,
40, 80, 120,
180, 240
ppm)
XX/50 tests
4-9 pH (4, 5,
6, 7, 8, 9 pH
Units)
XX/50 tests
0, 1, 2, 3, 4, 5,
6, 7, 8, 9 pH
Units
£10.06/100
tests
Various options US$95/600 tests
pH
XX/100 tests
Amonia
0-6ppm (0,
0.25, 0.5, 1,
3, 6 ppm)
XX/25 tests
Aluminium
0, 5, 20, 50,
200, 500mg/l
£39.50/100
tests
0, 10, 25, 50, 100,
250 ppm US$90/100 tests
Ammonium
0, 10, 25, 50,
100, 200,
400mg/l
£40.58/100
tests
0, 10, 30, 60, 100,
200, 400 ppm US$70/100 tests
Phosphate
0, 3, 10, 25, 50,
100mg/l
£36.11/100
tests
10, 25, 50, 100,
250, 500 ppm
US$100/100
tests
Fluoride
0, 2, 5, 10, 20,
50, 100mg/L F,
£68.71/30
tests
Refer to manufacturer’s websites for more choice and information (www.hach.com, www.macherey-nagel.com, www.emdchemicals.com). There are also many other manufacturers of test strips.
Drinking Water Quality Testing Appendix 1 Equipment and Materials
A1-15
2.8. Colorimeters and Photometers
2.8.1. Wagtech Color comparator kit
Product Name: Wagtech Color Comparator kits Test type: See table below Cost: • ~US$155 for the kit • ~US$75 for each colour disc (one for each chemical parameter) • Reagents vary between US$90 to $120 for 250 tests (US$0.40-0.50 per test) Necessary Equipment:
• Colour discs • Comparator reagents • Distilled water (if necessary) Summary: The colour comparator is quick and easy to use and gives accurate reliable results. The kit is used in conjunction with tablet reagents and colour charts to test 32 different parameters. Just add a tablet reagent to the test sample, place the tube in the comparator and match the colour against the appropriate colour disc. The kit includes: comparator, 4 square cuvettes and dilution tube. The kit contains no reagents or discs these should be ordered separately.
Drinking Water Quality Testing Appendix 1 Equipment and Materials
A1-16
Colour discs Comparator Reagents
Notes:
• Easy to use and to easy to transport (light and small) • Relatively precise results. Contact Information: Wagtech International Wagtech Court Station Road Thatcham Berkshire RG19 4HZ United Kingdom Tel +44 (0) 1635 872929 [email protected] www.wagtech.co.uk
Drinking Water Quality Testing Appendix 1 Equipment and Materials
A1-17
2.8.2. Hach Colorimeter DR/850
Product Name: Hach Colorimeter DR/820 (20+ methods) or DR/850 (50+ methods) Cost: • ~US$720 (DR/820) • ~US$920 (DR/850) Test Type: acid, chromium 1, chromium 2, cyanide 3,4 and 5, total and free chlorine, fluoride, nitrate, lead, iron, manganese, Necessary Equipment:
• Reagents Summary: The colorimeter is expensive and the reagents vary in cost. The procedure has a high accuracy and the results can be obtained immediately. The main advantage of the DR/850 over the DR/820 is it can test for Fluoride and Phosphorus. Contact Information: www.hach.com/dr800series
Drinking Water Quality Testing Appendix 1 Equipment and Materials
A1-18
2.9. Parameter specific test kits
2.9.1. Arsenic
There are many arsenic kits available. Most are based on the Gutzeit Method which results in the production of arsine gas which reacts with mercuric bromide impregnated on test paper resulting in colour change.
Wagtech Digital Arsenator HACH Arsenic Test Kit ENPHO Arsenic Kit
Cost: US$700 (420 tests), $1.70/test Summary: The Digital Arsenator uses an optical photometer to digitally measure the colour change on mercuric bromide filter paper, and it’s portable. It detects arsenic within a reported range of 2-100 µg/L. The Arsenator is significantly more expensive than manual colour comparison kits, but is more accurate and precise. The complete system comes with sufficient reagents and consumables for 420 tests. Contact Information: Wagtech International Wagtech Court Station Road Thatcham Berkshire, RG19 4HZ, UK Tel +44 (0) 1635 872929 [email protected] www.wagtech.co.uk
Cost: US$123 (100 tests), $1.20/test Summary: The HACH Arsenic test kit is similar to the Wagtech Visual Arsenic Detection kit. Contact Information: www.hach.com
Cost: ~Rs.6000.00 ($75) for 50 tests ($1.50/test) Summary: ENPHO has developed a semi-quantitative low cost field test kit for testing untreated ground water, like tube-well. The salient features of the kit are easy to test, portable and rapid. Once the reagents are finished they can be refilled. If the concentration of arsenic in the water is higher than 150 µg/L it is better to dilute the sample with distilled water, for better results. Range: 10 µg/L – 500 µg/L. Contact Information: ENPHO 110/25 Adarsa Marga-1, Thapagaon, New Baneshwor Nepal Email: [email protected]
Drinking Water Quality Testing Appendix 1 Equipment and Materials
A1-19
Other Commercially Available Arsenic Test Kits* • Acustrip Inc. ( www.acustrip.com ) markets five different arsenic test kits. The main
product, the Arsenic Check test (#481396) has a range of 5-500 µg/L, while the lowerpriced, less sensitive version (#481298) has a range of 10-1000 µg/L. The company also markets a low-range kit (#481297) with a range of 2-160 µg/L and two “individual” kits for household use. The Acustrip kits have a reported reaction time of only 12 minutes.
• The Asia Arsenic Network ( www.asia-arsenic.net ), an early player in arsenic testing and kit development, continues to market an inexpensive kit with a range of 20-700 µg/L in Bangladesh (through NIPSOM – National Institute of Preventative and Social Medicine – www.nipsom.org ) and Nepal (through ENPHO - Environment and Public Health Organization, www.enpho.org). Kit specifications are available online.
• Merck ( www.merck-chemicals.com ) has produced arsenic test kits for many years. Currently the company markets two colorimetric (colour chart) kits: the standard Merckoquant arsenic test kit (#117917) with a reported detection range of 20-3000 µg/L and the newer more sensitive kit (#117927) with a reported detection range of 5-500 µg/L. Merck has also released a new digital optical photometer Spectroquant arsenic kit (#101747) with a reported range of 1-100 µg/L. This kit is used with Merck’s photometers to digitally measure colour results for better accuracy and precision. These photometers are typically used in a laboratory setting, but one model, the Nova 60A (# 1.09751.0001) comes with a battery pack and can be used as a “portable field station” (although it is much larger and heavier than the arsenator, below).
• A joint project between UNICEF and the Rajiv Gandhi National Drinking Water Mission in India has developed specifications for a field kit that does not use the conventional mercuric-bromide paper. Instead, a detector tube is filled with a granular media coated with a secondary colour reagent that reacts with arsenic and mercuric bromide to produce a pink colour. Following completion of the test, arsenic concentration (10-110 µg/L) is read directly by measuring the extent of pink colour penetration in the detector tube. Specifications for the kit are available from the Rural Water Supply Network (RWSN)
• UNICEF also supported the development of locally manufactured arsenic test kits in China, Thailand and Vietnam, and the former two are still in use. The Thai kit, developed and marketed by Mahidol University ( www.mahidol.ac.th ), has a detection range of 10-110 µg/L and is used both in Thailand and in other countries in the region.
* This list does not include all available kits, and it also does not constitute an endorsement of the companies or products that are listed. Modified Extract from UNICEF Handbook on Water Quality, 2008 Available at: www.unicef.org/wes/files/WQ_Handbook_final_signed_16_April_2008.pdf
Drinking Water Quality Testing Appendix 1 Equipment and Materials
A1-20
2.9.2. Fluoride
Fluoride, Pocket Colorimeter II Test Kit
Product Name: Hach Fluoride Colorimeter II Cost: ~US$385 Test type: Fluoride Necessary Equipment: • Reagents
Summary: Range 0.1 to 2 mg/L, with SPADNS Fluoride AccuVac reagent set (50 tests). Two precalibrated curves provided for using SPADNS Fluoride AccuVacs or SPADNS Fluoride Solution (order separately, Cat. No. 444-49). Software allows for data logging and calibration slope adjustment. Note: If you will be testing for other chemical parameters too, the HACH DR/850 may be more suitable as it tests for fluoride as well. Contact Information: HACH (USA) www.hach.com
Drinking Water Quality Testing Appendix 1 Equipment and Materials
A1-21
2.9.3. Chlorine & pH
Chlorine ‘Pool’ Tester - Free residual and Total Chlorine
Product Name: Pooltester – Residual and Total Chlorine, pH Cost: US$10-15 (for 20 tests), DPD (Chlorine) and Phenol Red (pH) reagents (tablets) cost between $0.10 and $0.50 per tablet. Test type: Free Residual Chlorine (DPD1), Total chlorine (DPD3), pH (Phenol Red)
Summary: The most economical method to test for residual chlorine, total chlorine and pH. Notes: Any standard pool tester should work. Make sure the ranges are sensitive enough between 0.1 mg/L and 1.0 mg/L (for example steps should be 0.1, 0.2, 0.3, 0.4, 0.5, etc.) when you wish to test for residual chlorine (which is ideally between 0.2 and 0.5 mg/L). The DPD tablets are designed for a specific volume of water (usually 10mL). Check instructions.
Drinking Water Quality Testing Appendix 1 Equipment and Materials
A1-22
B. Cost of Equipment and Consumables
Company Equipment and Materials Cost
(2008 US$) Biological Test Kits Hach MEL/MPN Total Coliform and E. coli 3092.70 Biological Reagents Replacement Apparatus Set for 50 samples 111.80 Buffered dilution water (pk/25) 105.85 Lauryl Tryptose w/MUG broth tubes, pk/15 50.00 m-ColiBlue24 media set for 50 tests 151.20 Absorbent pads and Membranes, Pack of 200 80.00 Chemical Test Kits CEL/850 Basic Drinking Water Lab 3377.45 Replacement agents 645.35 Chemical Test Strips Ammonia 925 tests) 41.70 Alkalinity (50 tests) 19.35 Arsenic low range (100) 272.30 Chloride (30-600ppm) 25.0 Copper (25 tests) 41.70 Chlorine, hardness, alkalinity and pH (50 tests) 30.65 Hardness (50 tests) 19.35 Iron (25 tests) 41.70 Nitrate and Nitrite (25 tests) 41.70 pH (50 tests) 25.00
Hach Company, USA
Phosphorous (50 tests) 41.70 Biological Test Kits WagTech JMP Kit includes switch able between 37 and 44
o
C incubator, materials for 200 faecal coliform tests, turbidimeter, Conductivity meter, Wagtech photometer kit which allows the measurement of 400 different chemical parameters including Ammonia, Aluminium, Manganese, Iron, Fluoride and Nitrate.
2500.00
Biological Test Reagents m-ColiBlue24 media set for 50 tests 151.20 100 ml bottle for 50 tests 78.90 Membrane Laurel Sulphate Broth 38.1g to the 500mL 102.0 Absorbent Pads and Membranes, Pack of 200 80.00 Chemical Test Kits Wagtech Digital Arsenator a portable instrument kit to measure low levels of arsenic in drinking water. Measures within the range 2 - 100 ppm arsenic. Includes materials for 420 tests.
650.00
WagTech 7100-Portable Photometer 1,031.00 WagTech 10195 Comparator Kit 155.00 Comparator Discs for per chemical 75.00 Chemical Test Reagents Ammonia (250 tests) 70.00 Chlorine free and total (250 tests) 42.00
Wagtech International, UK
Fluoride (250 tests) 100.00
Drinking Water Quality Testing Appendix 1 Equipment and Materials
A1-23
Company Equipment and Materials Cost
(2008 US$) Iron (250 tests) 110.00 Manganese (250 tests) 84.00 Nitrate (250 tests) 122.00 Phosphate (250 tests) 116.00 Biological Test Kit Oxfam DelAgua Portable Test Kit includes material for 200 faecal coliform tests, chlorine test apparatus and turbidimeter
3500.00
Biological Test Reagents
Membrane Laurel Sulphate Broth 38.1g to the 500mL (for 250 tests)
102.00
Absorbent Pads and Membranes, Pack of 200 80.00
University of Surrey, UK
The following methods are not recognized widely but you can use for your own validation:
Chemical Test Kit
ENPHO-Nepal Arsenic Kit including 50 tests 100.000
ENPHO, Nepal
ENPHO Field Kit including testing reagents for 10 chemical parameters (100 tests)
250.00
Biological Test Kit Coliscan Kit is available, and includes materials for 100 tests, including Coliscan MF medium, 100 membrane filters (47 mm), 100 dishes with absorbent pad, instruction page, and a colony color guide
187.00
Plastic Filter Apparatus 8.00 Filter support Pad for 10 pcs 23.00 Graduated Cylinder (100 mL) from Uniscience Lab, 3.00 Pipettes 3 mL (500 pcs) 30.00 Wash Bottles 250 mL 3.50
Micrology Laboratories, USA
Portable Egg Incubator Hova Bator (G.Q.F. manufacturing) A small incubator used in poultry production.
50.00-100.00
Drinking Water Quality Testing Appendix 1 Equipment and Materials
A1-24
C. Supplier Contact Information
Hach Company P.O. Box 389 Loveland, CO 80539 Tel: (800) 525-5940 Website: www.hach.com
Wagtech International Ltd Wagtech Court, Station Road Thatcham Berkshire RG19 4HZ United Kingdom Tel: +44 (0) 1635 872929 Fax: +44 (0) 1635 862898 Email: [email protected] Website: www.wagtech.co.uk
Robens Centre for Public and Environmental Health AW19, University of Surrey Guildford, GU2 5XH United Kingdom Tel: +44 1483 879209/879281 Fax: +44 1483 879971 Email: [email protected] Website: www.rcpeh.com or
www.delagua.org
Environment and Public Health Organization (ENPHO) 110/25 Adarsa Marg-1, Thapagaon, New Baneshwor, G.P.O Box No. : 4102, Kathmandu(East), Nepal Tel: 977-1-4468641, 4493188 Fax: 977-1-4491376 Email: [email protected] Website: www.enpho.org/products.htm
Millipore Corporation 397 Williams Street Marlborough, MA 01752 Tel: (800) 225-1380 Website: www.millipore.com
Drinking Water Quality Testing Appendix 2 Establishing a Laboratory
A2-1
Establishing a Water Quality Testing Laboratory
Having a water quality testing laboratory within the project makes it easier to monitor water quality and identify the effectiveness of a HWT program. A laboratory set up is often driven by scientific and regulatory considerations so it may not be feasible to establish a laboratory in all projects. The feasibility depends upon the availability of financial resources, physical facilities, lab personnel and basic lab instrumentation. Basic Purpose of a Project Laboratory: • Determine the level of physical, biological and chemical contaminants of treated water
(before and after) through household water treatment technology. • Identify the contaminants present in local water supply and sources. • Raise awareness regarding the consequences of contaminated water in the communities. • Analyze the quality of drinking water samples for the further improvement of water source
or household water treatment technology. • Provide reliable water quality testing services to clients based on their request. Range and Types of Samples The water quality lab should focus on testing samples related to drinking water (i.e. different sources, before and after treatment). Scope of Work The scope can include procurement of equipment, reagents, training, delivery and installation to provide a fully functioning laboratory. Depending on the local situation, lab personnel may identify the analytical procedures to be used. Determination of the instruments, equipment, and laboratory information management systems specifications, and consumables, supplies, spare parts required for the operation of a fully functioning laboratory. Analytical methods should be designed according to the national water quality standards. The WHO Guidelines for Drinking Water Quality are also available to help determine testing procedures. Other published governmental and non-governmental methodologies can be used as references as well such guideline for Canadian Drinking Water Quality and Oxfam Guidelines for Water Quality Treatment in Emergency. Laboratory Layout You should organize the layout and design of laboratory furniture and equipment taking into consideration the space available, storage, sterilization, sample retention, and office/clerical/supervisory staff. As well, special attention has to be given for the proper disposal of waste generated during the testing process.
Drinking Water Quality Testing Appendix 2 Establishing a Laboratory
A2-2
Physical Facility • A room size at least 3 m x 4 m with good ventilation, sink and water supply • Refrigerator • Shelves or racks • Source of electricity Staff and Equipment One or possibly two laboratory staff may be required to undertake the required physical, chemical and microbiological tests. The laboratory staff of each type of laboratory, in liaison with the project implementer would typically be responsible for: • Laboratory management • Determining and procuring the equipment and supplies that will be needed • Ensuring that laboratory standards are being followed and maintain quality control of • analytical procedure • Training new staff in the use of new equipment and procedures • Enforcing safety precautions and procedures, especially for fire and explosions • Preparing reagents and media, standardizing as necessary and storage under proper
conditions of reagents and media. • Checking accuracy of electronic equipment used in field analyses. • Preparing an inventory and stock control of chemicals and media. It would be appropriate to provide two sets of portable water testing equipment during the initial stage. The following is a potential equipment list for a laboratory. • Single incubator • 18 aluminium Petri dishes • Spirit thermometer • 18 aluminium calibration Petri dishes • Transformer/ battery • Charger • Two pin plug adaptor • Internal rechargeable and removable DC battery • Battery cable and crocodile clips • Vehicle cigarette adaptor • Membrane filtration unit • Membrane filters • Absorbent pads (2 containers) • Pad dispenser • Forceps • Dropping pipettes (5) • Containers that can be sterilized • Plastic beakers • Media measuring device • Lighter
Drinking Water Quality Testing Appendix 2 Establishing a Laboratory
A2-3
• Portable magnifier • Tube of silicone grease • Dilution tube (with brush) • Tablet crusher (3) • Waterproof digital turbidity meter • Calibration kit • Carrying case • Conductivity meter • pH 4, 7, 10 buffer solutions • Replacement batteries 1.5 V (4) • Photometer • Photometer lid • 6 test tubes • Reagents:
• Screwdriver • Stopwatch • Manuals (4) • Paper towel • Whirl-pak sample bags • Alcohol strip • Distilled water • Methanol • Sterilizer (autoclave, etc.) Safe Waste Disposal A project laboratory should be designed to dispose the lab waste generated during the testing process. Active bacterial cultures grown during incubation must be disposed of properly. See Section 6 for more details on how to safely dispose waste.
Drinking Water Quality Testing Appendix 2 Establishing a Laboratory
A2-4
Case Study: Community Laboratory in Cambodia The Water and Watershed Research Program in the Department of Biology at the University of Victoria assisted in the installation of a water quality testing laboratory in Siem Reap, Cambodia. The total cost for the lab equipment and supply was about US$10,000. The re-modeling of building cost about $2,500. The operating cost is about $25,000 US per year which includes the salaries for two employees, supplies, etc. The employees are a lab technician and field supervisor who go out into communities to conduct interviews and collect samples. The lab is able test about 30 samples per day. The tests done on each sample include membrane filtration using standard lab equipment. Conductivity, salinity, TDS, turbidity, iron, nitrates, phosphates, chlorine, and other colormetric analyses are performed using the Hach 890 colorimeter, a Hach portable turbidimeter and a portable conductivity meter. (University of Victoria, Personal Correspondence, 2007)
Drinking Water Quality Testing Appendix 3 Determining the Sample Size
A3-1
Determining the Sample Size
This is a sample size calculated by using formula derived from the University of Florida (http://edis.ifas.ufl.edu.). It shows that small sample population needs to select relatively a big number of samples. This table shows the sample size based on population and precision level.
Based on CAWST experience, it is recommended to use minimum 30 units in small project (less than 100 households) and 10-15 % precision a larger project (more than 100 households). The sample size also depends on the variation or diversity of geographical location, socio-economic status, and homogeneity in the community in terms of religion and beliefs.
Sample size for ±5%, ±7% , ±10% and ±15% Precision Levels
Where Confidence Level is 95%
Sample Size (n) for Precision (e) of: Size of Population
Drinking Water Quality Testing Appendix 4 Quality Control
A4-1
Quality Control Large-scale projects may want to monitor the quality of reagents, media and membranes on a regular basis. Whenever you need to order new reagents, media and membrane pad; it is a good idea to compare the products with those currently in use. Procedure 1. Assemble at least five positive water samples (samples that have been shown to be contaminated). The use of more samples will increase the sensitivity of the test. 2. Process the samples using the test batch of materials and the batch currently in use. 3. Incubate the testing apparatus. 4. Compare the growth characteristics of the contaminating organism on the two batches of materials. Note any unusual readings. 5. Count or calculate the number of colonies per 100 mL. 6. Transform the counts to logarithms and enter the results for the two batches of materials in parallel columns. 7. Calculate the difference d between the two transformed results for each sample (include the + or - sign). 8. Calculate the mean of the differences and the standard deviation. 9. Perform a t-test, using the number of samples as n. 10. Use a statistical table to determine the critical value of t at the 0.05 significance level (two-tailed test). Some critical values are given below. If the calculated value of t exceeds the critical value, the two batches of materials give significantly different results.
No of samples (n) Degree of freedom Critical value of t at 0.05
If this test indicates a problem with the new batch of materials, the test conditions and procedure should be carefully reviewed and the batch retested. The batch should be rejected as unsatisfactory only if the problems are confirmed by this second test.
Drinking Water Quality Testing Appendix 4 Quality Control
A4-2
Precision Testing Precision testing is important in the microbiological laboratory because test results can reveal procedural problems and problems with the materials. Satisfactory results must be obtained from precision tests before the results of monitoring tests are reported. Procedure 1. At the beginning of each month, or at the earliest convenient time, collect 15 samples that are likely to be positive by the first procedure, with a range of positive results. 2. Make duplicate analyses of each sample. The same analyst should do the tests, but all technicians should be included, on a rota basis. 3. Record the results of the duplicate tests as D1 and D2. Calculate the logarithm of each result. If either of a set of duplicate results is zero, add 1 to both values before calculating the logarithms. 4. Calculate the difference R between each pair of transformed duplicates, and the mean of these differences . 5. Calculate the precision criterion as 3.27 R. 6. Thereafter, analyse 10% of routine samples, or a minimum of two samples per day, in duplicate. Calculate the logarithm of each result and the difference between the logarithms. If the difference is greater than the calculated precision criterion, technician variability is excessive and the analytical procedure should be reviewed. The laboratory manager should decide whether or not to release monitoring test results in the light of past performance.
(Adapted from WHO, 1996)
Drinking Water Quality Testing Appendix 5 Data Recording Forms
A5-1
Data Recording Form Location: _______________________________________ Sample Taken By: ______________________________________________________________ Date of Sampling: ________________________________ Sample Tested By: ______________________________________________________________
Total Coliform Sample
Description Sample
ID # Turbidity
(NTU) pH
Chlorine (mg/L)
Iron (mg/L)
Manganese (mg/L)
Phosphate (mg/L)
Nitrate (mg/L)
Flouride (mg/L)
E. coli
(CFU/100 ml)
Fecal Coliform (CFU/100 ml)
Date of Report: ________________________________________ Comments:
Drinking Water Quality Testing Appendix 6 Test Procedures
A6-1
Arsenic Sources Arsenic can naturally occur in ground water and some surface water. It is one of the greatest chemical problems in developing countries. The WHO considers arsenic to be a high priority for screening in drinking water sources (WHO, 2006). High levels of arsenic can be found naturally in water from deep wells in over 30 countries, including India, Nepal, Bangladesh, Indonesia, Cambodia, Vietnam, Lao PDR, Mexico, Nicaragua, El Salvador and Brazil. In south Asia alone, it is estimated that 60 to 100 million people are affected by unsafe levels of arsenic in their drinking water. Bangladesh is the most severely affected, where 35 to 60 million of its 130 million people are exposed to arsenic-contaminated water. It is possible that arsenic may be found in other locations as more extensive testing is done. Potential Health Effects Arsenic is poisonous, so if people drink water or eat food contaminated with arsenic for several years, they develop chronic health problems called arsenicosis. Melanosis is the first symptom of drinking arsenic contaminated water over a few years. Melanosis is light or dark spots on people’s skin, often on the chest, back, or palms. The next step is that hardening skin bulges develop on people’s palms and feet – called keratosis. Drinking high amounts of arsenic for a longer time may cause cancer in the lungs, bladder, kidney, skin, liver, and prostate. Arsenic may also cause vascular diseases, neurological effects, and infant developmental defects. Arsenicosis can be partially reversed and treated in the early stages, by making sure people stop drinking arsenic contaminated water and by improving their nutrition. There is currently no effective cure for arsenic poisoning. The only prevention is to drink water that has safe levels of arsenic. According to the UNDP (2006), the projected human costs over the next 50 years include 300,000 deaths from cancer and 2.5 million cases of arsenic poisoning. WHO Guidelines The World Health Organization (WHO) considers arsenic to be a high priority for testing in drinking water sources. The WHO suggests that drinking water should have less than 0.01 mg/L of arsenic. (0.01 mg/L is the same as 10 µg/L or 10 ppb.)
WHO Guideline for Drinking Water < 0.01 mg/L
Drinking Water Quality Testing Appendix 6 Test Procedures
A6-2
Many countries have their own standards which are less strict, ranging from 0.025 mg/L to 0.05 mg/L (25-50 ppb). Many Southeast Asian countries that have an arsenic problem have adopted a temporary standard of 0.05 mg/L because it is difficult to test accurately to 0.01 mg/L and to treat water to meet that standard. Household Water Treatment Options One way to deal with arsenic in groundwater is to use a different source of drinking water, such as rainwater or surface water. Some people collect and store their rainwater and use it for drinking and cooking instead of arsenic contaminated ground water. If people change their water source to surface water, they will probably need to treat the water to remove turbidity and pathogens. If people are unable to change to a water source that doesn’t have arsenic, there are several different technologies that have been developed to remove arsenic from water. Each technology has advantages and limitations. Many of these technologies are being used in Bangladesh where the arsenic problem is widespread. See the Household Water
Treatment for Arsenic Removal Fact Sheets for more information on the different technologies.
Arsenic Mitigation
Arsenic Removal Technologies
• Oxidation
• Coagulation
• Adsorption
• Complexation
Alternative Arsenic Free Sources
• Safe tube wells
• Deep wells
• Rainwater harvesting
• Surface water
Drinking Water Quality Testing Appendix 6 Test Procedures
A6-3
Arsenic Test Procedure This test procedure uses the ENPHO-Nepal test kit reagents and equipment. If you buy equipment from a different company, then you will have to follow their instructions for the arsenic test.
ENPHO-Nepal Test Kit Reagents and Equipment:
• Arsine Generator Flask
• Mercuric Bromide Paper Holder
• Measuring Cylinder
• Mercuric Bromide Paper
• Tablet 1 and Tablet 2
• Reagent 1
• Standard Solution (5000 ppb)
• Cap of Mercuric Bromide Paper Holder
• Cotton
• Distilled Water (for dilution)
• Forceps
• Colour Chart
• Disposal Bag
• Water Sample
Instructions:
1. Take a piece of cotton and insert it in the wider part of the tube of bromide paper
holder.
2. Soak the cotton with one drop of Reagent 1.
3. Place the Mercuric Bromide paper in the cap “c” and fit it in the small tube.
4. Measue 20 mL of your water sample and pour in arsenic generator flask.
5. Add a piece of Tablet 1 in your water sample
6. Add a piece of Tablet 2 in your water sample and immediatly fit the mercuric
bromide paper holder tightly and allow it to stay till the tablets are completely dissolved.
7. After the tablets completely dissolve, gently swirl the flask and let stand for 5 minutes.
8. Detached the bromide paper holder from the flask and remove the filter paper with the
help of forceps.
9. Compare the colour on the bromide paper with colour chart.
Drinking Water Quality Testing Appendix 6 Test Procedures
A6-4
Chlorine Sources Chlorine is a chemical that we commonly add to drinking water to kill most pathogens that can make us sick. Chlorine is not usually found naturally in the environment in large amounts that can hurt us.
Two things can happen when we add chlorine to water: 1. Some chlorine reacts with other organic matter and forms new chlorine compounds.
This part is called combined chlorine. 2. Left over chlorine that is not combined is called free chlorine. The free chlorine is
mostly what gives protection of the drinking water to help prevent against secondary contamination. It is good to have 0.2 - 0.5 mg/L of free chlorine.
Total Chlorine = Combined Chlorine + Free Chlorine
The amount of chlorine required to disinfect water is very dependant on each source (organic matter, pH, temperature, etc). Potential Health Effects A small amount of chlorine in water is good since it kills most pathogens that can make us sick. Many cities around the world add chlorine to their water to make it safe for people to drink. High amounts of chlorine can irritate our skin and eyes if we touch it. The strong smell of chlorine can also hurt our throat and lungs if we breathe it in. WHO Guidelines The WHO suggests that drinking water should have less than 5.0 mg/L of chlorine. When we add chlorine to disinfect drinking water, it is good to have between 0.2 – 0.5 mg/L of free residual chlorine to give long-term protection.
WHO Guideline for Drinking Water < 5.0 mg/L
Household Water Treatment Options Since the addition of chlorine to water is a form of water treatment, we normally do not try to remove chlorine from drinking water. It is good to have some chlorine in drinking water to help make it safe.
Drinking Water Quality Testing Appendix 6 Test Procedures
A6-5
Chlorine Test Procedure This test procedure uses Wagtech reagents and equipment. If you buy equipment from a different company, then you will have to follow their instructions for the chlorine test. Reagents and Equipment:
• Wagtech DPD No.1 Tablets
• Wagtech DPD No.3 Tablets
• Wagtech Comparator
• Wagtech Colour Disc
• Square Test Tubes (13.5 mm) 10 mL
• Water Sample
Instructions:
1. Rinse a square test tube with your water sample and leave 2 or 3 drops of water in
the tube.
2. Add one DDP No.1 Tablet , crush the tablet, and then fill the test tube with the water
sample to the 10 ml mark. Mix to dissolve the tablet.
3. Place the test tube in the Comparator and match immediately against the colour disc.
The disc reading represents the free chlorine as mg/L. Stop the test at this stage if
you are only determining the free chlorine.
4. If you want to determine the total chlorine, add one DPD No.3 Tablet to the same
test tube. Crush the tablet and mix to dissolve.
5. Let the test tube to stand for two minutes.
6. Place the test tube in the Comparator and match against the colour disc. The disc
reading represents the total chlorine as mg/L.
7. The combined chlorine (mg/L) is calculated by using the following formula:
Total Chlorine = Combined Chlorine + Free Chlorine
Combined Chlorine = Total Chlorine - Free Chlorine
Drinking Water Quality Testing Appendix 6 Test Procedures
A6-6
Fluoride Sources Fluoride can naturally occur in groundwater and some surface water. Drinking water is normally the major source of fluoride exposure, with exposure from diet and from burning high fluoride coal also major contributors in some regions. High levels of fluoride can be found naturally in many areas of the world including, Africa, the Eastern Mediterranean and southern Asia. One of the best known high fluoride areas extends from Turkey through Iraq, Iran, Afghanistan, India, northern Thailand and China. However, there are many other areas with water sources that contain high fluoride levels and which pose a risk to those drinking the water, notably parts of the rift valley in Africa. It is possible that fluoride may be found in other locations as more extensive testing is done. Potential Health Effects A small amount of fluoride in water is generally good for strengthening people’s teeth and preventing decay. Fluoride is added to some city water systems and certain consumer products to protect teeth such as toothpastes and mouthwashes. Small amounts of fluoride are generally good for people’s teeth. But at higher amounts over time, it can cause dental fluorosis and damage people’s teeth by staining and pitting. Over many years, fluoride can build up in people’s bones, leading to skeletal fluorosis characterized by stiffness and joint pain. In severe cases, it can cause changes to the bone structure and crippling effects. Infants and young children are most at risk from high amounts of fluoride since their bodies are still growing and developing. There is currently no effective cure for fluorosis – the only prevention is to drink water that has safe levels of fluoride. WHO Guidelines The WHO suggests that drinking water should have 0.5 – 1.0 mg/L to protect teeth. Many cities around the world add fluoride to their drinking water to reach this level. Higher amounts of fluoride between 1.5 – 4.0 mg/L can cause dental fluorosis. Very high amounts of fluoride greater than 10.0 mg/L can lead to skeletal fluorosis. This is why the WHO suggests that drinking water should not have more than 1.5 mg/L of fluoride.
WHO Guideline for Drinking Water < 1.5 mg/L
Drinking Water Quality Testing Appendix 6 Test Procedures
A6-7
Household Water Treatment Options The best way to deal with fluoride in groundwater is to find a different source of drinking water, such as rainwater or surface water. Some people collect and store their rainwater during the wet season and use it for drinking or to dilute their groundwater during the rest of the year. This helps to lower the amount of fluoride in their water and make it safer to drink. If people change their water source to surface water, they will probably need to treat the water to remove turbidity and pathogens. Many of the areas that have fluoride contamination are arid and alternative sources of water are not available. There are emerging household water treatment technologies that are able to remove fluoride from drinking water. More research is needed to find a simple, affordable and locally available technology that can be easily used by households.
Fluoride Mitigation
Fluoride Removal Technologies
• Activated alumina
• Nalgonda technique
• Bone charcoal
• Clay
• Contact precipitation
Alternative Fluoride Free Sources
• Rainwater harvesting
• Surface water
Drinking Water Quality Testing Appendix 6 Test Procedures
A6-8
Fluoride Test Procedure This test procedure uses Wagtech reagents and equipment. If you buy equipment from a
different company, then you will have to follow their instructions for the fluoride test.
Reagents and Equipment:
• Wagtech Fluoride No. 1 Tablets
• Wagtech Fluoride No.2 Tablets
• Wagtech Comparator
• Wagtech Colour Disc
• Square Test Tubes (13.5 mm) 10 mL
• Water Sample
Instructions:
1. Fill a square test tube with your water sample to the 10 mL mark.
2. Add one Fluoride No.1 Tablet, crush the tablet, and mix to dissolve.
3. Add one Fluoride No.2 Tablet, crush the tablet, and mix to dissolve.
4. Let the test tube stand for 5 minutes.
5. Place the test tube in the Comparator and match against the colour disc. The disc
reading represents the fluoride as mg/L.
Drinking Water Quality Testing Appendix 6 Test Procedures
A6-9
Iron Sources Iron can be naturally found in groundwater and some surface water (such as creeks, rivers and some shallow dug wells). There are areas of the world that have naturally high amounts of iron in their groundwater. Iron can also be found in drinking water that is passed through rusty steel or cast iron pipes. Iron can come in two forms in water: dissolved and suspended. If groundwater comes from a deep tube well, the iron may be dissolved and not visible. However, once the iron is exposed to air, it usually turns the water black or orange colour. If surface water has iron in it, it will be a red-orange colour from the iron that is suspended in the water. Potential Health Effects Drinking water with high concentrations of iron will not make people sick. Iron, however, can change the colour of water and it may cause people to not use it and choose another, possibly contaminated, water source instead. WHO Guidelines The WHO does not have a suggested guideline for iron in drinking water since it does not have any adverse health effects. Usually, people do not like the taste of drinking water that has more than 0.3 mg/L of iron. Concentrations between 1.0 – 3.0 mg/L can be acceptable for people drinking anaerobic well water. Iron levels above 0.3 mg/L can stain water pipes and clothes during washing.
No WHO Guideline for Drinking Water
Household Water Treatment Options There are some different options to help take iron out of drinking water. To remove the orange colour suspended iron, you can let a container of water sit for a day and some of the orange flakes may settle to the bottom. Afterwards, you will need to pour out the clearer water from the container and throw away the orange flakes in a safe spot. Filters (such as the biosand filter or ceramic filters) can also be used to take out some of the iron from drinking water. Even straining the water through a cloth can remove some of the suspended iron.
Drinking Water Quality Testing Appendix 6 Test Procedures
A6-10
Iron Test Procedure This test procedure uses Wagtech reagents and equipment. If you buy equipment from a different company, then you will have to follow their instructions for the iron test. Reagents and Equipment:
• Wagtech Iron No. 1 Tablets
• Wagtech Iron No.2 Tablets
• Wagtech Comparator
• Wagtech Colour Disc
• Square Test Tubes (13.5 mm) 10 mL
• Water Sample
Instructions:
1. Fill a square test tube with your water sample to the 10 mL mark.
2. Add one Iron No.1 Tablet, crush the tablet, and mix to dissolve.
3. Add one Iron No.2 Tablet, crush the tablet, and mix to dissolve.
4. Let the test tube stand for 10 minutes.
5. Place the test tube in the Comparator and match against the colour disc. The disc
reading represents the iron as mg/L.
Drinking Water Quality Testing Appendix 6 Test Procedures
A6-11
Manganese Sources Manganese can be naturally found in groundwater and surface water, and it usually occurs with iron. However, human activities may also be responsible for manganese contamination in water in some areas. Manganese can come in two forms in water: dissolved and suspended. If groundwater comes from a deep tube well, the manganese may be dissolved and not visible. In surface water, manganese can be dissolved or suspended. Water with high levels of suspended manganese usually has a black colour or black flakes in it. Potential Health Effects People need small amounts of manganese to keep healthy and food is the major source for people. However, too little or too much manganese can cause adverse health effects. High levels of manganese, however, can turn water a black colour and it may cause people to not use it and choose another, possibly contaminated, water source instead. WHO Guidelines The WHO suggests that drinking water should not have more than 0.4 mg/L of manganese. Usually, people do not like the taste of drinking water that has more than 0.15 mg/L of manganese. Also, amounts above 0.15 mg/L can stain water pipes, clothes during washing, and food during cooking. Even levels of manganese below 0.05 mg/L may form black coatings on distribution pipes that come off into water as small black flakes. The presence of manganese in water may also lead to the accumulation of microbial growths in the water distribution system.
WHO Guideline for Drinking Water < 0.4 mg/L
Household Water Treatment Options There are some different options to help take suspended manganese out of drinking water. First of all, you can let a container of water sit for a day and some of the black flakes may settle to the bottom. Afterwards, you will need to pour out the clearer water from the container and throw away the black flakes in a safe spot. Filters (such as the biosand filter or ceramic filters) can also be used to take out some of the suspended manganese from drinking water. Even straining the water through a cloth can remove some of the flakes.
Drinking Water Quality Testing Appendix 6 Test Procedures
A6-12
Manganese Test Procedure This test procedure uses Wagtech reagents and equipment. If you buy equipment from a different company, then you will have to follow their instructions for the manganese test. Reagents and Equipment:
• Wagtech Manganese No. 1 Tablets
• Wagtech Manganese No.2 Tablets
• Wagtech Comparator
• Wagtech Colour Disc
• Square Test Tubes (13.5 mm) 10 mL
• Water Sample
Instructions:
1. Fill a square test tube with your water sample to the 10 mL mark.
2. Add one Manganese No.1 Tablet, crush the tablet, and mix to dissolve.
3. Add one Manganese No.2 Tablet, crush the tablet, and mix to dissolve. Put the cap
on the tube.
4. Let the test tube stand for 20 minutes.
5. Place the test tube in the Comparator and match against the colour disc. The disc
reading represents the manganese as ug/L.
Drinking Water Quality Testing Appendix 6 Test Procedures
A6-13
Phosphate Sources Phosphate or phosphorus is a natural mineral that is mined and used in fertilizers and soaps. They help plants to grow including water plants in lakes and rivers. With excessive plant growth, the waterways become clogged and fish will die off. Potential Health Effects Phosphates are not usually considered harmful to our health. However, high amounts of phosphate in water usually indicate that there is some contamination from mining, domestic wastewater, or excessive fertilizers being applied to farm land. This is an indicator that protecting the water source is needed to maintain a healthy natural water system. WHO Guidelines The WHO does not suggest a guideline value for phosphate in drinking water.
No WHO Guideline for Drinking Water
Household Water Treatment Options There are currently no practical or common household water treatment technologies that are able to remove phosphate from drinking water.
Drinking Water Quality Testing Appendix 6 Test Procedures
A6-14
Manganese Test Procedure
This test procedure uses Wagtech reagents and equipment. If you buy equipment from a
different company, then you will have to follow their instructions for the phosphate test.
Reagents and Equipment:
• Wagtech Phosphate No. 1 LR Tablets
• Wagtech Phosphate No.2 LR Tablets
• Wagtech Comparator
• Wagtech Colour Disc
• Square Test Tubes (13.5 mm) 10 mL
• Water Sample
Instructions:
1. Fill a square test tube with your water sample to the 10 mL mark.
2. Add one Phopshate No.1 LR Tablet, crush the tablet, and mix to dissolve.
3. Add one Phosphate No.2 LR Tablet, crush the tablet, and mix to dissolve.
4. Let the test tube stand for 10 minutes.
5. Place the test tube in the Comparator and match against the colour disc. The disc
reading represents the phosphate as mg/L.
Drinking Water Quality Testing Appendix 6 Test Procedures
A6-15
Turbidity Sources Turbidity is a physical property of water. It is the ‘cloudiness’ caused by small particles (suspend solids) that are generally invisible to the naked eye. One can compare it to smoke in air. In rivers and other surface waters, turbidity usual increases after heavy rain as the water picks up the dirt particles before emptying into the water sources. The units for measuring turbidity are NTU (Nephelometric Turbidity Units) which are not concentrations (mg per L) such as units for chemical testing, but rather values associated with how much light is reflected due to the amount of particles in the water. The more particles, the higher the NTU value. Potential Health Effects Turbidity doesn’t cause direct health impacts but is an indicator of biological contamination, as viruses, parasites and bacteria like to attach themselves to small particles. It also reduces the effectiveness of chlorination as chlorine will combine with the particles and less will be available to combine with the pathogens. WHO Guidelines The WHO guideline for turbidity is less than 5 NTU, which, to the naked eye, looks like clear water from a tap, spring or deep borehole.
WHO Guideline for Drinking Water < 5 NTU
Household Water Treatment Options Water with turbidity levels greater than 50 NTU can be often left to settle, allowing the particles to fall to the bottom. Filtering the water through a clean cotton cloth folded a few times over can also significantly reduce turbidity.
Drinking Water Quality Testing Appendix 6 Test Procedures
A6-16
Turbidity Test Procedure A simple test to measure the turbidity is to use a 2 L clear plastic bottle filled with the sample water. Place this on top of large print such as the CAWST logo on the participant manual. If you can see this logo looking down through the top of the bottle, the water probably has a turbidity of less than 50 NTU. Turbidity tubes are another easy and cheap way to visually estimate NTU. DelAgua and Wagtech testing kits provide turbidity tubes, but you can even make one yourself. Turbidity meters are electronic devices which provide quick and very accurate results allowing for high precision for turbidity less than 5 NTU. Equipment:
• Turbidity tube
Instructions:
1. Go outside or in a room with good lighting.
2. Rinse the turbidity tube with sample water 2 to 3 times.
3. Place a sheet of white paper on the floor
4. Hold the tube vertically and pour water sample into the tube slowly in stages of few
centimeters of water column at a time.
5. Holding the tube at hip level, over the white sheet of paper, try to see the cross or
circle at the bottom of the tube after each addition of water column from the top of
the tube. Keep on doing this until the black cross or circle at the bottom of the tube
just disappears or blurs completely.
6. Hold the tube vertically and read turbidity in NTU using the graduation on the side of
the tube. The result is the value of the line nearest the water level. (For some tubes
you may have to refer to a correspondence table).
Remarks: The readings will be significantly affected by the amount light, and the vision
of the person doing the test. Some larger particles may settle directly to the bottom,
blocking the view. Give it a good shake and take the reading.
Drinking Water Quality Testing Appendix 6 Test Procedures
A6-17
Microbiological Testing: Presence–Absence (P-A) Test Procedure This test procedure uses the Hach Pathoscreen reagents and equipment. If you buy equipment from a different company, then you will have to follow their instructions for the presence-absence test.
Hach Reagents and Equipment:
• Bottle (20 mL)
• PathoScreen Medium P/A Pillows
• Methanol or Alcohol
• Scissors
• Water Sample
Instructions:
1. Fill the sterilized bottle with 20 mL of your water sample.
2. Wipe the outside of the pillow with alcohol before opening it.
3. Use scissors to cut open one end of the pillow.
4. Add the powder to your water sample.
5. Put the cap on the bottle and shake it to mix the powder and water.
6. Put the bottle somewhere with a constant temperature (25 – 35oC) for 24 to 48 hours.
7. Check the bottle after 24 hours to see if there is a colour change. If there is no colour
change, then let the bottle sit for another 24 hours.
8. Compare the colour of the water sample with the following chart to determine the
results.
Colour Result
No colour change Negative
Changes from yellow to black Positive
Black precipitate forms Positive
Drinking Water Quality Testing Appendix 6 Test Procedures
A6-18
Microbiological Testing: Most Probable Number (MPN) Test Procedure This test procedure uses the Hach Pathoscreen reagents and equipment. If you buy equipment from a different company, then you will have to follow their instructions for the MPN test.
Hach Reagents and Equipment:
• 5 bottles (20 mL)
• 5 PathoScreen Medium P/A Pillows
• Methanol or Alcohol
• Scissors
• 5 Water Samples
Instructions:
1. Fill one of the sterilized bottles with 20 mL of your water sample.
2. Wipe the outside of the pillow with alcohol before opening it.
3. Use scissors to cut open one end of the pillow.
4. Add the powder to your water sample.
5. Put the cap on the bottle and shake it to mix the powder and water.
6. Repeat Steps 1-5 for the other four water samples.
6. Put the bottles somewhere with a constant temperature (25 – 35oC) for 24 to 48
hours.
7. Check the bottles after 24 hours to see if there is a colour change. If there is no colour
change, then let the bottle sit for another 24 hours.
8. Compare the colour of the water samples with the following table to determine the
results.
Colour Result
No colour change Negative water sample
Changes from yellow to black Positive water sample
Black precipitate forms Positive water sample
Drinking Water Quality Testing Appendix 6 Test Procedures
A6-19
9. Compare the results of the 5 water samples with the following table to determine the
overall level of contamination of the water samples.
Positive Water Samples MPN/100 mL
0 < 1.1
1 1.1
2 2.6
3 4.6
4 8.0
5 > 8.0
Drinking Water Quality Testing Appendix 6 Test Procedures
A6-20
Microbiological Testing: Membrane Filtration Test Procedure 1 This test procedure uses the Wagtech equipment. If you buy equipment from a different company, then you will have to follow their instructions for the membrane filtration test.
Drinking Water Quality Testing Appendix 6 Test Procedures
A6-21
Putting the Wagtech Equipment Together:
1. Put the filter equipment together by following the picture below.
Instructions for Sterilizing Wagtech Equipment:
The following steps should be done before taking a water sample and after filtering each sample.
1. Dry the filter cup and sample cup dry with clean tissue paper.
2. Pour 1 mL of methanol into the sample cup and swirl.
3. Put the sample cup upright and away from anything that can catch on fire.
4. Light the methanol. While the methanol is still burning turn the filter equipment into the
sample cup.
5. Wait for at least 5 minutes to ensure that the sample cup and filter equipment are
sterilized (methanol burns anaerobically and forms formaldehyde a strong bactericide).
6. Pour away any methanol that is left over in the sample cup.
Drinking Water Quality Testing Appendix 6 Test Procedures
A6-22
Instructions for Using Wagtech Equipment:
1. Use the dispenser to put a pad in a sterile Petri dish.
2. Pour about 2 mL of broth onto the pad.
3. Sterilise the forceps by holding the tips in a flame for 5 seconds. Allow the forceps to cool before handling the filter paper.
4. Using forceps, place a sterile filter paper onto the bronze support. Make sure that the grid side of the filter paper is facing up. If the filter paper tears or becomes contaminated, throw it out and use a new one.
5. Lock the filter paper in place by pushing the filter cup firmly down into position.
6. Pour your water sample into the filter cup up to the 100 mL mark.
7. Connect the hand pump to the base container and pump to suck the water sample through the filter paper.
8. When all the water has been filtered, undo the hand pump and take off the filter cup.
Drinking Water Quality Testing Appendix 6 Test Procedures
A6-23
9. Use the sterile forceps to take the filter paper off the bronze support.
10. Place the filter paper on top of the pad and broth in the Petri dish.
11. Put the lid on the Petri dish and label it with the sample number and date.
12. Put the Petri dish into the rack and repeat this process for all of your water samples. When you are finished, place the rack into the incubator. Wait between 1 to 4 hours after filtering before incubating your samples to allow the bacteria to resuscitate/recover.
Drinking Water Quality Testing Appendix 6 Test Procedures
A6-24
Test Procedure 2 This test procedure uses the Nalgene equipment. If you buy equipment from a different company, then you will have to follow their instructions for the membrane filtration test.
Nalgene Equipment:
1. Hand Pump
2. Nalgene Plastic Filter Unit
3. Sample Cup Other Equipment:
• Methanol • Lighter • Forceps • Tissue • Petri Dishes • Pad Dispenser • Pads
Instructions for Using Nalgene Equipment:
1. Use the dispenser to put a pad in a sterile Petri dish.
2. Pour about 2 mL of broth onto the pad.
3. Open the package and place the sterilized plastic filter on the table.
4. Pour your water sample into the filter cup up to the 100 mL mark.
5. Connect the hand pump to the base container and pump to suck the water sample through the filter paper.
6. When all the water has been filtered, undo the hand pump. Squeeze, twist and take off the filter cup.
7. Sterilise the forceps by holding the tips in a flame for 5 seconds. Allow the forceps to cool before handling the filter paper.
8. Use the sterile forceps to take the filter paper off the base container.
9. Place the filter paper on top of the pad and broth in the Petri dish.
10. Put the lid on the Petri dish and label it with the sample number and date.
11. Put the Petri dish into the rack and repeat this process for all of your water samples. When you are finished, place the rack into the incubator. Wait between 1 to 4 hours after filtering before incubating your samples.
Drinking Water Quality Testing Appendix 7 Example Test Report
A7-1
Example Water Quality Test Report
The report should be written by a qualified technician with input and collaboration with field workers and technicians for good interpretation of results and recommendations. The following is an example template for a report used in the context of water quality monitoring for a small project. In the example, new supplies (drilled wells, hand-dug wells) are tested every 6 months for chemical parameters and every 3 months for feacal contamination. Depending on resources, you may only want to test for chemical contaminants once or twice (depending on the result of the test!) but more frequently for fecal contramination (depending on the source type). In this example, random sampling was not necessary. In the case where a large number of systems need to be tested (such as a biosand filter project, or a large geographical area) then the sampling method chosen should be explained in the “Methodology” section of the report. See Section 3 and Appendix 5 for sampling methods.
Drinking Water Quality Testing Appendix 7 Example Test Report
A7-2
Quarterly Water Quality Testing Report for October to December 2007
January 2008
Prepared by: A. Smith, Monitoring Officer, NGO Good Water Quality for All
1. Introduction Water quality monitoring reports are produced every 3 months as part of the NGO’s monitoring and evaluation programme. This is the fourth and final report for the year 2007 covering all project areas (villages A, B, C and D) and all water supply systems (drilled wells, hand-dug wells, biosand filters).
2. Objectives Water testing is done in the context of domestic use with a particular focus on drinking water quality as one of the programme’s objective is improving drinking water supply. Water quality testing is undertaken within the NGO’s project areas: 1. To assess the quality of newly constructed water supplies and treatement systems at
commissioning 2. To monitor the quality of existing supply and treatement systems Though this report does include biosand filter water quality, it does not include analysis of the effectiveness of the biosand filters in our programmes. Refer to the report intitled “Biosand Filter Water Quality Testing Report – December 2007” which analysed the effectiveness of biosand filters programme in Village D, based on the chosen media and project context.
3. Testing Parameters For drinking water, the national standards, WHO guidelines and UNICEF recommend monitoring micorbiological quality as first priority (i.e. fecal coliforms or E.coli). 10 CFU/100 ml has been used as the acceptable limit. Other important priorities are the aesthetic quality of water (to ensure user acceptability) and contimation with chemicals of known health risk. Chemicals of concern for health in our project area include fluoride and arsenic and for aesthetic concern, iron, manganese, color, odour and taste. pH and Turbidity will also be tested in relation to the biosand filter and household chlorination. Physical and biological parameters are tested every 3 months, and chemical contamination every six months (where relevent).
4. Testing Methodology Samples are collected in the field by trained field workers (see data collection sheets in appendix) using sterilised sample bottles and placed in the fridge. All testing is started within 8 hours of sample collection by a trained technicien in a dedicated room and clean environment.
Drinking Water Quality Testing Appendix 7 Example Test Report
A7-3
Parameter Method Details
E.coli Membrane filtration with Coliscan-MF broth
See testing protocol in appendix. Duplicate samples are tested. 1 field blank per batch of 20 samples.
pH Test strips Product: EMD test strips. ref.9588-3. pH Range 5 to 10, step 0.3 to 0.5
Fluroride Visual color comparison Wagtech Color disk (Wag-WE10224) and reagent Wag-WE10322 (range 0 to 1.5 mg/l) dillutions made for concentrations beyond range using deionised water
Arsenic Wagtech Arsenator Range 2 to 100ppb Iron Test strip ITS Inc. Sensafe Iron Check (ref. 480125). Range 0 to 5
Manganese Test strip ITS Inc. Sensafe Iron Check (ref. 481020). Range 0 to 2 mg/l. Sensitivities: <0.02, 0.05, 0.1, 0.2, 0.5, 1.0, 2.0 ppm (mg/L)
5. Results Results were transcribed on data recording sheets and summarized in the following table. Information is grouped by source and village. For trend analysis purposes, the data from the past quarters have been included in the tables. All new data is marked in italic. Parameters exceeding national drinking water quality standards are in bold. SampleID Date pH Tb* F* Ar* Fe* Mn* E.coli* Obs*
Samples from Borehole (Market- BHA) Location: Village A – Depth 52m – India Mark II handpump (Date of Comissioning : 12 Jan 2007)
HDC-3 14-12-07 4.5 50 0 0 0.1 0 500 Brownish color water Samples from Biosand filter outlet (Ref:BSD1) Location: Village D - (Installation date: 10 Jan 2007)
* Tb = Turbidity (NTU), F = Fluoride (ppm), Ar = Arsenic (ppb), Mn = Manganese (ppm), E.coli = CFU/100ml, Obs = Observations made by field worker. ND = Parameter was not tested.
Drinking Water Quality Testing Appendix 7 Example Test Report
A7-4
6. Interpretation and Recommendations Summary
• The bacteriological quality of all systems tested where within acceptable range (0 to 14 CFU/100 ml) except for the hand-dug well in Village C (ref: HDC) has increased levels of fecal contamination (500 CFU/100 ml in the latest test) and recently the Market Borehole in Villlage A.
• Very high levels of fluroride (20 mg/L, 10 times the limit) where found in the first test for the newly commissioned borehole at the school in Village B.
• Arsenic was found at excessive concentration (100 ppb) in a biosand filter (BSD1) in Village D in July.
Village A The turbidity for the Market borehole (BHA) is high (should be <5 NTU). The variation in the rainy season shows possible infiltration of surface waters or insufficient development of borehole. This could lead to bacteriological contamination. Recommend more testing, checking BH apron integrity and drilling records, recommend treatment and rehabilitation if possible. The iron still seems to be a problem. Recommend continued testing, coupled with user’s survey to establish if concentrations are a deterrent (could lead to returning to less safe water sources). Suggest settling and filtration, and explanation that is not harmfull for health. Village B New borehole, these are the first tests. Fluoride is over 100x over limit. Recommend doing further fluoride tests to confirm as soon as possible. Village C The hand-dug well (ref: HDC) showed significant and increasing levels of feacal contamination (500 CFU/100ml) since the commissioning of the well (July 2007). This could be due to surface water infiltration and/or poor user hygiene. Recommend checking the well lining and sanitation practices around area. Recommend users to treat water. Village D The July testing showed 100ppb of Arsenic. Further investigations in August confirmed that the biosand filter users in the area were using borehole water in the dry season (a borehole which was contaminated with Arsenic) because the hand-dug well in the rainy season would dry up. Recommend adapting the biosand filters in the area to elimiate Arsenic or recommend using another source in the dry season. Further arsenic testing should be done to confirm arsenic contamination.
Drinking Water Quality Testing Appendix 8 Culture Media
A8-1
Culture Media for Microbiological Testing Suitable for Indicators* Photo Culture Media Type
TC TTC
E.
coli
Incubation Time and Temperature
Form / Container
Colony Counting
m-Lauryl sulphate (MLSB)
Broth
Nutri-Pad
X X ~30oC for 4 hours
then 44 ± 0.5 o
C (for FC) for 14hrs
35.0 ± 0.5°C (for TC) for 18hrs
Powder (38.1g or 500g)
Both thermotolerant and total coliforms produce yellow colonies.
m-Endo Broth
Agar
Nutri-Pad
X (X) 35.0 ± 0.5°C for 24hrs
Powder
Dehydrated pads
Total coliforms produce light to dark blue colonies. (E. coli produce dark red colonies with a green metallic sheen).
m-FC Broth
Agar
X 44.5 ± 0.5°C Powder Thermotolerant coliforms produce blue to blue-grey colonies.
Modified m-TEC Agar X 35.0 ± 0.5°C for 2hrs then 44.5 ± 0.5°C for 22-24hours
Powder E. coli produce red-magenta colonies.
m-ColiBlue24 Broth
Agar
X 35 ± 0.5°C for 22-24hrs
Liquid (2 ml ampoules, 100ml glass bottle) – refrigerated
Prepared agar plates
E. coli produce blue colonies and total coliform produce red colonies.
Coliscan MF Broth
Agar
X X ambient to 37°C (ideally 34-37°C for 18-20 hrs)
Liquid (20 ml plastic bottles) – frozen
E. coli produce purple blue or dark blue colonies.
* TC – Total Coliforms, FC – Thermotolerant Coliforms
Drinking Water Quality Testing Appendix 9 WHO Guidelines
A9-1
WHO Guidelines for Drinking Water Quality: Selected Chemicals
Chemical Guideline Value
pH No health based value is proposed
Aluminium No health based value is proposed
Ammonia No health based value is proposed
Antimony 0.02 mg/L
Arsenic 0.01 mg/L
Barium 0.7 mg/L
Boron 0.5 mg/L
Cadmium 0.003 mg/L
Calcium No health based value is proposed
Chloride No health based value is proposed
Chlorine 5 mg/L
Chromium 0.05 mg/L
Copper 2.0 mg/L
Cyanide 0.07 mg/L
Fluoride 1.5 mg/L (Recommended to have 0.5 - 1.0 mg/L for artificial fluoridation of drinking water)
Total dissolved solids (TDS) No health based value is proposed
Uranium 0.015 mg/L
Zinc No health based value is proposed
(Adapted from WHO, 2006)
Drinking Water Quality Testing Appendix 9 WHO Guidelines
A9-2
Potential Health Effects
The effect of the contaminant on human health depends largely upon the type of contaminant, its concentration, the length and frequency of exposure. The user’s age, physical health condition and immunity can also have a large influence on the resulting health effect. A list of chemical contaminants, the health impacts they pose, and potential contamination sources are provided in the following table.
Potential Health Impacts of Chemical Contamination
Chemical Potential Health Effect from
Drinking Water Source
Aluminium Little indication that orally ingested aluminium is acutely toxic. No health based guideline is proposed.
Naturally occurring; most abundant metal. Aluminium salts are widely used in water treatment as coagulants to reduce organic matter, colour, turbidity and microorganism levels.
Ammonia Ammonia in drinking water is not of immediate health relevance. No health based guideline is proposed.
Sewage, industrial processes, and agricultural activities
Antimony Itchy, rough and broken skin. Eczema and dermatitis result from long term and regular contact with antimony.
High concentrations may occur from mining operations and active volcanic areas.
Arsenic
Skin disease (melanosis and keratosis). May lead to lung, bladder, kidney, skin, liver, and prostate cancer. Also known to cause vascular diseases, neurological effects, and infant developmental defects.
Naturally occurring; also used commercially and industrially in the manufacture of transistors, lasers and semi-conductors. Some areas have relatively high concentrations of arsenic in groundwater.
Barium No evidence that barium is carcinogenic or mutagenic.
Used in a variety of industrial applications; however barium in water comes mainly from natural sources.
Boron Toxic to the male reproductive tract and may cause developmental toxicity.
Used in the manufacture of glass, soaps and detergents and as flame retardants. Found naturally in groundwater, but its presence in surface water is frequently a consequence of the discharge of treated sewage that contains detergents. Conventional water treatment does not significantly remove boron.
Cadmium High doses can cause kidney damage.
Used in the steel industry, plastics and in batteries. Released in wastewater, fertilizers and local air pollution. Contamination in drinking water may also be caused by galvanized pipes, solders and metal fittings. Food is the main source of exposure.
Calcium Essential element for human nutrition. No health based guideline is proposed.
Naturally occurring.
Drinking Water Quality Testing Appendix 9 WHO Guidelines
A9-3
Chemical Potential Health Effect from
Drinking Water Source
Chloride Several studies have suggested that the chloride may play a role in kidney function and nutrition.
Chloride in drinking water comes from natural sources, sewage, industrial effluents, and from urban runoff containing de-icing salt. Main source of human exposure is the addition of salt to food.
Chlorine
Effects are not likely to occur at levels of chlorine that are normally found in the environment. High dose of chlorine irritates the skin, the eyes, and the respiratory system.
Produced in large amounts and widely used industrially and domestically as an important disinfectant and bleach.
Chromium No significant health effects have been attributed to chromium due to lack of toxicological data.
Naturally occurring. Food appears to be the major source of uptake.
Copper
Copper is both an essential nutrient and drinking water contaminant. Can effect the gastrointestinal tract, impact may be greater on sensitive populations such as the carriers of the gene for Wilson disease and other metabolic disorders.
Used to make pipes, valves and fittings. Copper sulphate pentahydrate is sometimes added to surface water to control algae. Primary source in drinking water is the corrosion of copper plumbing. Food and water are the primary sources of copper exposure in developed countries.
Cyanide Long-term consumption effects the thyroid and the nervous system.
Can be found in some foods, particularly in some developing countries, and occasionally found in drinking water from industrial contamination.
Fluoride
Low concentrations (0.5 – 1.0 mg/L) provide protection against dental caries, especially in children. Higher levels can cause mottling of teeth and dental fluorosis. Much higher levels can result in skeletal damage.
Naturally occurring; used widely in industry; used to produce phosphate fertilizers. In most circumstances food is the main source of intake. Some areas have relatively high concentrations of fluoride in groundwater.
Iron Essential element for human nutrition. No health based guideline is proposed.
Naturally occurring; one of most abundant metals. Also found in drinking water from corrosion of steel and cast iron pipes.
Lead
Infants, children and pregnant women are most susceptible. Infants and children: Delays in physical or mental development; deficits in attention span and learning abilities. Adults: Kidney problems; high blood pressure.
Used in the production of lead-acid batteries solders and alloys. Lead in drinking water is usually from household plumbing systems that use lead in pipes, solders and fittings.
Manganese Essential element for human nutrition. Adverse effects can result from both deficiency and overexposure.
Naturally occurring; one of most abundant metals, usually found with iron. Used in manufacturing and in cleaning, bleaching and disinfection products. Food is the main source of exposure.
Mercury Causes neurological symptoms and kidney damage.
Used in the mining industry, production of chlorine, electrical appliances, and in dental amalgams. Food is the main source of exposure.
Drinking Water Quality Testing Appendix 9 WHO Guidelines
A9-4
Chemical Potential Health Effect from
Drinking Water Source
Molybdenum
Essential element for human nutrition. High doses may cause liver dysfunction and joint pain in the knees, hands and feet.
Naturally occurring; relatively rare element. Used in manufacturing of special steels, used as lubricant additives and in agriculture to prevent molybdenum deficiency of crops. May be found in high concentrations near mining sites.
Nickel
Higher chances of lung cancer, nose cancer, birth defects, allergic reactions, heart disorders.
Naturally occurring; used in the production of stainless steel and nickel alloys. Food is the main source of exposure. However, nickel in water can be significant in areas where there is heavy industrial pollution or relatively high concentrations in groundwater.
Nitrate and nitrite
Main health concern is methaemoglobinaemia, or blue baby syndrome, that occurs in infants that are usually bottle fed. Symptoms include shortness of breath and their skin turning blue due to the lack of oxygen.
Naturally occurring as part of the nitrogen cycle. Nitrate is used in fertilizers and sodium nitrite is used as a food preservative. Concentration of nitrate in groundwater and surface water is caused by agricultural runoff; leaching from septic tanks, and sewage. Nitrite is from microbial activity and may be intermittent.
Potassium
Essential element for human nutrition. No health based guideline is proposed. Increased exposure could result in health effects in people with kidney disease or who are taking medication that interferes with normal potassium functions in the body.
Naturally occurring; not commonly found in drinking water at levels that are a concern to human health. However, drinking water treated by water softeners using potassium chloride may significantly increase exposure and result in adverse health effects in susceptible individuals.
Silver No health based guideline is proposed. Only a small percentage of silver is absorbed by the body.
Naturally occurring; occasionally found in groundwater, surface water and drinking water. Silver salts are sometimes used by HWT technologies to reduce bacteria (i.e. ceramic filters).
Sodium No health based guideline is proposed.
Sodium salts (e.g. sodium chloride) are found in virtually all food and drinking water. Food is the main source of exposure. Water softeners can add significantly to the sodium content in drinking water.
Total Dissolved Solids (TDS)
Although there are no direct health concerns, very low or high concentrations may cause an objectionable taste.
TDS in drinking water comes from natural sources, sewage, urban runoff and industrial wastewater. Concentrations of TDS in water vary greatly in different geological regions.
Drinking Water Quality Testing Appendix 9 WHO Guidelines
A9-5
Chemical Potential Health Effect from
Drinking Water Source
Uranium
Little information is available on the chronic health effects of exposure to uranium in drinking water. Radiological effects are not considered in the drinking water guidelines.
Naturally occurring. Used mainly as a fuel in nuclear power stations. Contamination is caused by leaching from natural deposits, release from mining operations, emissions from the nuclear industry, combustion of coal and other fuels, and use of phosphate fertilizers that contain uranium.
Zinc Zinc is an essential trace element for human nutrition. No health based guideline is proposed.
Found in virtually all food and drinking water. Food is the main source of exposure.