Introduction to electrochemical techniques. Valentin Mir č eski Institute of Chemistry Faculty of Natural Sciences and Mathematics “Ss Cyril and Methodius” University, Skopje Republic of Macedonia. Electrochemistry: basic terms. - PowerPoint PPT Presentation
1 Introduction to electrochemical Introduction to electrochemical techniques techniques Valentin Mir č eski Institute of Chemistry Faculty of Natural Sciences and Mathematics “Ss Cyril and Methodius” University, Skopje Republic of Macedonia
Transcript
1
Introduction to electrochemical Introduction to electrochemical techniquestechniques
Valentin MirčeskiInstitute of Chemistry
Faculty of Natural Sciences and Mathematics“Ss Cyril and Methodius” University, Skopje
Republic of Macedonia
2
Electrochemistry: basic terms
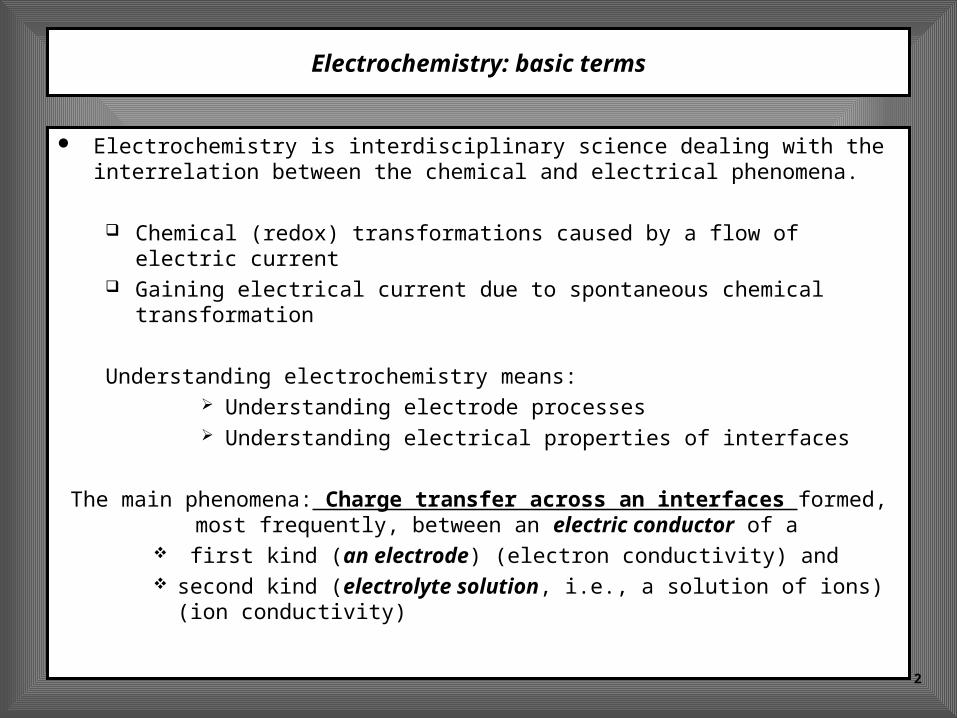
Electrochemistry is interdisciplinary science dealing with the interrelation between the chemical and electrical phenomena.
Chemical (redox) transformations caused by a flow of electric current Gaining electrical current due to spontaneous chemical
The main phenomena: Charge transfer across an interfaces formed, most frequently, between an electric conductor of a
first kind (an electrode) (electron conductivity) and second kind (electrolyte solution, i.e., a solution of ions) (ion
conductivity)
3
Electrochemical cells
Galvanic cell:Spontaneous redox (electrode)
reactions give raise to a current flow.
Electrolysis cell: non-spontaneous redox
(electrode) reactions are driven by the power of an external electric supply!
4
Electrochemical cells and electrochemical reactions
The simples electrochemical experiment involves charge transfer across at least two interfaces
Electric potential difference between the electric potential of the two electrodes
(the main driving force as a measure for the energy available to drive electric charges through the electrochemical cell)
5
Electrical potential (E (V – volt)) is a measure for the potential energy of a charge in an electric field;
The difference in the potential (potential energy) causes a charged species to move in the electric field (charge transfer)
Potential of 1 V (volt) is equivalent to the potential energy of 1J of a charged species with a charge of 1 C (coulomb)
Charge transfer in time is called electric current (I (A – ampere)
Electric potential and current
6
Electrode reactions, half reactions…
Electrode/electrolyte interface is characterized with a large potential difference , thus a strong electric filed exists at the interface! Electrode reactions Half-reactions The overall reaction Working electrode Reference electrode
R (reduced species)
O (oxidized species)
- e
Ele
ctro
de
Ele
ctro
de
O + ne- ⇄ R(electrode reaction)
electrode|solution Interface
7
The main reference electrode: Standard (normal) hydrogen electrode (SHE) (NHE)
Reference callomel electrode Hg/Hg2Cl2/KCl (saturated in water) 0.242 V vs SHE
Reference silver-silver chloride electrode Ag/AgCl/KCl (saturated in water) 0.197 V vs SHE
In the course of the electrochemical experiment the chemical composition, hence the electric potential, of the reference electrode remains constant!
Standard hydrogen electrode
Controlling the potential difference between the working and reference electrode, one controls actually the potential of the working electrode only!
8
Reduction Reduction current (“ – “)
Oxidation Oxidation current (“ + “)
Standard redox potential E, which is related to the standard Gibbs energy
Synonyms: standard electrode potential; standard reduction potential.
O + ne- = R
n – number of electronsF – Faraday constant (96 485.3 C mol-1). Thus, the physical meaning of the
Faraday constant is that one mole of a single charged species has a charge of 96 485.3 C; e.g., one mole of electrons has a charge of - 96 485.3 C.
Faraday law: A charge of 96485.3 C corresponds to the transformation of 1 mol reactant and 1 mol product in a one-electron electrohemical reaction O + e- = R
Current sign convention, standard redox potential, Faraday law
G = -nFE
9
I – E curve: polarisation curve
(working electrode) 2H+ + 2e- = H2
(reference electrode) Ag + Br- = AgBr + e-
2Br- = Br2 + 2e-
AgBr + e- = Ag + Br-
The overall current flow must be equal at both electrodes, and it is dictated by the working electrode, which has much smaller electrode surface area.
Limiting potentials dictated by electrochemical reactions of the supporting electrolyte at particular electrode.
Electrode reactions are heterogeneous in their nature.
The rate depends on the electric field, i.e., on the electrode potential.
10
Overpotential: additional energy required than thermodynamically predicted due to the slow electrode
kinetics
Hg
A large overpotential for hydrogen reduction at Hg electrode
11
Electroactive species in a supporting electrolyte
Polarization curve in the presence of traces of electroactive species (Cd2+)
12
Possible electrode reactions at different electrodes
13
Faradaic and nonfaradaic processesFaradaic and nonfaradaic processes
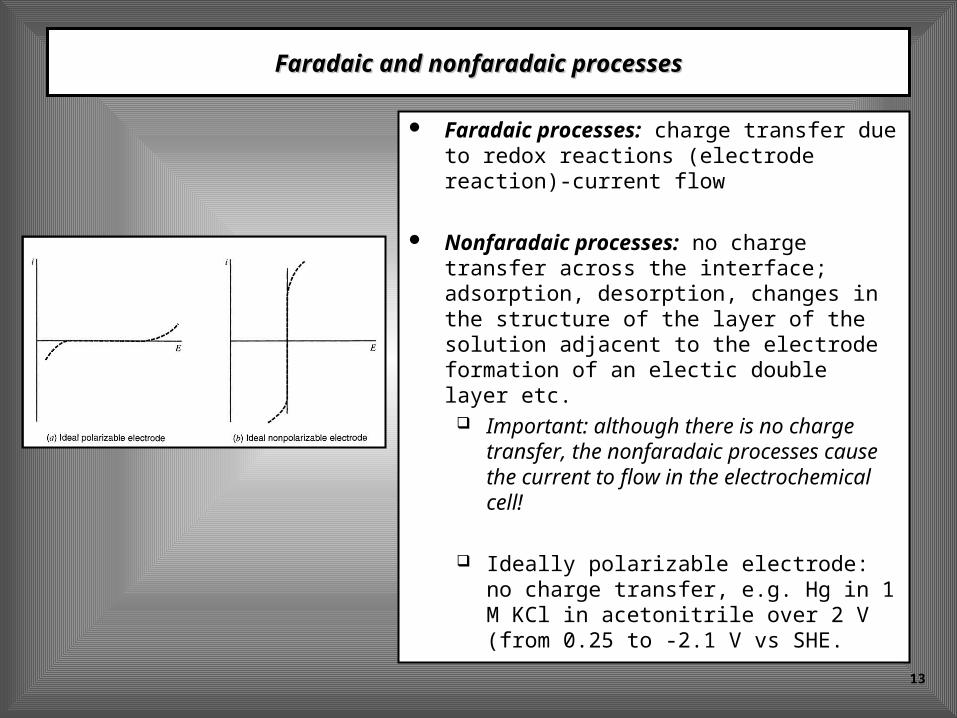
Faradaic processes: charge transfer due to redox reactions (electrode reaction)-current flow
Nonfaradaic processes: no charge transfer across the interface; adsorption, desorption, changes in the structure of the layer of the solution adjacent to the electrode formation of an electic double layer etc. Important: although there is no
charge transfer, the nonfaradaic processes cause the current to flow in the electrochemical cell!
Ideally polarizable electrode: no charge transfer, e.g. Hg in 1 M KCl in acetonitrile over 2 V (from 0.25 to -2.1 V vs SHE.
14
Electrode/electrolyte interface: an electric capacitorElectrode/electrolyte interface: an electric capacitor
15
Structure of the electrical doubly layerStructure of the electrical doubly layer
(IHP) - inner Helmholtz plane
(OHP) - Outer Helmholtz plane
16
Potential profile across the double-layerPotential profile across the double-layer
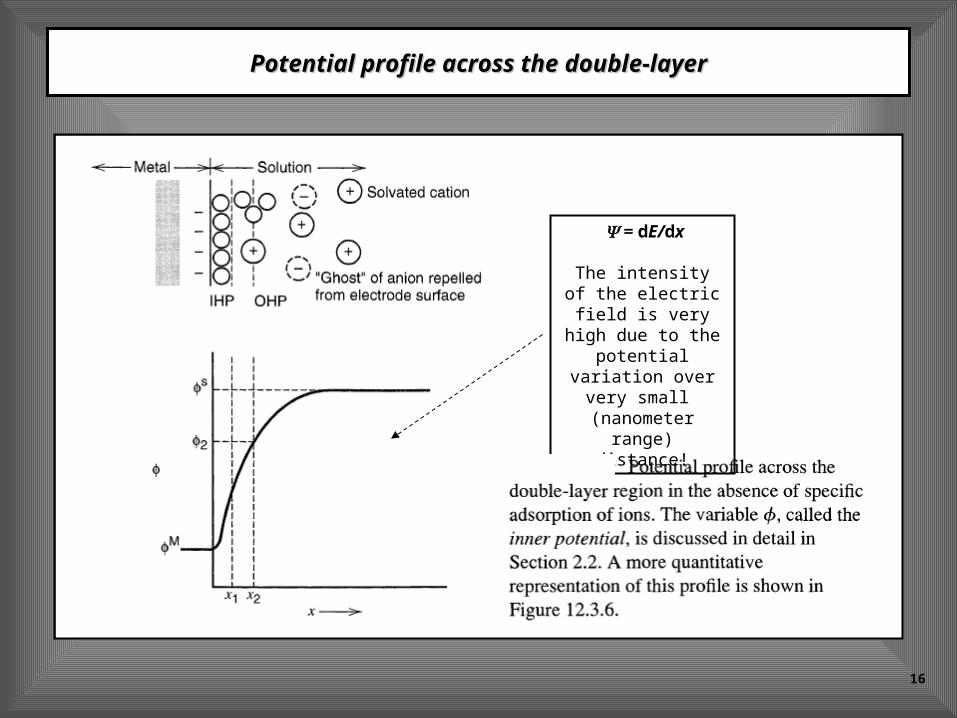
= dE/dx
The intensity of the electric field is very high due to
the potential variation over
very small (nanometer range)
distance!
17
O + ne- ⇄ R(electrode reaction)
nFA
Iv
Electric current (Electric current (II) measured at ) measured at the electrode is proportional to the the electrode is proportional to the rate (rate (vv)) of the electrode reaction!of the electrode reaction!((qq – charge, t – time, – charge, t – time, FF – Faraday constant; – Faraday constant; AA – electrode surface area; – electrode surface area; nn – number of – number of electrons, n(O) – number of moles of the electrons, n(O) – number of moles of the reactant O)reactant O)
Rate of an electrode reaction: the flux
R (reduced species)
O (oxidized species)
- e
Ele
ctro
de
Ele
ctro
de
electrode|solution Interface
AnF
I
AnFt
qv
tA
nv
nFnqt
qI
1
d
d
d
)O(d
)O(d
d Flux (the rate of the heterogeneous electrode reaction) is equal to the amount of reacted material per unit of time per unit of electrode surface area (mol s
-1 cm-2). This chemical rate is equal to the ratio of the electric current, number of exchanged electrons in a unit reaction and electrode surface area.
Electrode reaction controlled by the mass transportElectrode reaction controlled by the mass transport
0x
0x'0
[R]
[O]ln
nF
RTEE
If the mass transfer is the slowest step of the electrode reaction, then the electrode reaction is termed as being “electrochemically reversible”. At each potential difference (E) of the interface, the electrode reaction is in redox equilibrium, which is described by the Nernst equation:
The Nernst eq. reveals that variation of the potential difference at the interface (E) causes variation of the equilibrium concentrations of the redox species ([O] and [R]). In other words, it shifts the position of the redox equilibrium, which is manifested as a flow of electric current in the system.
R
O
Ele
ctro
de
Ele
ctro
de
electrolyte electrolyte solutionsolution
E = E = elecc.elecc. – – sol. sol. (Potential difference (E) across the interface
is externally controlled by controlling the inner potential () of the electrode. In simple words, one controls the activity, i.e., concentration of electrons participating in the electrode reaction, thus affecting both the position of the redox equilibrium O/R and the kinetics of the redox transformation. Note, frequently, the potential difference E is designated simply as electrode potential with a symbol E)
O + ne ⇄ R(electrode reaction)
20
Semi-empirical treatment of a voltammetric experiment when the diffusion layer has a constant thickness: a steady-state
mass transfer
0)d
d( x
RR x
cDv
)0(*
xcc
Dv RRR
)0(*
xcc
DnFA
I RRR
0)d
d( x
R
x
cv
.)(*R concbulkc
)0( xcR
x
Rc
ele
ctr
od
e
R
RRRR
Dmxccm
nFA
I));0(( *
O
OOOO
Dmxccm
nFA
I));0(( *
)0( xcmnFA
IOO
*RR
l cmnFA
I
In this experiment, the flux at the electrode (i.e., the rate of the electrode reaction, thus the current), depends on the diffusion rate only (i.e., depends on the mass transfer only). According to the First Fick law, the rate of diffusion depends on the diffusion coefficient (D) and the concentration gradient (dc/dx); (D – diffusion coefficient (it is the rate constant of the diffusion (cm 2 s-1)). In addition, it is assumed that the diffusion layer has a constant thickness . The flux of R species must be equal, but opposite in sign, with the flux of O species. R diffuses toward the electrode, while O, formed by oxidation of R, diffuses away from the electrode (in the opposite direction)
0.)(*O concbulkc
R = O + ne-
The maximal flux of R will be if cR(x = 0) = 0. Thus, the corresponding current is termed limiting current, Il
21
R
lR nFAm
Ic *
R
lR nFAm
IIxc
)0(
II
I
nF
RT
m
m
nF
RTEE
xc
xc
nF
RTEE
lO
R
lnln
)0(
)0(ln
0
R
O0
O
R
l
m
m
nF
RTEE
II
ln
2/
2/1
II
I
nF
RTEE
l ln2/1
E / V
I / A
E1/2
Il (limiting current)
Typical I-E curve (voltammogram) for an electriochemical experiment
with a constant thickness of the diffusion layer (steady state
voltammetry)
22
Kinetics of a simple homogeneous chemical reaction
A ⇄ Bkf
kb
Aff ck
Bbb ck
BbAfnet ckck
][
][
A
BK
k
k
b
f Symbols and abbreviations
ff – forward – forwardbb – backward – backwardnetnet – overall reaction – overall reactionKK – equilibrium constant – equilibrium constant[X] - equilibrium concentration [X] - equilibrium concentration of a species Xof a species X
The rate of a common chemical reaction depends on the concentrations of participants, and (through the rate constant) on the temperature and activation energy.
23
R ⇄ O + ne-kf
kb
nFA
Ick a
Rff nFA
Ick c
Obb
nFA
Ickck ObRfbfnet
][ ObRfca ckcknFAIII
)](exp[ '00 EERT
nFkk f )]()1(exp[ '00 EE
RT
nFkkb
)()1()(0'0'0
),0(),0(EE
RT
nF
O
EERT
nF
R etcetcFAkI
c – cathodic (reductive)a – anodic (oxidative) – electron transfer coefficient (dimensionless number between 0 and 1; most frequently the value is 0.5)k (cm s-1)- standard rate constant (rate constant when the electrode potential is equal to the standard potential of the redox couple, E’)
Butler-Volmer equation
Electrode kineticsElectrode kinetics
Rate constants depend on the potential! The unique feature of electrochemical rate constants. Thus, the rate of the electrode reaction can be controlled by the potential!
24
Limiting current
limiting current
Dependence of the current on the electrode potential
R
O (at the electrode surface)
v = I/nFA
Ele
ctr
od
eE
lectr
od
e O (in the
solution)
diffusion
Although the rate of the electrode reaction could be very fast due to the large overpotential, the overall rate will by limited by the supply of the electrode surface with the electroactive material by the mass transport, i.e. diffusion!
The current increases exponentially with the potential as predicted by the dependence of the rate constants on the potential!
25
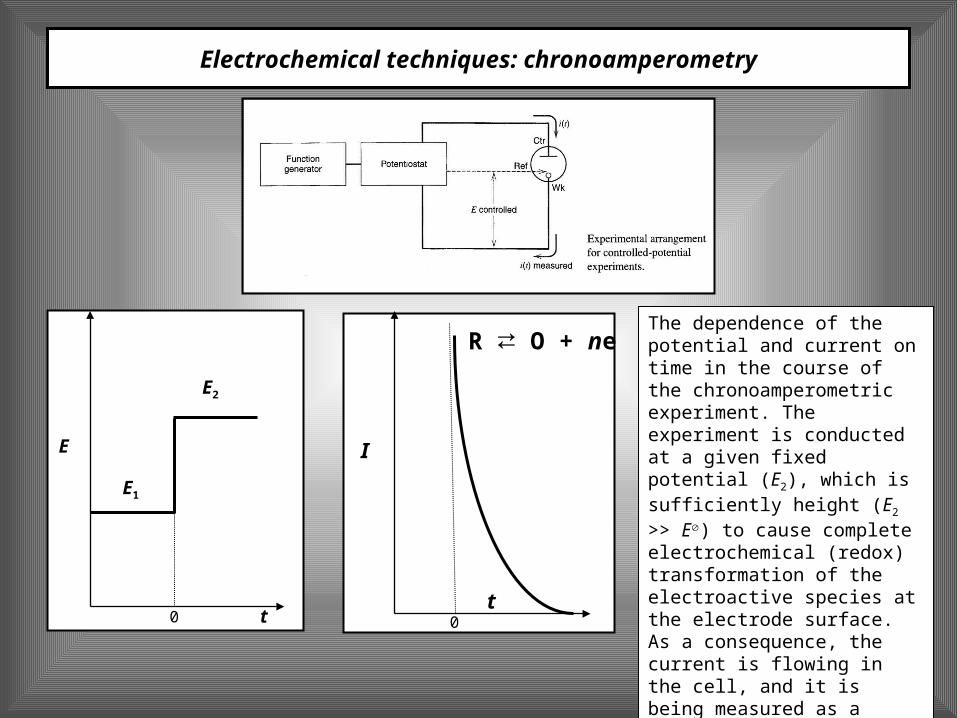
Electrochemical techniques: chronoamperometry
The dependence of the potential and current on time in the course of the chronoamperometric experiment. The experiment is conducted at a given fixed potential (E2), which is sufficiently height (E2 >> E) to cause complete electrochemical (redox) transformation of the electroactive species at the electrode surface. As a consequence, the current is flowing in the cell, and it is being measured as a function of time.
t
E
E2
E1
0t
I
0
R O + ⇄ ne
26
Description of the mathematical model referring to a simple chronoamperometric experiment - Cottrell equation
)()()(
),0()(
0),0(
),(lim
),(),(
*
0
*
2
2
equationCottrellt
DnFActItI
x
tcD
nFA
tI
tc
ctxc
x
txcD
t
txc
RRd
x
RR
R
RRx
RR
R
R O + ⇄ ne
x
c R /
c*R
1
0,2
t = 0
t = 0,001 s
t = 0,01 s
t = 0,1 s
t = 1 s
Concentration profiles. Variation of the concentration of electroactive species with the distance x measured from the electrode surface at different times of the chronoamperometric experiment. As shown above, the thickness of the diffusion layer increases with time.
Cottrell experiment: Chronoamperometric experiment in a homogenous solution containing only R species, at a potential E >> E , thus enabling complete transformation of all R species at the electrode surface. Mass transfer is occurring only by diffusion without any specific adsorption phenomena on the electrode surface.
27
Chronoamperometry with a double potential step
tI
0
For mechanistic purposes, i.e. to reveal the mechanism of the electrode reaction, the chronoamperometric experiment can be conducted with a double potential step, as shown in the figure below. At the potential E2, the initially present R species undergo electrochemical oxidation at the electrode surface to produce species O, resulting in the first branch of the current, presented in the right plot (i.e.. chronoamperogram). In the second potential step, the potential is changed to a value E3, at which the reduction of previously formed species O is taking place, producing the second branch of the chronoamperogram presented on the right panel.
t
E
E2
0
E3E1
28
Chronocoulometry
Chronocoulometry is equivalent method to chronoamperometry, the difference being in measuring the charge consumed in the course of the electrode reaction instead of the current. We recall, the definition of the current
Hence, the charge is simply calculated as an integral of the current-time function, i.e.
In the course of the experiment, contrary to the chronoamerometry, the response of the crhronocoulometry increases with time, as the amount of the material transformed at the electrode increases with time. By integration of the current, the noise effect is usually smoothed out and it is not so significant as in chronoametrometry. The contribution of the double layer as well as from electrode reaction of immobilized species can be easily separated from the contribution of diffusing species. Thus, chronocoulometry is especially valuable for studying surface processes, thus it is of particular importance in studying conducting polymers.
t
ttIq0
d)(
t
qI
d
d
29
For a Cottrell experiment described on page 27, the chronocoulometric response is defined as:
The charge consumed during the experiment of species that diffuses toward the electrode is proportional to the square-root of time and the plot vs. t1/2 is linear with a slop from which some of the constants of the equation above can be obtained, given the knowledge of others.
2/1
2/12/12
ctnFAD
Q
The eq. above shows that at t = 0, the charge is 0. However, in a real experiment the line Q vs t1/2 does not cross through the origin, as shown in the plot. This is due to the charge consumed by the double layer formation and by electrode transformation of species immobilized on the electrode surface. Thus the total charge can be separated in three terms:
The first term is due to electrode reaction controlled by the diffusion of the species, homogeneously distributed in the solution, the second term Qdl is due to formation of the double layer and the third is due to electrode transformation of adsorbed species.