52
/faculteit technologie management Introduction to FACETS: A Many-Facet Rasch Model Computer Program Antal Haans
| Date post: | 26-Aug-2018 |
| Category: |
Documents |
| Upload: | truongkhue |
| View: | 214 times |
| Download: | 0 times |

/faculteit technologie management
Introduction to FACETS:A Many-Facet Rasch Model
Computer Program
Antal Haans

/faculteit technologie management
Outline
• Principles of the Rasch Model• Many-Facet Rasch Model• Facets Software• Several Examples• The Importance of Connectivity• Incomplete Data

/faculteit technologie management
The Principles of the Rasch Model
• Consider a typical mathematics exam with ten increasingly difficult items j, each scored as correct or incorrect
items
i = 4
i = ...
i = 3
i = 2
i = 1
j = ...j = 4j = 3j = 2j = 1persons

/faculteit technologie management
The Principles of the Rasch Model
• For each cell a probability of success can be calculated
• P(success) = function of person ability and item difficulty: F(�i, �j)
items
.......79i = 4
....71i = ...
.......69.79.85i = 3
.51.61.71.81.91i = 2
.65.79.81.85.99i = 1
j = ...j = 4j = 3j = 2j = 1persons
/faculteit technologie management
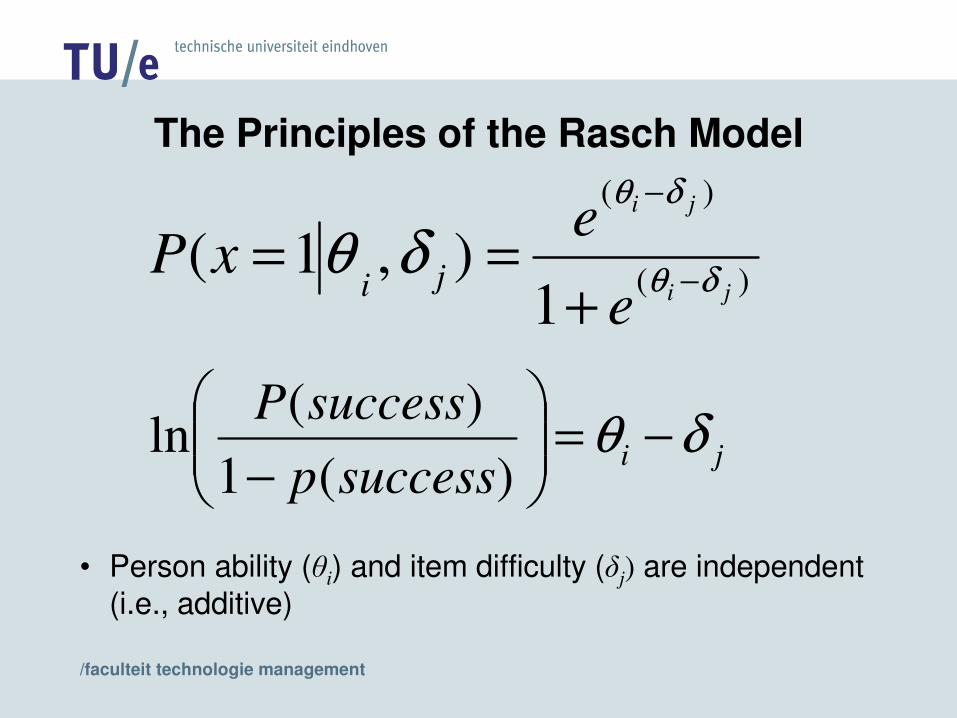
The Principles of the Rasch Model
• Person ability (�i) and item difficulty (�j) are independent (i.e., additive)
)(
)(
1),1(
ji
ji
e
exP ji δθ
δθ
δθ −
−
+==
jisuccesspsuccessP δθ −=��
�
����
�
− )(1)(
ln

/faculteit technologie management
The Principles of the Rasch Model
• Each datum can be expressed in terms of a combination of person ability and item difficulty
items
....�4 - �1i = 4
..�5 - �1i = ...
....�3 – �3�3 – �2�3 - �1i = 3
�2 – �5�2 – �4�2 – �3�2 – �2�2 - �1i = 2
�1 – �5�1 – �4�1 – �3�1 – �2�1 – �1i = 1
j = ...j = 4j = 3j = 2j = 1persons

/faculteit technologie management
The Principles of the Rasch Model
• item difficulty (�j) and person ability (�i) have the same units: Logits or log odds units
• If the data fit the Rasch model, we have:– A one-dimensional interval scale of
the latent trait– Invariance between item difficulty
and person ability
� �1 1–
� �5 1– � �4 1–
� �1 2–
� �2 1–
� �2 4– � �1 5–
� �1 3– � �3 1–
� �2 3– � �3 3–
� �1 4– � �5 1– � �1 3–
� �2 2–
�1
�2
�3
�4
�5 �1
�2
�3
�4
�5
/faculteit technologie management
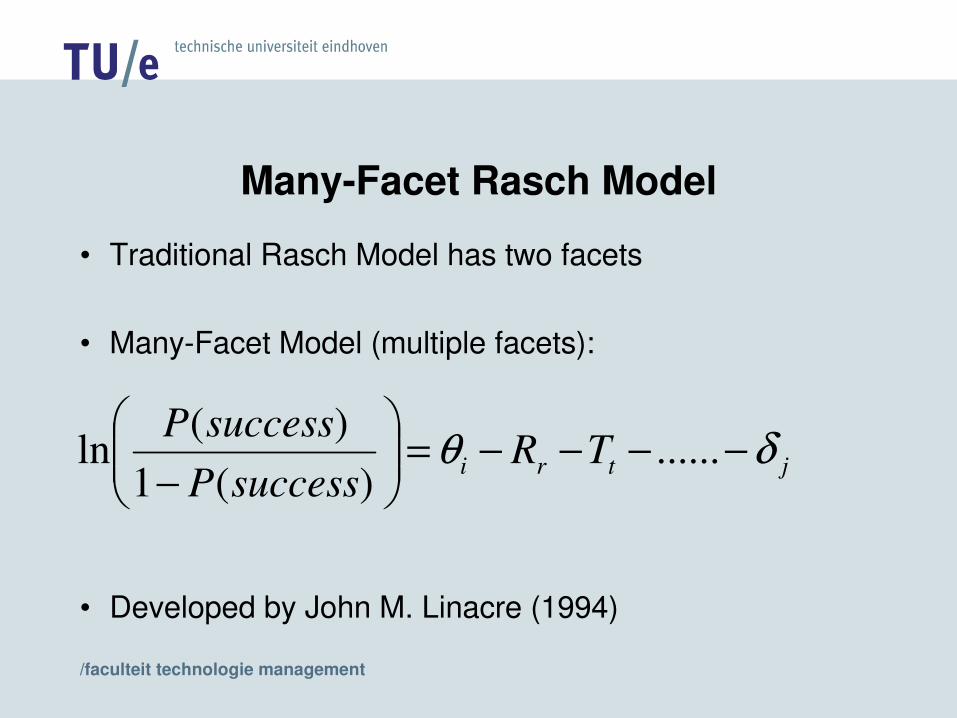
Many-Facet Rasch Model
• Traditional Rasch Model has two facets
• Many-Facet Model (multiple facets):
• Developed by John M. Linacre (1994)
jtri TRsuccessP
successP δθ −−−−=���
����
�
−......
)(1)(
ln

/faculteit technologie management
FACETS: Some Figures
• Facets can handle up to:– 1.000.000 persons– 255 facets– 90% missing data
• Number of people currently using FACETS:– 400 single user licenses– 22 site licenses (4 in Europe; 1 in the Netherlands)
• Developed by John M. Linacre

/faculteit technologie management
FACETS: Different Types of Data
• Ordinal data– Dichotomous items– Multiple choice items
• Andrich's rating scale (Djk = �j + �k)• partial credit model (Djk = �j + �jk)
– Paired comparisons
• Continuous data – Counts, time, distance, etc.

/faculteit technologie management
EXAMPLES

/faculteit technologie management
Ex.1: 2-Facets with Dichotomous Data
• Field sobriety "Walk-the-Line" test on 15 suspects
• Seven items "yes/no" format– more or less than 9 steps– used arms for balance– too much swaying– failed to turn on one foot– did not walk a straight line– did not walk heal-to-toe– fell over during instructions

/faculteit technologie management
Data:
1,1-7,1,1,1,1,0,1,0 ; Row contains for person 1, the responses to items 1 to 7: yes, yes, yes, yes, no, yes, no
2,1-7,0,1,0,0,0,0,0 ; Row contains for person 2, the responses to items 1 to 7: no, yes, no, no, no, no, no
...15,1-7,1,1,1,1,0,0,0
descriptors data
Ex.1: 2-Facets with Dichotomous Data

/faculteit technologie management
Ex.1: 2-Facets with Dichotomous Data
• Model:
• The probability that a certain person i scores a "yes" on a certain behavior j (e.g., fail to walk heal-to-toe) is governed by:• the person's drunkenness (�i) MINUS• the easiness of performing a behavior (�j)
)(
)(
1),1(
ji
ji
e
exP ji δθ
δθ
δθ −
−
+==

/faculteit technologie management
Ex.1: 2-Facets with Dichotomous Data
title=Example 1: 2-facet (traditional) Rash model......
facets=2 ; There are two facets (persons and items)
noncenter=1 ; Mean of facet 2 estimates are anchored at zero
positive=1 ; Facet 1 is positive (i.e., + �i - �j)
model=?,?,D ; Model with two facets (?s) and dichotomous data (D) model statement should match dataset!

/faculteit technologie management
Ex.1: 2-Facets with Dichotomous Data
Labels =
1,suspects ; Facet 1 is called suspects (should match dataset!)1=Julia C ; Element 1 in facet 1 is Julia C... 15=William D ; Element 15 in facet 1 is William D* ; End element list with * !
2,items ; Facet 2 is called items1=Took less or more than nine steps ; Label for item 1...7=Fell over during officer's instructions ;Label for item 2*

/faculteit technologie management
Ex.1: 2-Facets with Dichotomous Data
Data =
1,1-7,1,1,1,1,0,1,02,1-7,0,1,0,0,0,0,03,1-7,1,1,1,0,0,0,04,1-7,1,0,0,0,0,0,0.........14,1-7,1,1,1,1,1,0,015,1-7,1,1,1,1,0,0,0� ; ����End control file with a !
/faculteit technologie management
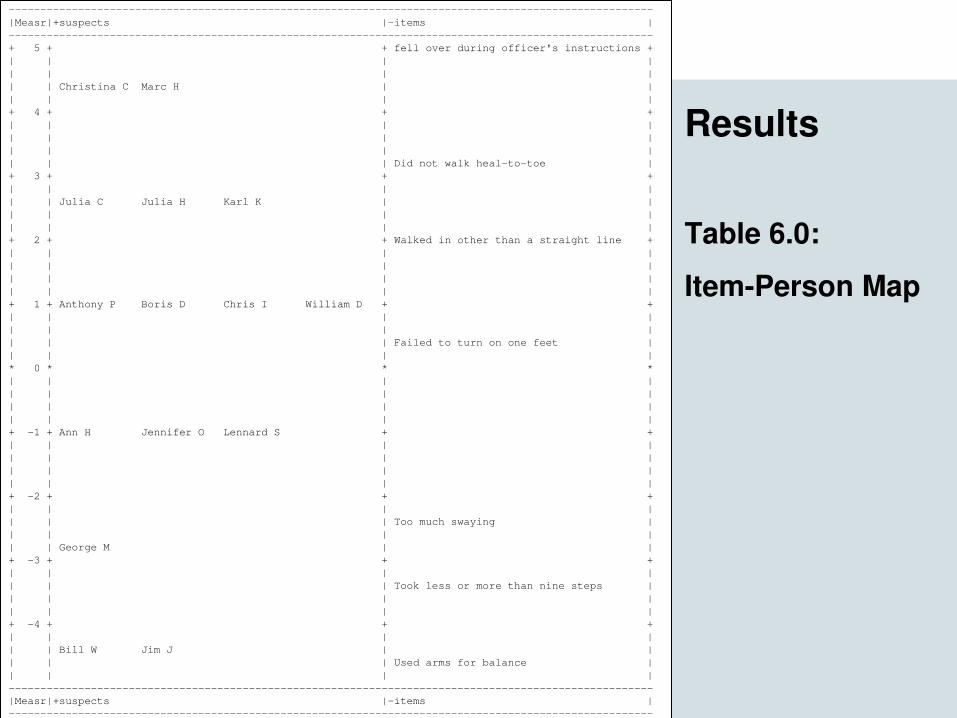
------------------------------------------------------------------------------------------------------|Measr|+suspects |-items |------------------------------------------------------------------------------------------------------+ 5 + + fell over during officer's instructions +| | | || | | || | Christina C Marc H | || | | |+ 4 + + +| | | || | | || | | || | | Did not walk heal-to-toe |+ 3 + + +| | | || | Julia C Julia H Karl K | || | | || | | |+ 2 + + Walked in other than a straight line +| | | || | | || | | || | | |+ 1 + Anthony P Boris D Chris I William D + +| | | || | | || | | Failed to turn on one feet || | | |* 0 * * *| | | || | | || | | || | | |+ -1 + Ann H Jennifer O Lennard S + +| | | || | | || | | || | | |+ -2 + + +| | | || | | Too much swaying || | | || | George M | |+ -3 + + +| | | || | | Took less or more than nine steps || | | || | | |+ -4 + + +| | | || | Bill W Jim J | || | | Used arms for balance || | | |------------------------------------------------------------------------------------------------------|Measr|+suspects |-items |------------------------------------------------------------------------------------------------------
Results
Table 6.0:
Item-Person Map

/faculteit technologie management
-------------------------------------------------------------------------------------------------| Obsvd Obsvd Obsvd Fair-M| Model | Infit Outfit |Estim.| || Score Count Average Avrage|Measure S.E. | MnSq ZStd MnSq ZStd|Discrm| Nu suspects |-------------------------------------------------------------------------------------------------| 6 7 .9 .99| 4.32 1.40 | .36 -.9 .14 4.9| 1.69 | 5 Christina C || 6 7 .9 .99| 4.32 1.40 | 1.99 1.2 .74 5.0| .13 | 12 Marc H || 5 7 .7 .93| 2.59 1.26 | 1.36 .7 .55 2.0| .76 | 1 Julia C || 5 7 .7 .93| 2.59 1.26 | 2.16 1.6 1.69 2.2| -.45 | 9 Karl K || 5 7 .7 .93| 2.59 1.26 | .42 -.9 .19 1.9| 1.67 | 14 Julia H || 4 7 .6 .72| .97 1.32 | .36 -.9 .15 .5| 1.56 | 8 Chris I || 4 7 .6 .72| .97 1.32 | .36 -.9 .15 .5| 1.56 | 10 Boris D || 4 7 .6 .72| .97 1.32 | 1.68 1.0 .68 .8| .61 | 11 Anthony P || 4 7 .6 .72| .97 1.32 | .36 -.9 .15 .5| 1.56 | 15 William D || 3 7 .4 .29| -.91 1.44 | .19 -.9 .10 .5| 1.50 | 3 Jennifer O || 3 7 .4 .29| -.91 1.44 | .19 -.9 .10 .5| 1.50 | 7 Ann H || 3 7 .4 .29| -.91 1.44 | .19 -.9 .10 .5| 1.50 | 13 Lennard S || 2 7 .3 .06| -2.72 1.26 | 2.47 1.9 3.49 2.6|-1.33 | 6 George M || 1 7 .1 .01| -4.33 1.33 | .47 -.9 .18 5.4| 1.77 | 2 Jim J || 1 7 .1 .01| -4.33 1.33 | 1.53 .9 .58 5.5| .40 | 4 Bill W |-------------------------------------------------------------------------------------------------| 3.7 7.0 .5 .57| .41 1.34 | .94 -.1 .60 2.3| | Mean (Count: 15) || 1.5 .0 .2 .36| 2.66 .07 | .80 1.1 .87 1.9| | S.D. (Populn) || 1.6 .0 .2 .37| 2.75 .07 | .83 1.1 .91 2.0| | S.D. (Sample) |-------------------------------------------------------------------------------------------------Model, Populn: RMSE 1.34 Adj (True) S.D. 2.29 Separation 1.71 Reliability .75Model, Sample: RMSE 1.34 Adj (True) S.D. 2.40 Separation 1.79 Reliability .76Model, Fixed (all same) chi-square: 59.4 d.f.: 14 significance (probability): .00Model, Random (normal) chi-square: 17.3 d.f.: 13 significance (probability): .19-------------------------------------------------------------------------------------------------
Table 7.1.1: Person Estimates and Fit Statistics

/faculteit technologie management
---------------------------------------------------------------------------------------------------------------------|Obsvd Obsvd Obsvd Fair-M| Model | Infit Outfit |Estim.| ||Score Count Average Avrage|Measure S.E. | MnSq ZStd MnSq ZStd|Discrm| N items |---------------------------------------------------------------------------------------------------------------------| 1 15 .1 .01| 4.98 1.15 | .76 -.1 .19 3.4| 1.24 | 7 fell over during officer's instructions || 3 15 .2 .06| 3.19 .83 | 1.12 .3 .54 1.3| .99 | 6 Did not walk heal-to-toe || 5 15 .3 .17| 1.97 .75 | .81 -.4 .48 .5| 1.30 | 5 Walked in other than a straight line || 8 15 .5 .51| .35 .75 | 1.50 1.2 2.36 1.2| .17 | 4 Failed to turn on one feet || 12 15 .8 .94| -2.39 .97 | .29 -1.4 .12 .5| 1.51 | 3 Too much swaying || 13 15 .9 .98| -3.42 1.06 | 1.18 .4 .35 1.5| .99 | 1 Took less or more than nine steps || 14 15 .9 .99| -4.69 1.22 | .79 -.1 .16 3.1| 1.26 | 2 Used arms for balance |---------------------------------------------------------------------------------------------------------------------| 8.0 15.0 .5 .52| .00 .96 | .92 .0 .60 1.7| | Mean (Count: 7) || 4.8 .0 .3 .42| 3.35 .18 | .36 .8 .74 1.1| | S.D. (Populn) || 5.2 .0 .3 .45| 3.62 .19 | .39 .8 .79 1.2| | S.D. (Sample) |---------------------------------------------------------------------------------------------------------------------Model, Populn: RMSE .98 Adj (True) S.D. 3.20 Separation 3.28 Reliability .92Model, Sample: RMSE .98 Adj (True) S.D. 3.48 Separation 3.57 Reliability .93Model, Fixed (all same) chi-square: 70.5 d.f.: 6 significance (probability): .00Model, Random (normal) chi-square: 5.9 d.f.: 5 significance (probability): .32---------------------------------------------------------------------------------------------------------------------
Table 7.2.1: Item Estimates and Fit Statistics

/faculteit technologie management
------------------------------------------------------------------------------------------|Cat Step Exp. Resd StRes| Nu suspects N items |------------------------------------------------------------------------------------------| 1 1 .0 1.0 4 | 6 George M 4 Failed to turn on one feet || 0 0 .9 -.9 -3 | 9 Karl K 4 Failed to turn on one feet |------------------------------------------------------------------------------------------|Cat Step Exp. Resd StRes| Nu suspects N items |------------------------------------------------------------------------------------------
Table 4.1: Unexpected responses

/faculteit technologie management
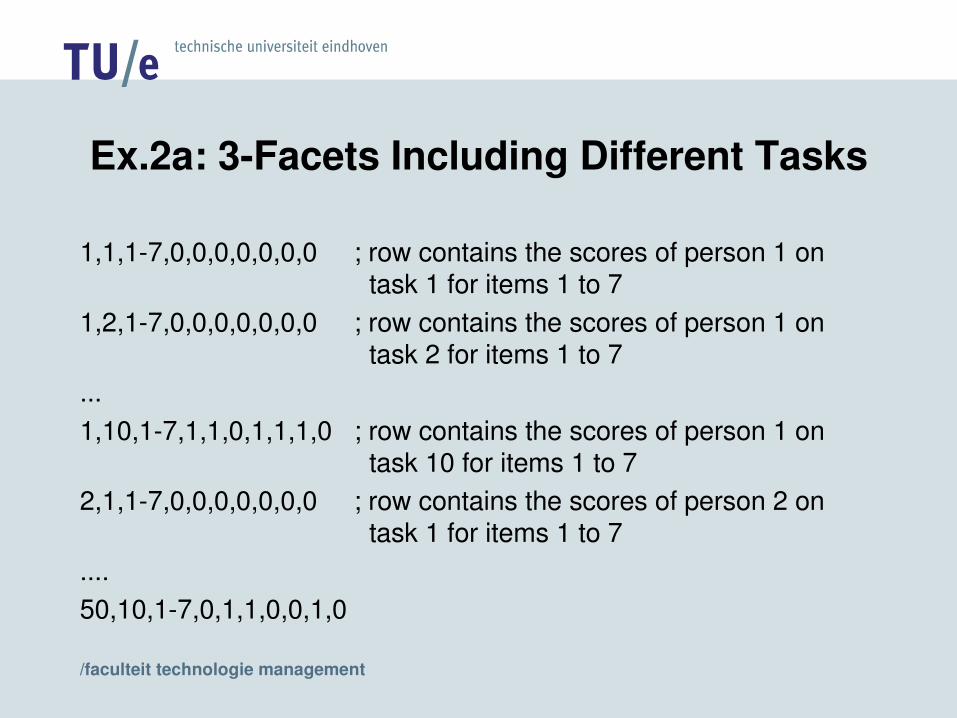
Ex.2a: 3-Facets Including Different Tasks
• How sensitive is the "Walk-the-Line" test?
• Each participants performs 10 different tasks– drinking 1 beer– drinking 2 beers– ...– drinking 10 beers
• Each participant "walks the line" after each task
/faculteit technologie management
Ex.2a: 3-Facets Including Different Tasks
1,1,1-7,0,0,0,0,0,0,0 ; row contains the scores of person 1 on task 1 for items 1 to 7
1,2,1-7,0,0,0,0,0,0,0 ; row contains the scores of person 1 on task 2 for items 1 to 7
...1,10,1-7,1,1,0,1,1,1,0 ; row contains the scores of person 1 on
task 10 for items 1 to 72,1,1-7,0,0,0,0,0,0,0 ; row contains the scores of person 2 on
task 1 for items 1 to 7....50,10,1-7,0,1,1,0,0,1,0

/faculteit technologie management
Ex.2a: 3-Facets Including Different Tasks
• Model:
• The probability that a certain person i scores a "yes" on a certain behavior j (e.g., fail to walk heal-to-toe) after a certain amount t of beer is governed by:
• the person's sensitivity to alcohol (�i) PLUS
• the amount of alcohol intake in the task (Tt) MINUS• the easiness of the behavior (�j)
)(
)(
1),,1(
jti
jti
T
T
jti e
eTxP δθ
δθ
δθ −+
−+
+==

/faculteit technologie management
Ex.2a: 3-Facets Including Different Tasks
title=Example 2a: 3-facet model - 10 tasks...
facets=3 ; This time three facets
noncenter=1 ; Means of facets 2 and 3 are at zero
positive=1,2 ; Facet 1 and 2 are positive (i.e., + �i + Tt - �j)
models=?,?,?,D ;three facets (?s) to be estimated

/faculteit technologie management
Ex.2a: 3-Facets Including Different Tasks
Labels =
1,persons1-50= ; no labels, just 50 participants*
2,tasks ; Facet 2 contains the tasks1=1 consumption2=2 consumptions...10=10 consumptions*

/faculteit technologie management
Ex.2a: 3-Facets Including Different Tasks
3,items ;Facet 3 now contains the items1=Took less or more than nine steps...7=fell over during officer's instructions*
Data=
1,1,1-7,0,0,0,0,0,0,01,2,1-7,0,0,0,0,0,0,0...50,10,1-7,0,1,1,0,0,1,0�

/faculteit technologie management
----------------------------------------------------------------------------------------------|Measr|+persons |+tasks |-items |----------------------------------------------------------------------------------------------| | | | fell over during officer's instructions || | | | || | | | |+ 2 + + + +| | | | || | | | || | | 10 consumptions | Did not walk heal-to-toe || | | | Walked in other than a straight line |+ 1 + + 9 consumptions + +| | | 8 consumptions | || | *** | | || | * | | || | *** | | |* 0 * * * 7 consumptions * *| | **** | 6 consumptions | || | * | 5 consumptions | Failed to turn on one feet || | **** | | || | * | | |+ -1 + + + Too much swaying +| | ****** | 4 consumptions | || | * | | || | *** | 3 consumptions | Used arms for balance || | | | |+ -2 + **** + + Took less or more than nine steps +| | ******* | | || | ** | | || | | | || | ** | | |+ -3 + ** + + +| | * | | || | | | || | | | || | | | |+ -4 + * + + +| | | | || | | | || | ** | | || | | | |+ -5 + + + +| | | | || | * | | || | | | || | | | |+ -6 + + 1 consumption 2 consumptions + +----------------------------------------------------------------------------------------------|Measr| * = 1 |+tasks |-items |----------------------------------------------------------------------------------------------
Results
Table 6.0:
Facet Map

/faculteit technologie management
-------------------------------------------------------------------------------------------------| Obsvd Obsvd Obsvd Fair-M| Model | Infit Outfit |Estim.| || Score Count Average Avrage|Measure S.E. | MnSq ZStd MnSq ZStd|Discrm| Nu tasks |-------------------------------------------------------------------------------------------------| 171 350 .5 .46| 1.39 .14 | .91 -1.3 1.02 .1| 1.09 | 10 10 consumptions || 156 350 .4 .39| 1.08 .14 | 1.01 .1 .89 -.4| 1.01 | 9 9 consumptions || 146 350 .4 .34| .88 .14 | 1.06 .9 1.33 1.3| .88 | 8 8 consumptions || 107 350 .3 .18| .06 .15 | .88 -1.6 .62 -1.1| 1.19 | 7 7 consumptions || 94 350 .3 .14| -.23 .15 | 1.03 .3 1.38 .9| .94 | 6 6 consumptions || 84 350 .2 .12| -.47 .16 | .99 .0 1.44 .9| .97 | 5 5 consumptions || 60 350 .2 .07| -1.10 .17 | 1.04 .4 .75 -.2| .97 | 4 4 consumptions || 44 350 .1 .04| -1.61 .19 | .99 .0 .99 .2| 1.01 | 3 3 consumptions || 0 350 .0 .00|( -7.17 1.82)|Minimum | | 1 1 consumption || 0 350 .0 .00|( -7.17 1.82)|Minimum | | 2 2 consumptions |-------------------------------------------------------------------------------------------------| 86.2 350.0 .2 .17| -1.43 .49 | .99 -.1 1.05 .2| | Mean (Count: 10) || 57.8 .0 .2 .16| 3.00 .67 | .06 .8 .29 .8| | S.D. (Populn) || 61.0 .0 .2 .17| 3.16 .70 | .06 .9 .31 .8| | S.D. (Sample) |-------------------------------------------------------------------------------------------------With extremes, Model, Populn: RMSE .83 Adj (True) S.D. 2.89 Separation 3.49 Reliability .92With extremes, Model, Sample: RMSE .83 Adj (True) S.D. 3.06 Separation 3.70 Reliability .93Without extremes, Model, Populn: RMSE .16 Adj (True) S.D. .99 Separation 6.32 Reliability .98Without extremes, Model, Sample: RMSE .16 Adj (True) S.D. 1.06 Separation 6.76 Reliability .98With extremes, Model, Fixed (all same) chi-square: 341.4 d.f.: 9 significance (probability):.00With extremes, Model, Random (normal) chi-square: 7.6 d.f.: 8 significance (probability): .48-------------------------------------------------------------------------------------------------
Table 7.2.1: Task Estimates and Fit Statistics

/faculteit technologie management
Ex.2b: 3-Facets Including Different Raters
• Audio-visual recordings of 10 job interviews
• 3 Judges rate each person's communicational skill by means of 5 items on a 5 point scale (ranging from 0 = weak to 4 = strong)
• 5 items:– general appearance– non-verbal skills– verbal skill– Pronunciation– confidence

/faculteit technologie management
Ex.2b: 3-Facets Including Different Raters
Data set
1,1,1-5,4,3,4,4,41,2,1-5,4,4,4,0,01,3,1-5,3,4,3,4,42,1,1-5,3,3,3,3,0......10,3,1-5,3,3,0,0,0

/faculteit technologie management
Ex.2b: 3-Facets Including Different Raters
• Model:
• The probability that a certain person i receives a certain score k (e.g., 4) on a certain item j (e.g., nonverbal skills) by a certain rater r is governed by:
• the person's communication skill (�i) MINUS• the harshness of the rater (Rr) MINUS• the difficulty of receiving a k on item j (Djk)
)(
)(
1),,1(
kjri
kjri
DR
DR
kjri e
eDRxP −−
−−
+== θ
θ
θ

/faculteit technologie management
Ex.2b: 3-Facets Including Different Raters
• We will be using Andrich's rating scale to model the step difficulties:
– A mean item difficulty (�j) is estimated for each item– All item share the same step difficulties (�k)
• So that: Djk = �j + �k
/faculteit technologie management
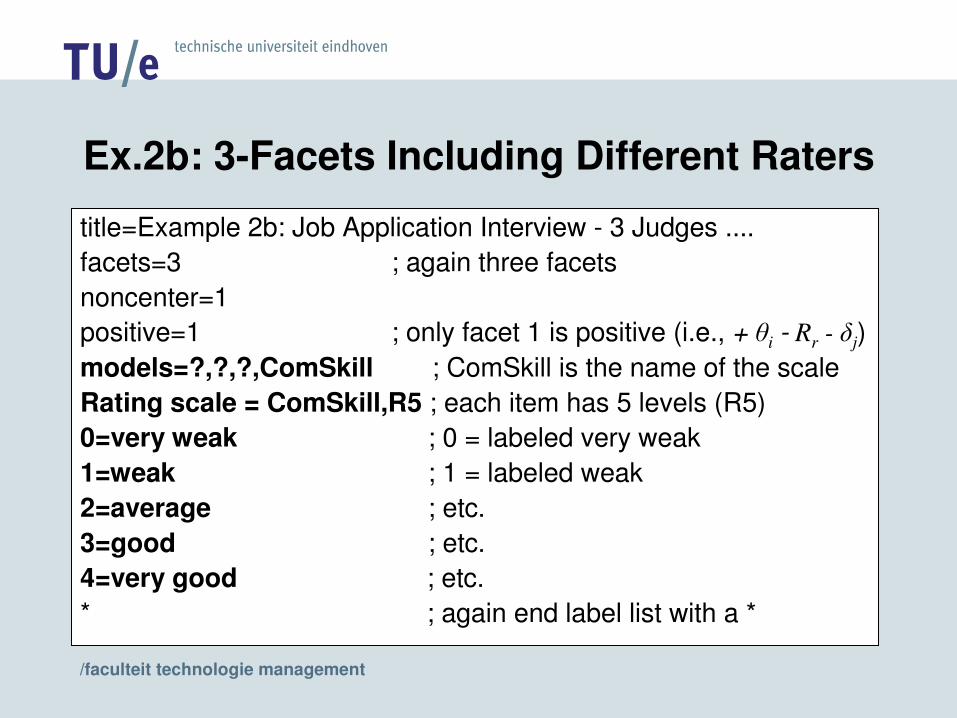
Ex.2b: 3-Facets Including Different Raters
title=Example 2b: Job Application Interview - 3 Judges ....facets=3 ; again three facetsnoncenter=1positive=1 ; only facet 1 is positive (i.e., + �i - Rr - �j)models=?,?,?,ComSkill ; ComSkill is the name of the scaleRating scale = ComSkill,R5 ; each item has 5 levels (R5)0=very weak ; 0 = labeled very weak1=weak ; 1 = labeled weak2=average ; etc.3=good ; etc.4=very good ; etc.* ; again end label list with a *

/faculteit technologie management
Ex.2b: 3-Facets Including Different Raters
Labels =1,persons1=Peter...*2,Rater1=JudgeA...*3,Items1=general appearance...*

/faculteit technologie management
-------------------------------------------------------|Measr|+persons |-Rater |-Items |COMSK|-------------------------------------------------------| | | | | || | Christina | | | || | | | | || | | | | || | | | | || | | | | |+ 2 + + + + +| | | | | || | | | | || | | | | || | | | | || | | | | || | | | | || | | | | --- || | | | | || | Peter | | | |+ 1 + + + + +| | | | | || | Marcel | | confidence | || | | | | || | | | | || | | | Pronunciation | || | Jennifer | JudgeB | | 3 || | | | | || | | | | || | | JudgeC | verbal skill | |* 0 * George * * * --- *| | | | | || | Julia | | | 2 || | | | | || | | | | --- || | William | JudgeA | | || | | | non-verbal skills | || | Bill | | | 1 || | | | general appearance | || | | | | |+ -1 + Ann + + + +| | Jim | | | --- || | | | | |-------------------------------------------------------|Measr|+persons |-Rater |-Items |COMSK|-------------------------------------------------------
Results
Table 6.0:
Facet Map

/faculteit technologie management
------------------------------------------------------------------------------------------------|Obsvd Obsvd Obsvd Fair-M| Model | Infit Outfit |Estim.| ||Score Count Average Avrage|Measure S.E. | MnSq ZStd MnSq ZStd|Discrm| N Items |------------------------------------------------------------------------------------------------| 39 30 1.3 1.09| .80 .19 | 1.19 .6 .77 -.2| 1.01 | 5 confidence || 47 30 1.6 1.64| .53 .18 | .90 -.2 .68 -.6| 1.29 | 4 Pronunciation || 62 30 2.1 2.55| .07 .17 | .89 -.3 1.03 .1| .54 | 3 verbal skill || 83 30 2.8 3.23| -.57 .18 | .68 -1.1 .71 -.7| 1.02 | 2 non-verbal skills || 90 30 3.0 3.37| -.82 .19 | .80 -.6 1.40 1.0| 1.04 | 1 general appearance |------------------------------------------------------------------------------------------------| 64.2 30.0 2.1 2.37| .00 .18 | .89 -.3 .92 -.1| | Mean (Count: 5) || 19.8 .0 .7 .89| .62 .01 | .17 .6 .27 .7| | S.D. (Populn) || 22.1 .0 .7 .99| .69 .01 | .19 .7 .30 .7| | S.D. (Sample) |------------------------------------------------------------------------------------------------Model, Populn: RMSE .18 Adj (True) S.D. .59 Separation 3.24 Reliability .91Model, Sample: RMSE .18 Adj (True) S.D. .67 Separation 3.65 Reliability .93Model, Fixed (all same) chi-square: 54.6 d.f.: 4 significance (probability): .00Model, Random (normal) chi-square: 3.7 d.f.: 3 significance (probability): .29------------------------------------------------------------------------------------------------
Table 7.3.1: Item Estimates and Fit Statistics
Mean item difficulty �j

/faculteit technologie management
--------------------------------------------------------------------------| DATA | QUALITY CONTROL | STEP | EXPECTATION || Category Counts Cum.| Avge Exp. OUTFIT|CALIBRATIONS | Measure at || Score Used % % | Meas Meas MnSq |Measure S.E.|Category -0.5 |--------------------------------------------------------------------------| 0 47 31% 31%| -1.14 -1.04 .6 | |( -1.44) || 1 11 7% 39%| -.50 -.61 1.1 | .62 .25| -.70 -1.08|| 2 5 3% 42%| .05 -.15 .4 | .40 .25| -.21 -.45| | 3 48 32% 74%| .73 .43 1.1 | -2.14 .25| .43 .05|| 4 39 26% 100%| 1.15 1.46 1.2 | 1.11 .24|( 2.23) 1.29| ------------------------------------------------------------(Mean)--------
Table 8.1: Item step statistics
step difficulties �k

/faculteit technologie management
Ex.2b: 3-Facets Including Different Raters
• IMPORTANT:
• There is formally no difference between a facet containing persons, items, tasks or raters
• Getting a high score on an easy task is similar to receiving a high score from a lenient judge
/faculteit technologie management
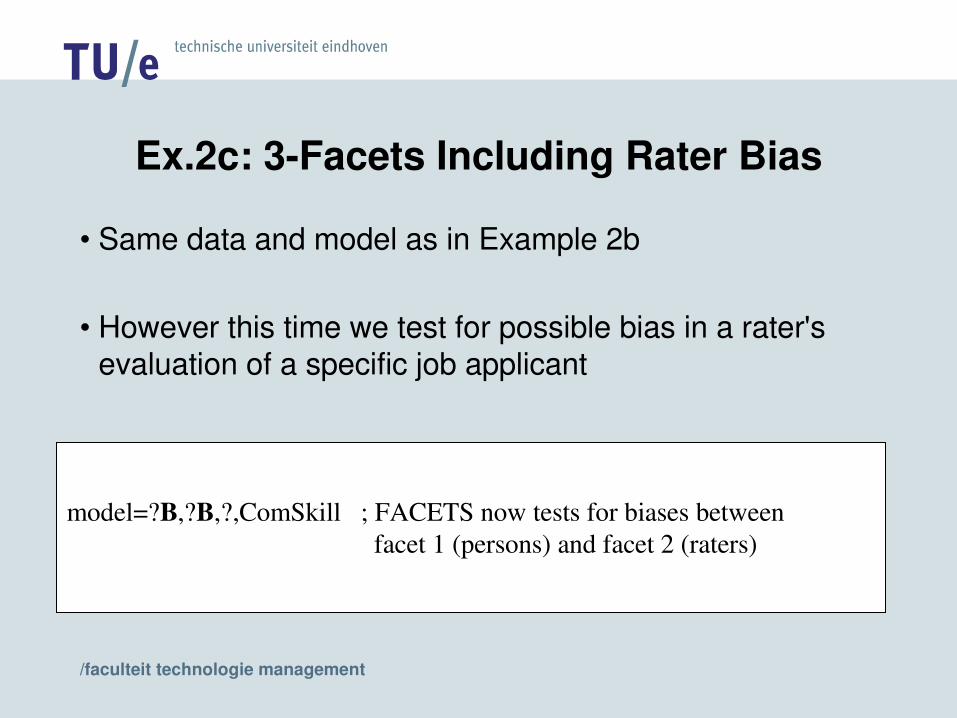
Ex.2c: 3-Facets Including Rater Bias
• Same data and model as in Example 2b
• However this time we test for possible bias in a rater's evaluation of a specific job applicant
model=?B,?B,?,ComSkill ; FACETS now tests for biases between facet 1 (persons) and facet 2 (raters)
/faculteit technologie management
Ex.2c: 3-Facets Including Rater Bias
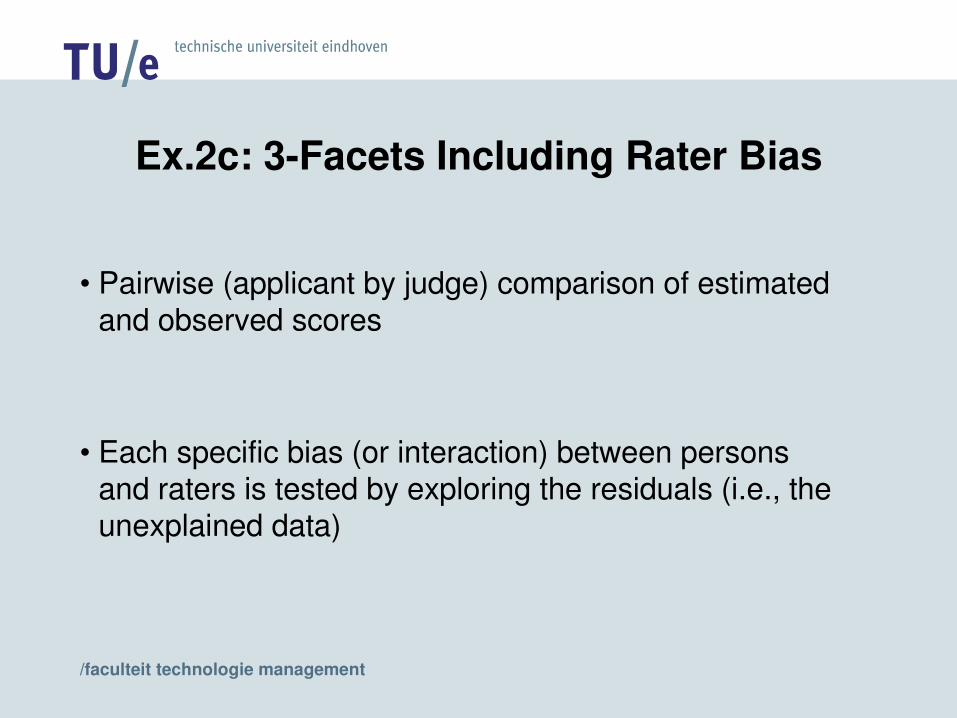
• Pairwise (applicant by judge) comparison of estimated and observed scores
• Each specific bias (or interaction) between persons and raters is tested by exploring the residuals (i.e., the unexplained data)
/faculteit technologie management
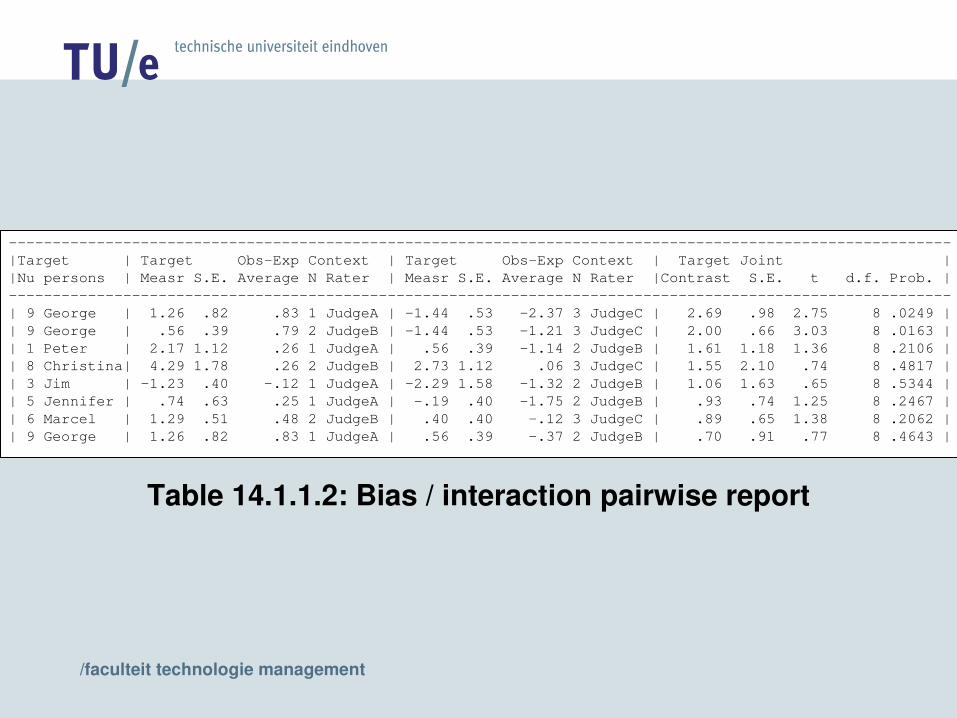
-----------------------------------------------------------------------------------------------------------|Target | Target Obs-Exp Context | Target Obs-Exp Context | Target Joint ||Nu persons | Measr S.E. Average N Rater | Measr S.E. Average N Rater |Contrast S.E. t d.f. Prob. |-----------------------------------------------------------------------------------------------------------| 9 George | 1.26 .82 .83 1 JudgeA | -1.44 .53 -2.37 3 JudgeC | 2.69 .98 2.75 8 .0249 || 9 George | .56 .39 .79 2 JudgeB | -1.44 .53 -1.21 3 JudgeC | 2.00 .66 3.03 8 .0163 || 1 Peter | 2.17 1.12 .26 1 JudgeA | .56 .39 -1.14 2 JudgeB | 1.61 1.18 1.36 8 .2106 || 8 Christina| 4.29 1.78 .26 2 JudgeB | 2.73 1.12 .06 3 JudgeC | 1.55 2.10 .74 8 .4817 || 3 Jim | -1.23 .40 -.12 1 JudgeA | -2.29 1.58 -1.32 2 JudgeB | 1.06 1.63 .65 8 .5344 || 5 Jennifer | .74 .63 .25 1 JudgeA | -.19 .40 -1.75 2 JudgeB | .93 .74 1.25 8 .2467 || 6 Marcel | 1.29 .51 .48 2 JudgeB | .40 .40 -.12 3 JudgeC | .89 .65 1.38 8 .2062 || 9 George | 1.26 .82 .83 1 JudgeA | .56 .39 -.37 2 JudgeB | .70 .91 .77 8 .4643 |
Table 14.1.1.2: Bias / interaction pairwise report
/faculteit technologie management
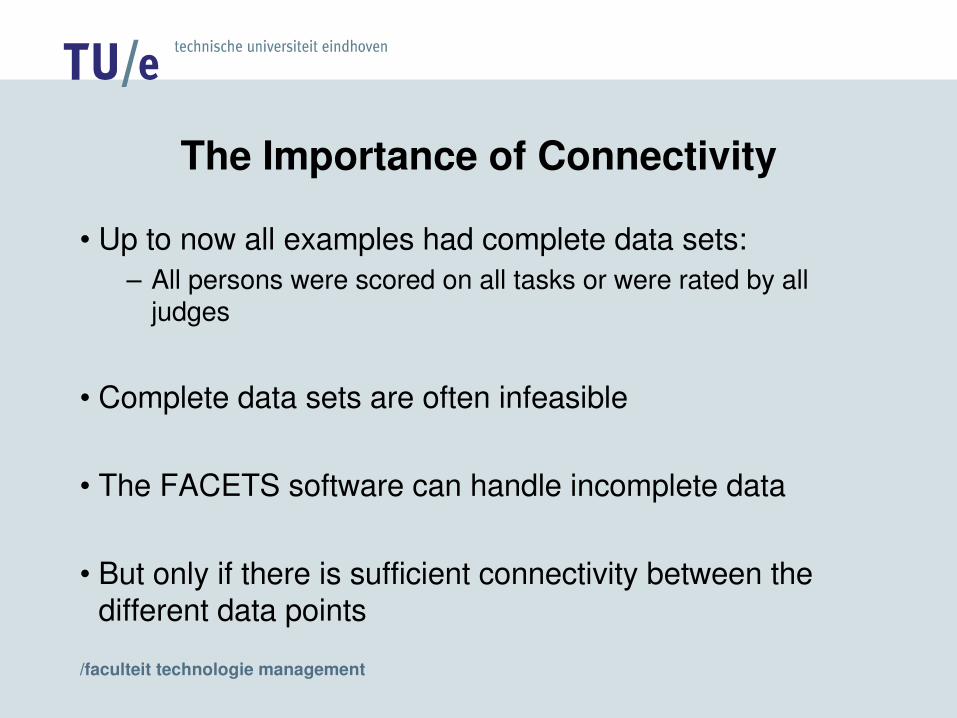
The Importance of Connectivity
• Up to now all examples had complete data sets:– All persons were scored on all tasks or were rated by all
judges
• Complete data sets are often infeasible
• The FACETS software can handle incomplete data
• But only if there is sufficient connectivity between the different data points
/faculteit technologie management
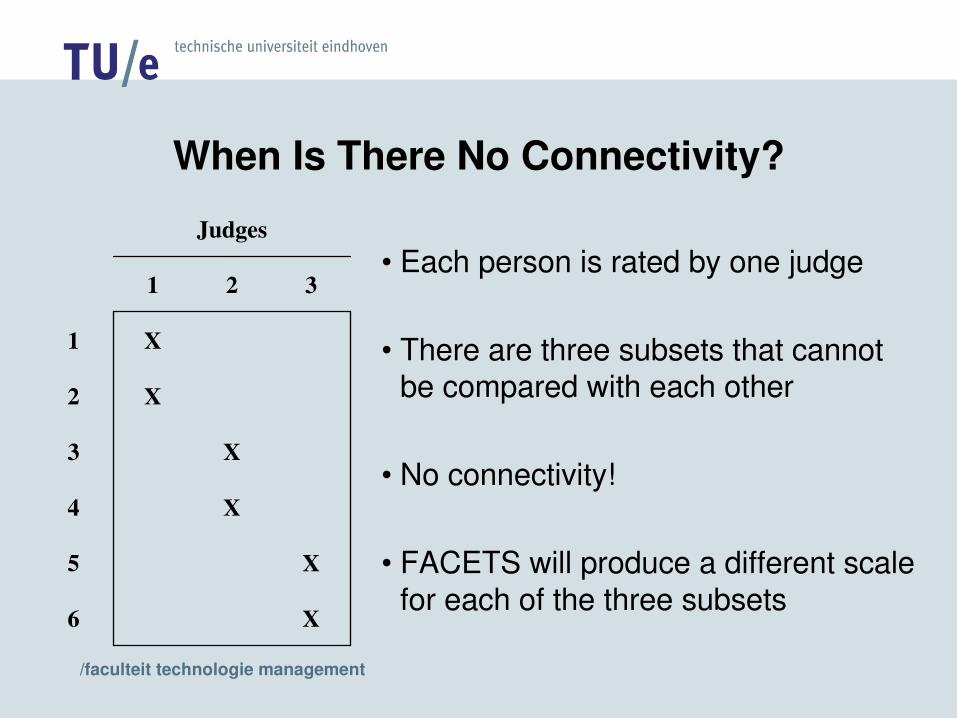
When Is There No Connectivity?
• Each person is rated by one judge
• There are three subsets that cannot be compared with each other
• No connectivity!
• FACETS will produce a different scale for each of the three subsets
X6
X5
X4
X3
X2
X1
321
Judges

/faculteit technologie management
Two Examples of Connectivity
XX6X6
XX5X5
XX4XX4
XX3XX3
XX2XX2
XX1XX1
321321
JudgesJudges
rotated judgment plan

/faculteit technologie management
Ex.3: Incomplete Data
• As in experiment 2b and 2c: Audio-visual recordings of 10 persons' job interviews
• Each person is rated by two judges according to a rotated judgment plan
• On communicational skills by means of 5 items on a 5 point scale

/faculteit technologie management
Ex.3: Incomplete Data
Data
1,1,1-5,4,3,4,4,41,2,1-5,4,4,4,0,02,2,1-5,3,3,1,0,02,3,1-5,3,3,4,0,03,1,1-5,3,3,0,0,03,3,1-5,3,3,0,0,0...

/faculteit technologie management
-------------------------------------------------------------------------------------------|Obsvd Obsvd Obsvd Fair-M| Model | Infit Outfit |Estim.| ||Score Count Average Avrage|Measure S.E. | MnSq ZStd MnSq ZStd|Discrm| Nu persons |-------------------------------------------------------------------------------------------| 39 10 3.9 3.94| 3.98 1.07 | 1.11 .4 1.24 .5| .89 | 8 Christina || 31 10 3.1 3.34| .95 .36 | 1.30 .7 1.10 .3| 1.05 | 1 Peter || 30 10 3.0 3.10| .56 .34 | 1.35 .7 1.31 .6| .17 | 6 Marcel || 22 10 2.2 2.99| .43 .28 | .91 .0 .71 -.4| .79 | 5 Jennifer || 17 10 1.7 2.49| .03 .29 | .56 -.9 .40 -1.0| 1.37 | 2 Julia || 20 10 2.0 1.67| -.38 .29 | 1.67 1.4 1.48 .8| .33 | 9 George || 16 10 1.6 1.29| -.57 .30 | .35 -1.9 .63 -.2| .71 | 4 William || 13 10 1.3 .81| -.84 .31 | .72 -.4 .45 -.3| 1.47 | 7 Bill || 12 10 1.2 .52| -1.08 .31 | .76 -.3 .51 -.3| 1.52 | 3 Jim || 8 10 .8 .30| -1.39 .36 | .72 -.2 .41 -.1| 1.13 | 10 Ann |-------------------------------------------------------------------------------------------| 20.8 10.0 2.1 2.05| .17 .39 | .94 -.1 .82 .0| | Mean (Count: 10)|| 9.3 .0 .9 1.23| 1.46 .23 | .39 .9 .39 .6| | S.D. (Populn) || 9.8 .0 1.0 1.29| 1.54 .24 | .41 1.0 .41 .6| | S.D. (Sample) |-------------------------------------------------------------------------------------------Model, Populn: RMSE .45 Adj (True) S.D. 1.38 Separation 3.06 Reliability .90Model, Sample: RMSE .45 Adj (True) S.D. 1.47 Separation 3.25 Reliability .91Model, Fixed (all same) chi-square: 61.6 d.f.: 9 significance (probability): .00Model, Random (normal) chi-square: 6.9 d.f.: 8 significance (probability): .55-------------------------------------------------------------------------------------------
Table 7.1.1: Person Estimates and Fit Statistics

/faculteit technologie management
ReferencesRasch Model and Estimation- Bond, T. G., & Fox, C. M. (2001). Applying the Rasch model: Fundamental measurement
in the human sciences. Mahwah, NJ: Lawrence Erlbaum.- Embretson, S. E., & Reise, S. P. (2000). Item response theory for psychologists. Mahwah,
NJ: Lawrence Erlbaum.Many-Facet Rasch Model and Estimation- Linacre, J. M. (1994). Many-facet Rasch measurement (2nd Ed.). Chicago: MESA. - Linacre, J. M. (1999). Understanding Rasch measurement: Estimation methods for Rasch
measures. Journal of Outcome Measurement, 3, 382-405.- Linacre, J. M. (2002). Construction of measures from many-facet data. Journal of Applied
Measurement, 3, 486-512.Incomplete Data, Judgment Plans and the Chi-Square Statistics- Schumacker, R. E., & Lunz, M. E. (1997). Interpreting the chi-square statistics reported in
the many-faceted model. Journal of Outcome Measurement, 1, 239-257.- Schumacker, R. E. (1999). Many-facet Rasch analysis with crossed, nested, and mixed
designs. Journal of Outcome Measurement, 3, 323-338.


