8
Introduction to Gas Phase FTIR Spectroscopy

Introduction to Gas Phase FTIR Spectroscopy

22
FTIR stands for Fourier transform infrared, the preferred method of infrared spectroscopy. In infrared (IR) spectroscopy, radiation in the IR region of the electromagnetic spectrum is passed through a gas sample. Some of the infrared radiation is absorbed by the sample and some of it is passed through (transmitted). The resulting spectrum represents the molecular absorption and transmission response, creating a molecular fingerprint of the sample. Like a fingerprint no two unique molecular structures produce the same infrared spectrum. This makes infrared spectroscopy useful for several types of analysis.
Wavelength
Source
Sample
Ene
rgy
Wavelength
Detector
So, what information can FTIR spectroscopy provide?• It can identify trace contaminants in high-purity gas
samples
• It can determine up to 30 components in gases from combustion processes, such as diesel engine emissions or continuous emissions monitoring (CEM) applications
• It can quantify gas samples over large concentration spans, from parts per billion up to 99.99%
• It can monitor gas samples continuously, providing Concentration versus Time trend charts
• It cannot detect diatomic or noble gases such as O2, N2, H2, He, or Ar, which do not have absorbance bands in the infrared region of the spectrum.
This booklet is an introduction to the principles behind FTIR gas spectroscopy and will address basic FTIR theory, how it works, and the practical aspects that must be considered for FTIR analysis of gases. We hope that this information gives you a good understanding of the importance and usefulness of this powerful technique.
Introduction to FTIR spectroscopy
The SpectrometerConceptual diagram of the beam path through a transmission sample
2
3
Why infrared spectroscopy?Infrared spectroscopy has been a workhorse technique for materials analysis in the laboratory for over seventy years. An infrared spectrum represents a fingerprint of a sample with absorption peaks that correspond to the frequencies of vibrations between the bonds of the atoms making up the material. As each chemical compound is comprised of a unique combination of atoms, no two compounds produce the exact same infrared spectrum. Therefore, infrared spectroscopy can result in a positive identification (qualitative analysis) of a material’s unique composition. In addition, the size of the peaks in the infrared spectrum is a direct indication of the amount of material present. With modern software algorithms, infrared spectroscopy is an excellent tool for quantitative analysis.
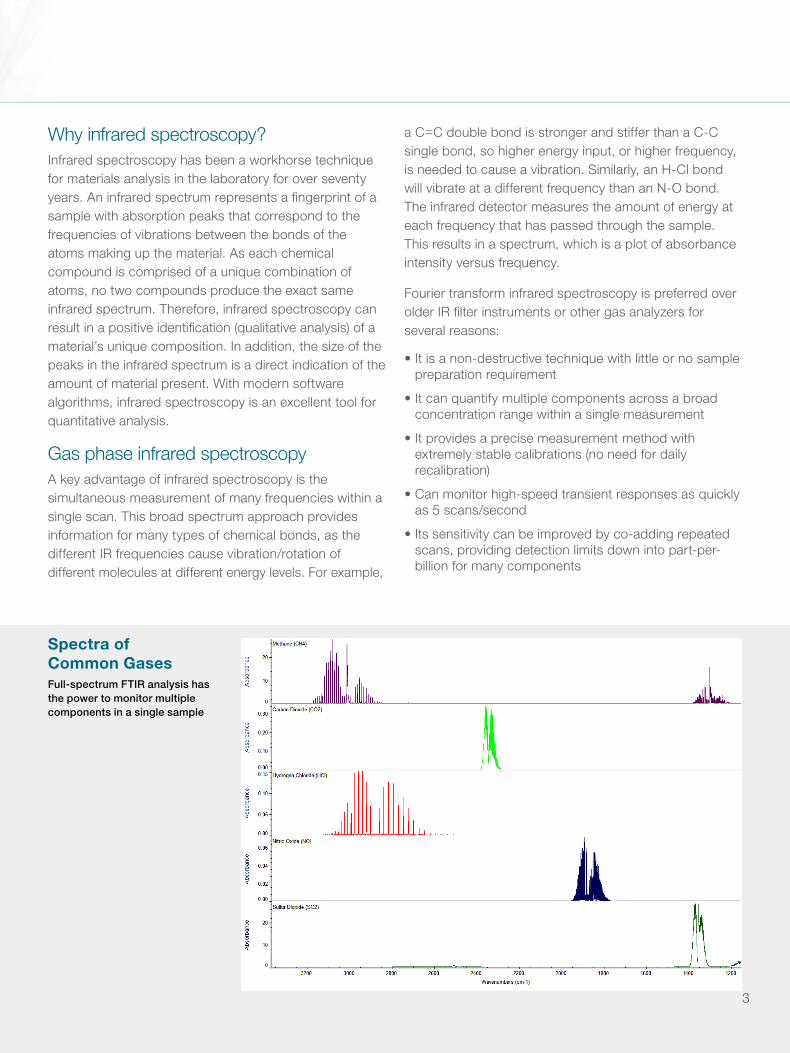
Gas phase infrared spectroscopyA key advantage of infrared spectroscopy is the simultaneous measurement of many frequencies within a single scan. This broad spectrum approach provides information for many types of chemical bonds, as the different IR frequencies cause vibration/rotation of different molecules at different energy levels. For example,
a C=C double bond is stronger and stiffer than a C-C single bond, so higher energy input, or higher frequency, is needed to cause a vibration. Similarly, an H-Cl bond will vibrate at a different frequency than an N-O bond. The infrared detector measures the amount of energy at each frequency that has passed through the sample. This results in a spectrum, which is a plot of absorbance intensity versus frequency.
Fourier transform infrared spectroscopy is preferred over older IR filter instruments or other gas analyzers for several reasons:
• It is a non-destructive technique with little or no sample preparation requirement
• It can quantify multiple components across a broad concentration range within a single measurement
• It provides a precise measurement method with extremely stable calibrations (no need for daily recalibration)
• Can monitor high-speed transient responses as quickly as 5 scans/second
• Its sensitivity can be improved by co-adding repeated scans, providing detection limits down into part-per-billion for many components
FTIR spectroscopy for gas analysis
Spectra of Common GasesFull-spectrum FTIR analysis has the power to monitor multiple components in a single sample
4
A key advantage of FTIR spectroscopy is the measurement of all spectral frequencies simultaneously. Older IR technology used dispersion gratings, which scan through the spectrum one frequency at a time. An FTIR spectrometer uses an optical device called an interferometer, which modulates all of the infrared frequencies “encoded” into it. The signal can be measured very quickly, up to 5 scans a second for gas samples. This enables the spectrometer to monitor rapid changes in sample concentration over time.
Most interferometers employ a beamsplitter, which takes the incoming infrared beam and divides it into two optical beams. One beam reflects off of a flat mirror that is fixed in place. The other beam reflects off of a flat mirror mounted on a mechanism that moves the mirror a very short distance (typically a few millimeters) away from the beamsplitter. The two beams reflect off of their respective mirrors and are recombined when they meet back at the beamsplitter. Because the path that one beam travels is a fixed length and the other is constantly changing as its mirror moves, the signal that exits the interferometer is the result of these two beams “interfering” with each other. The resulting signal is called an interferogram, which has the unique property that every data point (a function of the moving mirror position) has information about every
infrared frequency that comes from the source. This means that as the interferogram is measured, all frequencies are being measured simultaneously. Thus, the use of the interferometer results in extremely fast measurements.
Spectral resolution, the ability to discriminate between adjacent absorbance peaks, is important in gas analysis to help distinguish between different components. Gas spectra typically feature numerous sharp, narrow absorbance bands in a spectral “envelope”, as compared to the broader, rounder spectral bands characteristic of solid or liquid samples. This arises from gas molecules having more degrees of freedom from intermolecular effects, enabling the atoms in the chemical bonds to rotate and vibrate freely. Consequently, spectrometers must be set to collect high-resolution data (typically 0.5 cm-1) to resolve each sharp peak of a gas’ spectrum.
Because the analyst requires a frequency spectrum (a plot of the intensity at each individual frequency) in order to make an identification, the measured interferogram signal cannot be interpreted directly. A means of “decoding” the individual frequencies is required. This can be accomplished via a well-known mathematical technique called the Fourier transformation (FT). This transformation is performed by the computer, which then presents the user with the desired spectral information for analysis.
FT
Interferogram Single beam
Transmittance
Ratio
Background
Sample
Background
Sample
Absorbance
How FTIR spectroscopy works
FTIR data processing summary

CA
UT
ION
Interferometer
IR source Mirror
Mirror
Mirror
Mirror
Beamsplitter
Optical path
Detector
Reference laser
Gas sample cell
Generating a spectrum on an FTIR spectrometer follows this process:
1. The Source: Infrared energy is emitted from a glowing black-body source. This beam passes through an aperture, which controls the amount of energy presented to the gas sample (and, ultimately, to the detector).
2. The Interferometer: The beam enters the interferometer where the “spectral encoding” takes place. The resulting interferogram signal then exits the interferometer. The interferometer uses a reference laser for precise wavelength calibration, mirror position control and data acquisition timing.
3. The Sample: Gas samples are enclosed in a gas cell with windows, which seal the gas cell and allow the infrared beam to pass into the cell. “White” cells have highly-reflective gold mirrors on either end of the cell, allowing the IR beam to pass multiple times through the sample before exiting the cell. The gas sample is controlled to a constant temperature and pressure to ensure reproducible sampling.
4. The Detector: The beam finally passes to the detector for final measurement. The detectors used are specially designed to measure the interferogram signal.
5. The Computer: The measured signal is digitized and sent to the computer where the Fourier transformation takes place. The final infrared spectrum is then presented to the user for interpretation and any further manipulation.
Because there needs to be a relative scale for the absorption intensity, a background spectrum must also be measured. The background is taken through an evacuated gas cell, or with the cell filled with N2 or other non-absorbing gas, in order to “zero” the instrument response. The background or zero spectrum is then compared to the sample spectrum within the gas cell to determine the “percent transmittance” of each frequency. Any spectral features common to the background spectrum and the sample spectrum will then cancel each other out and not appear in the final measurement. Thus, all spectral features on the spectrum are strictly attributed to the sample. This technique compensates for any spectral distortions or drift from the instrument that affects the spectrum. A single background measurement can be used for many sample measurements because this background spectrum is characteristic of the instrument itself.
5
The gas sample analysis process
A simple spectrometer layout
Below are some of the major advantages that FTIR spectroscopy offers over other analytical techniques.
Multiple gases analyzed in one sampleMost analytical sensors are sensitive to only 1 or 2 gases of interest, such as a chemiluminescence (CIA) detector for NOx gases (NO/NO2). In contrast, all IR-active gases are sampled simultaneously with an FTIR spectrometer with some methods analyzing over 30 separate gases!
Broad range of industrial compounds
• Combustion byproducts CO, CO2, H2O
• Methane (CH4) and other hydrocarbon species
• NO, NO2, N2O, NH3 for environmental applications
• Toxic or corrosive gases such as HCl, HCN, HF, HBr, SO2
• Semiconductor gases such as NF3, SiF4, CF4, CO2, and many chloro/fluorocarbons
• Chemical species such as alcohols, aldehydes, and aromatic compounds (BTEX)
Fast, convenient samplingSample handling for gases is easy since samples simply enter the gas cell directly for immediate measuring. Controlling the gas cell at a fixed temperature and pressure is all that is needed for reproducible results. Data collection does not require the use of diffusers, impingers or chemical derivatization. Hot, wet gases can be sampled directly without passing through a water condenser (“cold trap”) or be diluted with room air and captured in Tedlar® bags. A particulate filter for soot or other solid-phase contaminants may be used to keep the gas cell clean.
FTIR analysis can be used to monitor the quality of individual gas samples (e.g., pure specialty gases) or to create concentration trend charts from flowing sample streams (e.g., continuous emissions monitoring—CEM). Unlike gas chromatography (GC), FTIR spectroscopy can measure rapid changes in sample concentrations to transient events, second-by-second or even faster. Quantitative FTIR data is also easily automated and integrated with industrial process control systems and can be combined with other analyzer results such as O2 sensors.
Broad dynamic range—from percent levels to parts-per-billionThrough proper selection of gas sampling parameters, such as gas cell pathlength and spectral resolution, FTIR spectroscopy can analyze gases at wildly contrasting concentrations. FTIR analysis of combustion samples, for example, can measure CO2 values at 25%, with NO values down to 1 ppm. Detection levels of low parts-per-billion of contaminants in high-purity gas samples can be achieved with sampling times of less than 2 minutes.
Stable response eliminates need for daily recalibrationMost gas analyzers require the user to keep span gases (calibration gases) available for daily analyzer recalibration to adjust for changes in instrument response. In contrast, FTIR calibrations remain very stable and accurate indefinitely without recalibration. This is possible because taking a new background/zero scan compensates for any instrumental drift in the final absorbance spectrum.
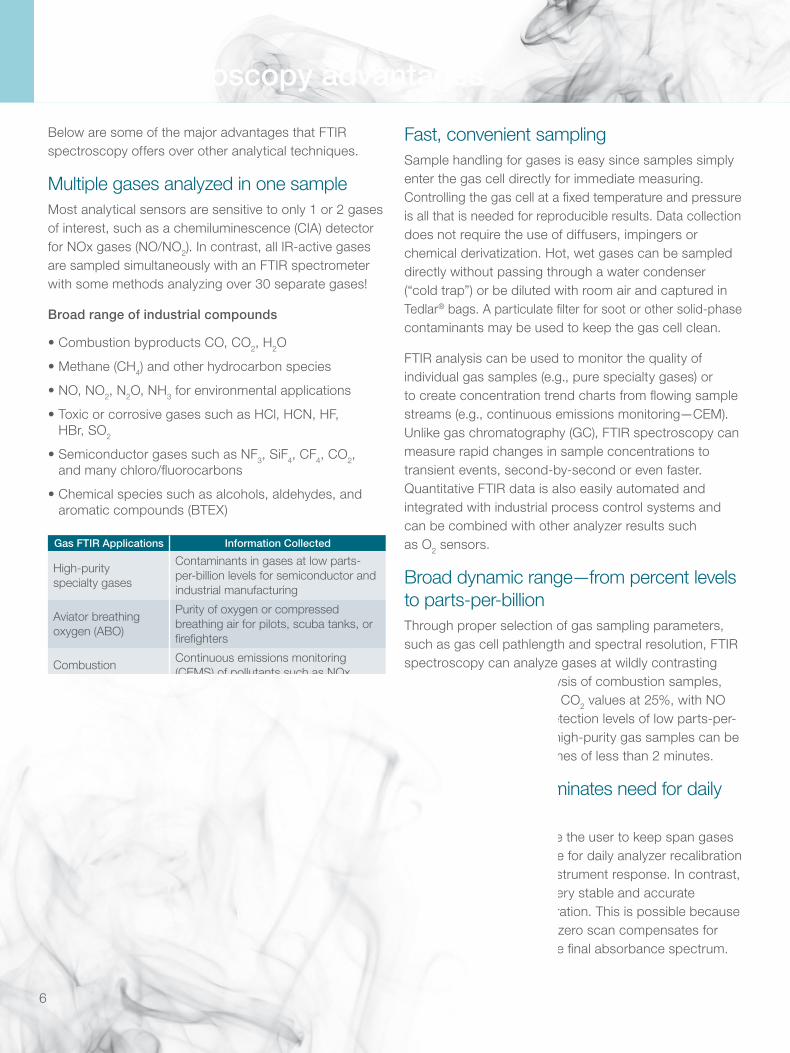
Gas FTIR Applications Information Collected
High-purity specialty gases
Contaminants in gases at low parts- per-billion levels for semiconductor and industrial manufacturing
Aviator breathing oxygen (ABO)
Purity of oxygen or compressed breathing air for pilots, scuba tanks, or firefighters
Combustion exhaust analysis
Continuous emissions monitoring (CEMS) of pollutants such as NOx gases, SO2, or VOC
Catalyst studiesGas byproducts from catalytic chemical reactions and kinetics
Fire safety scienceConcentration of smoke toxicity gases such as HCl or HF emitted from burning materials
Renewable energyGas profiles emitted by biomass, fermentation, and anaerobic digestion at landfills
FTIR spectroscopy advantages
6

7
Span gas cylindersInlet valve
Antaris IGSSample lines and gas cell at 50 °C
Sample
Vent to hood
= Valve
Outlet valve
Vacuum pump
Gas divider for calibration standards
Heated sample line
Pressure gauge to monitor sample—pressure at 760 mm Hg (1 atmosphere)
N2 background
There are several key factors to consider when setting up an FTIR gas analysis system. For the highest accuracy, the gas temperature and pressure should be kept constant, so that any changes in the spectra are due to changes in concentration, not gas density.
The diagram below shows a typical path for the gas to flow through the spectrometer. A diaphragm pump creates a vacuum, pulling the sample through a heated sample line into a heated gas cell to maintain a constant temperature. By adjusting the inlet and outlet valves, pressure can be kept constant as the gas flows through the cell. Alternatively, mass flow controllers may be used to maintain a constant flow through the cell.
Parameters Spectrometer Options Example Configurations
What are the concentration range/detection limits of your compounds?
Choose the gas cell pathlength designed for your detection range
• 10 cm cell for % levels• 2 M cell for part per million (ppm)• 10 M cell for part per billion (ppb)
What temperature and pressure are required?
Choose temperature and pressure controllers; Choose pressurized gas cells
Exhaust gases from combustion must be heated to prevent condensation of water or other compounds
How fast do I need to collect samples?
Select the FTIR detector that matches your collection speed
• DTGS used for 1–2 minute collections • MCT used for second-by-second collections
Static or changing concentrations?Software selections to match sample conditions
• Single samples• Concentration trend charts
How to analyze/quantify gas samples?
Standard or customized calibrations availableAccurate predictions require optimized calibrations
Standalone FTIR results or integrate with other sensors?
Interface with digital control systems (DCS) or programmable logic controllers (PLC)
• Automated control of sample valves • Data transmission to external control system
via Ethernet or 4–20 mA
*Your local Thermo Fisher Scientific representative can answer questions to optimize the FTIR system for your application(s).
Consider these parameters when configuring an FTIR spectrometer for your gas analysis application.*
Practical considerations for gas sampling
Gas sample conditioning example Gas flow diagram showing sample conditioning before entering the spectrometer
Find out more at thermofisher.com/IGS
© 2018 Thermo Fisher Scientific Inc. All rights reserved. Tedlar is a registered trademark of DuPont. All other trademarks are the property of Thermo Fisher Scientific and its subsidiaries unless specified. Specifications, terms and pricing are subject to change. Not all products are available in all countries. Please consult your local sales representative for details. BR52338_E 07/18M
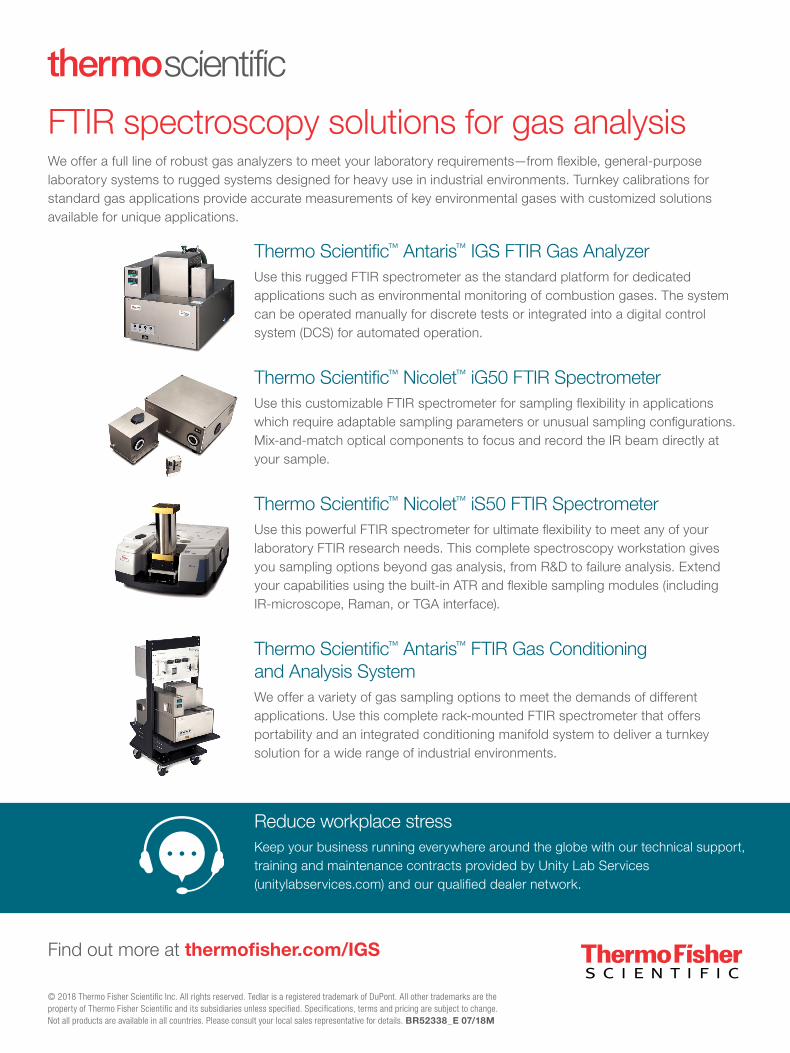
FTIR spectroscopy solutions for gas analysisWe offer a full line of robust gas analyzers to meet your laboratory requirements—from flexible, general-purpose laboratory systems to rugged systems designed for heavy use in industrial environments. Turnkey calibrations for standard gas applications provide accurate measurements of key environmental gases with customized solutions available for unique applications.
fpo Reduce workplace stressKeep your business running everywhere around the globe with our technical support, training and maintenance contracts provided by Unity Lab Services (unitylabservices.com) and our qualified dealer network.
Thermo Scientific™ Antaris™ IGS FTIR Gas AnalyzerUse this rugged FTIR spectrometer as the standard platform for dedicated applications such as environmental monitoring of combustion gases. The system can be operated manually for discrete tests or integrated into a digital control system (DCS) for automated operation.
Thermo Scientific™ Nicolet™ iG50 FTIR Spectrometer Use this customizable FTIR spectrometer for sampling flexibility in applications which require adaptable sampling parameters or unusual sampling configurations. Mix-and-match optical components to focus and record the IR beam directly at your sample.
Thermo Scientific™ Nicolet™ iS50 FTIR Spectrometer Use this powerful FTIR spectrometer for ultimate flexibility to meet any of your laboratory FTIR research needs. This complete spectroscopy workstation gives you sampling options beyond gas analysis, from R&D to failure analysis. Extend your capabilities using the built-in ATR and flexible sampling modules (including IR-microscope, Raman, or TGA interface).
Thermo Scientific™ Antaris™ FTIR Gas Conditioning and Analysis SystemWe offer a variety of gas sampling options to meet the demands of different applications. Use this complete rack-mounted FTIR spectrometer that offers portability and an integrated conditioning manifold system to deliver a turnkey solution for a wide range of industrial environments.


