54
Introduction to Geographic Information Systems Xiaogang (Marshall) Ma School of Science Rensselaer Polytechnic Institute Tuesday, January 22, 2013 GIS in the Sciences ERTH 4750 (38031)
| Date post: | 11-Jan-2016 |
| Category: |
Documents |
| Upload: | charla-bates |
| View: | 221 times |
| Download: | 1 times |

Introduction to Geographic Information Systems
Xiaogang (Marshall) MaSchool of Science
Rensselaer Polytechnic InstituteTuesday, January 22, 2013
GIS in the SciencesERTH 4750 (38031)

Acknowledgements
• This lecture is partly based on:– Huisman, O., de By, R.A. (eds.), 2009. Principles of
Geographic Information Systems. ITC Press, Enschede, The Netherlands
– Fox, P., 2012. Introduction to Geographic Information Systems for Science. Course lecture at RPI, Troy
2

Contents
• Introductions• Course outline• Logistics and resources• Assessment and assignments• Goals and learning objectives• Introduction to GIS• Next classes
3
Introductions
• Name, major, year• Interests, goals, outcomes• Have you completed any *suggested*
prerequisites:– Geography, cartography– Other spatial analysis– Mathematics background
• Questions
4
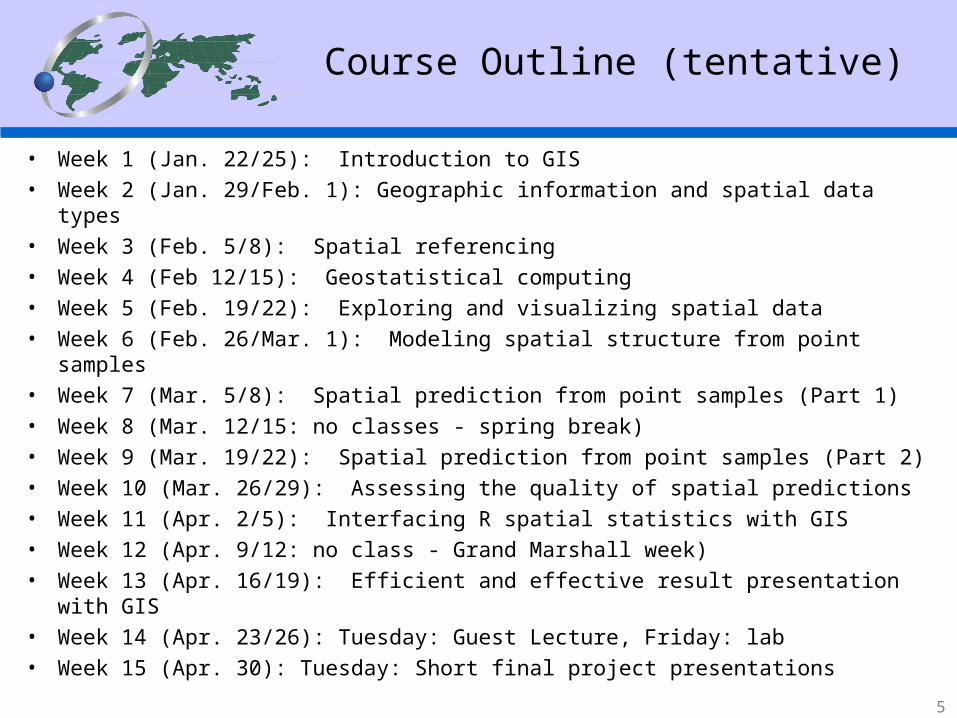
• Week 1 (Jan. 22/25): Introduction to GIS
• Week 2 (Jan. 29/Feb. 1): Geographic information and spatial data types
• Week 3 (Feb. 5/8): Spatial referencing• Week 4 (Feb 12/15): Geostatistical computing
• Week 5 (Feb. 19/22): Exploring and visualizing spatial data
• Week 6 (Feb. 26/Mar. 1): Modeling spatial structure from point samples
• Week 7 (Mar. 5/8): Spatial prediction from point samples (Part 1)
• Week 8 (Mar. 12/15: no classes - spring break)
• Week 9 (Mar. 19/22): Spatial prediction from point samples (Part 2)
• Week 10 (Mar. 26/29): Assessing the quality of spatial predictions
• Week 11 (Apr. 2/5): Interfacing R spatial statistics with GIS
• Week 12 (Apr. 9/12: no class - Grand Marshall week)
• Week 13 (Apr. 16/19): Efficient and effective result presentation with GIS
• Week 14 (Apr. 23/26): Tuesday: Guest Lecture, Friday: lab
• Week 15 (Apr. 30): Tuesday: Short final project presentations
Course Outline (tentative)
5
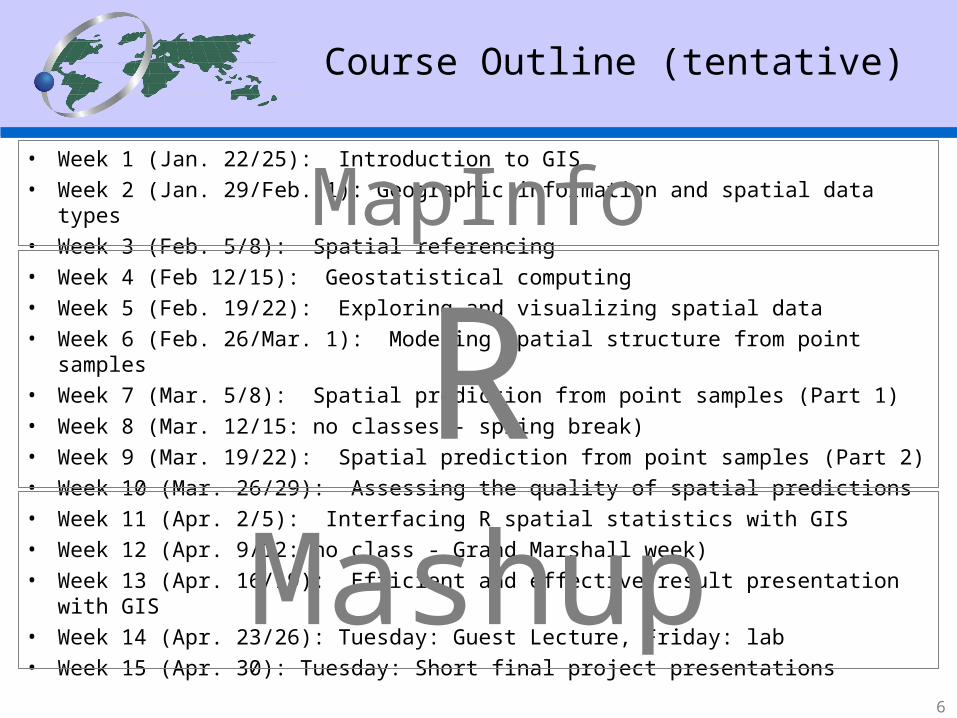
• Week 1 (Jan. 22/25): Introduction to GIS
• Week 2 (Jan. 29/Feb. 1): Geographic information and spatial data types
• Week 3 (Feb. 5/8): Spatial referencing• Week 4 (Feb 12/15): Geostatistical computing
• Week 5 (Feb. 19/22): Exploring and visualizing spatial data
• Week 6 (Feb. 26/Mar. 1): Modeling spatial structure from point samples
• Week 7 (Mar. 5/8): Spatial prediction from point samples (Part 1)
• Week 8 (Mar. 12/15: no classes - spring break)
• Week 9 (Mar. 19/22): Spatial prediction from point samples (Part 2)
• Week 10 (Mar. 26/29): Assessing the quality of spatial predictions
• Week 11 (Apr. 2/5): Interfacing R spatial statistics with GIS
• Week 12 (Apr. 9/12: no class - Grand Marshall week)
• Week 13 (Apr. 16/19): Efficient and effective result presentation with GIS
• Week 14 (Apr. 23/26): Tuesday: Guest Lecture, Friday: lab
• Week 15 (Apr. 30): Tuesday: Short final project presentations
Course Outline (tentative)
6
MapInfo
RMashup

Logistics
• Class: ERTH 4750• Hours: 4pm-5:50pm Tuesday, Friday• Location: JRSC 2C25• Instructor: Xiaogang (Marshall) Ma – [email protected] • Contact hours: Thursdays 1pm-2pm (or by appointment)• Contact location: JRSC 1W01 or Winslow 2120• TA: Anastasia Rodzianko, [email protected] • Web: http://tw.rpi.edu/web/Courses/GIScience/2013
– Schedule, syllabus, reading, assignments, etc.
7
Assessment and Assignments
• Via written assignments with specific percentage of grade allocation provided with each assignment
• Via individual oral presentations with specific percentage of grade allocation provided
• Via group presentations – depending on class size• Via participation in class (not to exceed 10% of total) – this
works by ‘losing’ points by not participating• Late submission policy: first time with valid reason – no
penalty, otherwise 20% of score deducted each late day
8

Assessment and Assignments
• Reading assignments– Are given almost every week– Most are background and informational– Some are key to completing assignments– Some are relevant to the current week’s class (i.e. follow up
reading)– Others are relevant to following week’s class (i.e. pre-reading)– Undergraduates - will not be evaluated on but we will often discuss
these in class and participation in these is taken into account– Graduates – are likely to be tested as part of assignments, i.e. an
extra question
• You will progress from individual work to group work
9
Goals
• To provide students an opportunity to learn geospatial applications and tools.
• To introduce relational analysis and interpretation of spatial data and presentation on maps.
• Introduce spatial database concepts and technical aspects of query languages and geographic integration of graphic and tabular data.
• To introduce intermediate aspects of geospatial analysis: map projections, reference frames, multivariate analysis, correlation analysis, regression, interpolation, extrapolation, and kriging.
• To gain experience in an end-to-end GIS application via a term project.
10

Learning Objectives
• Through class lectures, practical sessions, written and oral presentation assignments and projects, students should:– Demonstrate proficiency in using geospatial
applications and tools (commercial and open-source).– Present verbally relational analysis and interpretation of
a variety of spatial data on maps.– Demonstrate skill in applying database concepts to
build and manipulate a spatial database, SQL, spatial queries, and integration of graphic and tabular data.
– Demonstrate intermediate knowledge of geospatial analysis methods and their applications.
11

Academic Integrity
• Student-teacher relationships are built on trust. For example, students must trust that teachers have made appropriate decisions about the structure and content of the courses they teach, and teachers must trust that the assignments that students turn in are their own. Acts, which violate this trust, undermine the educational process. The Rensselaer Handbook of Student Rights and Responsibilities defines various forms of Academic Dishonesty and you should make yourself familiar with these. In this class, all assignments that are turned in for a grade must represent the student’s own work. In cases where help was received, or teamwork was allowed, a notation on the assignment should indicate your collaboration. Submission of any assignment that is in violation of this policy will result in a penalty. If found in violation of the academic dishonesty policy, students may be subject to two types of penalties. The instructor administers an academic (grade) penalty, and the student may also enter the Institute judicial process and be subject to such additional sanctions as: warning, probation, suspension, expulsion, and alternative actions as defined in the current Handbook of Student Rights and Responsibilities. If you have any question concerning this policy before submitting an assignment, please ask for clarification.
12

Skills needed
• Geography? – Nah, we’ll cover that
• Literacy with computers that can load and run the relevant applications
• Ability to access Internet and retrieve or acquire data
• Presentation of assignments
13

What is expected
• Attend class, complete assignments (esp. reading)
• Participate• Ask questions• Work both individually and in a group• Work constructively in group and class sessions
14

Questions so far?
15

Introduction to Geographic Information Systems
16
Now let’s start
Contents
• 1 The purpose of GIS• 2 The real world and representations of it• 3 GIS as a domain of science and technology• 4 Seven levels of GIS competence
17

1 The purpose of GIS
• A few example scenarios
• An urban planner might like to find out about the urban fringe growth in her/his city, and quantify the population growth that some suburbs are witnessing. S/he might also like to understand why it is these suburbs and not others.
Urban fringe, Waitara, New ZealandImage courtesy of Quentin Christie
18

• A biologist might be interested to determine how widespread the invasive Asian clam in Lake George was, and to develop and implement an eradication plan.
1 The purpose of GIS
Asian clam identified in Lake George, NYImage courtesy of lakegeorge.com
19
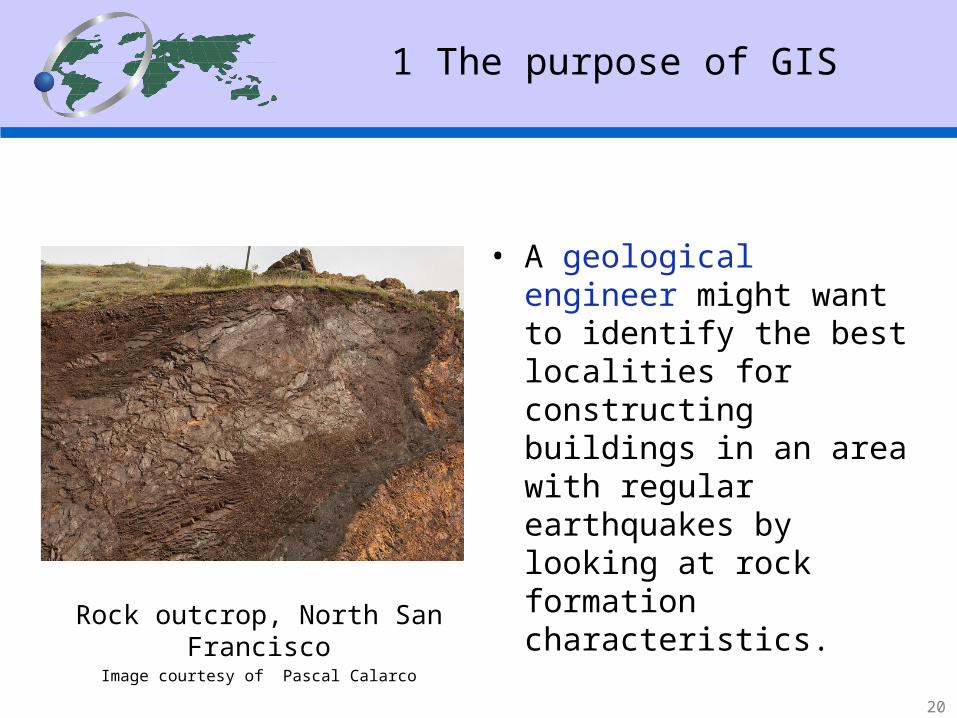
• A geological engineer might want to identify the best localities for constructing buildings in an area with regular earthquakes by looking at rock formation characteristics.
1 The purpose of GIS
Rock outcrop, North San FranciscoImage courtesy of Pascal Calarco
20

• A forest manager might want to optimize timber production using data on soil and current tree stand distributions, in the presence of a number of operational constraints, such as the requirement to preserve tree diversity.
1 The purpose of GIS
Timber productionImage courtesy of futureforest.eu
21

1 The purpose of GIS
• Various professionals work with data that relates to space, typically involving positional data.
• Positional data determines where things are, or perhaps where they were or will be.
Abraham LincolnThomas JeffersonGeorge Washington
They worked on ‘positions’ (land survey) before entering politicsImages courtesy of wikipedia.org 22

1 The purpose of GIS
• More precisely, those professionals’ questions are related to geographic space, which have positional data relative to the Earth’s surface (georeferenced data).– There are also positional data of a non-geographic nature.
• A Geographic Information System (GIS) is a computerized system that helps in maintaining and displaying data about geographic space.
23

1.1 Some fundamental observations
• Our world is constantly changing, and not all changes are for the better.– Natural causes: e.g., volcanic eruptions– Human causes: e.g., land use changes– Mix / Unclear causes: e.g., El Niño / La Niña events
Grimsvotn volcano, May 21, 2011Image courtesy of AP / Jon Gustafsson
U.S. Drought of 2012Image courtesy of The NY Times / Mashid Mohadjerin
24

1.1 Some fundamental observations
• We, humans, want to understand what is going on in our world, and to take action(s).
• The fundamental problem in many uses of GIS is that of understanding phenomena that have (a) a geographic dimension, and (b) a temporal dimension.– Spatio-temporal: be of/in space and time
“Everything that happens, happens somewhere in space and time. ”
-- Michael Wegener (University of Dortmund)
25

1.1 Some fundamental observations
Drought’s Footprint (1930 to present)Image source: National Climatic Data Center, NOAA
26

1.1 Some fundamental observations
The maps show current and projected forest types. Major changes are projected for many regions. For example, in the Northeast, under a mid-range warming scenario, the currently dominant maple-beech-birch forest type is projected to be completely displaced by other forest types in a warmer future.
Projected shifts in forest types
Image source: http://nca2009.globalchange.gov/projected-shifts-forest-types
27
1.2 Definition of GIS
• We may distinguish three important phases of working with georeferenced data:– Data preparation and entry– Data analysis– Data presentation
• The three phases may be repeated a number of times before we are satisfied with the results.
• We can define a GIS as a computerized system that facilitates the phases of data entry, data analysis and data presentation especially in cases when we are dealing with georeferenced data.
28

1.3 Spatial data and geoinformation
• Data are representations that can be operated upon by a computer.
• Metadata are data about data.• Spatial data are data that contain positional values.• Geospatial data are spatial data that are georeferenced.
– In the context of GIS, spatial data and geospatial data are regarded as synonyms of georeferenced data.
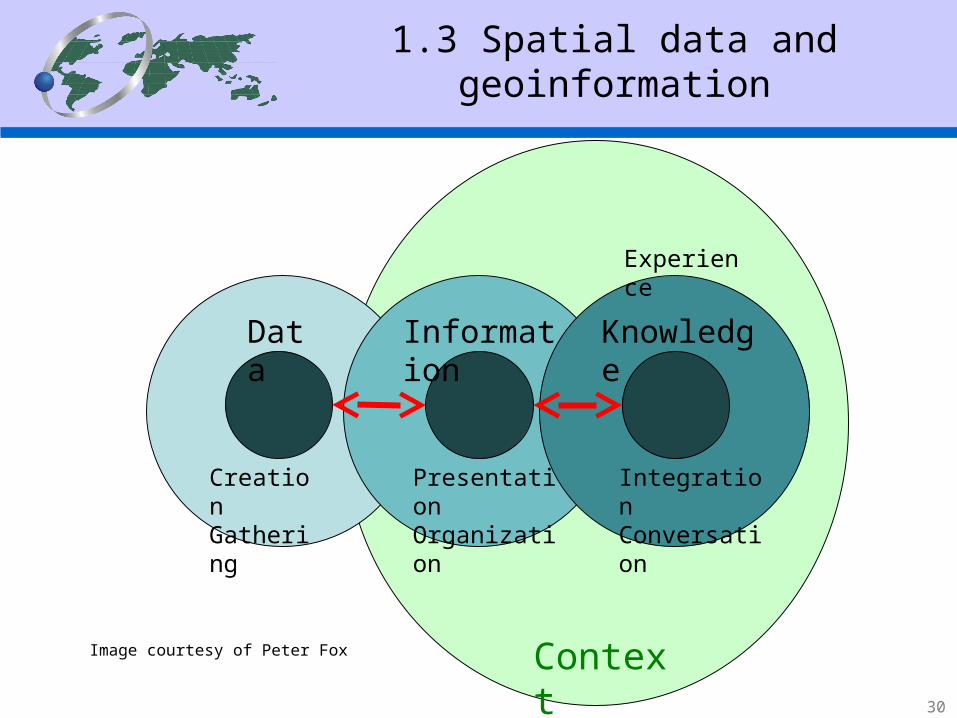
• Information is the meaning of data as interpreted by human beings.
• Geoinformation is information that involves interpretation of spatial data.
29
1.3 Spatial data and geoinformation
Image courtesy of Peter Fox
Data Information Knowledge
Context
PresentationOrganization
IntegrationConversation
CreationGathering
Experience
30
1.3 Spatial data and geoinformation
• In GIS, a wider view of QUALITY is important for several reasons:– Even source data have been subject to strict quality control, errors
are introduced when these data are input to a GIS.– A GIS database normally contains data from different sources of
varying quality.– Most GIS analysis operations will themselves introduce errors.– Uncertainty in decision-making depends upon quality of base data
and derived information.– … …
31

1.3 Spatial data and geoinformation
Comparison of seven available digital databases of the streets in part of Goleta, CA, USA
(Goodchild 2011)
32

2 The real worldand representations of it
• When dealing with data and information we are usually trying to represent some part of the real world as it is, as it was, or perhaps as we think it will be.– We say ‘some part’ because the real world cannot be represented
completely.
• We use a computer representation of some part of the real world to enter and store data, analyze the data and transfer results to humans or to other systems.
Image courtesy of NOAA 33
2.1 Modeling
• A representation of some part of the real world can be considered a model of that part.– This allows us to study the model instead of the real world.
• Models come in many different flavors.– Maps– Databases – … …
• Most maps and databases can be considered static models.
• Dynamic models or process models address changes that have taken place, are taking place and may take place.
34
2.1 Modeling
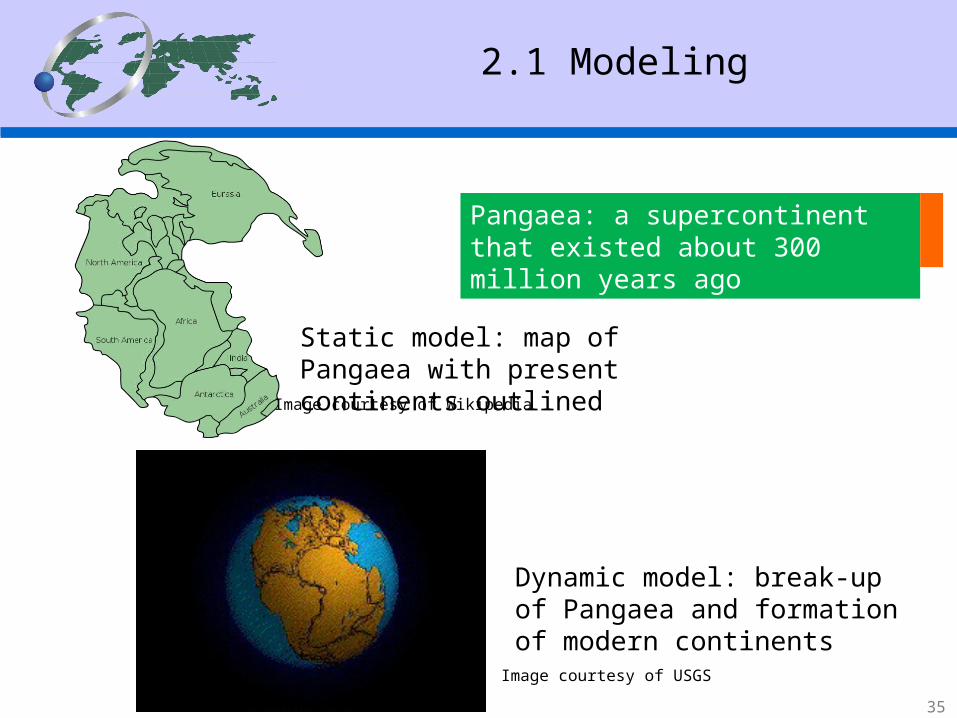
Dynamic model: break-up of Pangaea and formation of modern continents
Static model: map of Pangaea with present continents outlinedImage courtesy of Wikipedia
Image courtesy of USGS
Pangaea: a supercontinent that existed about 300 million years ago
35

2.2 Maps
• The best known models of the real world are maps.• A map is always a graphic representation at a certain level
of detail.– The smaller the scale, the less detail a map can show.
• Cartography: science and art of map making
Map scale increasing
Images made with Google Maps
Image © Bil Keane. Courtesy of familycircus.com
36

2.2 Maps
More examples of maps
Images courtesy of rpi.edu
37

2.3 Databases
• A database is a repository for storing large amounts of data.– It allows concurrent use.– It supports storage optimization.– It supports data integrity.– It has a query facility.– It offers query optimization.
• Modern database systems organize the stored data in tabular format.
Image courtesy ofMapInfo User Guide
38
2.3 Databases
• A database may have many tables, and each table may have many columns (attributes) and rows (records).
• During database design, it is determined which tables will be present and which columns each table will have.
• The result of a completed database design is known as the database schema.
• To define the database schema, we use a language, commonly known as a data model.
• The definition of a model is called data modeling.
39
2.4 Spatial databases
• Spatial databases are a specific type of database.– Besides traditional administrative data, they can store
representations of real world geographic phenomena for use in a GIS.
– A spatial database, also called a geodatabase, focuses on concurrency, storage, integrity, and querying of spatial data.
– A GIS focuses on operating on spatial data with a ‘deep understanding’ of geographic space.
• A spatial database is used under the assumption that the relevant spatial phenomena occur in a two- or three-dimensional Euclidean space.
40

2.4 Spatial databases
• Geographic phenomena have various relationships with each other and possess spatial, temporal, and thematic attributes.
• For data management purposes, phenomena are classified into thematic data layers.
• Spatial analysis is the generic term for all manipulations of spatial data carried out to improve one’s understanding of the geographic phenomena that the data represent.
Image courtesy of Jonathan Campbell and Michael Shin 41

3 GIS as a domain of science and technology
(DiBiase et al. 2006)
Philosophy
Computer Science
Mathematics
Statistics
Psychology
LandscapeArchitecture
Engineering
Various Application Domains
Geography
Information Science &
Technology
Geographic Information Science & Technology
Geographic Information
Science
Application of GI Science & Technology
Geospatial Technology
From GI System to GI Science & Technology
42

3.1 Geographic Information Science
• Hmm, a broad S– From GISystems to GIScience– GIScience: the science behind GISystems technology
• considers fundamental questions raised by the use of systems and technologies
• is the science needed to keep technology at the cutting edge
Courtesy: http://www.ncgia.ucsb.edu/giscc/units/u002/u002.html
43

3.2 Geospatial technology
• Geospatial technology / Geomatics– Land surveying– Remote sensing– Cartography– Geographic information systems (GIS)– Global navigation satellite systems (GPS, GLONASS,
Galileo, Compass)– Photogrammetry– Geography– …
44
• Global Positioning System (GPS)– a system of Earth-orbiting satellites transmitting
precisely timed signals• a similar system deployed by the Russian Federation is called
GLONASS (global navigation satellite system)• and other systems by EU, China, India, etc.
– signals are received by a special electronic device• the smallest versions are hand-held and even smaller
– provides direct measurement of position on the Earth's surface
– location is expressed in latitude/longitude or other standard system
3.2 Geospatial technology
45

• GPS
3.2 Geospatial technology
Image source: AP
Image source: Wikipedia
Image from WWWImage source: Wikipedia46

• Remote Sensing (RS)– use of Earth orbiting satellites to capture information
about the surface and atmosphere below– satellites vary depending on how much detail can be
seen, what parts of the electromagnetic spectrum are sensed
– signals transmitted to Earth receiving stations where they are transformed for dissemination as digital images
Courtesy: http://www.ncgia.ucsb.edu/giscc/units/u002/u002.html
3.2 Geospatial technology
47

3.2 Geospatial technology
• Two main types of RS– Passive RS: detect natural radiation (e.g., sunlight) that
is emitted or reflected by the object or surrounding areas
– Active RS: emits energy (e.g., laser light) in order to scan objects and areas whereupon a sensor then detects and measures the radiation that is reflected or backscattered from the target
Images from: http://www.rsgisrs.com/rs_types.htm48

49
Night lights of Australia as observed by the Visible Infrared Imaging Radiometer Suite (VIIRS) on the Suomi NPP satellite in April and October 2012

50
More information: http://earthobservatory.nasa.gov/IOTD/view.php?id=80030&src=fb
Fires

• GISystems– a computerized system that facilitates the entry,
analysis, and presentation of georeferenced data
• GPS and RS are primary data sources for GIS
3.2 Geospatial technology
http://shuttles.rpi.edu/
http://www.flightradar24.com/
Try these:
51

4 Seven levels of GIS competence
• Levels of GIS competence in ascending order: 1. Public awareness of GIS and its uses;
2. Basic spatial and computer understanding;
3. Routine use of basic GIS software;
4. Higher-level modeling applications of GIS;
5. Design and development of GIS applications;
6. Design of geographic information systems; and
7. GIS research and development.
(DiBiase et al. 2006; Marble 1997)
52

Reading for this week
• Map• GPS• Remote Sensing• MapInfo User Guide and other docs
See links to them at: http://tw.rpi.edu/web/Courses/GIScience/2013
53

Next classes
• Friday class:– install and work with MapInfo / Map Basic– RPI has an on-site license of MapInfo– http://www.rpi.edu/dept/arc/web/software/sw_available.html
• Start working with it, ask questions…
• In preparation:– Next Tuesday: Geographic information and spatial data
types– Also, check course webpage for additional resources:– http://tw.rpi.edu/web/Courses/GIScience/2013
54


