+ All Categories
Home > Documents > Introduction to GIS using QGIS -...

Introduction to GIS using QGIS -...

Date post: 13-May-2020
Category:
Upload: others
View: 13 times
Download: 0 times
Share this document with a friend
117
Iman Mallakpour ( [email protected]) Department of Civil and Environmental Engineering, University of California, Irvine 1 Introduction to GIS using QGIS https://imgur.com/gallery/WoBen Central Asia PEER Forum December 3-5, 2018, Almaty, Kazakhstan
Transcript

Iman Mallakpour ([email protected])

Department of Civil and Environmental Engineering, University of California, Irvine

1

Introduction to GIS using QGIS

https://imgur.com/gallery/WoBen

Central Asia PEER Forum

December 3-5, 2018, Almaty, Kazakhstan

2

What is GIS?

Geographic

Information

System

https://www.esri.com/en-us/what-is-gis/overview

3

GIS is a technological field that incorporates geographical features with tabular

data in order to map, analyze, and assess real-world problems.

OR

A computer-based information system that is used to:

input

store

manipulate

display

Analyze

spatial data and to identify spatial patterns and support decision making

processes.

4

GIS is Everywhere!

5

• Many of the issues in our world have a critical

spatial component! – Land management

– Property lines, easements, right of ways

– Data on land values, taxation, assessment

– Business site selection, advertising

– Proximity of ‘our’ land to other facilities (pollution, hunting,

municipal, federal, state)

– Hydrology: Soil, Elevation,

Structures , vegetation

– Crime analysis

– Emergency management and

disaster preparation

6

The Earth is finite! – If not now, within our lifetimes there may be no natural

ecosystems.

– Land managers, natural resource workers, and politicians

are and will continue to make decisions about biological

systems.

– Good information and tools are needed to do this.

GIS for Our Future

7

GIS answers the following

Location: What is at...? Where is it?

Condition: Status of features?

Trends: What has changed since...?

Patterns: What spatial patterns exist?

Modeling: What if…?

Beyond creating and viewing maps, spatial data analysis is concerned with questions

not directly answered by looking at the data themselves.

8

• Federal and Local Government

• “Human Services”

• Census data

• Disease control

• Infrastructure and utilities

• Land and resources management

• Military

• Natural hazard mapping (e.g., fires,

flooding,

earthquakes, tsunami, landslides)

• Evacuation plans

• Industry

• Engineering Consultants

• Technology (e.g., Google Maps)

• Insurance

Researchers in academia

• Geography

• Biology

• Earth Sciences

• Atmospheric Science

• Geophysics

• Geochemistry

• Geology

• Hydrology

• Cryosphere

• Engineering

• … anyone working with spatial data

9

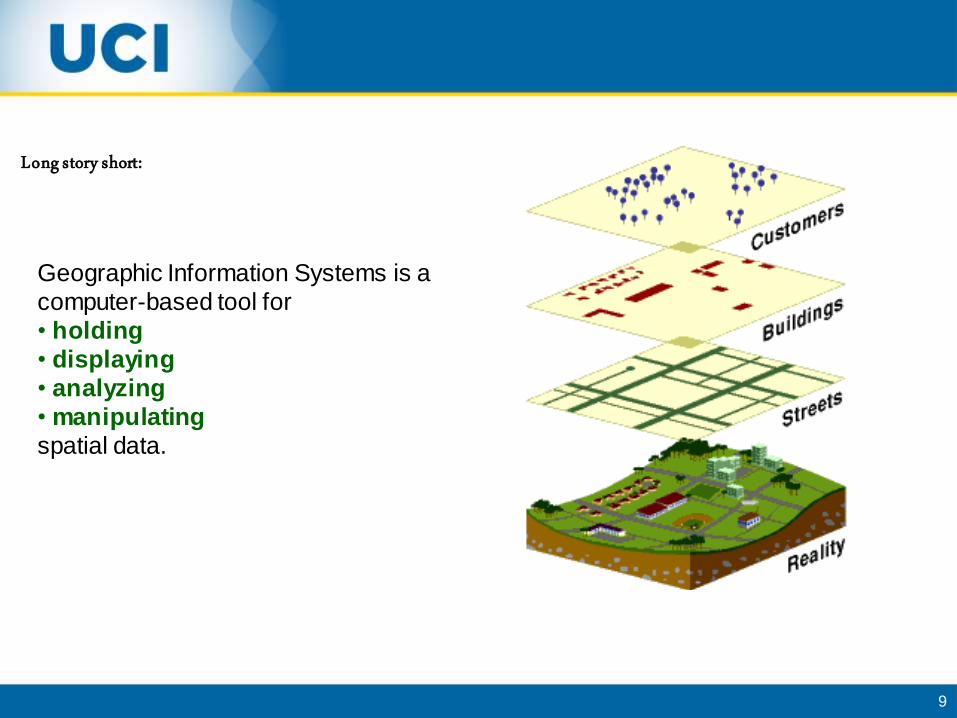
Geographic Information Systems is a

computer-based tool for

• holding

• displaying

• analyzing

• manipulating

spatial data.

Long story short:

10

Geographic Information System (GIS)

• GIS is used to store, analyze, and manipulate geospatial data

• We’ll be learning to use QGIS

• Other software

• Python and R also have geospatial packages/libraries for working with geospatial data directly with code

• ArcMap

• Computer-based tool with a full GUI used to:

• Create, display, explore, and edit GIS datasets

• Create map layouts for printing or publication

• ArcCatalog

• Tool used to manage your files and databases

11

The Differences Between QGIS and ArcGIS

12

Spatial and spatio-temporal data are everywhere.

Types of Spatial Data

13

• Data or observations with associated geographic

information

• Meaning that it is multidimensional (2D), with an x, y location in space

• Can also be 3D (not covered in this class)

• Large data sets!

• Can easily reach a terabyte in size

• Time consuming to analyze

• To deal with this size issue, very large geospatial datasets will often be provided in a more compact file format (e.g. NetCDF, GRIB) • May require pre-processing of the data to input it into ArcGIS

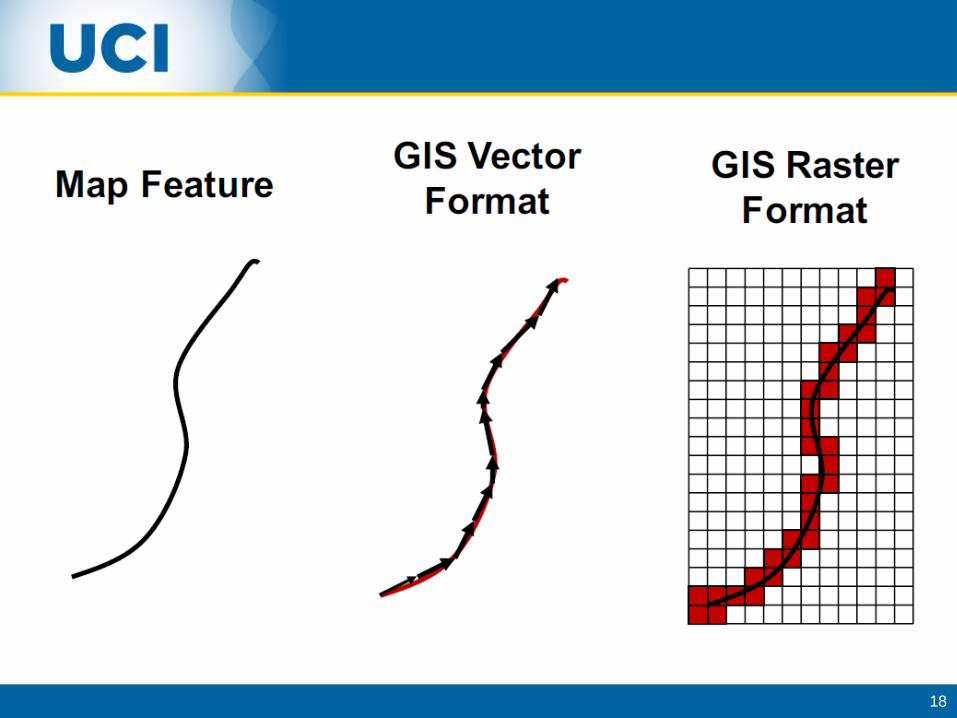
In GIS, vector and raster are two different ways of representing spatial data.

14

http://metrocosm.com/qgis/

15

Raster Data

Raster are regularly spaced grids. Raster data stores information of features in cell-

based manner. Satellite images, photogrammetry and scanned maps are all raster-

based data. Images are types of (multi-band) raster. Rasters are generally identified by

corner locations of the data set, size of grid, and units of the measure (elevation,

reflectivity, etc…)

Basic Elements:

• Extent # Rows # Columns

• Origin

• Orientation

• Resolution: pixel = grain = grid cell

16

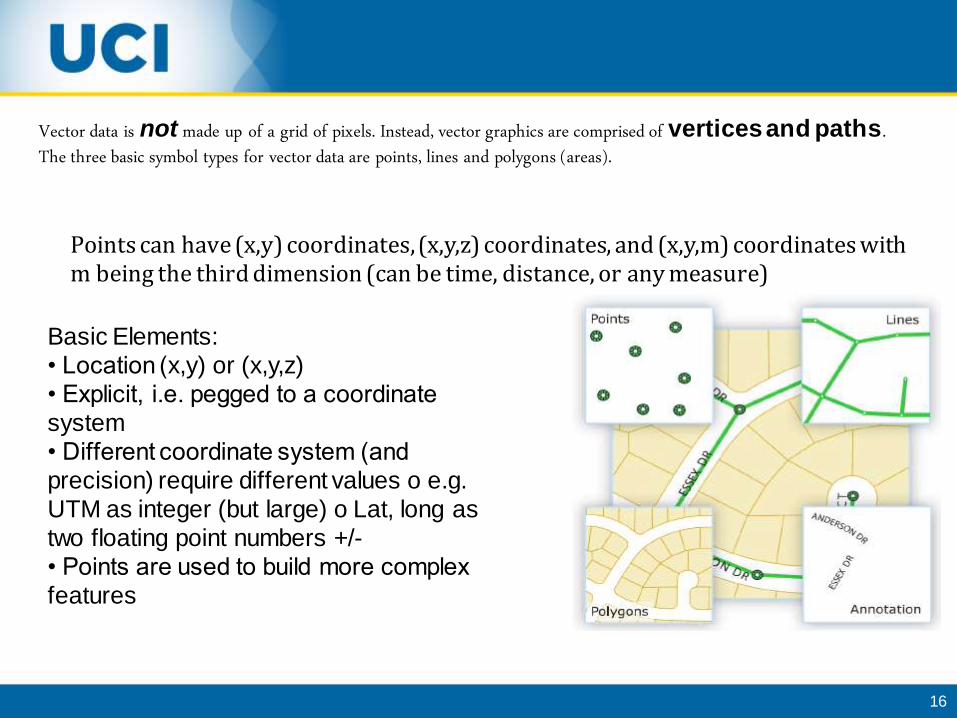
Points can have (x,y) coordinates, (x,y,z) coordinates, and (x,y,m) coordinates with m being the third dimension (can be time, distance, or any measure)

Basic Elements:

• Location (x,y) or (x,y,z)

• Explicit, i.e. pegged to a coordinate

system

• Different coordinate system (and

precision) require different values o e.g.

UTM as integer (but large) o Lat, long as

two floating point numbers +/-

• Points are used to build more complex

features

Vector data is not made up of a grid of pixels. Instead, vector graphics are comprised of vertices and paths. The three basic symbol types for vector data are points, lines and polygons (areas).

17

18

19

20

•Advantage and disadvantage of using raster and vector data

•Raster data model record value of all the points of the area covered

which required more data storage than model represented by the vector

model.

•Raster data is less expensive to create computationally compare to

vector graphics.

•Raster data has issue while overlaying multiple images.

•Vector data are easily overlaid, for example overlaying roads, rivers,

land use are easier than raster data.

•Vector data are easier to scale, re-project or register.

•Vector data are more compatible with the relational database

management system.

•Vector file sizes are much smaller than raster image file.

•Vector data are easier to update like adding river stream but has to be

recreated for the raster image.

Source:

http://support.pitneybowes.com/SearchArticles/VFP05_KnowledgeWithSideb

arHowTo?id=kA180000000Cu9DCAS&popup=false;&lang=en_US

21

Spatial data have spatial reference: They have coordinate values and a system of reference for these coordinates. As a fairly simple example, consider the locations of points on the Earth. This data set consists of points only. When we want to draw these points on a (flat) map, we are faced with the problem of projection: we have to translate from the spherical longitude/latitude system to a new, non-spherical coordinate system, which inevitably changes their relative positions.

22

Lets open QGIS!

The QGIS interface is separated into four

interface types: menu bar, toolbars, panels,

Status Bar and map display.

Menu bar

Toolbars

Status Bar

Panels

Map display

More to read:

https://docs.qgis.org/2.18/en/docs/training_

manual/introduction/overview.html

https://docs.qgis.org/testing/en/docs/user_

manual/introduction/qgis_gui.html

23

Form menu:

Layer>Add layer

>Add Delimited Text Layer

File that will be used

in the task 1:

signif.txt

(significant earthquakes)

NOAA’s National Geophysical Data Center

produces a great dataset of all significant

earthquakes

From: https://www.qgistutorials.com/en/docs/importing_spreadsheets_csv.html

Task 1-Importing Spreadsheets, CSV files and text

file

24

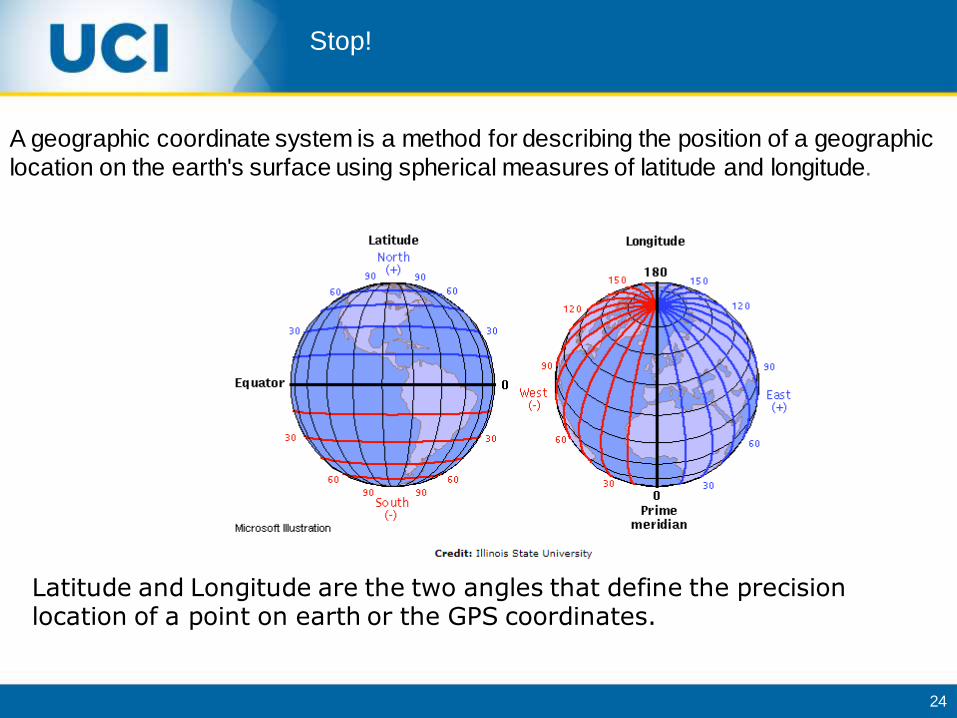
Latitude and Longitude are the two angles that define the precision location of a point on earth or the GPS coordinates.

A geographic coordinate system is a method for describing the position of a geographic

location on the earth's surface using spherical measures of latitude and longitude.

Stop!

25

Get Latitude and Longitude: https://www.latlong.net/

26

It is easy to confuse X and Y coordinates.

Latitude is a Y coordinate.

Longitude is a X coordinate.

27

Geographic Coordinate Systems

Coordinate reference systems (CRS): how to represent a bumpy ellipsoid on the plane.

28

Map Projections(3 basic categories)

Secant

orTangent

Secant

orTangent

Secant

orTangent

29

30

Coordinate Systems

GIS applications store data features using x, y, z coordinates that represent locations via

a defined geographic coordinate system. A coordinate system is a reference that links

the locations of geographic features using a datum and map projection system. A datum

is a representation of the earth’s surface from a mathematical viewpoint. The most

frequently used datum is the world geodetic system of 1984 (WGS84) which is widely

used for location measurement and referencing. Generally, there are two types of

coordinate systems: (a) a global (spherical) coordinate system such as latitude-

longitude alternatively referred to as geographic coordinate systems; (b) a projected

coordinate system based on a map projection scheme that transforms the spherical

surface of the earth into a two dimensional system (x,y coordinates).

31

Coordinate Systems

The process of transforming a three dimensional curved system into a two dimensional

Cartesian plane is known as projection. Both geographic and projected coordinate

systems define a framework for locating geographic features. In ArcGIS application,

both geographic and projected coordinate systems can be used to define locations.

When you are working with multiple layers of data with different coordinate system,

ArcGIS can integrate your layers as long as each layer has a defined spatial reference.

32

A spatial reference defines the coordinate system and spatial properties of datasets. In QGIS application, the spatial reference parameters include: •The coordinate system (e.g., latitude-longitude) •The precision of the coordinates or the coordinate resolution •Processing tolerances •The spatial domain or the map extent

33

More to read about Coordinate Reference Systems:

https://docs.qgis.org/testing/en/docs/gentle_gis_introduction/coordinate_reference_syst

ems.html

34

Task 2- Importing a shapefile (map of world)

File that will be used in the task 2:

TM_WORLD_BORDERS_SIMPL-0.3.shp

35

36

37

Task 3- Repeat task 1 and 2 with the below datasets:

1- us states

2- Qmax-63-01

Task 3- Your turn

38

Task 4- In this task we want to explore how to view attributes and do queries on them.

Continue with task 3.

-Make 2 copies of point dataset.

-Right-click the layer and select Open Attribute Table

-Explore it! What do you see?

Task 4- Working with Attributes

39

Perform query on attributes

-Take a look at Pval

and est.

-Close Attribute

table.

40

Selecting points with especial attribute

- Right click on the point layer and select Properties.

41

- In the source tab, find

Query Builder.

42

1- Enter the below expression:

"pval" < 0.05 AND "est">0

Click ok.

Take a look at what happens.

2- Redo (1) with using the below

expression:

"pval" < 0.05 AND "est"<0

43

Task 5- Map time!

In this task we will learn how to make our first print-ready map. First change the color

of USA map.

Right click on the state layer and select Properties.

In Symbology tab, find single symbol. And then find simple white.

44

You will see a new color!

45

Now change the style and color of points.

Right click on the point layers you selected by "pval" < 0.05 AND "est">0 and

select Properties.

In Symbology tab, find single symbol and maker and find a triangle symbol, then make it

blue.

46

Redo it for the point layers you selected by "pval" < 0.05 AND "est“<0 by making a red

downward triangle symbol. You have to get something similar to the below map.

47

Things to Consider When Making a Map!

48

49

50

51

52

Time to make a beautiful map!

Go to Project > New Print Layout

53

Go to Add Item > Add Map

54

Now we will follow a step by step procedure to make the below map.

55

56

Task 6- Make a hurricane map

We are going to make the below map that is showing every recorded hurricane, cyclone,

and typhoon going back about 150 years.

Source: http://metrocosm.com/qgis/

Files you will

need to use for

this task:

1-

Allstorms.ibtrac

s_all_lines.v03r

08.shp

2-

ne_110m_admi

n_0_countries.

shp

57

Load the files

58

You will see something like this

59

The various styling options are located in the Style tab of the Properties dialog. Change

the color of the world map.

60

Change the background color of the main map area.

61

Let us explore another styling option. Select the wind value and draw hurricane lines .

This time choose Categorized from the Style tab.

62

Choose a color map and Click OK.

63

Your turn to make a beautiful map. Be creative!

64

Task 7- Make a world population map.

Load the data.

65

66

Choose a color ramp of your choice and click

67

68

69

Remove Antarctica

70

71

72

Task 8- Raster Data

73

Each pixel in this raster file has a value of either -1 or 1.

A raster layer consists of one or more raster bands. It is referred to as either

single band or multi band raster. A band represents a matrix of values.

74

To better visualize these pixels open Properties> Symbology

75

Symbology > Render type > Unique values

76

77

Make a map only for California. You have to select this state first on the State shapefile.

78

79

80

Clip the raster file to the extension of California.

81

Raster> Extraction> Clip Raster by mask layer

82

83

That’s what you will get.

84

Task 9- length of lines and number of points

Files you will need to use

for this task:

1-

Lakes_and_Rivers_Shap

efile

2- us states

3-powerplants-usa

85

Vector> Analysis Tools> Sum line lengths

86

87

Vector> Analysis Tools> Count Points in Polygon

88

89

Sampling Raster Data using Points or Polygons and installing plugin.

In the raster files we need to extract the pixel values at certain locations or aggregate

them over some area. For this we need to install a QGIS plugin, the Point Sampling Tool

Also we need to work with the Zonal Statistics that is in processing toolbox.

The Processing Toolbox is the main element of the processing GUI (more about it here

https://docs.qgis.org/testing/en/docs/user_manual/processing/toolbox.html)

Plugins in QGIS add useful features to the software. Plugins are written by QGIS

developers and other independent users who want to extend the core functionality of the

software. To begin using plugins, you need to know how to download, install and activate

them.

Task 10- Raster Data 2

90

91

The aim of this task is to extract

1- The temperature at urban areas

2- Calculate the average temperature for each county in the United States.

- You need to work with three files.

us.tmax_nohads_ll_20140525_float.tif (Maximum temprature)

2013_Gaz_ua_national.zip ( representing urban areas in the US. )

tl_2013_us_county.zip (The united States counties)

Source of this task:

https://www.qgistutorials.com/en/docs/sampling_raster_data.html

Data Sources: [NOAACPC], [USGAZETTEER] [TIGER]

92

Add the raster file

93

Add Delimited Text Layer

94

95

Open Plugins from menu then in the Analyses select the Point sampling tool.

96

In the Point Sampling Tool dialog please select 2013_Gaz_ua_national as the Layer

containing sampling points. Then, Choose GEOID and NAME fields from the

2013_Gaz_ua_national layer. choose the us.tmax_nohads_ll_{YYYYMMDD}_float:

Band 1. Name the output vector layer as max_temparature_at_urban_locations.shp

97

The temperature at urban areas

98

Calculate the average temperature for each county in the United States

Add vector layer.

99

Make sure that both the raster file and the vector file are having same projection

system.

100

Processing> Toolbox> search for “Zonal Statistics ” and open it .

101

Select us.tmax_nohads_ll_20140525_float as the Raster layer and counties as the

vector layer containing the zones. Enter ZS_ as the Output column prefix. Click OK.

102

Note: You can have different zonal statistics.

103

Now is your turn, make the map that show the average temperature for each

county in the United States (like the below map)

104

Task 11- Playing with vector data and Geoprocessing tools

105

Open “states.shp”> select the states you want to combined to form a single feature.

Then: Geoprocessing tools> Dissolve

106

107

That should be what

you will get!

108

Geoprocessing tools> Dissolve (overlay layers such that output contains intersecting

and non-intersecting areas).

109

More reading on Geoprocessing tools : https://grindgis.com/software/qgis/basic-

editing-tools-in-qgis

Merged features with the Union

processing.

110

Task12- Merge two or more polygons

Open “states.shp” and select “the States” layer and then select the toggle edit

111

Select the features you want with the selection tool from toolbar (by area or single click)

and press ctrl key and click on the features.

112

From the Edit menu find merge selected features.

113

Click ok.

114

Please make a merged map like the one below.

115

Books to read!

116

Good Resources:

https://docs.qgis.org/2.18/en/docs/user_manual/processing/vect

or_menu.html

Free data:

https://freegisdata.rtwilson.com/

https://docs.qgis.org/2.8/it/docs/training_manual/

https://www.nab.vu/sites/default/files/documents/QGIS%2

0Training%20Manual.PDF

https://automating-gis-processes.github.io/2017/course-

info/course-info.html

117


Recommended