38
Introduction to Hierarchical Clustering Analysis Pengyu Hong 09/16/2005
| Date post: | 21-Dec-2015 |
| Category: |
Documents |
| View: | 218 times |
| Download: | 3 times |

Introduction to Hierarchical Clustering Analysis
Pengyu Hong09/16/2005
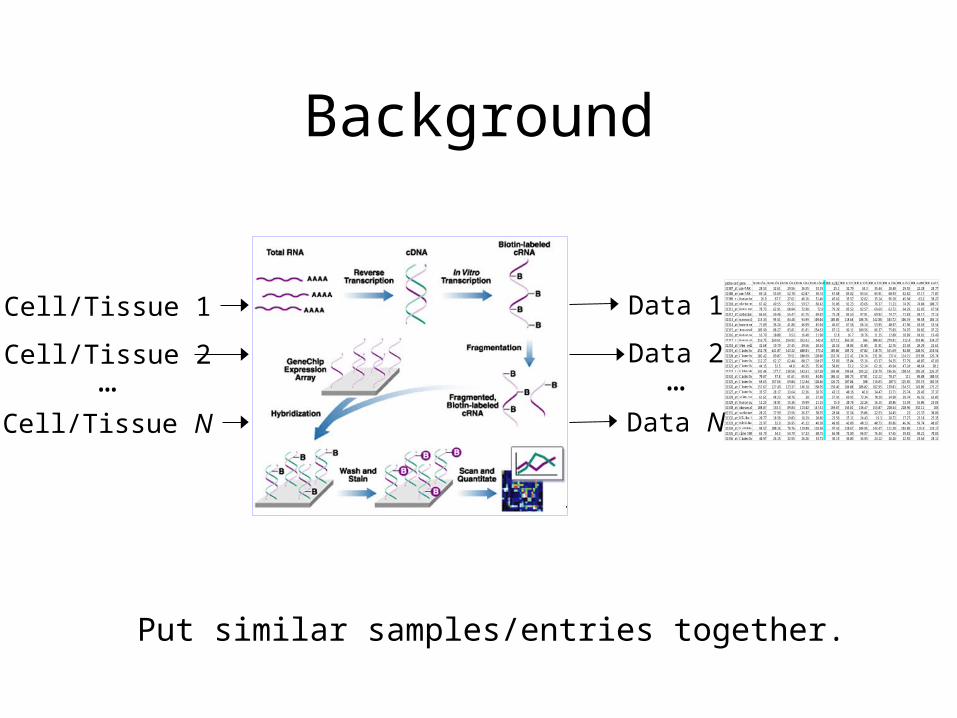
Background
Cell/Tissue 1
Cell/Tissue 2
Cell/Tissue N
…
Data 1
Data 2
Data N
…
probe set gene Normal m412aNormal m414aNormal m416aNormal m426aNormal m430aMM m282 MM m331aMM m332aMM m333aMM m334aMM m353aMM m408aMM m423a31307_at pre-T/NK cell associated protein28.53 32.61 29.56 36.55 33.19 25.1 32.79 34.3 35.44 28.48 29.55 22.28 28.7731308_at pre-T/NK cell associated protein69.14 53.69 52.78 62.07 58.74 67.88 85.82 83.54 85.91 60.93 62.82 47.17 77.0731309_r_atHuman breast cancer suppressor element Ishmael Upper CP1 mRNA, partial cds16.9 67.7 27.61 46.16 51.46 45.62 35.57 32.62 35.14 96.18 45.94 63.2 38.2731310_at glycine receptor, alpha 1 (startle disease/hyperekplexia, stiff man syndrome)67.42 49.55 55.51 59.57 68.42 91.06 91.23 83.66 76.37 71.23 74.95 74.04 100.7731311_at Homo sapiens cDNA FLJ40594 fis, clone THYMU2010671, highly similar to Homo sapiens T-cell receptor78.73 62.91 60.84 72.98 72.9 79.39 85.52 82.57 69.69 63.72 64.29 62.85 67.5831312_at potassium voltage-gated channel, Shab-related subfamily, member 266.65 59.46 55.47 61.75 69.92 75.28 85.53 97.91 69.92 74.77 71.83 58.17 72.1531313_at mannosyl (alpha-1,6-)-glycoprotein beta-1,6-N-acetyl-glucosaminyltransferase115.33 95.51 84.48 94.99 109.04 105.05 118.68 106.76 142.88 103.72 106.19 98.58 104.1331314_at bone morphogenetic protein 3 (osteogenic)71.89 36.24 41.86 46.99 45.94 46.67 67.56 66.14 53.95 40.97 47.96 43.63 53.5431315_at immunoglobulin lambda locus103.99 88.27 83.81 81.81 254.63 87.12 99.11 109.56 86.37 75.03 74.97 69.02 97.2231316_at Human vacuolar ATPase (isoform HO68) mRNA, complete cds16.79 10.08 9.53 16.48 11.98 12.8 16.7 18.76 11.25 12.09 18.89 10.81 19.4931317_r_atHuman unproductively rearranged Ig mu-chain mRNA V-region (VD), 5' end, clone mu-3A1A316.75 269.61 254.92 352.61 342.4 327.12 366.39 346 308.43 279.81 312.4 318.06 334.2731318_at Stem cell factor {alternatively spliced} [human, preimplantation embryos, blastocysts, mRNA Partial, 180 nt]32.68 19.79 27.45 29.56 28.34 26.55 38.04 41.05 31.91 22.76 23.58 28.29 22.6131319_at Cluster Incl. M20707:Human kappa-immunoglobulin germline pseudogene (Chr22.4) variable region (subgroup V kappa II) /cds=(0,320) /gb=M20707 /gi=185954 /ug=Hs.123030 /len=363252.78 441.07 143.32 400.01 373.4 105.06 105.72 87.02 110.75 161.69 84.88 240.91 210.5431320_at Cluster Incl. U18548:Human GPR12 G protein coupled-receptor gene, complete cds /cds=(15,1019) /gb=U18548 /gi=604499 /ug=Hs.123034 /len=1101101.42 89.07 79.51 100.69 120.06 116.74 121.41 134.74 131.36 137.4 114.15 119.89 126.7431321_at Cluster Incl. U41737:Human pancreatic beta cell growth factor (INGAP) mRNA, complete cds /cds=(5,520) /gb=U41737 /gi=1514681 /ug=Hs.123060 /len=586112.27 62.17 62.44 80.17 110.97 53.89 55.04 55.16 63.37 54.35 57.79 48.07 47.8931322_at Cluster Incl. X61079:Human mRNA for T cell receptor, clone IGRA24 /cds=(0,142) /gb=X61079 /gi=33521 /ug=Hs.123062 /len=23544.15 52.5 44.8 46.25 55.96 50.01 53.2 52.24 62.16 49.94 47.24 40.64 50.131323_r_atGlutamate transporter II variant B/HBGT IIB {5' region} [human, brain and spinal cord, mRNA Partial Mutant, 129 nt]141.44 177.7 138.58 142.61 167.28 169.49 199.64 185.22 218.79 196.56 150.14 185.24 226.3731324_at Cluster Incl. U82303:Homo sapiens unknown protein mRNA, partial cds /cds=(0,257) /gb=U82303 /gi=1938329 /ug=Hs.123080 /len=34470.87 57.8 61.61 65.93 84.05 106.41 106.73 87.01 112.12 78.47 111 89.08 100.5331325_at Cluster Incl. U82306:Homo sapiens unknown protein mRNA, partial cds /cds=(0,221) /gb=U82306 /gi=1938333 /ug=Hs.123081 /len=25368.63 167.66 69.04 112.84 120.46 126.72 107.04 100 116.83 207.5 125.65 155.19 102.5531326_at Cluster Incl. AF005081:Homo sapiens skin-specific protein (xp32) mRNA, partial cds /cds=(0,340) /gb=AF005081 /gi=2589189 /ug=Hs.123091 /len=416157.67 127.49 123.37 146.18 150.95 159.46 184.08 206.02 182.95 139.01 154.57 143.09 175.2731327_at Cluster Incl. AF015124:Homo sapiens IgG heavy chain variable region (Vh26) mRNA, partial cds /cds=(0,305) /gb=AF015124 /gi=2599349 /ug=Hs.123093 /len=34035.57 28.17 33.64 32.36 38.76 43.13 40.16 46.8 34.47 33.71 25.74 29.45 37.3731328_at solute carrier family 34 (sodium phosphate), member 161.61 48.23 50.76 58 57.58 57.91 69.91 72.34 70.29 54.98 59.74 45.55 63.0231329_at Human putative opioid receptor mRNA, complete cds12.23 18.91 15.36 19.99 21.15 15.9 20.76 22.26 16.15 28.86 13.59 16.06 23.8531330_at ribosomal protein S19108.87 133.3 89.84 113.02 147.61 169.87 156.81 136.47 153.07 220.54 220.96 332.11 18331331_at surfactant protein A binding protein28.21 17.99 23.56 26.37 30.35 28.84 31.54 35.06 22.53 24.45 23 21.37 30.8631332_at RIG-like 14-1 20.77 18.58 19.03 18.29 20.86 23.56 25.11 24.43 19.3 28.72 17.27 23.18 25.3531333_at tolloid-like 1 22.97 52.9 26.95 41.22 48.38 48.85 42.09 40.13 40.73 89.86 46.96 59.74 40.8731334_at G protein-coupled receptor 4598.57 100.16 78.76 119.09 118.58 97.42 110.67 104.95 143.47 111.28 102.88 115.9 133.1731335_at clone 1900 unknown protein65.79 54.3 54.79 57.23 60.75 66.98 72.89 86.97 76.34 57.65 59.83 49.21 70.8331336_at Cluster Incl. AC004076:Homo sapiens chromosome 19, cosmid R30217 /cds=(0,2075) /gb=AC004076 /gi=2822142 /ug=Hs.129709 /len=207640.97 26.15 32.55 26.26 33.73 36.15 36.03 34.93 24.12 26.26 22.55 23.64 28.11
Put similar samples/entries together.

Background Clustering is one of the most important unsupervised
learning processes that organizing objects into groups whose members are similar in some way.
Clustering finds structures in a collection of unlabeled data.
A cluster is a collection of objects which are similar between them and are dissimilar to the objects belonging to other clusters.

Motivation I
• Microarray data quality checking– Does replicates cluster together?– Does similar conditions, time points, tissue
types cluster together?

Data: Rat Schizophrenia Data (Allen Fienberg and Mayetri Gupta) Two time points:35 days (PD 35) and 60 days (PD60) past
birth. Two brain regions: Prefrontal cortex (PFC) and Nucleus
accumbens (NA). Two replicates (Samples are from the same set of tissue split
into different tubes so that replicates should be in close agreement.)
dChip was used to normalize the data and get model-based expression values, using the full PM/MM model.
How to read this clustering result?
Heat map
Link length
Sample IDs
Gene IDsClustering
results
Problem?

Motivation II
• Cluster genes Prediction of functions of unknown genes by known ones

Functional significant gene clusters
Two-way clustering
Gene clusters
Sample clusters

Motivation II
• Cluster genes Prediction of functions of unknown genes by known ones
• Cluster samples Discover clinical characteristics (e.g. survival, marker status) shared by samples.

Bhattacharjee et al. (2001) Human lung carcinomas mRNA expression profiling reveals distinct adenocarcinoma subclasses.
Proc. Natl. Acad. Sci. USA, Vol. 98, 13790-13795.

Motivation II
• Cluster genes Prediction of functions of unknown genes by known ones
• Cluster samples Discover clinical characteristics (e.g. survival, marker status) shared by samples
• Promoter analysis of commonly regulated genes
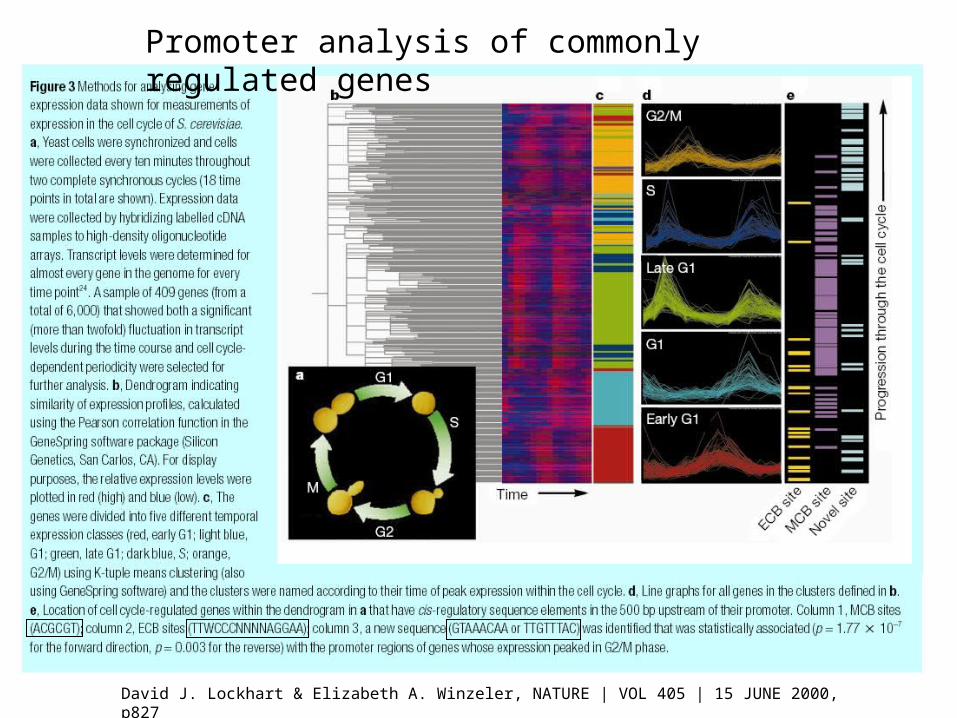
David J. Lockhart & Elizabeth A. Winzeler, NATURE | VOL 405 | 15 JUNE 2000, p827
Promoter analysis of commonly regulated genes

Clustering Algorithms
• Start with a collection of n objects each represented by a p–dimensional feature vector xi , i=1, …n.
• The goal is to divide these n objects into k clusters so that objects within a clusters are more “similar” than objects between clusters. k is usually unknown.
• Popular methods: hierarchical, k-means, SOM, mixture models, etc.

Hierarchical Clustering
DendrogramVenn Diagram of Clustered Data
From http://www.stat.unc.edu/postscript/papers/marron/Stat321FDA/RimaIzempresentation.ppt
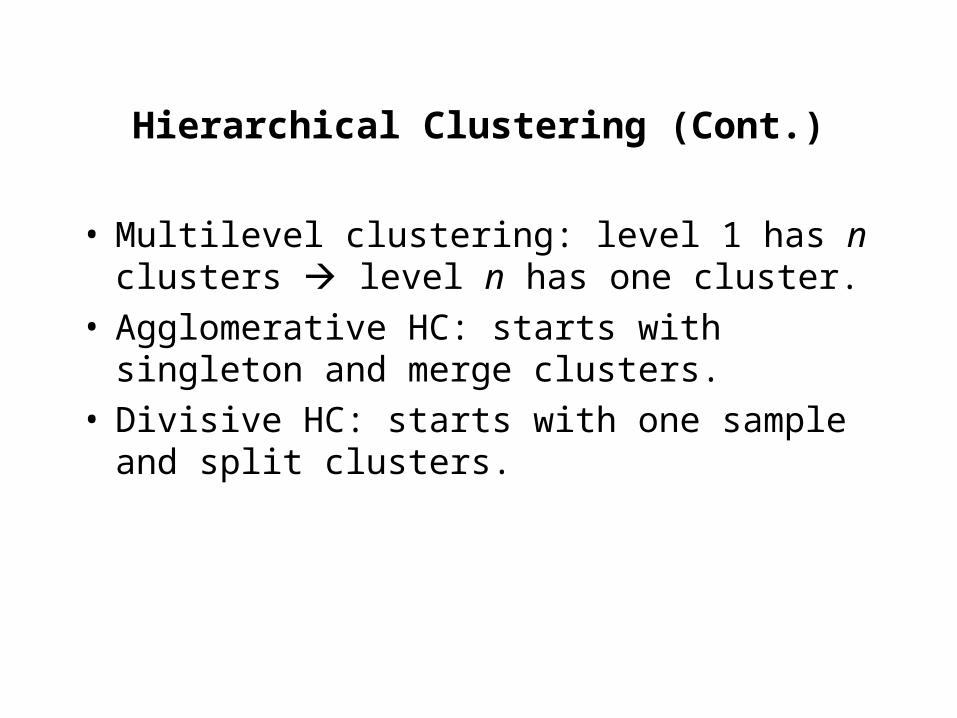
Hierarchical Clustering (Cont.)
• Multilevel clustering: level 1 has n clusters level n has one cluster.
• Agglomerative HC: starts with singleton and merge clusters.
• Divisive HC: starts with one sample and split clusters.

Nearest Neighbor Algorithm
• Nearest Neighbor Algorithm is an agglomerative approach (bottom-up).
• Starts with n nodes (n is the size of our sample), merges the 2 most similar nodes at each step, and stops when the desired number of clusters is reached.
From http://www.stat.unc.edu/postscript/papers/marron/Stat321FDA/RimaIzempresentation.ppt

Nearest Neighbor, Level 2, k = 7 clusters.
From http://www.stat.unc.edu/postscript/papers/marron/Stat321FDA/RimaIzempresentation.ppt

Nearest Neighbor, Level 3, k = 6 clusters.

Nearest Neighbor, Level 4, k = 5 clusters.
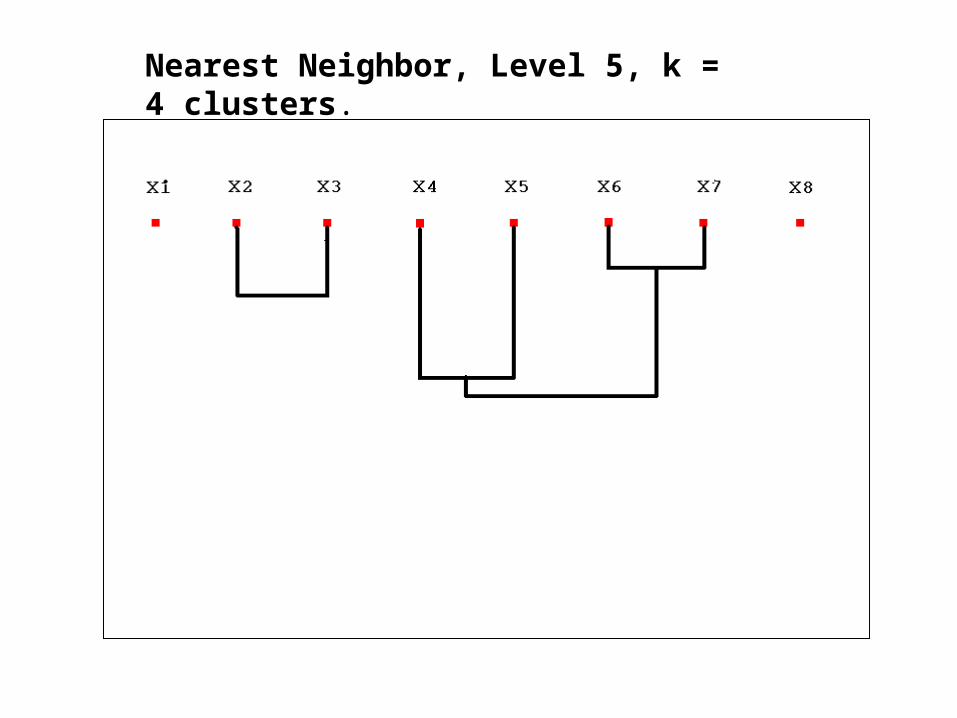
Nearest Neighbor, Level 5, k = 4 clusters.

Nearest Neighbor, Level 6, k = 3 clusters.
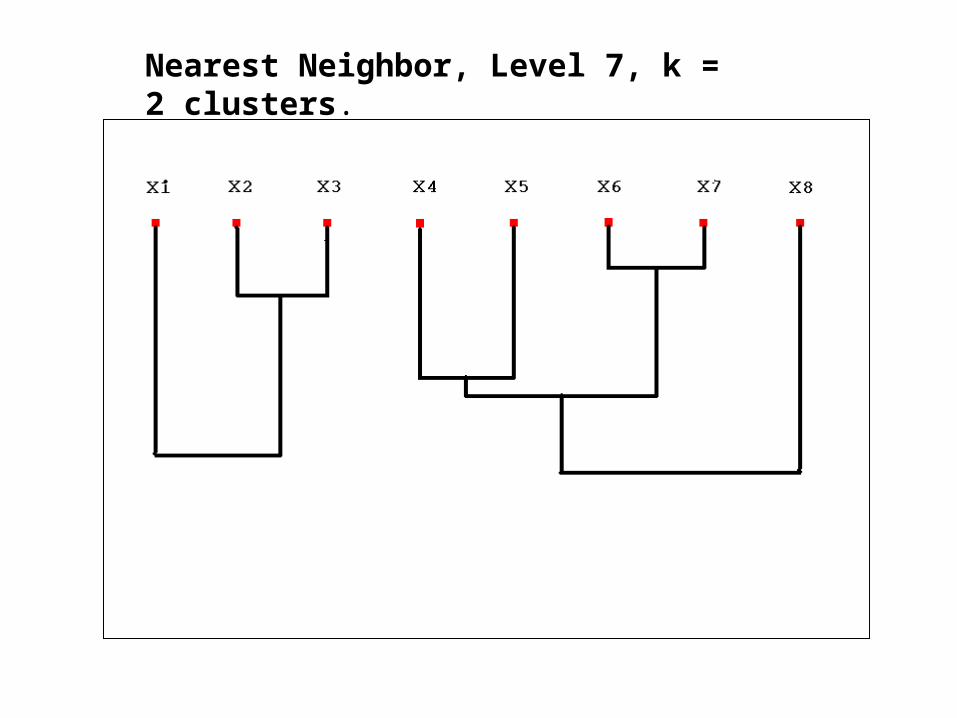
Nearest Neighbor, Level 7, k = 2 clusters.

Nearest Neighbor, Level 8, k = 1 cluster.

Calculate the similarity between all possible
combinations of two profiles
Two most similar clusters are grouped together to form
a new cluster
Calculate the similarity between the new cluster and
all remaining clusters.
Hierarchical Clustering
Keys• Similarity• Clustering
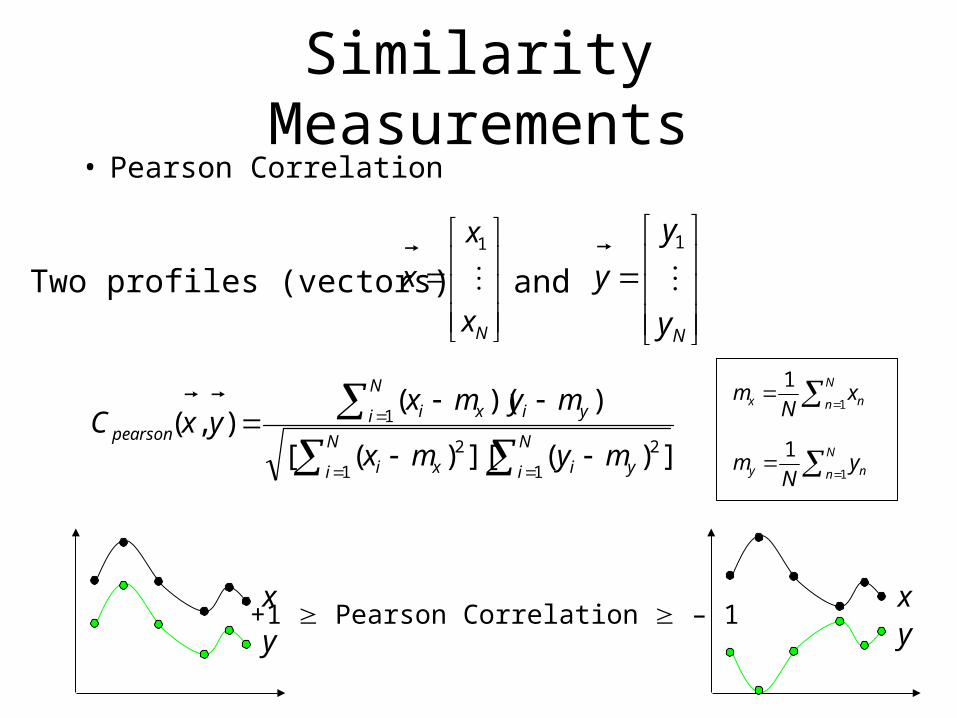
Similarity Measurements• Pearson Correlation
Nx
x
x 1
Two profiles (vectors) and
])(][)([
))((),(
1
2
1
2
1
N
i yi
N
i xi
N
i yixipearson
mymx
mymxyxC
Ny
y
y 1
x
y
x
y+1 Pearson Correlation – 1
N
n nx xN
m1
1
N
n ny yN
m1
1

Similarity Measurements
• Pearson Correlation: Trend Similarity
ab
5.02.0ac
1),( caCpearson
1),( baCpearson
1),( cbCpearson

Similarity Measurements
• Euclidean Distance
N
n nn yxyxd1
2)(),(
Nx
x
x 1
Ny
y
y 1

Similarity Measurements
• Euclidean Distance: Absolute difference
ab
5.02.0ac
5875.1),( cad
8025.2),( bad
2211.3),( cbd

Similarity Measurements• Cosine Correlation
Nx
x
x 1
yx
yxNyxC
N
i ii
1
cosine
1
),(
Ny
y
y 1
yx
+1 Cosine Correlation – 1 yx

Similarity Measurements
• Cosine Correlation: Trend + Mean Distance
ab
5.02.0ac
1),(inecos baC
9622.0),(inecos caC
9622.0),(inecos cbC

Similarity Measurementsab
5.02.0ac
1),(inecos baC
9622.0),(inecos caC
9622.0),(inecos cbC
5875.1),( cad
8025.2),( bad
2211.3),( cbd
1),( caCpearson
1),( baCpearson
1),( cbCpearson

Similarity Measurements
7544.0),(inecos baC
8092.0),(inecos caC
844.0),(inecos cbC
0255.0),( cad
0279.0),( bad
0236.0),( cbd
1244.0),( caCpearson
1175.0),( baCpearson
1779.0),( cbCpearson
Similar?

Clustering
C1
C2
C3
Merge which pair of clusters?
+
+
Clustering
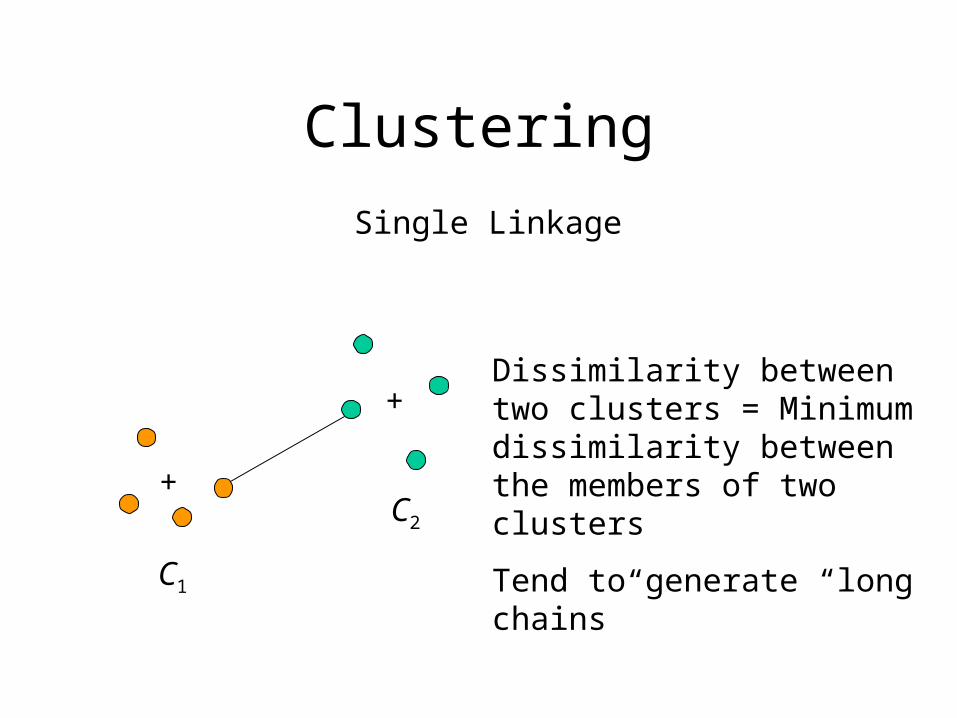
Single Linkage
C1
C2
Dissimilarity between two clusters = Minimum dissimilarity between the members of two clusters
Tend to generate “long chains”

+
+
Clustering
Complete Linkage
C1
C2
Dissimilarity between two clusters = Maximum dissimilarity between the members of two clusters
Tend to generate “clumps”

+
+
Clustering
Average Linkage
C1
C2
Dissimilarity between two clusters = Averaged distances of all pairs of objects (one from each cluster).
+
+
Clustering
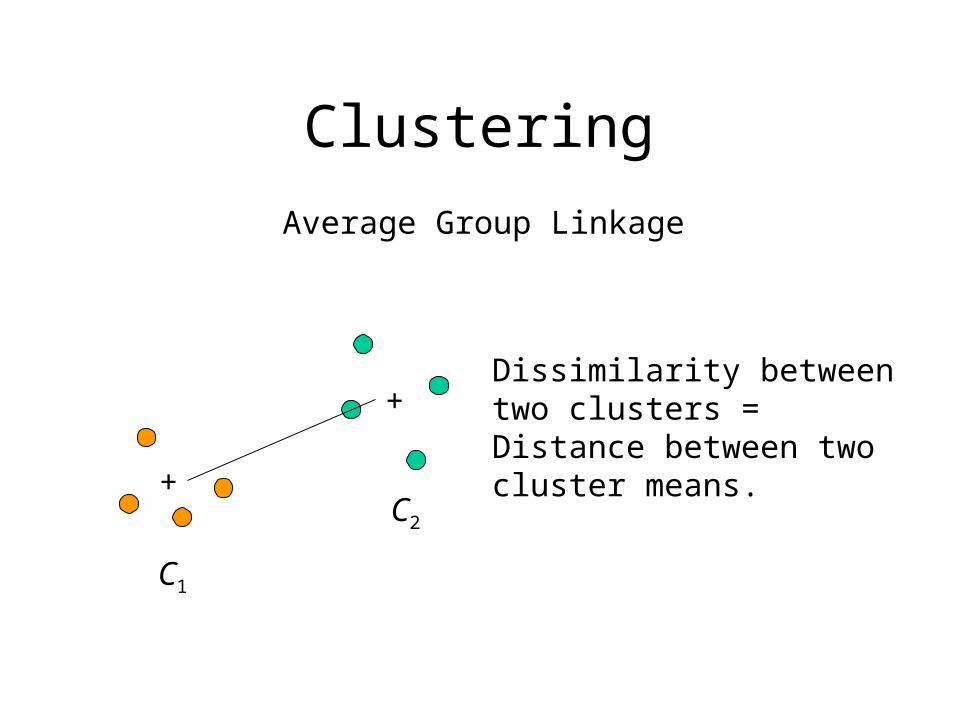
Average Group Linkage
C1
C2
Dissimilarity between two clusters = Distance between two cluster means.

Considerations
• What genes are used to cluster samples?– Expression variation
– Inherent variation
– Prior knowledge (irrelevant genes)
– Etc.

Take Home Questions
• Which clustering method is better?
• How to cut the clustering tree to get relatively tight clusters of genes or samples?


