79
Introduction to Medical Decision Making and Decision Analysis Gillian D. Sanders Ph.D. Duke Clinical Research Institute Duke University July 18, 2007
| Date post: | 17-Dec-2015 |
| Category: |
Documents |
| Upload: | tamsin-adams |
| View: | 219 times |
| Download: | 2 times |

Introduction to Medical Decision Making
and Decision Analysis
Gillian D. Sanders Ph.D.
Duke Clinical Research InstituteDuke UniversityJuly 18, 2007

Outline
• Decision analysis» Components of decision analysis» Building a tree: Example» Sensitivity analyses
• Markov models» Background» Constructing the model» Example» Monte Carlo simulations

Decision Analysis
• Decision analysis is a quantitative, probabilistic method for modeling problems under situations of uncertainty

Making a Decision
• We make a decision when we irreversibly allocate resources.
• We typically use the following steps:» gather information» assess consequences of the alternatives» take an action
• Goal of decision analysis is to clarify the dynamics and trade-offs involved in selecting one strategy from a set of alternatives
• Usually, in everyday decision-making, we do not take the time to thoroughly analyze the decision
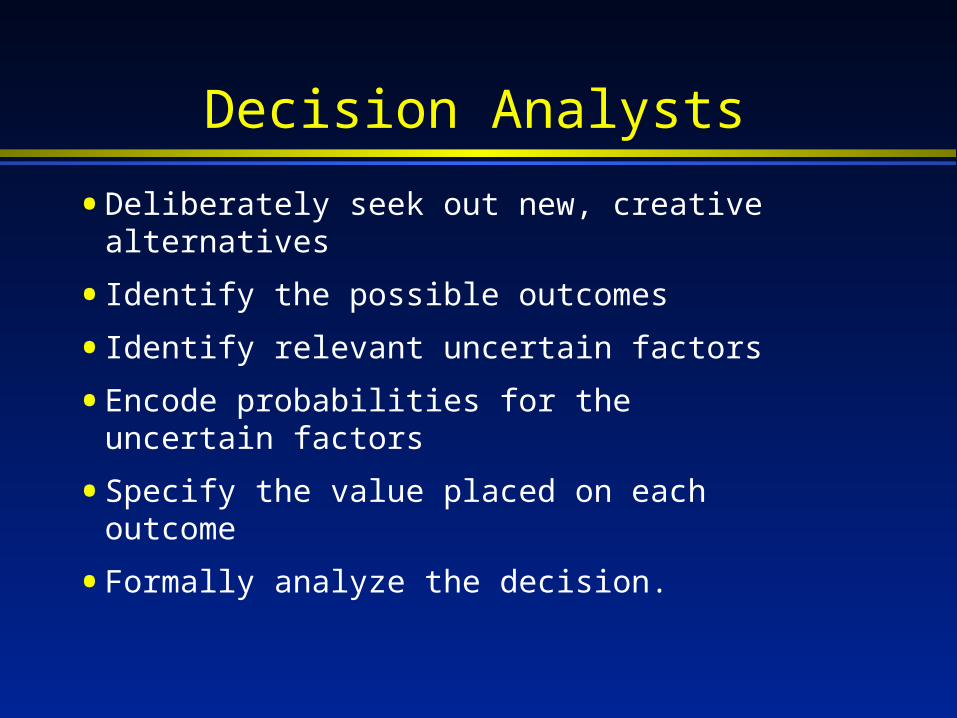
Decision Analysts
• Deliberately seek out new, creative alternatives
• Identify the possible outcomes
• Identify relevant uncertain factors
• Encode probabilities for the uncertain factors
• Specify the value placed on each outcome
• Formally analyze the decision.

• Complexity -- large number of factors, multiple attributes, more than one decision-maker
• Time factor -- static (no change over time) vs. dynamic (time-dependent)
• Uncertainty -- deterministic vs. probabilistic. Deterministic means there is no uncertainty and the problem can be solved with a set of precise equations
Decisions Vary in Degree Of:
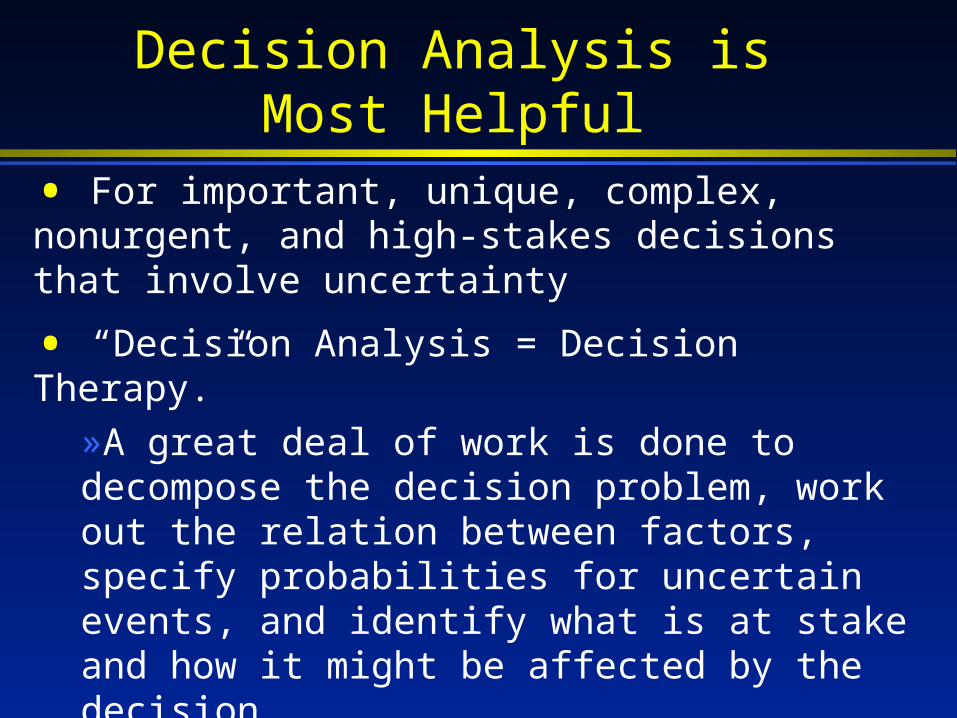
• For important, unique, complex, nonurgent, and high-stakes decisions that involve uncertainty
• “Decision Analysis = Decision Therapy.” »A great deal of work is done to decompose the decision problem, work out the relation between factors, specify probabilities for uncertain events, and identify what is at stake and how it might be affected by the decision »Constructing the tree, even before “solving” it mathematically, can provide important insights.
Decision Analysis is Most Helpful

Cost-Effectiveness Analyses
• Cost-effectiveness analysis (CEA)is a methodology for evaluating the tradeoffs between health benefits and costs
• CEA is aid to decision making, not a complete resource allocation procedure

Cost-Effectiveness Ratio
Compares a specific (new) intervention to a stated alternative (old) intervention
Costnew – Costold / Benefitnew – Benefitold
Incremental resources
required by the intervention
Incremental health effects gained by
using the intervention
Decision Model
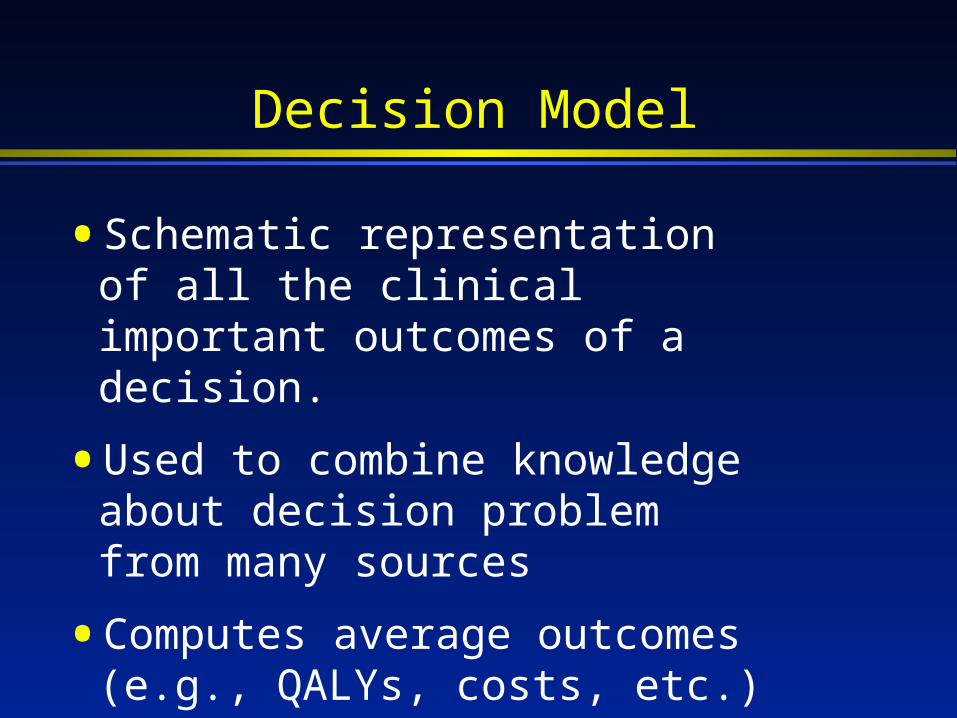
• Schematic representation of all the clinical important outcomes of a decision.
• Used to combine knowledge about decision problem from many sources
• Computes average outcomes (e.g., QALYs, costs, etc.) from decisions.
Elements of Decision Analysis
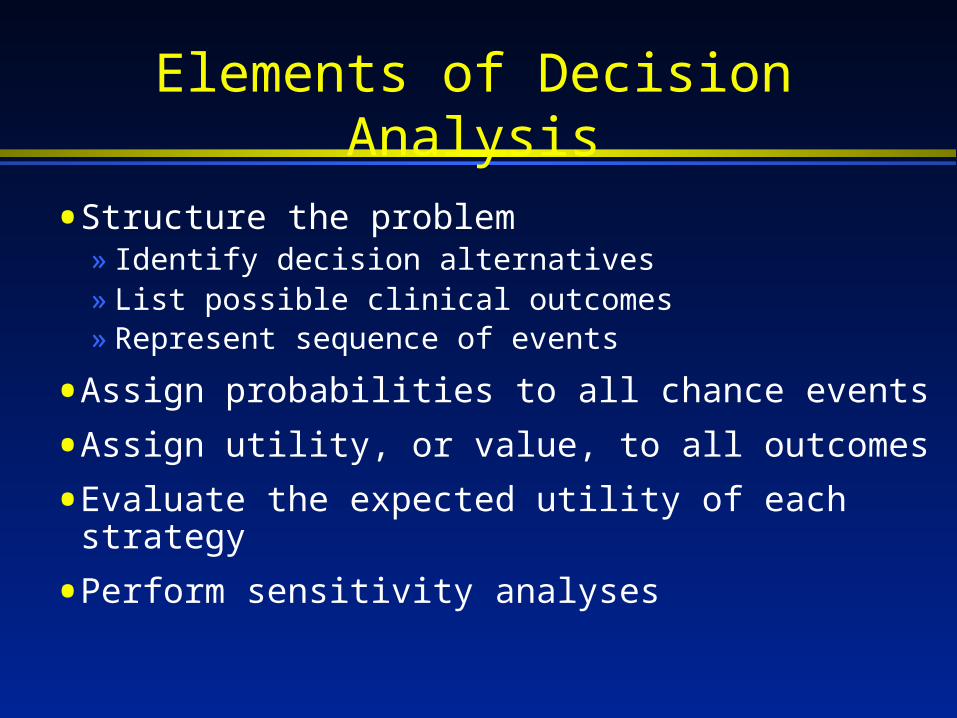
• Structure the problem» Identify decision alternatives» List possible clinical outcomes» Represent sequence of events
• Assign probabilities to all chance events
• Assign utility, or value, to all outcomes
• Evaluate the expected utility of each strategy
• Perform sensitivity analyses
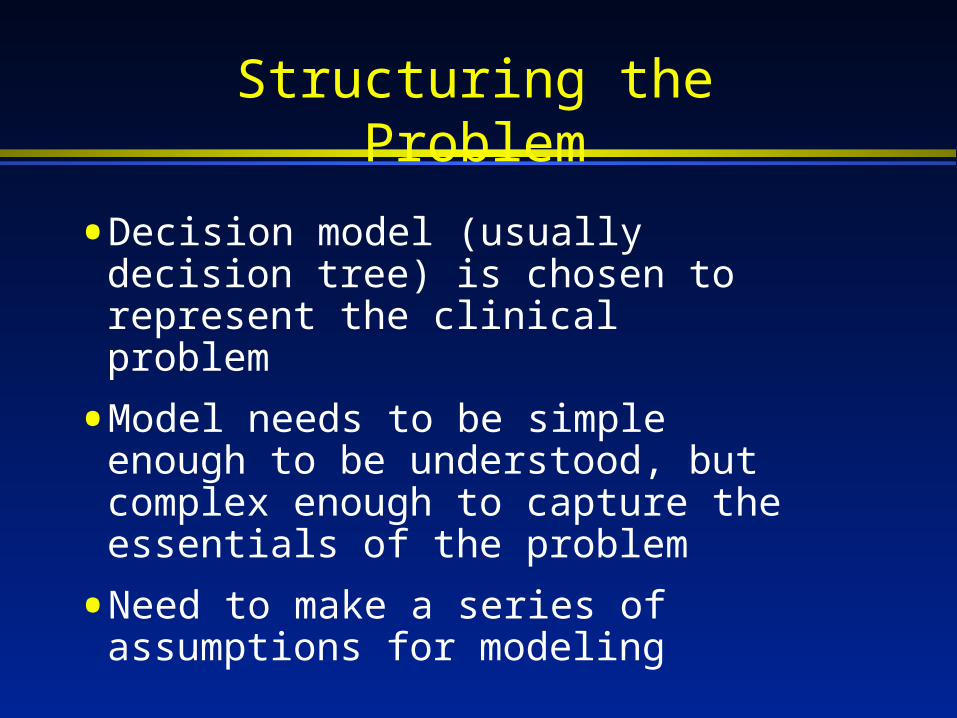
Structuring the Problem
• Decision model (usually decision tree) is chosen to represent the clinical problem
• Model needs to be simple enough to be understood, but complex enough to capture the essentials of the problem
• Need to make a series of assumptions for modeling
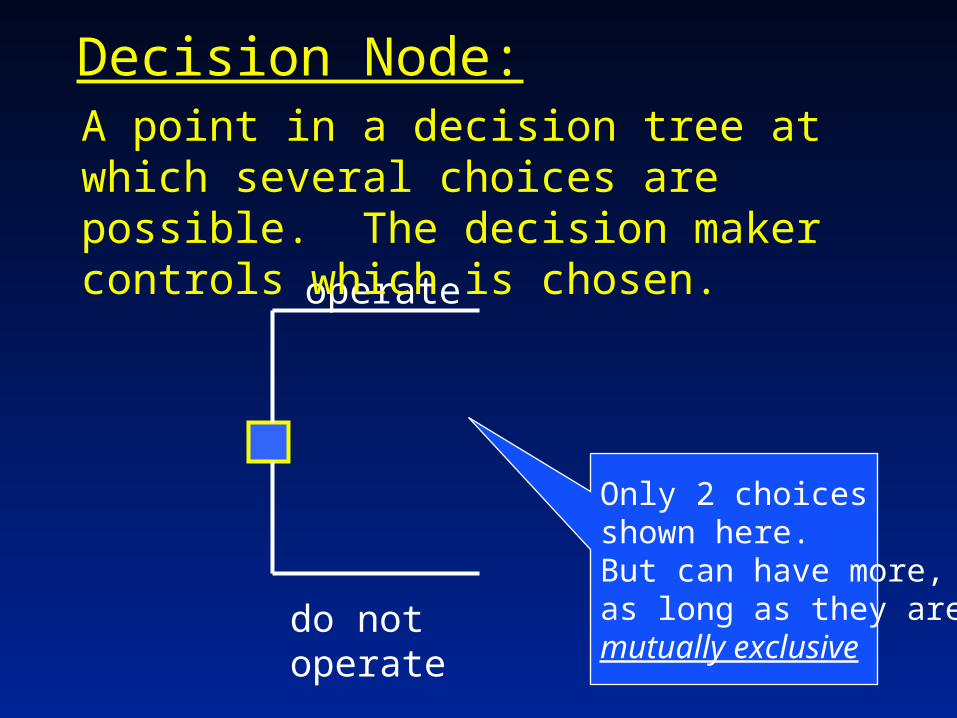
Decision Node:
operate
do not operate
A point in a decision tree at which several choices are possible. The decision maker controls which is chosen.
Only 2 choices shown here.But can have more,as long as they aremutually exclusive
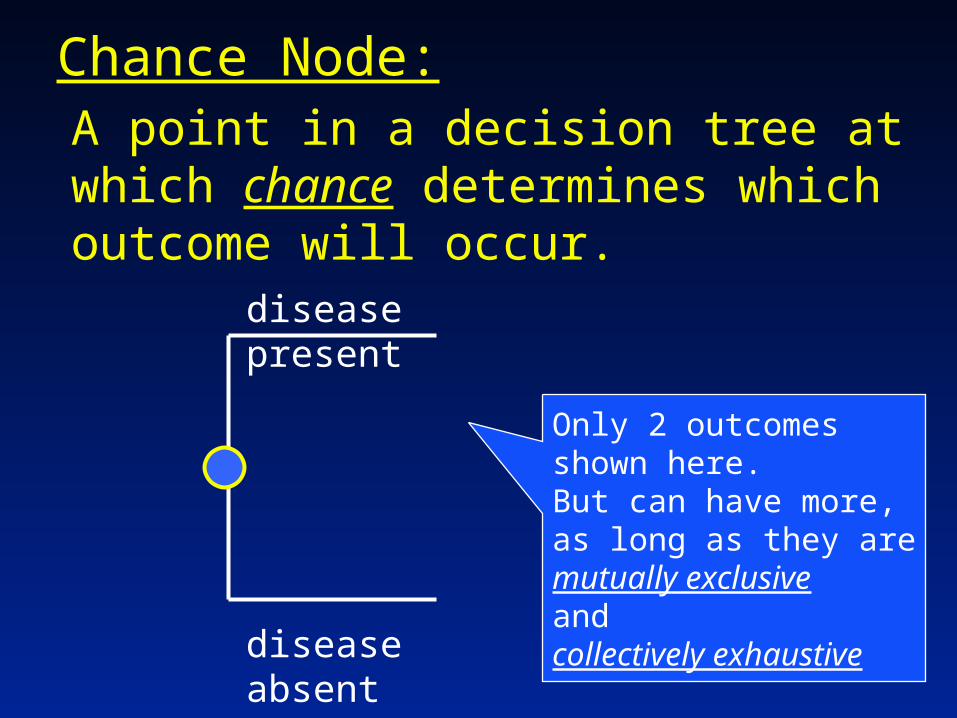
Chance Node:A point in a decision tree at which chance determines which outcome will occur.
disease present
disease absent
Only 2 outcomes shown here.But can have more,as long as they aremutually exclusiveandcollectively exhaustive

Some Definitions
• Mutually exclusive» The intersection of the events is empty» One (and only one) of the events must
occur
• Collectively exhaustive» Events taken together make up the entire
outcome space» At least one of the events must occur

Terminal Node:Final outcome state associated with each possible pathway
Patient curedSome measure of valueor worth needs to be applied to the terminalnodes (eg. LYs, QALYs, costs)
20 LY20 LY

Outline
• Decision analysis» Components of decision analysis» Building a tree: Example» Sensitivity analyses
• Markov models» Background» Constructing the model» Example» Monte Carlo simulations
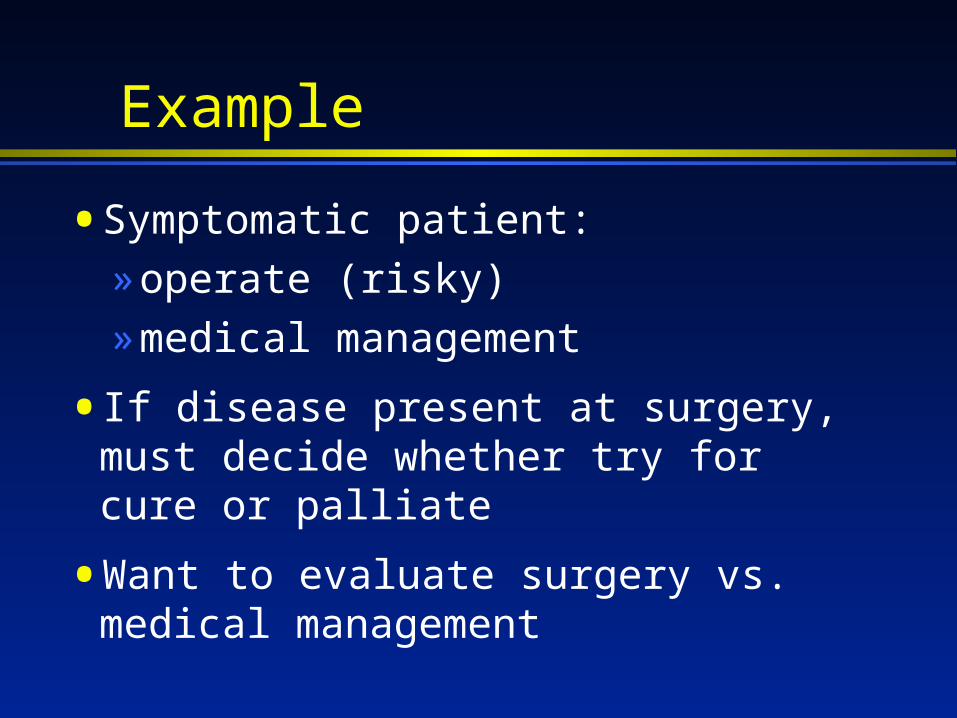
Example
• Symptomatic patient:
» operate (risky)
» medical management
• If disease present at surgery, must decide whether try for cure or palliate
• Want to evaluate surgery vs. medical management

surgery
drug
disease present
diseaseabsent
operativedeath
survive
diseaseabsent
diseasepresent
no cure
cure
survive
operativedeath
cure
no cure
no cure
curesurvive
operativedeath
trycure
palliate
surgery
drug
disease present
diseaseabsent
operativedeath
survive
diseaseabsent
diseasepresent
no cure
cure
survive
operativedeath
cure
no cure
no cure
curesurvive
operativedeath
trycure
palliate
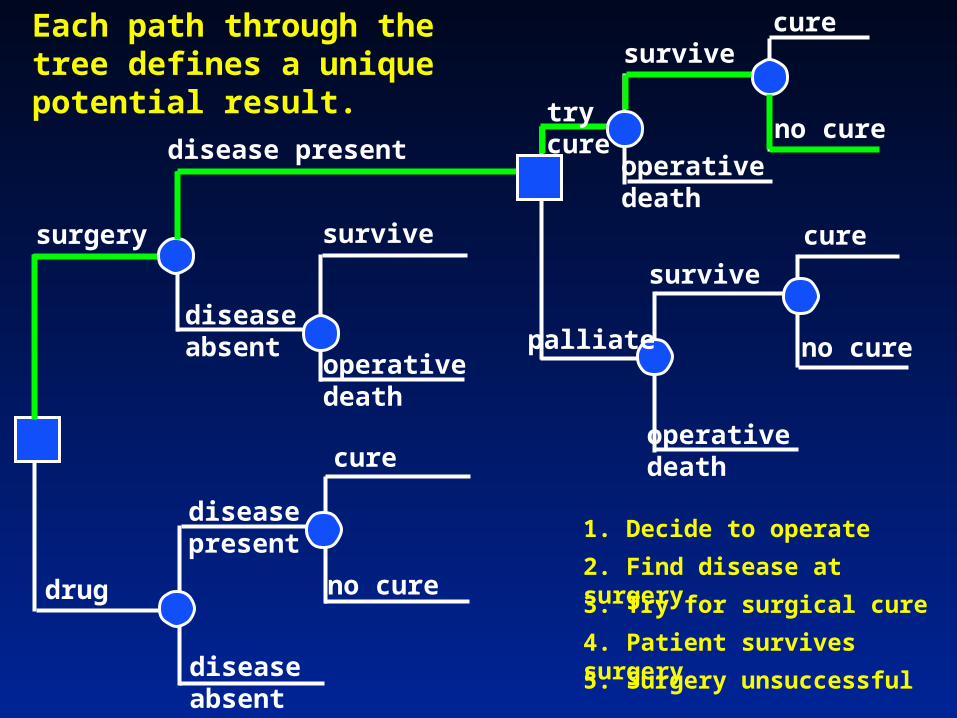
Each path through the tree defines a unique potential result.
1. Decide to operate
2. Find disease at surgery
3. Try for surgical cure
4. Patient survives surgery
5. Surgery unsuccessful

surgery
drug
disease present
diseaseabsent
operativedeath
survive
diseaseabsent
diseasepresent
no cure
cure
survive
operativedeath
cure
no cure
no cure
curesurvive
operativedeath
trycure
palliate
Insert probabilities at each chance node. Sources include data from literature/studies, modeling, expert judgment...
10%
90%
10%
90%
10%
90%
10%
90%
90%
10%
99%
1%
90%
10%
98%
2%

surgery
drug
disease present
diseaseabsent
operativedeath
survive
diseaseabsent
diseasepresent
no cure
cure
survive
operativedeath
cure
no cure
no cure
curesurvive
operativedeath
trycure
palliate
Assign a value to the outcome at each endpoint
10%
90%
10%
90%
10%
90%
10%
90%
90%
10%
99%
1%
90%
10%
98%
2%
AVERAGE OUTCOMES
Operative death: 0 life years
Death from progressionof the disease: 2 life years
Cure: 20 life years20 LY20 LY
20 LY20 LY
20 LY20 LY 20 LY20 LY
20 LY20 LY
2 LY2 LY
2 LY2 LY
2 LY2 LY
0 LY
0 LY
0 LY
surgery
drug
disease present
diseaseabsent
operativedeath
survive
diseaseabsent
diseasepresent
no cure
cure
survive
operativedeath
cure
no cure
no cure
curesurvive
operativedeath
trycure
palliate
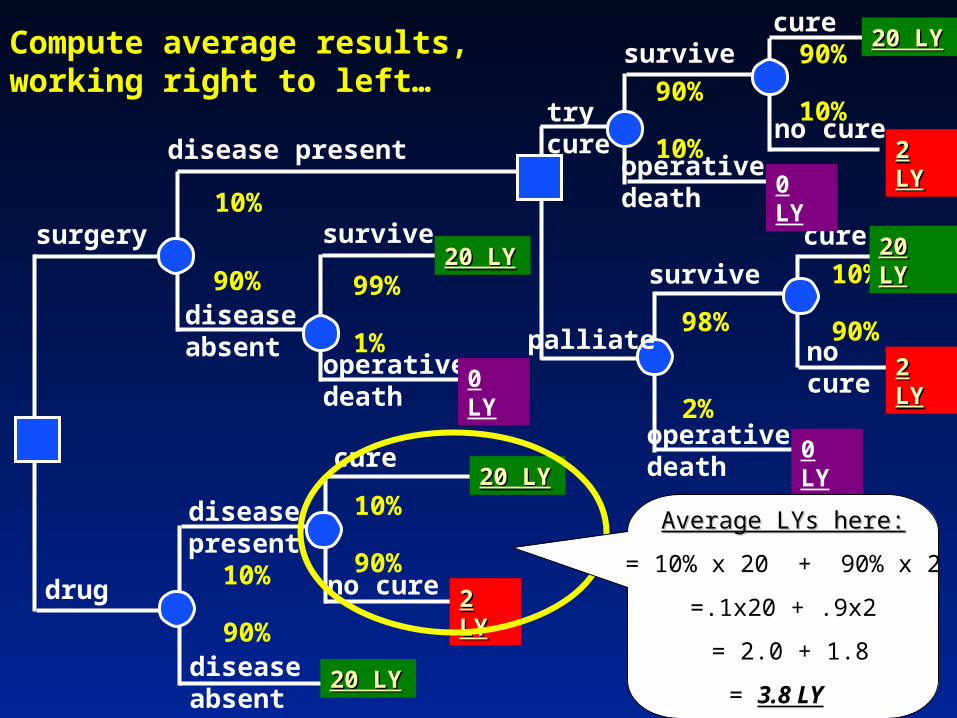
Compute average results, working right to left…
10%
90%
10%
90%
10%
90%
10%
90%
90%
10%
99%
1%
90%
10%
98%
2%
20 LY20 LY
20 LY20 LY
20 LY20 LY 20 LY20 LY
20 LY20 LY
2 LY2 LY
2 LY2 LY
2 LY2 LY
0 LY
0 LY
0 LY
Average LYs here:Average LYs here:
= 10% x 20 + 90% x 2
=.1x20 + .9x2
= 2.0 + 1.8
= 3.8 LY
surgery
drug
disease present
diseaseabsent
operativedeath
survive
diseaseabsent
diseasepresent
survive
operativedeath
cure
no cure
no cure
curesurvive
operativedeath
trycure
palliate
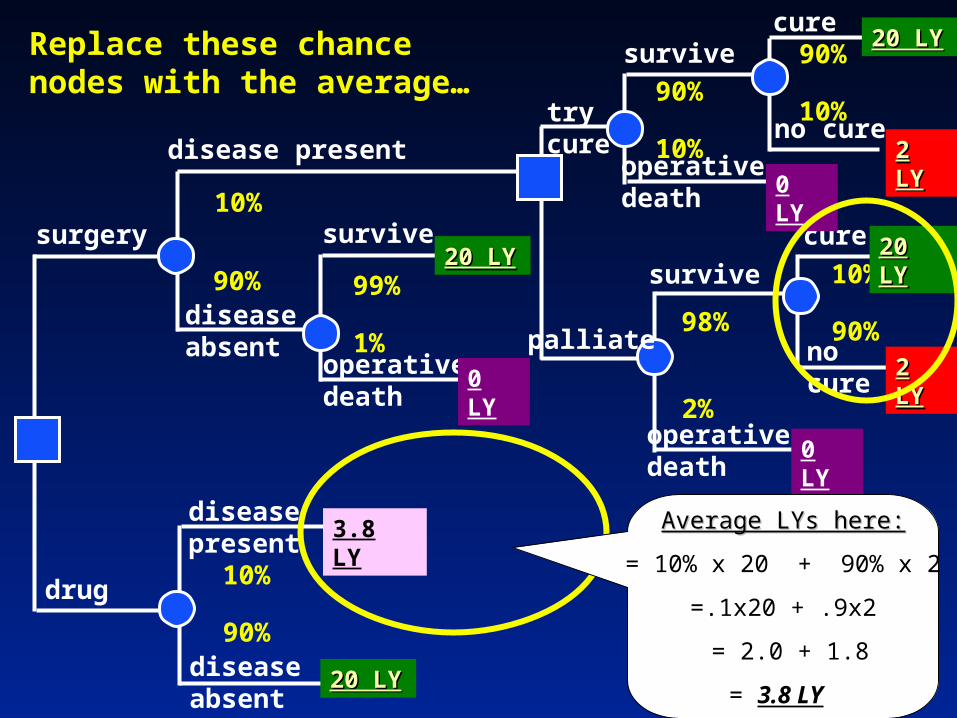
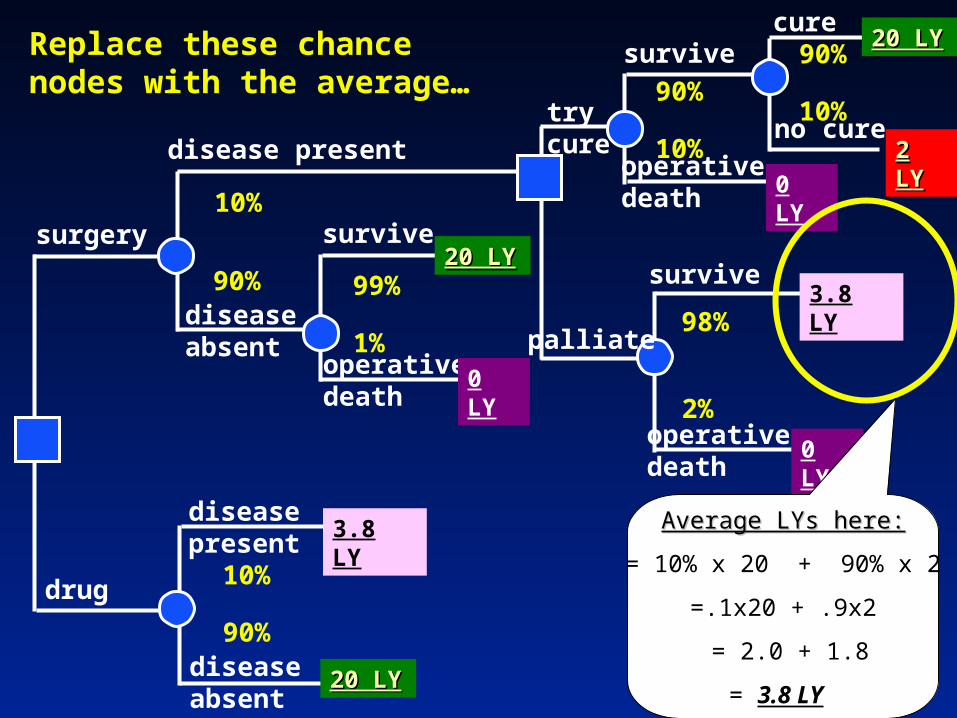
Replace these chance nodes with the average…
10%
90%
10%
90% 10%
90%
90%
10%
99%
1%
90%
10%
98%
2%
20 LY20 LY
20 LY20 LY 20 LY20 LY
20 LY20 LY
2 LY2 LY
2 LY2 LY
0 LY
0 LY
0 LY
Average LYs here:Average LYs here:
= 10% x 20 + 90% x 2
=.1x20 + .9x2
= 2.0 + 1.8
= 3.8 LY
3.8 LY
surgery
drug
disease present
diseaseabsent
operativedeath
survive
diseaseabsent
diseasepresent
survive
operativedeath
no cure
curesurvive
operativedeath
trycure
palliate
Replace these chance nodes with the average…
10%
90%
10%
90%
90%
10%
99%
1%
90%
10%
98%
2%
20 LY20 LY
20 LY20 LY
20 LY20 LY
2 LY2 LY
0 LY
0 LY
0 LY
Average LYs here:Average LYs here:
= 10% x 20 + 90% x 2
=.1x20 + .9x2
= 2.0 + 1.8
= 3.8 LY
3.8 LY
3.8 LY
surgery
drug
disease present
diseaseabsent
operativedeath
survive
diseaseabsent
diseasepresent
survive
operativedeath
no cure
curesurvive
operativedeath
trycure
palliate
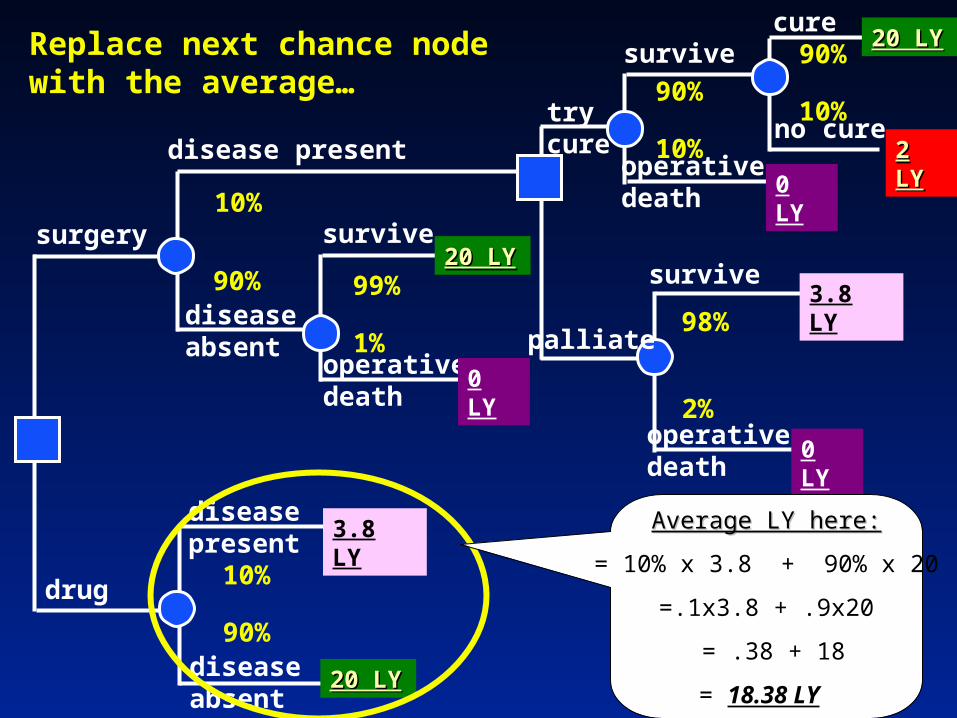
Replace next chance node with the average…
10%
90%
10%
90%
90%
10%
99%
1%
90%
10%
98%
2%
20 LY20 LY
20 LY20 LY
20 LY20 LY
2 LY2 LY
0 LY
0 LY
0 LY
3.8 LY
3.8 LY
Average LY here:Average LY here:
= 10% x 3.8 + 90% x 20
=.1x3.8 + .9x20
= .38 + 18
= 18.38 LY

surgery
drug
disease present
diseaseabsent
operativedeath
survive
survive
operativedeath
no cure
curesurvive
operativedeath
trycure
palliate
Replace next chance node with the average…
10%
90%
90%
10%
99%
1%
90%
10%
98%
2%
20 LY20 LY
20 LY20 LY
2 LY2 LY
0 LY
0 LY
0 LY
3.8 LY
Average LY here:Average LY here:
= 10% x 3.8 + 90% x 20
=.1x3.8 + .9x20
= .38 + 18
= 18.38 LY
18.38 LY

surgery
drug
disease present
diseaseabsent
operativedeath
survive
survive
operativedeath
no cure
curesurvive
operativedeath
trycure
palliate
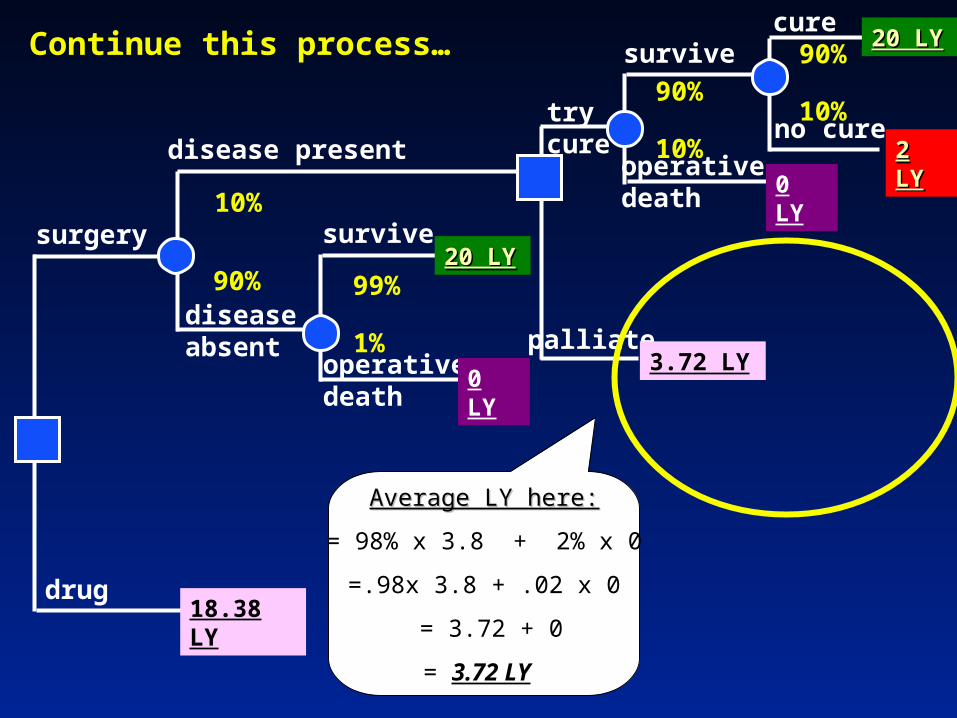
Continue this process…
10%
90%
90%
10%
99%
1%
90%
10%
98%
2%
20 LY20 LY
20 LY20 LY
2 LY2 LY
0 LY
0 LY
0 LY
3.8 LY
18.38 LY
Average LY here:Average LY here:
= 98% x 3.8 + 2% x 0
=.98x 3.8 + .02 x 0
= 3.72 + 0
= 3.72 LY
surgery
drug
disease present
diseaseabsent
operativedeath
survive
no cure
curesurvive
operativedeath
trycure
palliate
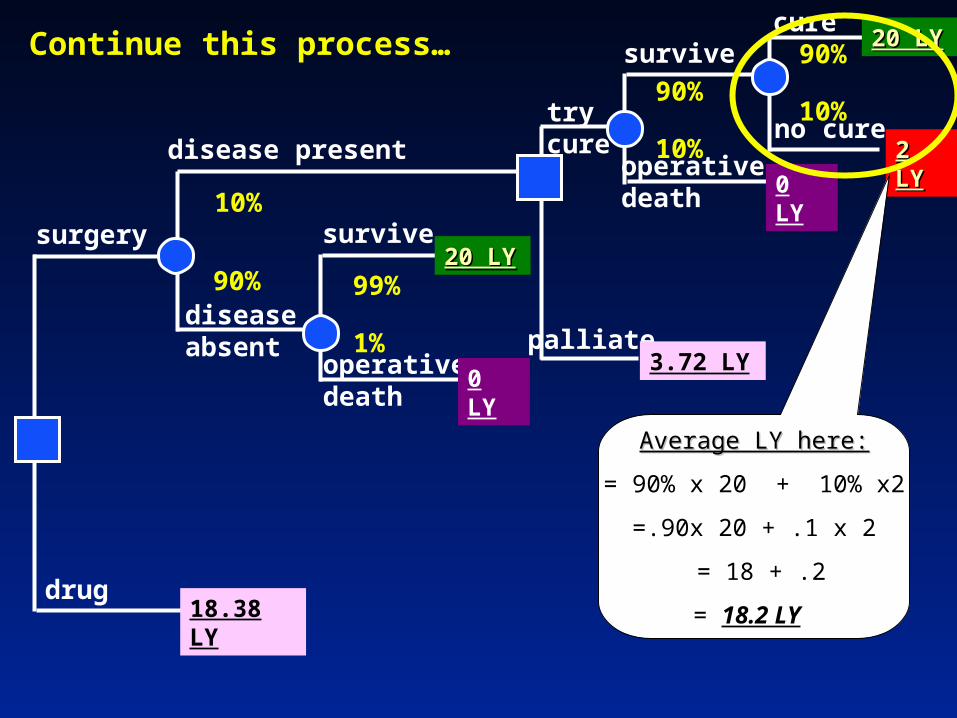
Continue this process…
10%
90%
90%
10%
99%
1%
90%
10%
20 LY20 LY
20 LY20 LY
2 LY2 LY
0 LY
0 LY
18.38 LY
Average LY here:Average LY here:
= 98% x 3.8 + 2% x 0
=.98x 3.8 + .02 x 0
= 3.72 + 0
= 3.72 LY
3.72 LY
surgery
drug
disease present
diseaseabsent
operativedeath
survive
no cure
curesurvive
operativedeath
trycure
palliate
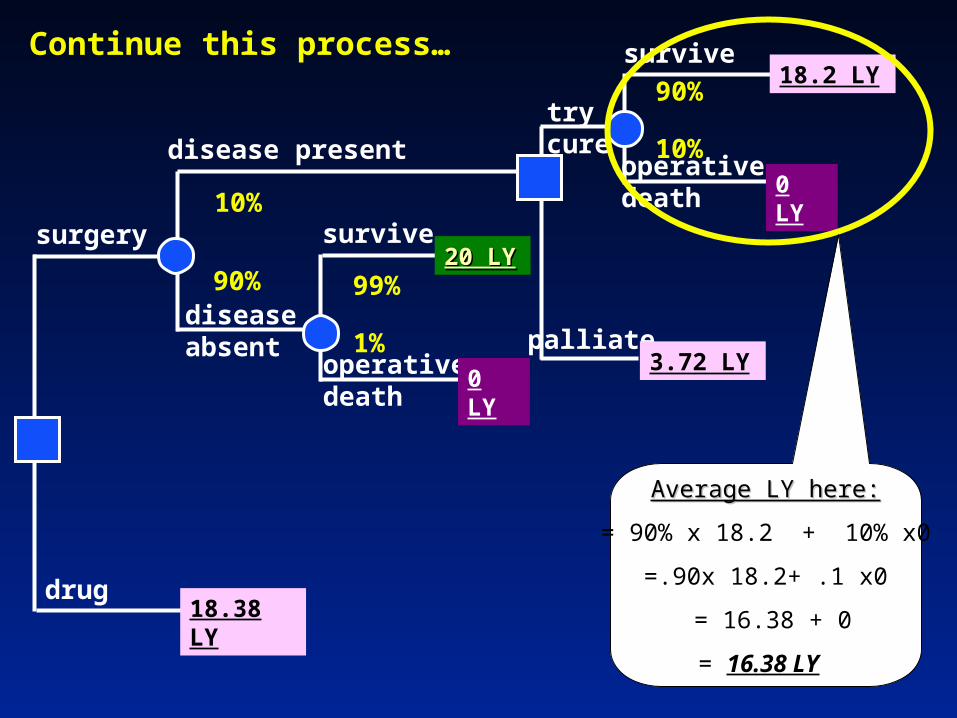
Continue this process…
10%
90%
90%
10%
99%
1%
90%
10%
20 LY20 LY
20 LY20 LY
2 LY2 LY
0 LY
0 LY
18.38 LY
3.72 LY
Average LY here:Average LY here:
= 90% x 20 + 10% x2
=.90x 20 + .1 x 2
= 18 + .2
= 18.2 LY

surgery
drug
disease present
diseaseabsent
operativedeath
survive
survive
operativedeath
trycure
palliate
Continue this process…
10%
90% 99%
1%
90%
10%
20 LY20 LY
0 LY
0 LY
18.38 LY
3.72 LY
Average LY here:Average LY here:
= 90% x 20 + 10% x2
=.90x 20 + .1 x 2
= 18 + .2
= 18.2 LY
18.2 LY
surgery
drug
disease present
diseaseabsent
operativedeath
survive
survive
operativedeath
trycure
palliate
Continue this process…
10%
90% 99%
1%
90%
10%
20 LY20 LY
0 LY
0 LY
18.38 LY
3.72 LY
18.2 LY
Average LY here:Average LY here:
= 90% x 18.2 + 10% x0
=.90x 18.2+ .1 x0
= 16.38 + 0
= 16.38 LY

surgery
drug
disease present
diseaseabsent
operativedeath
survive
trycure
palliate
Continue this process…
10%
90% 99%
1%
20 LY20 LY
0 LY
18.38 LY
3.72 LY
Average LY here:Average LY here:
= 90% x 18.2 + 10% x0
=.90x 18.2+ .1 x0
= 16.38 + 0
= 16.38 LY
16.38 LY
surgery
drug
disease present
diseaseabsent
operativedeath
survive
trycure
palliate
10%
90% 99%
1%
20 LY20 LY
0 LY
18.38 LY
3.72 LY
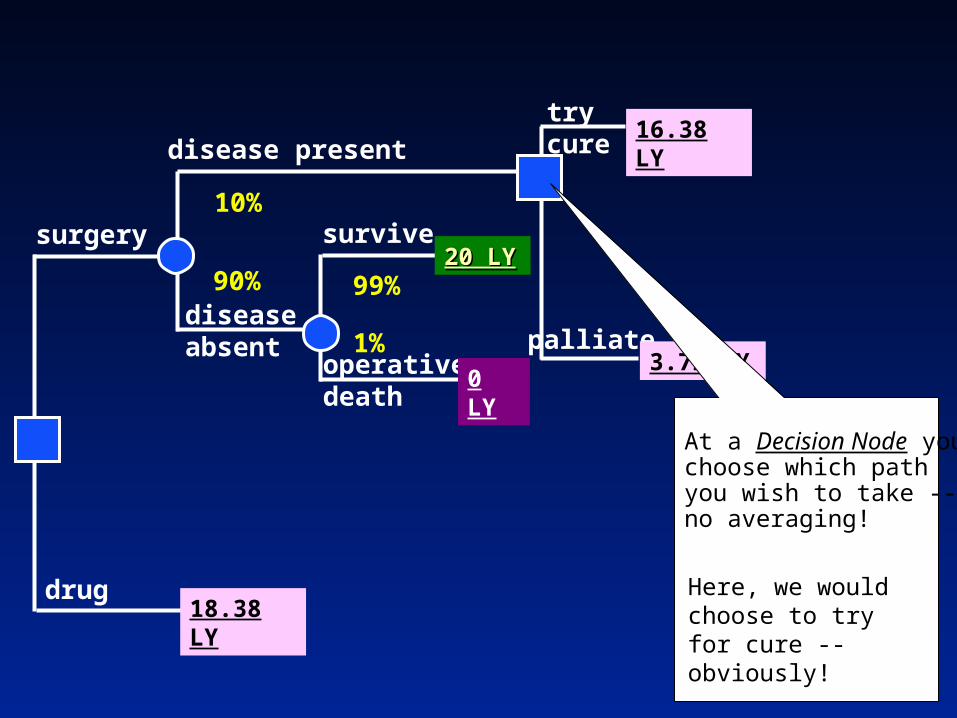
16.38 LY
At a Decision Node youchoose which pathyou wish to take -- no averaging!
Here, we would choose to try for cure -- obviously!

surgery
drug
disease present
diseaseabsent
operativedeath
survive
trycure10%
90% 99%
1%
20 LY20 LY
0 LY
18.38 LY
16.38 LY

surgery
drug
disease present
diseaseabsent
operativedeath
survive
trycure10%
90% 99%
1%
20 LY20 LY
0 LY
18.38 LY
16.38 LY
Average LY here:Average LY here:
= 99% x 20 + 1% x0
=.99x 20+ .01 x0
= 19.8 + 0
= 19.8 LY
Continue working from right to left, averaging out at Continue working from right to left, averaging out at Chance Nodes, and choosing best branch at Decision Chance Nodes, and choosing best branch at Decision Nodes...Nodes...

surgery
drug
disease present
diseaseabsent
trycure10%
90%
18.38 LY
16.38 LY
Average LY here:Average LY here:
= 99% x 20 + 1% x0
=.99x 20+ .01 x0
= 19.8 + 0
= 19.8 LY
19.8 LY
surgery
drug
disease present
diseaseabsent
trycure10%
90%
18.38 LY
16.38 LY
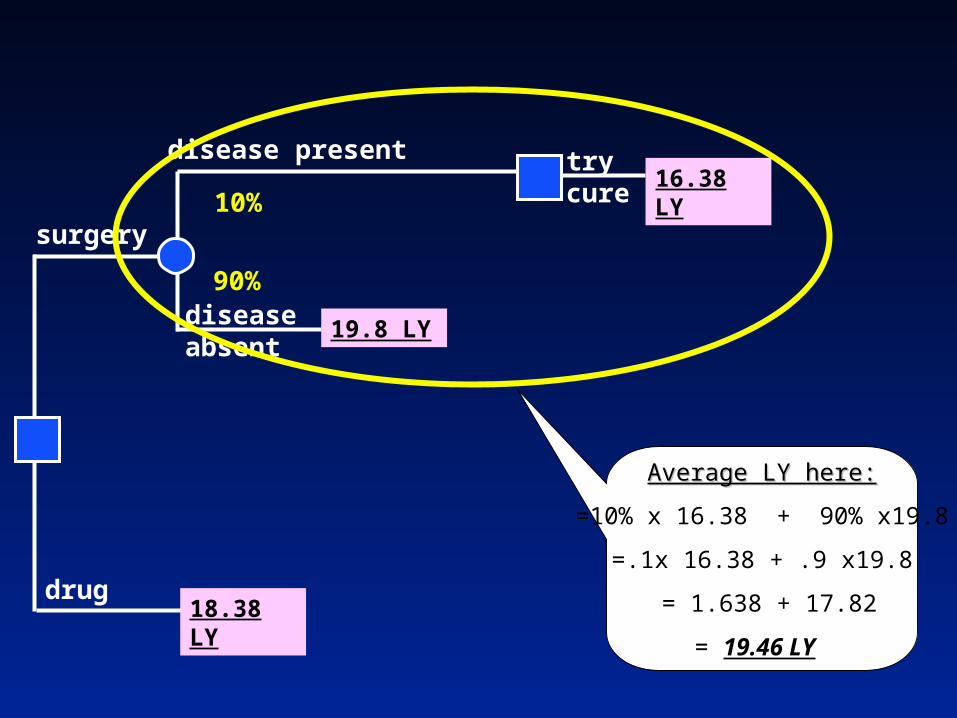
19.8 LY
Average LY here:Average LY here:
=10% x 16.38 + 90% x19.8
=.1x 16.38 + .9 x19.8
= 1.638 + 17.82
= 19.46 LY
surgery
drug18.38 LY
Average LY here:Average LY here:
=10% x 16.38 + 90% x19.8
=.1x 16.38 + .9 x19.8
= 1.638 + 17.82
= 19.46 LY
19.46 LY

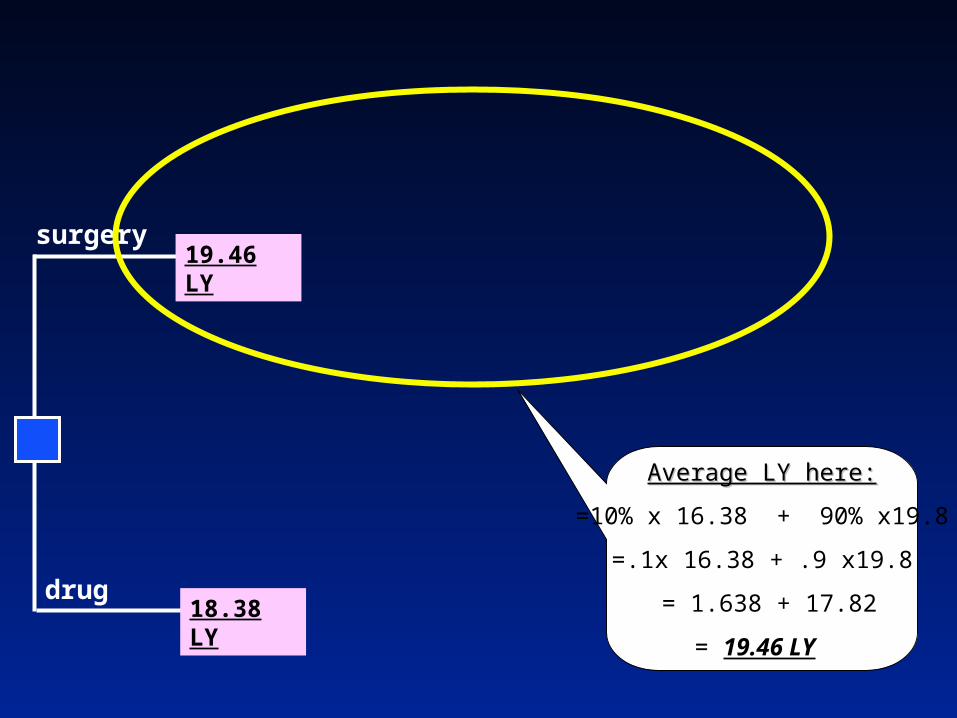
surgery
drug18.38 LY
19.46 LY
The outcome for each decision is more apparent now:
Medical management yields an average of 18.38 LY
Surgery (intending cure) produces average of 19.46 LY
The incremental benefit of Surgery
versus Medical Management is
19.46 - 18.38 = 1.08 LY

Repeat this Decision Analysis Using Other Outcome Measures
• Instead of just using average life years, can use QALYs at each endpoint.
• If you use both costs and QALYs at each endpoint:» Then can calculate the incremental
cost effectiveness of surgery versus medical management

Outline
• Decision analysis» Components of decision analysis» Building a tree: Example» Sensitivity analyses
• Markov models» Background» Constructing the model» Example» Monte Carlo simulations

Sensitivity Analysis
• Systematically asking “what if” questions to see how the decision result changes.
• Determines how “robust” the decision is.
• Threshold analysis: one parameter varied
• Multi-way analysis: multiple parameters systematically varied
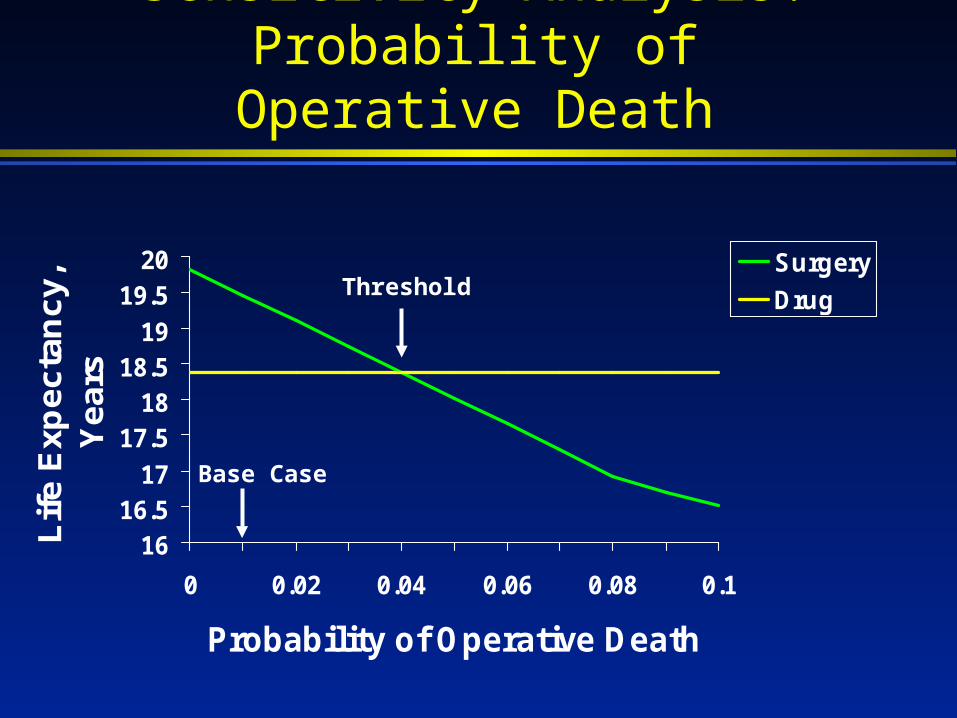
Sensitivity Analysis: Probability of Operative Death
1616.5
17
17.518
18.519
19.520
0 0.02 0.04 0.06 0.08 0.1
Probability of Operative Death
Lif
e E
xp
ec
tan
cy
, Y
ea
rs
Surgery
Drug
Base Case
Threshold

Two-Way Sensitivity Analysis:pDisease vs. pOperativeDeath
00.010.020.030.040.050.060.070.080.09
0 0.1 0.2 0.3 0.4 0.5 0.6 0.7 0.8 0.9 1
Probability of Disease
Pro
ba
bil
ity
of
Op
era
tiv
e D
ea
th Choose Drug
Choose Surgery

Outline
• Decision analysis» Components of decision analysis» Building a tree: Example» Sensitivity analyses
• Markov models» Background» Constructing the model» Example» Monte Carlo simulations

What is a Markov Model?
Mathematical modeling technique, derived from matrix algebra, that describes the transitions a cohort of patients make among a number of mutually exclusive and exhaustive health states during a series of short intervals or cycles
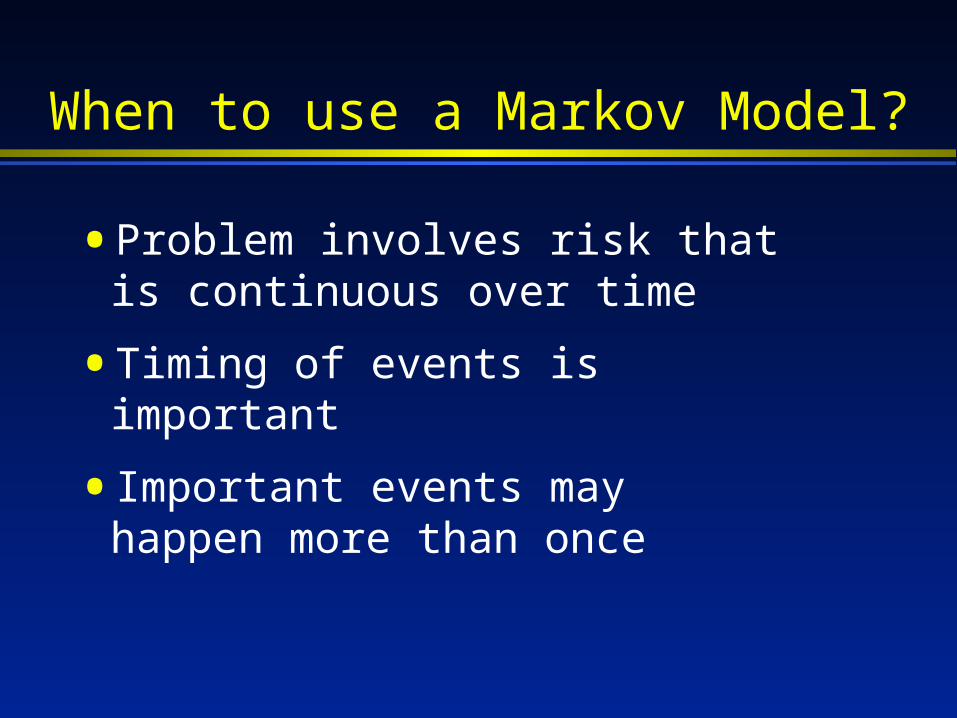
When to use a Markov Model?
• Problem involves risk that is continuous over time
• Timing of events is important
• Important events may happen more than once

Properties of a Markov Model
• Patient is always in one of a finite number of health states
• Events are modeled as transitions from one state to another
• Contribution of utility to overall prognosis depends on length of time spent in health states
• During each cycle, the patient may make a transition from one state to another

Outline
• Decision analysis» Components of decision analysis» Building a tree: Example» Sensitivity analyses
• Markov models» Background» Constructing the model» Example» Monte Carlo simulations

Constructing a Markov Model
• Choose set of mutually exclusive health states
• Determine possible transitions between these health states» State transitions» Transition probabilities
• Determine clinical valid cycle length

Cycle Length
• Clinically meaningful time interval
• Entire life of patient, relatively rare events yearly
• Shorter time frame, frequent events, rate changing rapidly over time monthly or weekly
• Availability of probability data?
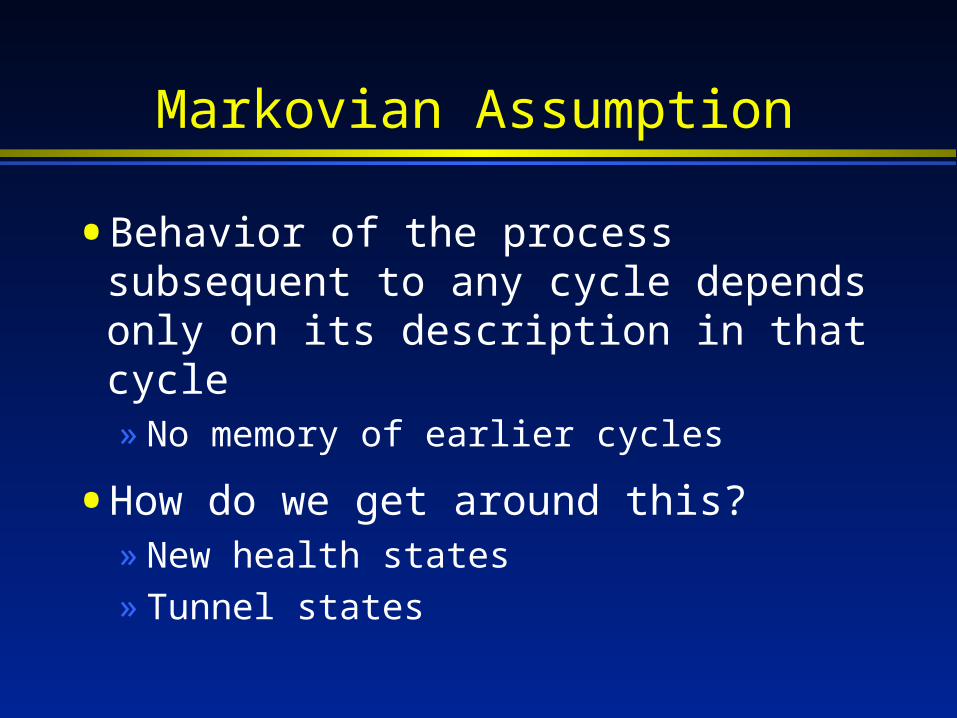
Markovian Assumption
• Behavior of the process subsequent to any cycle depends only on its description in that cycle» No memory of earlier cycles
• How do we get around this?» New health states» Tunnel states

Outline
• Decision analysis» Components of decision analysis» Building a tree: Example» Sensitivity analyses
• Markov models» Background» Constructing the model» Example» Monte Carlo simulations

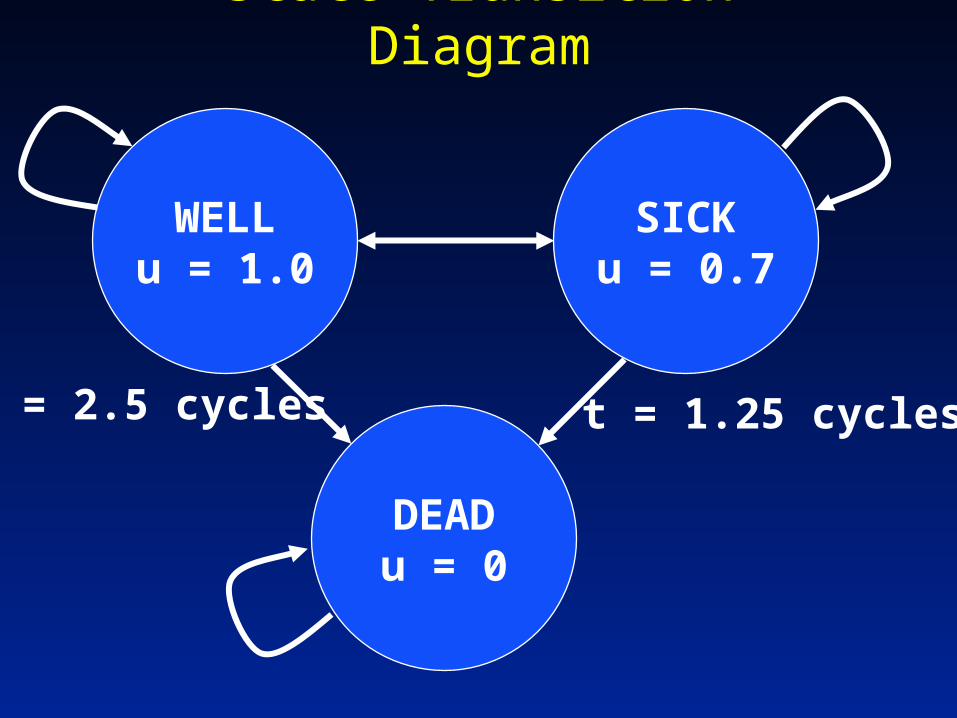
State Transition Diagram
SICK
DEAD
WELL

Evaluation
• Compute number of cycles spent in each health state
» Expected utility =
• Define incremental utility for spending a cycle in given health state
» Expected utility =
n
1s
st
s
n
1s
s u*t
State Transition Diagram
SICKu = 0.7
DEADu = 0
WELLu = 1.0
t = 2.5 cycles t = 1.25 cycles
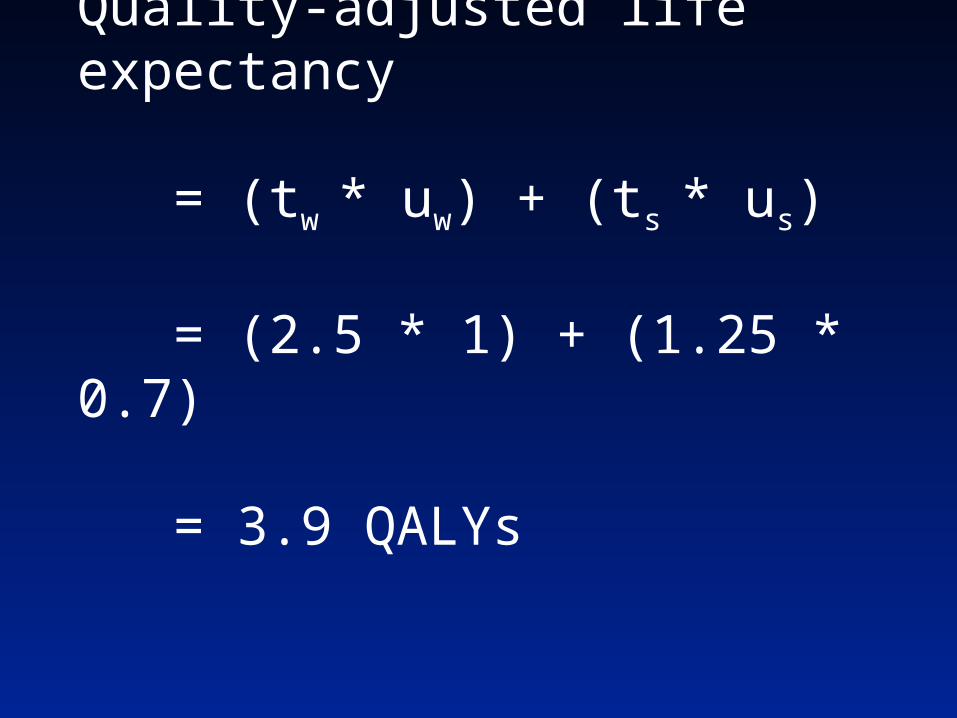
Quality-adjusted life expectancy
= (tw * uw) + (ts * us)
= (2.5 * 1) + (1.25 * 0.7)
= 3.9 QALYs
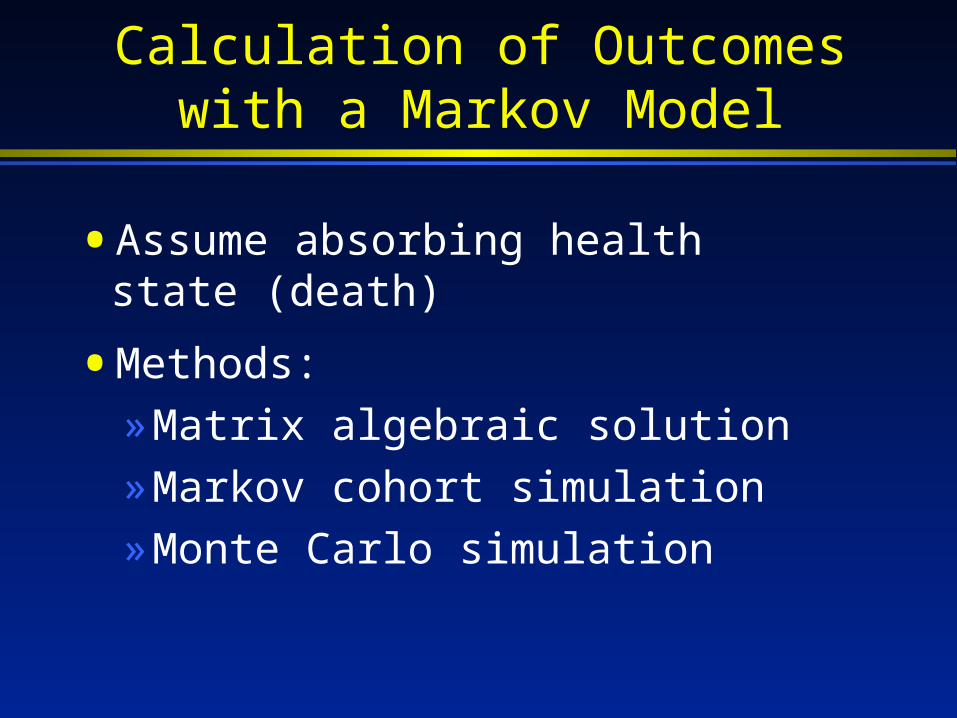
Calculation of Outcomeswith a Markov Model
• Assume absorbing health state (death)
• Methods:
» Matrix algebraic solution
» Markov cohort simulation
» Monte Carlo simulation

Fundamental Matrix Solution
• Requires constant transition probabilities
• Does not require simulation
• Requires matrix algebra

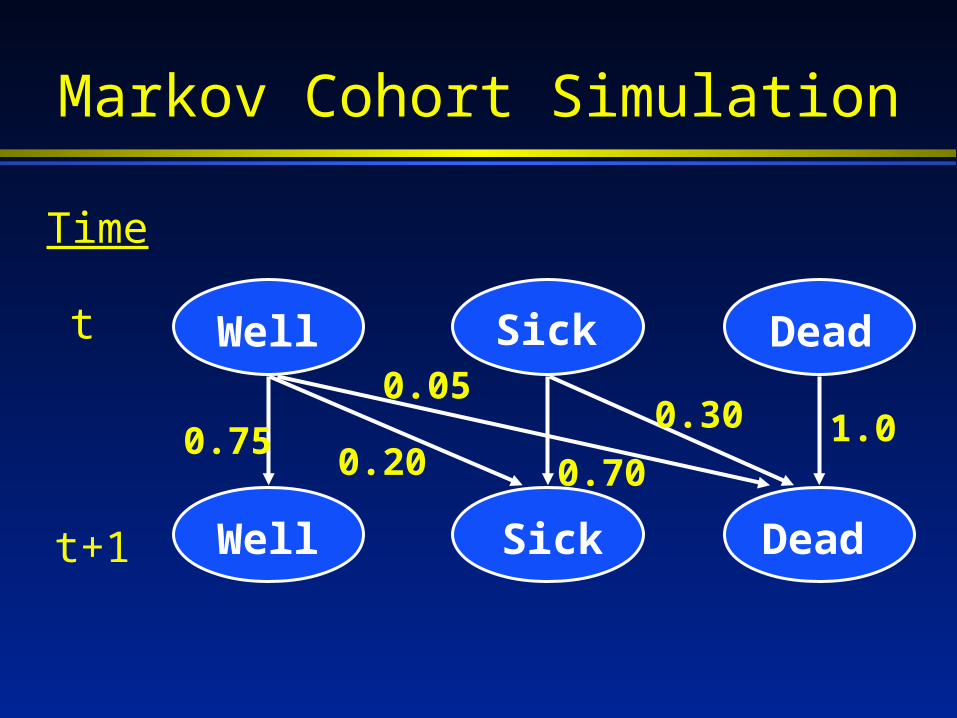
Transition Probability Matrix
Well Sick Dead
Well 0.75 0.20 0.05
Sick 0 0.70 0.30
Dead 0 0 1
Starting Probability Vector: [ 1 0 0 ]
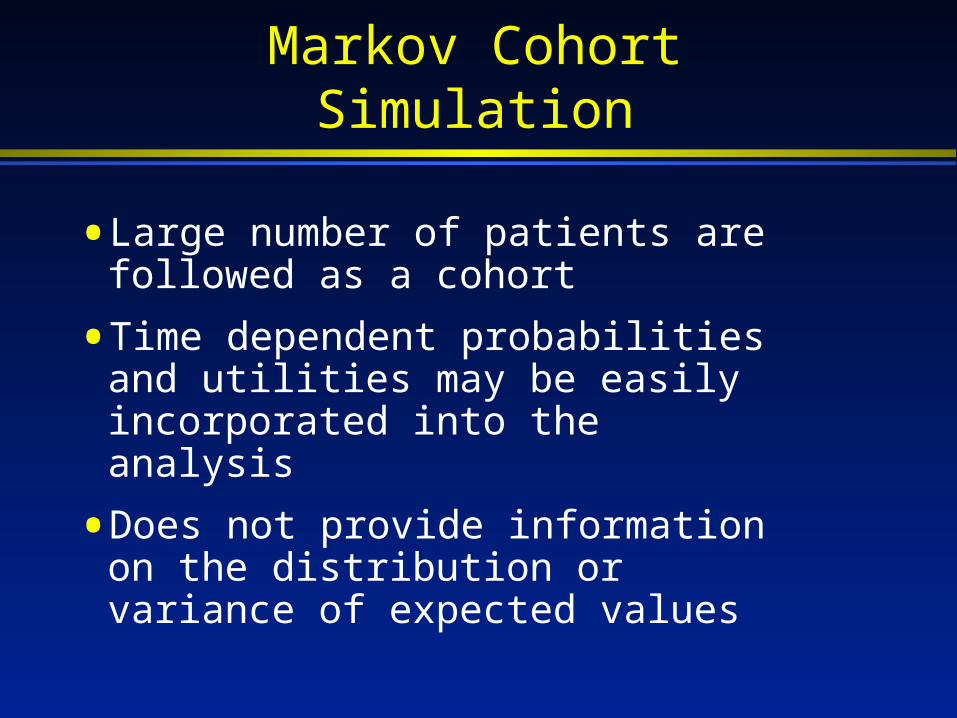
Markov Cohort Simulation
• Large number of patients are followed as a cohort
• Time dependent probabilities and utilities may be easily incorporated into the analysis
• Does not provide information on the distribution or variance of expected values
t
t+1
Well
Well
Sick
Sick
Dead
Dead
Time
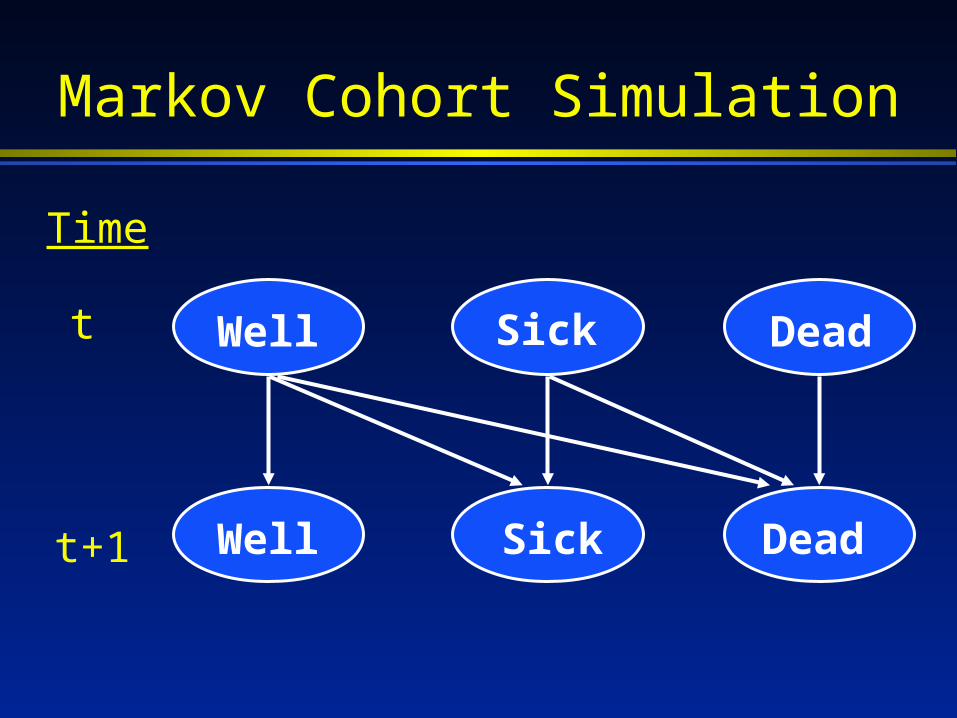
Markov Cohort Simulation
t
t+1
Well
Well
Sick
Sick
Dead
Dead
Time
Markov Cohort Simulation
0.750.20
0.05
0.70
0.30 1.0
t
t+1
Well
Well
Sick
Sick
Dead
Dead
Time
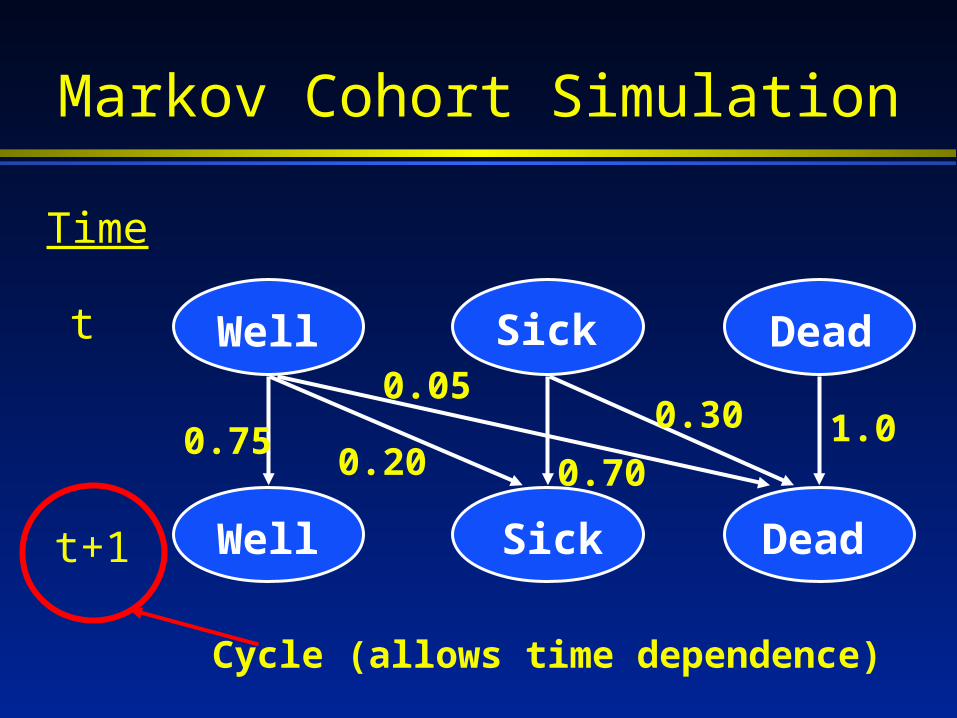
Markov Cohort Simulation
0.750.20
0.05
0.70
0.30 1.0
Cycle (allows time dependence)
Well DeadSick
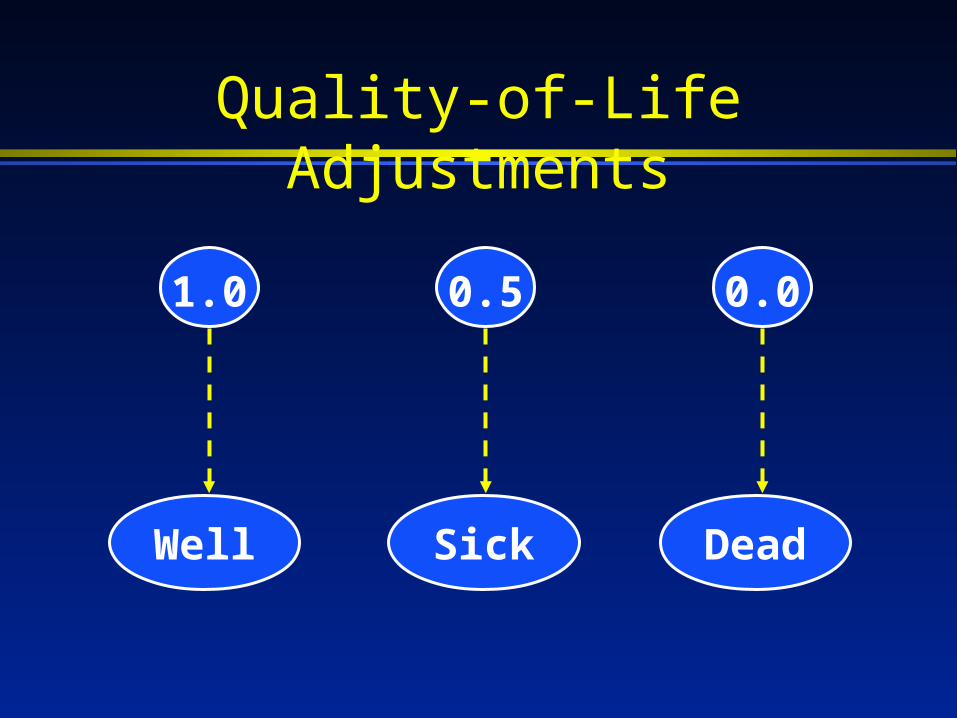
Quality-of-Life Adjustments
1.0 0.5 0.0

Expressed as a Markov Tree:Structure
Well
DeadDead
Sick
Dead
Sick
Dead
Sick
Well
Die
Get Sick
Stay Well
Die
Stay Sick
Markov

Expressed as a Markov Tree:Transition Probabilities
Well
DeadDead
Sick
Dead
Sick
Dead
Sick
Well
Die
Get Sick
Stay Well
Die
Stay Sick
Markov
1
0
0
0.75
0.20
0.05
0.70
0.30
Expressed as a Markov Tree:Utilities
Well
DeadDead = 0
Sick
Dead = 0
Sick = 0.5
Dead = 0
Sick = 0.5
Well = 1.0
Die
Get Sick
Stay Well
Die
Stay Sick
Markov
1
0
0
0.75
0.20
0.05
0.70
0.30

Running the Model
Cycle Total
Cycle Well Sick Dead Reward Reward
0 1 0 0 0.5 0.5
1 0.75 0.20 0.05 0.85 1.35
2 0.56 0.29 0.15 0.71 2.06
3 0.42 0.32 0.26 0.58 2.64
4 0.32 0.31 0.38 0.47 3.11

Outline
• Decision analysis» Components of decision analysis» Building a tree: Example» Sensitivity analyses
• Markov models» Background» Constructing the model» Example» Monte Carlo simulations
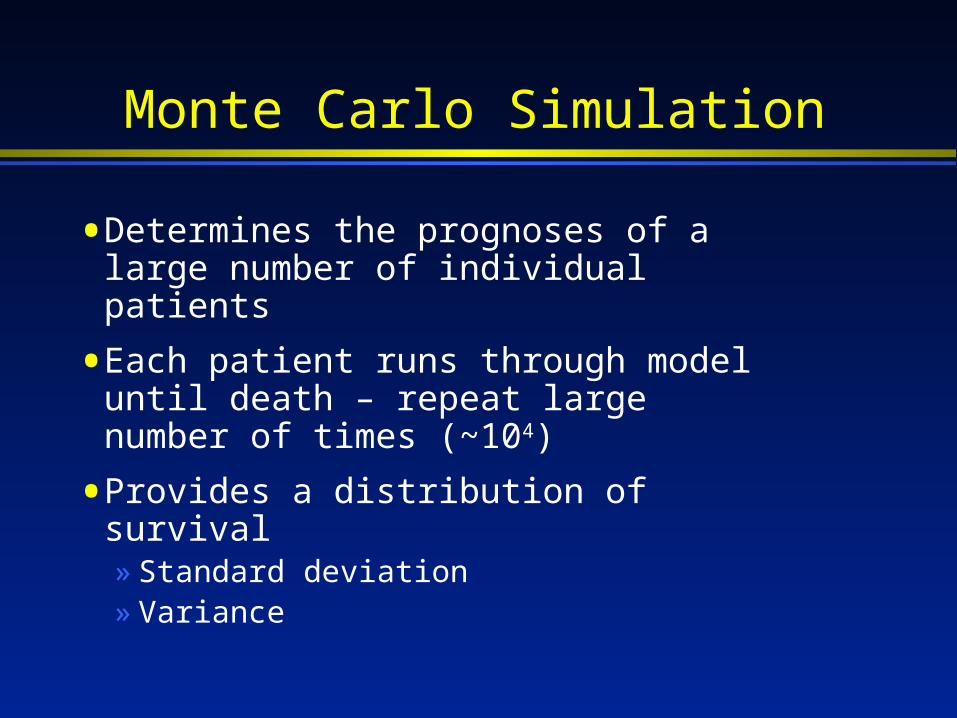
Monte Carlo Simulation
• Determines the prognoses of a large number of individual patients
• Each patient runs through model until death – repeat large number of times (~104)
• Provides a distribution of survival» Standard deviation» Variance

Monte Carlo Simulation
Well DeadSick
Well DeadSick
Well DeadSick
Well DeadSickWWSD
1
2
3
4
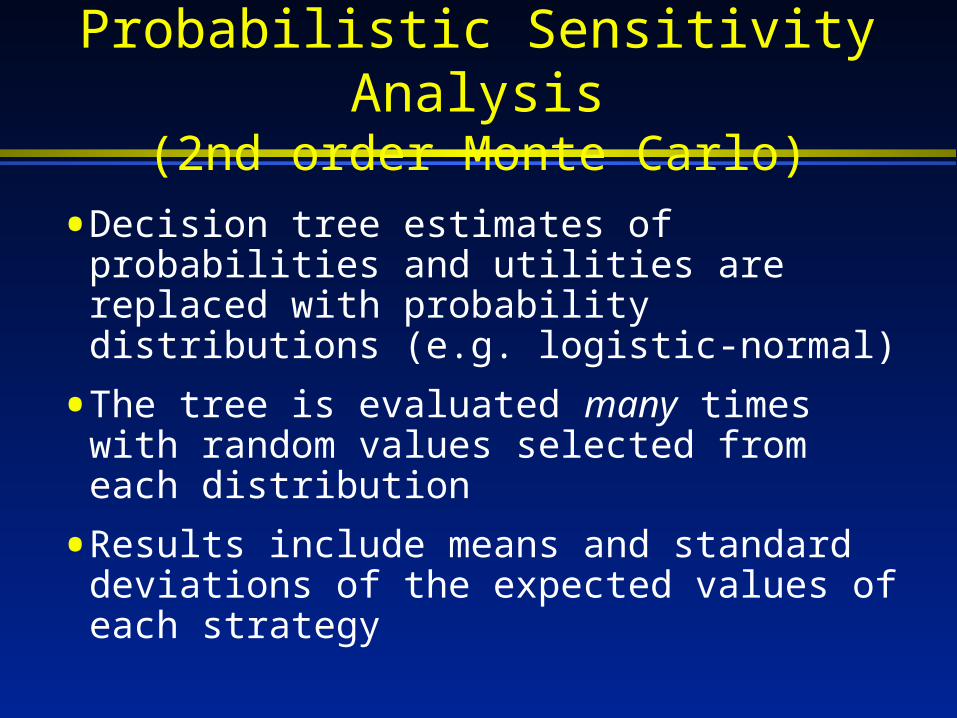
Probabilistic Sensitivity Analysis(2nd order Monte Carlo)
• Decision tree estimates of probabilities and utilities are replaced with probability distributions (e.g. logistic-normal)
• The tree is evaluated many times with random values selected from each distribution
• Results include means and standard deviations of the expected values of each strategy
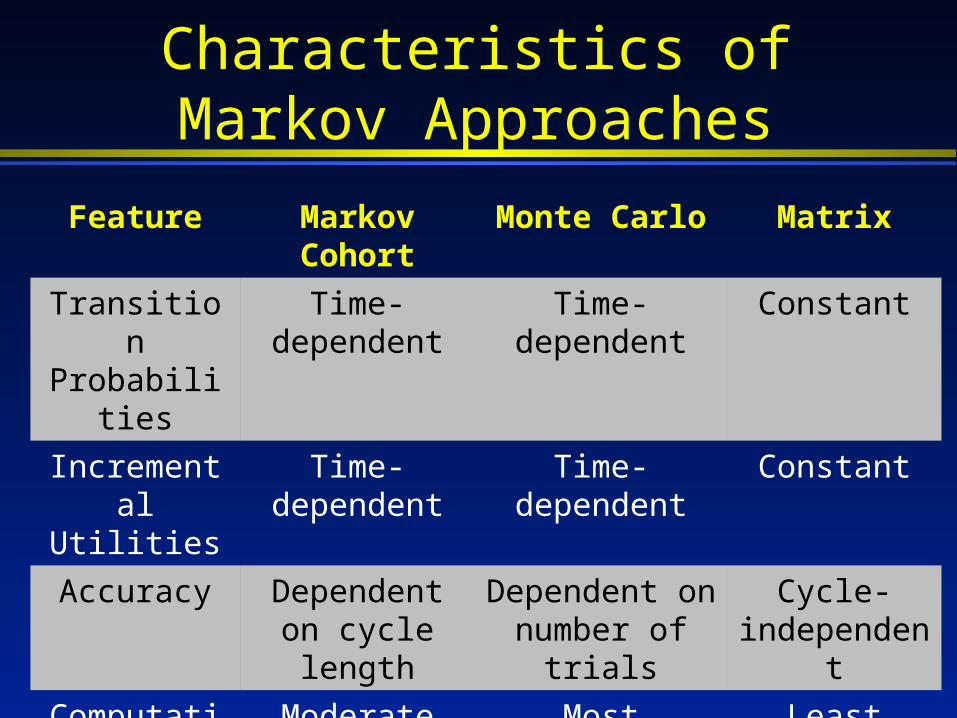
Characteristics ofMarkov Approaches
Feature Markov Cohort
Monte Carlo Matrix
Transition Probabilities
Time-dependent
Time-dependent Constant
Incremental Utilities
Time-dependent
Time-dependent Constant
Accuracy Dependent on cycle length
Dependent on number of trials
Cycle-independent
Computation Moderate Most Least
Variability Measures
No Yes Yes
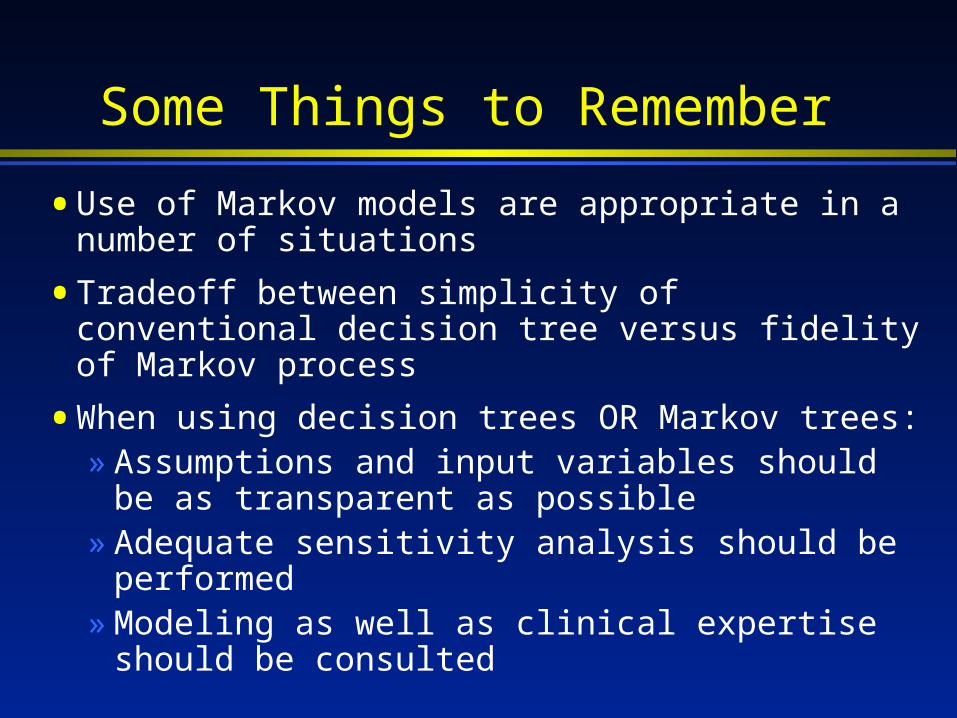
Some Things to Remember
• Use of Markov models are appropriate in a number of situations
• Tradeoff between simplicity of conventional decision tree versus fidelity of Markov process
• When using decision trees OR Markov trees:» Assumptions and input variables should be as
transparent as possible» Adequate sensitivity analysis should be
performed» Modeling as well as clinical expertise should be
consulted
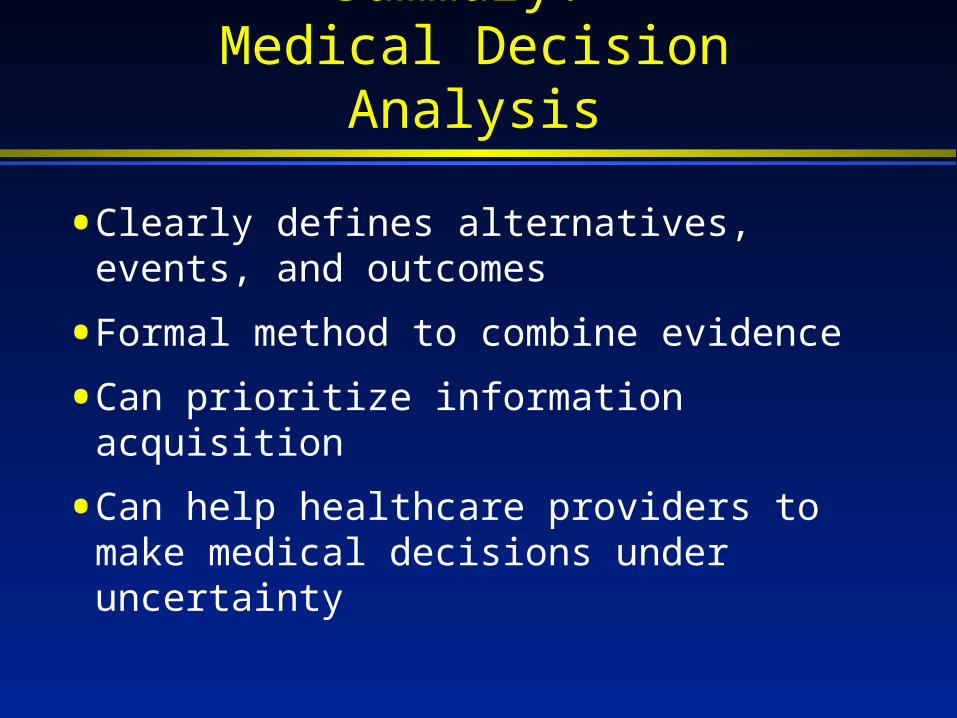
Summary: Medical Decision Analysis
• Clearly defines alternatives, events, and outcomes
• Formal method to combine evidence
• Can prioritize information acquisition
• Can help healthcare providers to make medical decisions under uncertainty
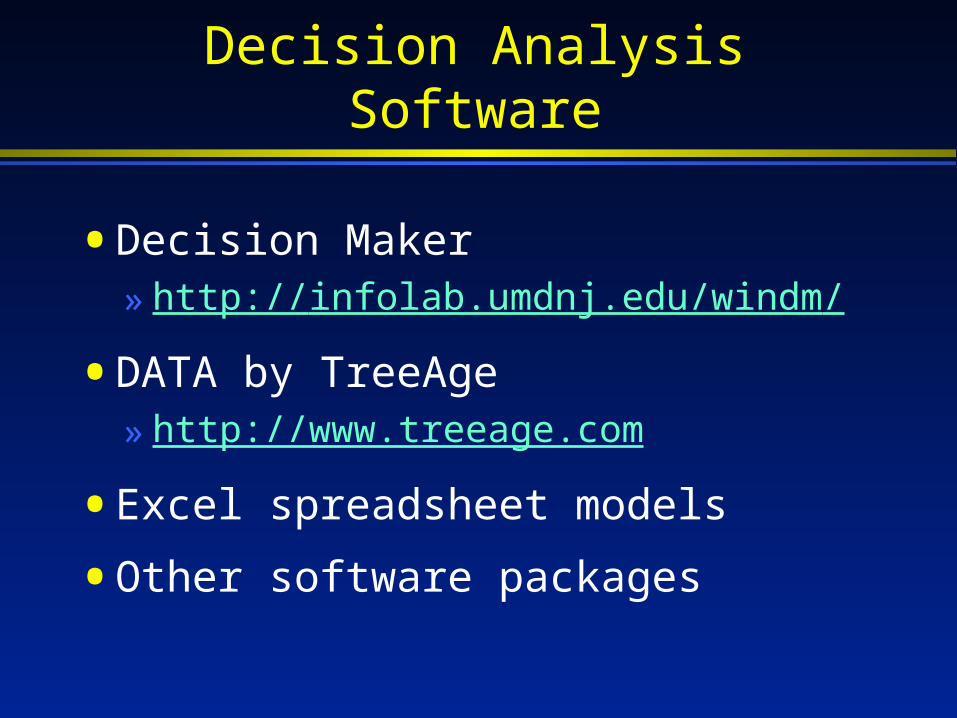
Decision Analysis Software
• Decision Maker» http://infolab.umdnj.edu/windm/
• DATA by TreeAge» http://www.treeage.com
• Excel spreadsheet models
• Other software packages
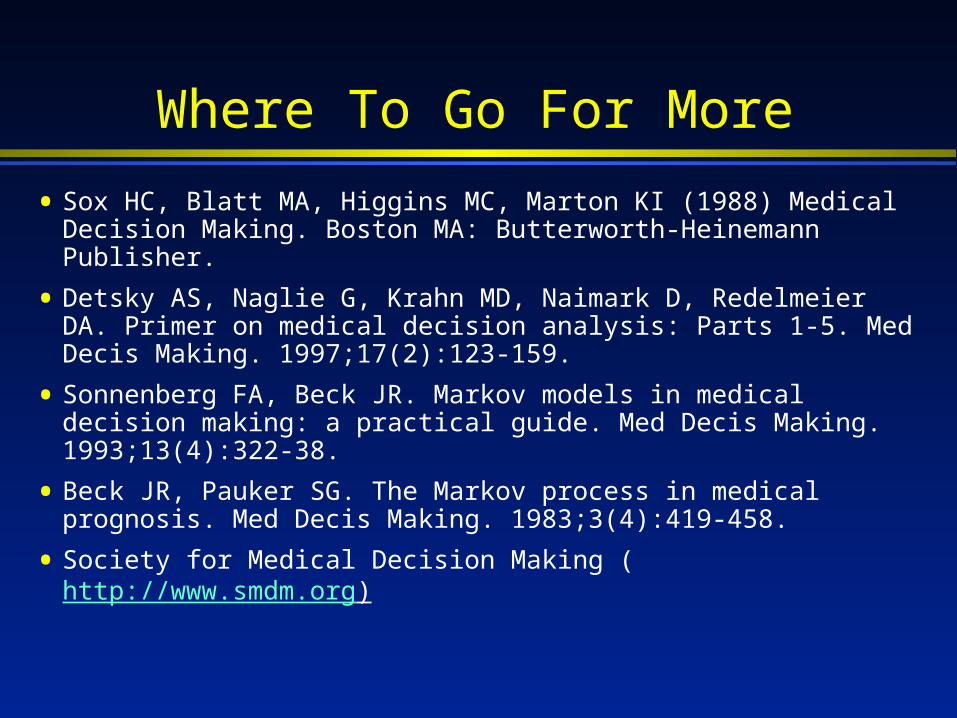
Where To Go For More
• Sox HC, Blatt MA, Higgins MC, Marton KI (1988) Medical Decision Making. Boston MA: Butterworth-Heinemann Publisher.
• Detsky AS, Naglie G, Krahn MD, Naimark D, Redelmeier DA. Primer on medical decision analysis: Parts 1-5. Med Decis Making. 1997;17(2):123-159.
• Sonnenberg FA, Beck JR. Markov models in medical decision making: a practical guide. Med Decis Making. 1993;13(4):322-38.
• Beck JR, Pauker SG. The Markov process in medical prognosis. Med Decis Making. 1983;3(4):419-458.
• Society for Medical Decision Making (http://www.smdm.org)


