41
Introduction to Paraview GUI Raffaele Ponzini – [email protected] SuperComputing Applications and Innovation Department
Introduction to Paraview GUI
Raffaele Ponzini – [email protected] SuperComputing Applications and Innovation Department
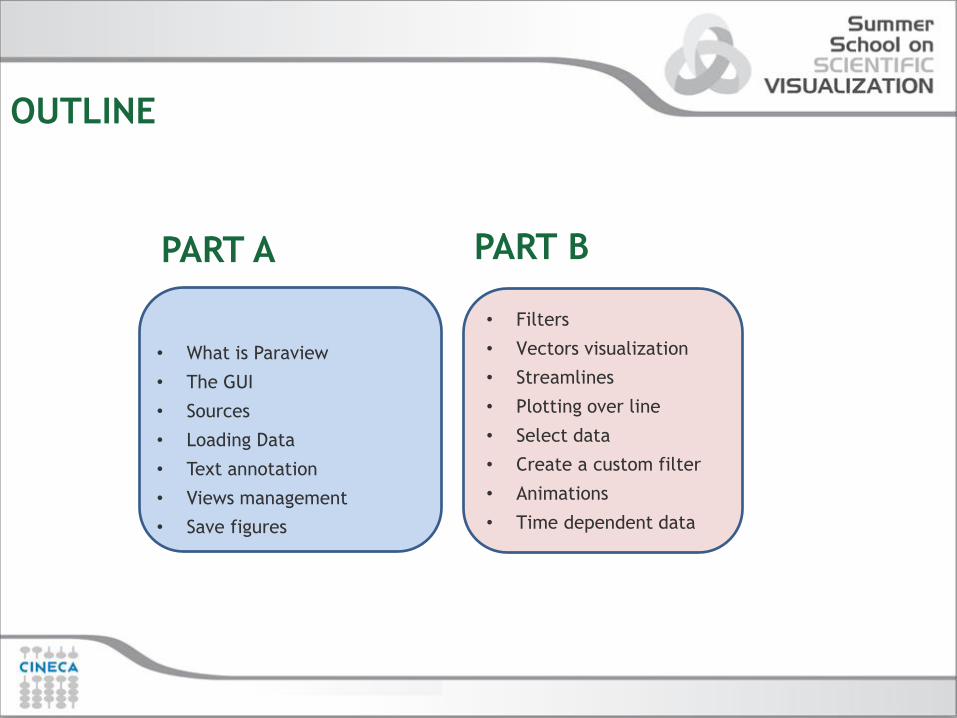
• Filters
• Vectors visualization
• Streamlines
• Plotting over line
• Select data
• Create a custom filter
• Animations
• Time dependent data
OUTLINE
• What is Paraview
• The GUI
• Sources
• Loading Data
• Text annotation
• Views management
• Save figures
PART A PART B
What is Paraview
ParaView is an open-source application for visualizing 2D/3D data.
To date, ParaView has been demonstrated to process billions of unstructured cells and to process
over a trillion structured cells.
ParaView's parallel framework has run on over 100,000 processing cores.
ParaView's key features are:
• An open-source, scalable, multi-platform visualization application.
• Support for distributed computation models to process large data sets.
• An open, extensible, and intuitive user interface.
• An extensible, modular architecture based on open standards.
• A flexible BSD 3-clause license.
• Commercial maintenance and support.
PARAVIEW: a standard de-facto
ParaView is used by many academic, government, and commercial
institutions all over the world.
ParaView is downloaded roughly 100,000 times every year.
ParaView also won the HPCwire Readers' Choice Award and HPCwire Editors'
Choice Award for Best HPC Visualization Product or Technology.
Obtaining Paraview & Official Resources
• Main website:
http://www.paraview.org/
• Download page:
http://www.paraview.org/paraview/resources/software.php
• Resources (video):
http://www.paraview.org/paraview/resources/webinars.html
• Resources (wiki):
http://www.paraview.org/Wiki/ParaView
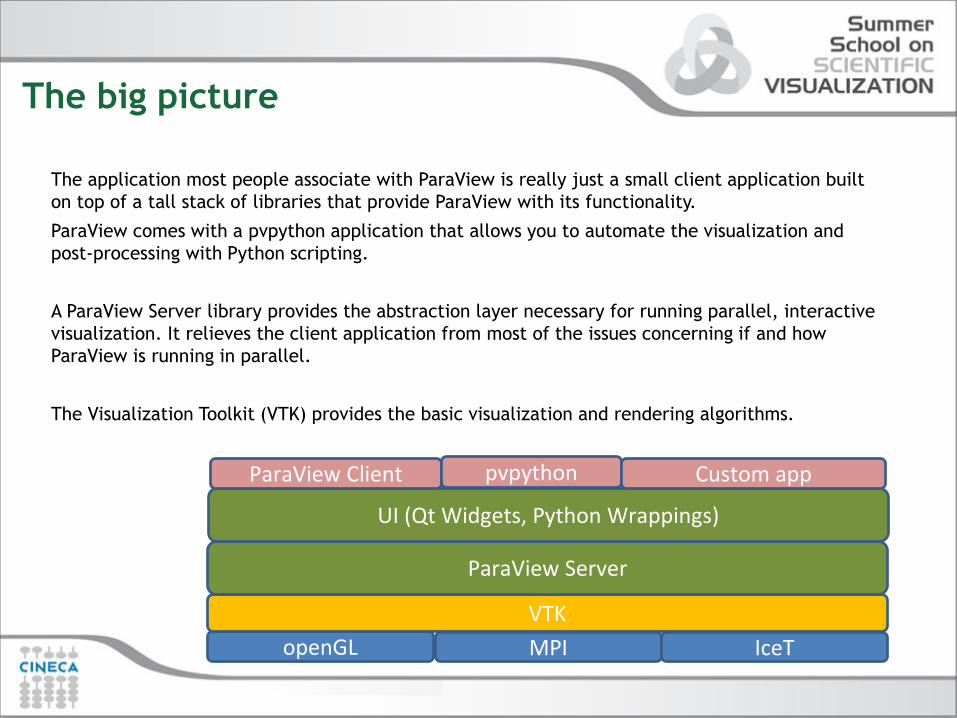
The big picture
The application most people associate with ParaView is really just a small client application built
on top of a tall stack of libraries that provide ParaView with its functionality.
ParaView comes with a pvpython application that allows you to automate the visualization and
post-processing with Python scripting.
A ParaView Server library provides the abstraction layer necessary for running parallel, interactive
visualization. It relieves the client application from most of the issues concerning if and how
ParaView is running in parallel.
The Visualization Toolkit (VTK) provides the basic visualization and rendering algorithms.
openGL MPI IceT
VTK
ParaView Server
UI (Qt Widgets, Python Wrappings)
ParaView Client pvpython Custom app

GUI
Launch the Paraview application on your pc

GUI elements
Menu Bar
Toolbars
Pipeline Browser (we will look at this later on)
Properties Panel
3D View
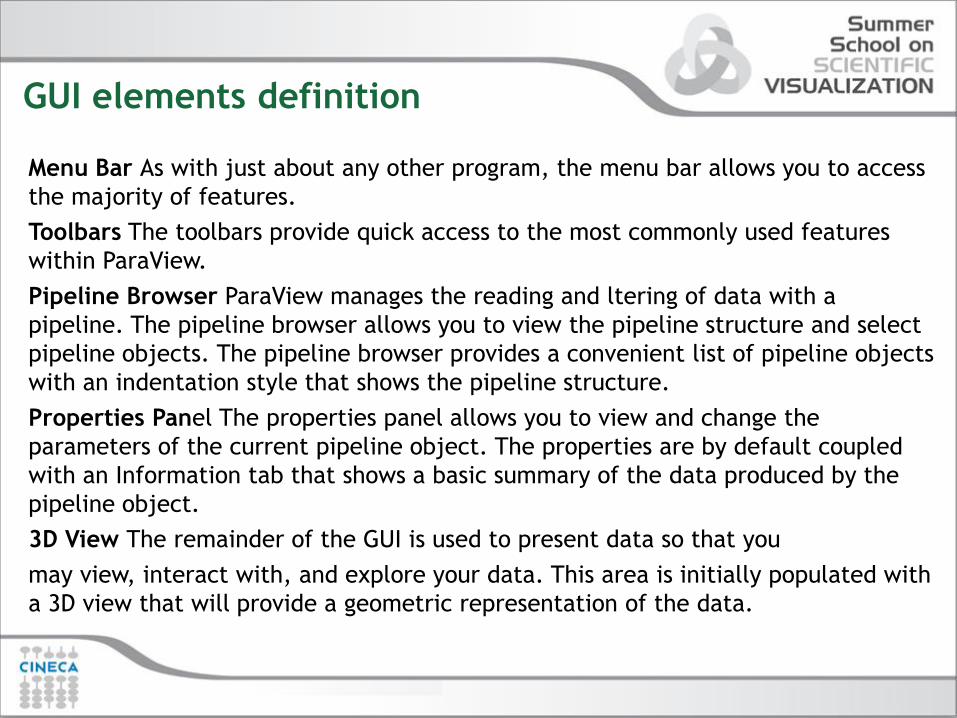
GUI elements definition
Menu Bar As with just about any other program, the menu bar allows you to access
the majority of features.
Toolbars The toolbars provide quick access to the most commonly used features
within ParaView.
Pipeline Browser ParaView manages the reading and ltering of data with a
pipeline. The pipeline browser allows you to view the pipeline structure and select
pipeline objects. The pipeline browser provides a convenient list of pipeline objects
with an indentation style that shows the pipeline structure.
Properties Panel The properties panel allows you to view and change the
parameters of the current pipeline object. The properties are by default coupled
with an Information tab that shows a basic summary of the data produced by the
pipeline object.
3D View The remainder of the GUI is used to present data so that you
may view, interact with, and explore your data. This area is initially populated with
a 3D view that will provide a geometric representation of the data.
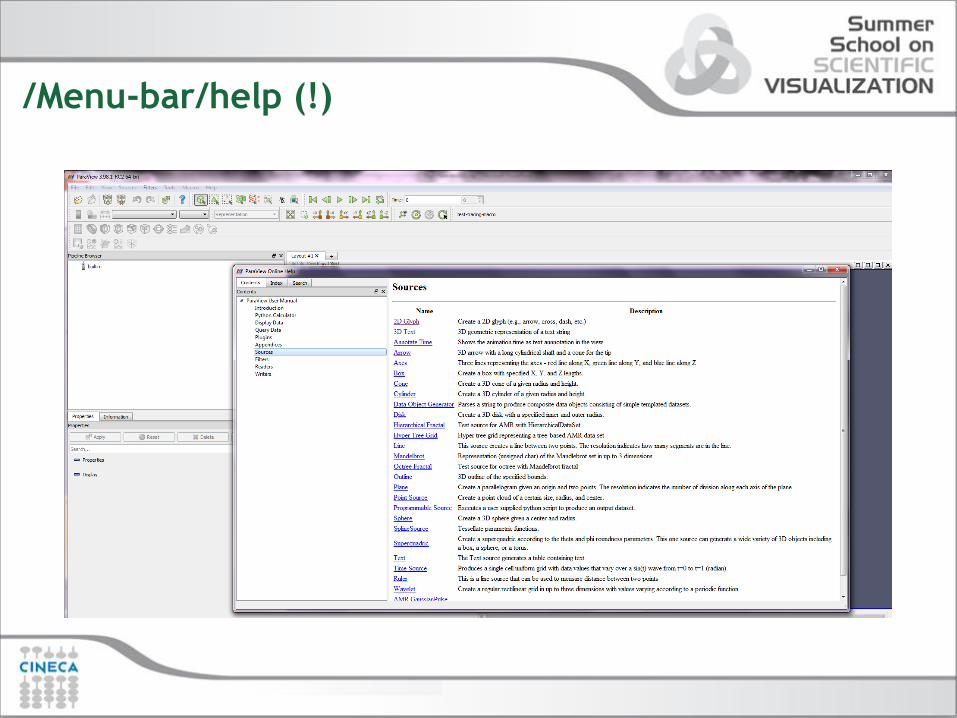
/Menu-bar/help (!)

Personalize your GUI
The GUI is customizable so that toolbars can be displayed or hidden when needed.

Sources
Data can be uploaded into ParaView
3D scene using VTK source objects
or loading files (readers).
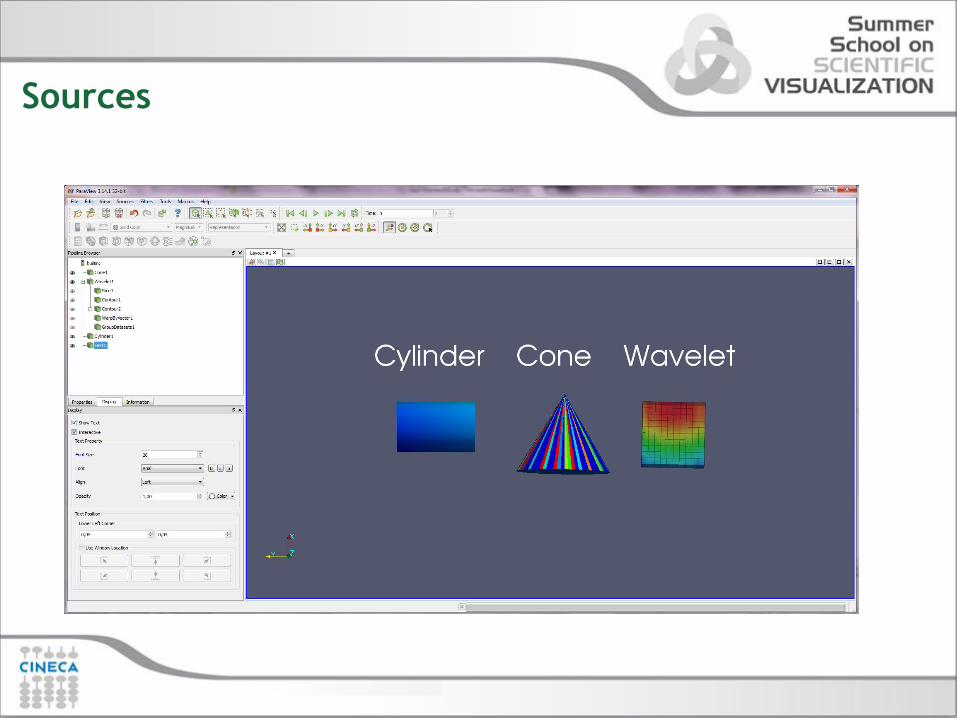
Sources
3D objects manipulations
Test the usage of your mouse buttons:
• Left button: rotation
• Right button: panning
• Middle button: zooming
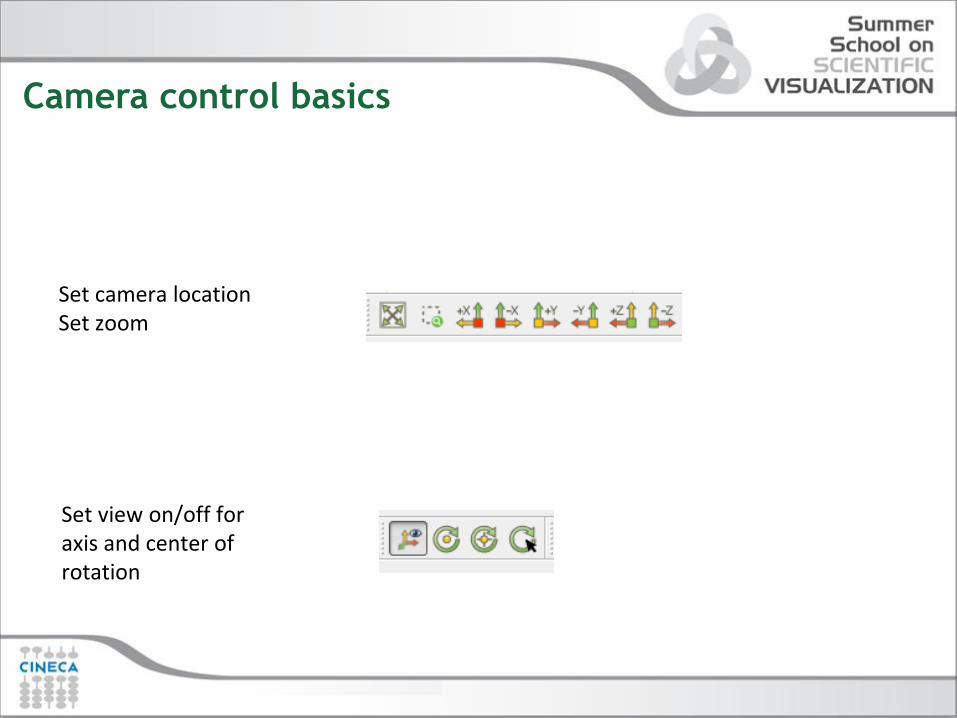
Camera control basics
Set camera location Set zoom
Set view on/off for axis and center of rotation

Change center of rotation
Apply/Reset
Undo/Redo
Apply: click on the apply button to ‘sync’ your data state.(Automatic apply of changes button )
Reset: click this button to restore the default configuration state.
Undo: go back to the previous state
Redo: return to the state you changed back
Camera Undo: same as above but for camera views changes
Camera Redo: same as above but for camera views changes
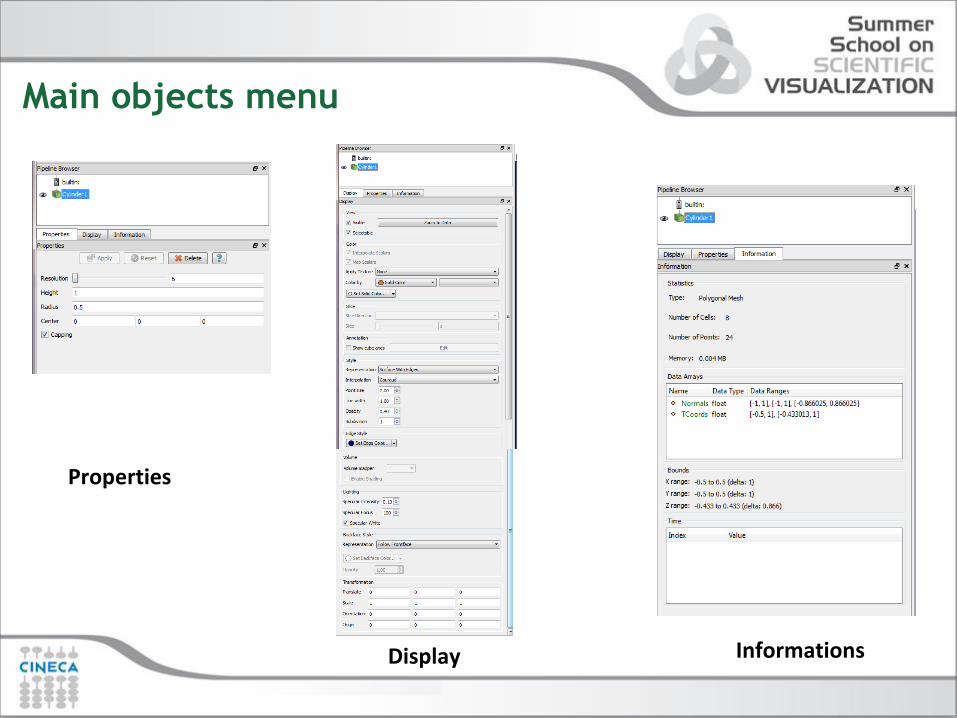
Main objects menu
Properties
Display Informations
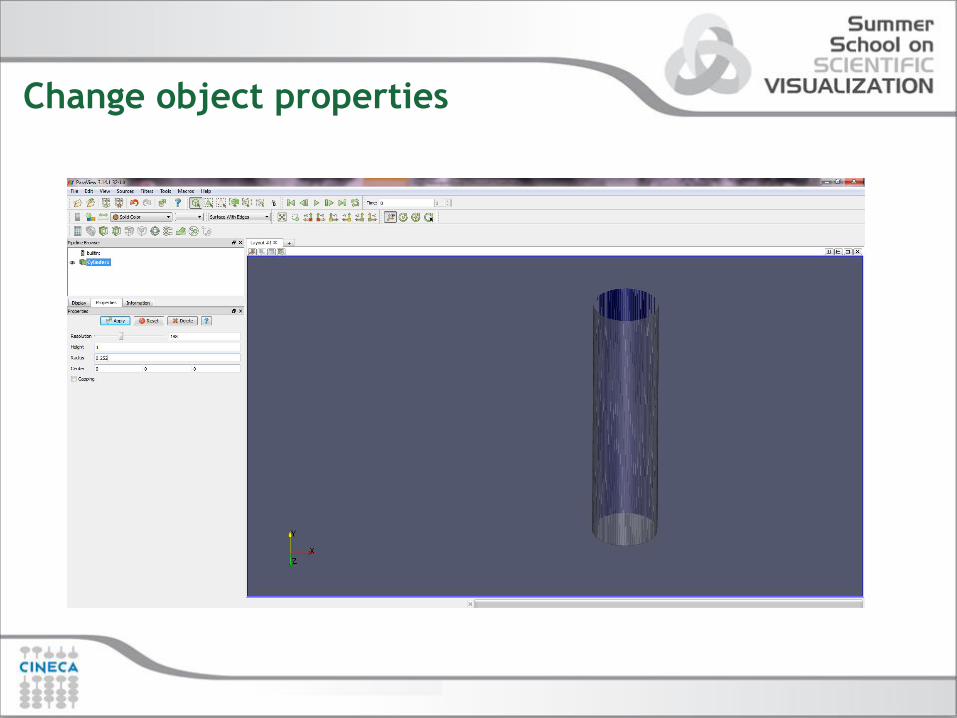
Change object properties
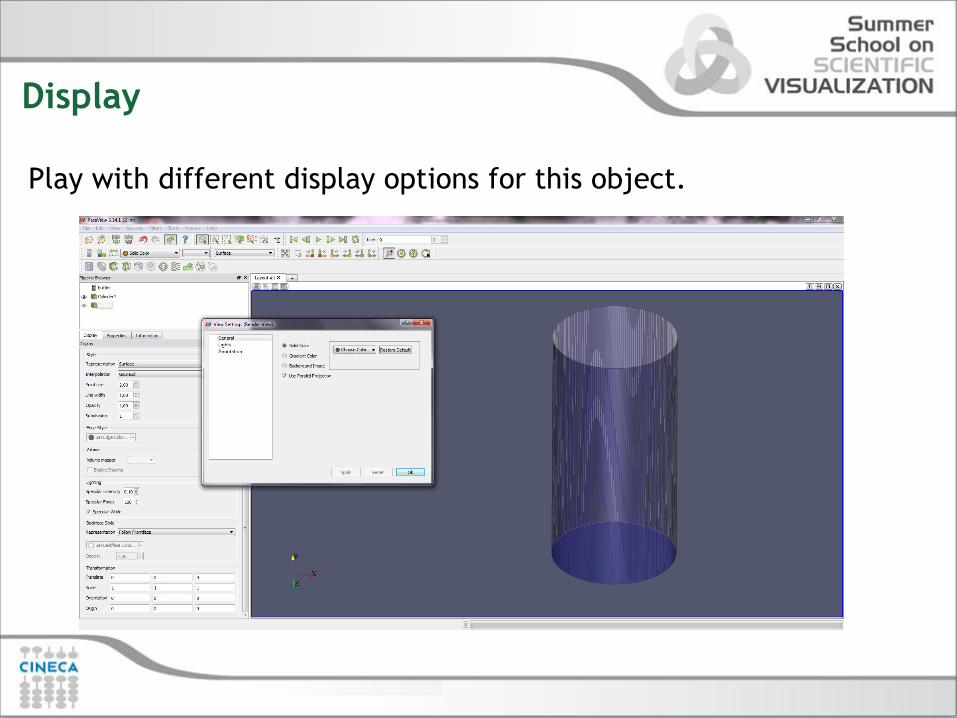
Display
Play with different display options for this object.
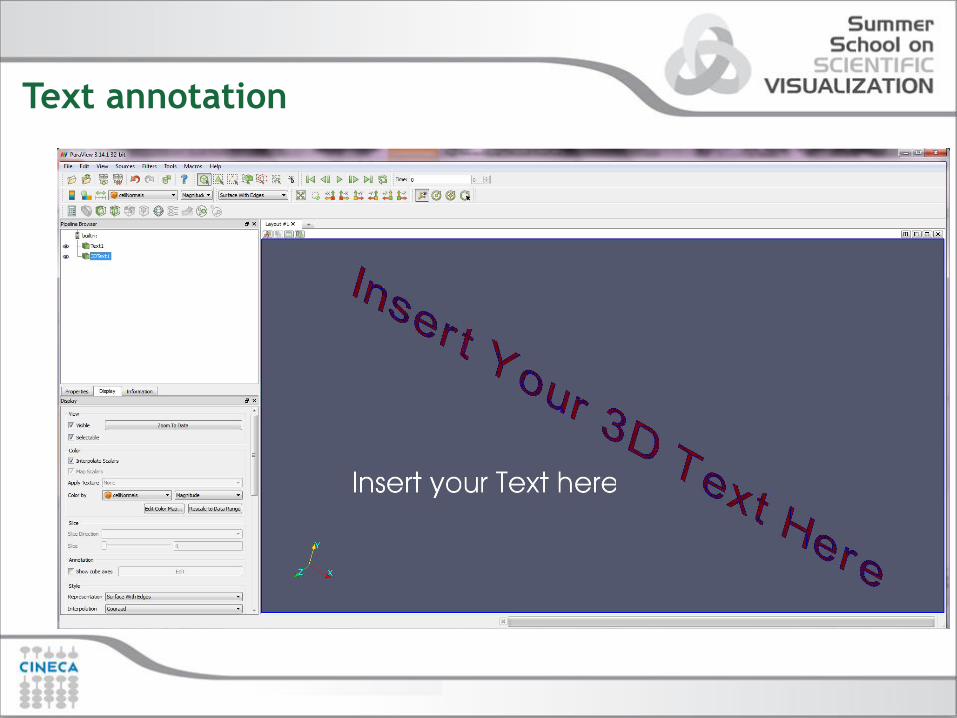
Text annotation
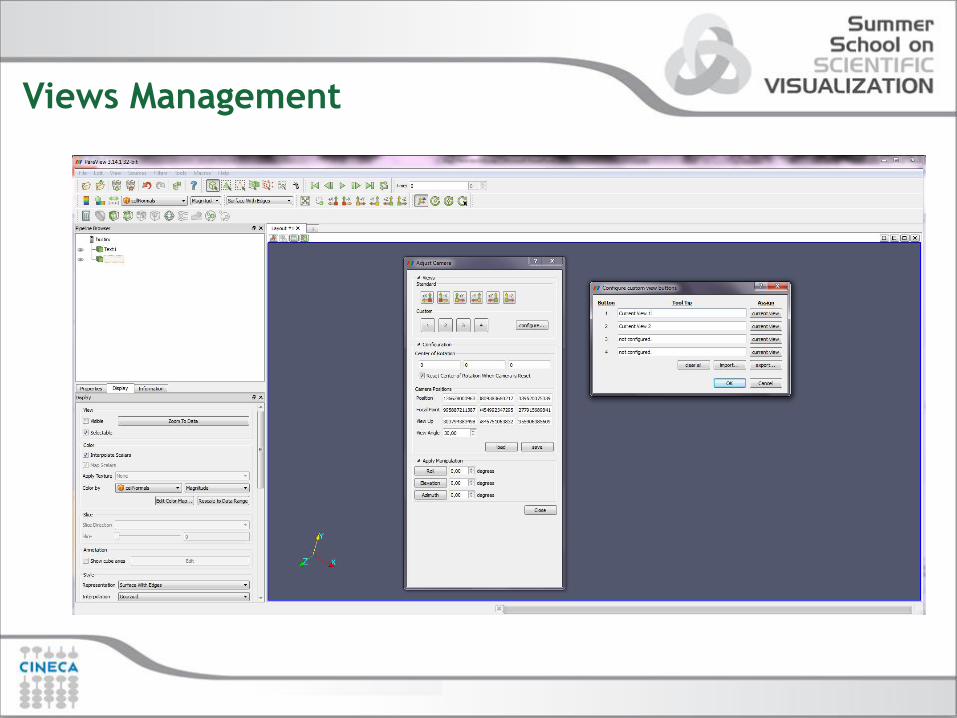
Views Management
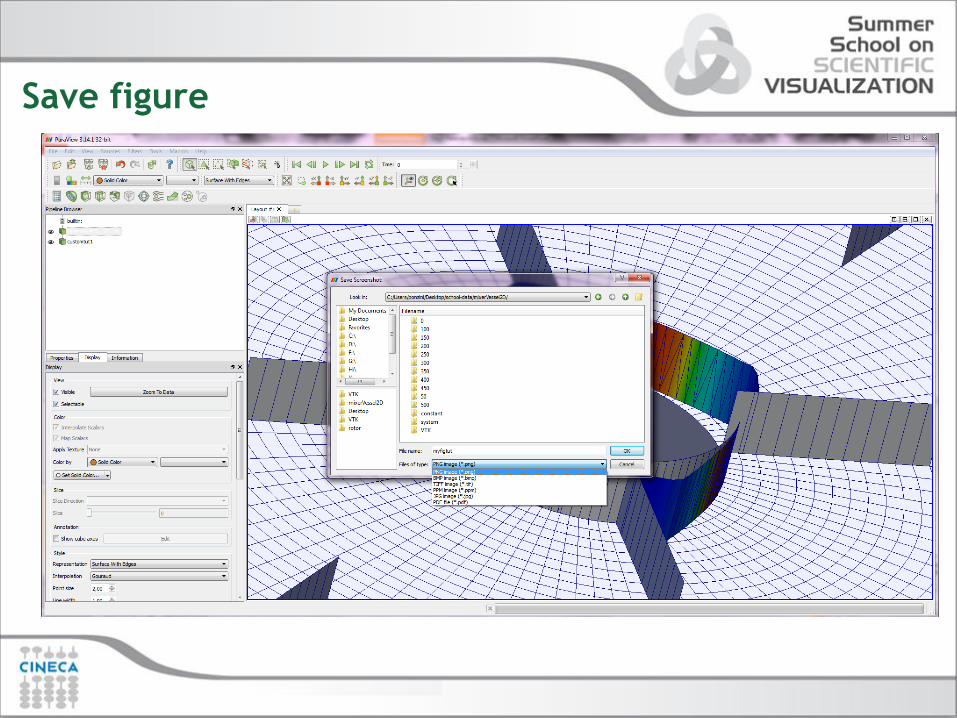
Save figure
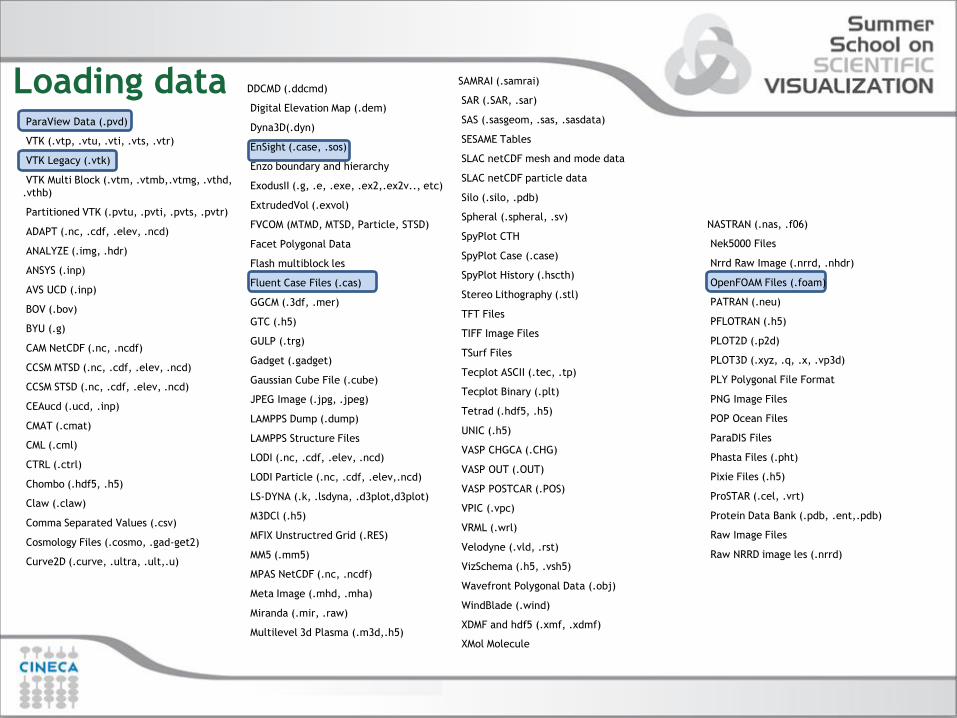
Loading data ParaView Data (.pvd)
VTK (.vtp, .vtu, .vti, .vts, .vtr)
VTK Legacy (.vtk)
VTK Multi Block (.vtm, .vtmb,.vtmg, .vthd,
.vthb)
Partitioned VTK (.pvtu, .pvti, .pvts, .pvtr)
ADAPT (.nc, .cdf, .elev, .ncd)
ANALYZE (.img, .hdr)
ANSYS (.inp)
AVS UCD (.inp)
BOV (.bov)
BYU (.g)
CAM NetCDF (.nc, .ncdf)
CCSM MTSD (.nc, .cdf, .elev, .ncd)
CCSM STSD (.nc, .cdf, .elev, .ncd)
CEAucd (.ucd, .inp)
CMAT (.cmat)
CML (.cml)
CTRL (.ctrl)
Chombo (.hdf5, .h5)
Claw (.claw)
Comma Separated Values (.csv)
Cosmology Files (.cosmo, .gad-get2)
Curve2D (.curve, .ultra, .ult,.u)
DDCMD (.ddcmd)
Digital Elevation Map (.dem)
Dyna3D(.dyn)
EnSight (.case, .sos)
Enzo boundary and hierarchy
ExodusII (.g, .e, .exe, .ex2,.ex2v.., etc)
ExtrudedVol (.exvol)
FVCOM (MTMD, MTSD, Particle, STSD)
Facet Polygonal Data
Flash multiblock les
Fluent Case Files (.cas)
GGCM (.3df, .mer)
GTC (.h5)
GULP (.trg)
Gadget (.gadget)
Gaussian Cube File (.cube)
JPEG Image (.jpg, .jpeg)
LAMPPS Dump (.dump)
LAMPPS Structure Files
LODI (.nc, .cdf, .elev, .ncd)
LODI Particle (.nc, .cdf, .elev,.ncd)
LS-DYNA (.k, .lsdyna, .d3plot,d3plot)
M3DCl (.h5)
MFIX Unstructred Grid (.RES)
MM5 (.mm5)
MPAS NetCDF (.nc, .ncdf)
Meta Image (.mhd, .mha)
Miranda (.mir, .raw)
Multilevel 3d Plasma (.m3d,.h5)
NASTRAN (.nas, .f06)
Nek5000 Files
Nrrd Raw Image (.nrrd, .nhdr)
OpenFOAM Files (.foam)
PATRAN (.neu)
PFLOTRAN (.h5)
PLOT2D (.p2d)
PLOT3D (.xyz, .q, .x, .vp3d)
PLY Polygonal File Format
PNG Image Files
POP Ocean Files
ParaDIS Files
Phasta Files (.pht)
Pixie Files (.h5)
ProSTAR (.cel, .vrt)
Protein Data Bank (.pdb, .ent,.pdb)
Raw Image Files
Raw NRRD image les (.nrrd)
SAMRAI (.samrai)
SAR (.SAR, .sar)
SAS (.sasgeom, .sas, .sasdata)
SESAME Tables
SLAC netCDF mesh and mode data
SLAC netCDF particle data
Silo (.silo, .pdb)
Spheral (.spheral, .sv)
SpyPlot CTH
SpyPlot Case (.case)
SpyPlot History (.hscth)
Stereo Lithography (.stl)
TFT Files
TIFF Image Files
TSurf Files
Tecplot ASCII (.tec, .tp)
Tecplot Binary (.plt)
Tetrad (.hdf5, .h5)
UNIC (.h5)
VASP CHGCA (.CHG)
VASP OUT (.OUT)
VASP POSTCAR (.POS)
VPIC (.vpc)
VRML (.wrl)
Velodyne (.vld, .rst)
VizSchema (.h5, .vsh5)
Wavefront Polygonal Data (.obj)
WindBlade (.wind)
XDMF and hdf5 (.xmf, .xdmf)
XMol Molecule
Loading your data (no filtering)
• Load the data file provided for the school.
• Inspect available variables and ranges.
• Adjust view and display settings as learned above.
• Adjust representation and coloring
• Adjust text and legend
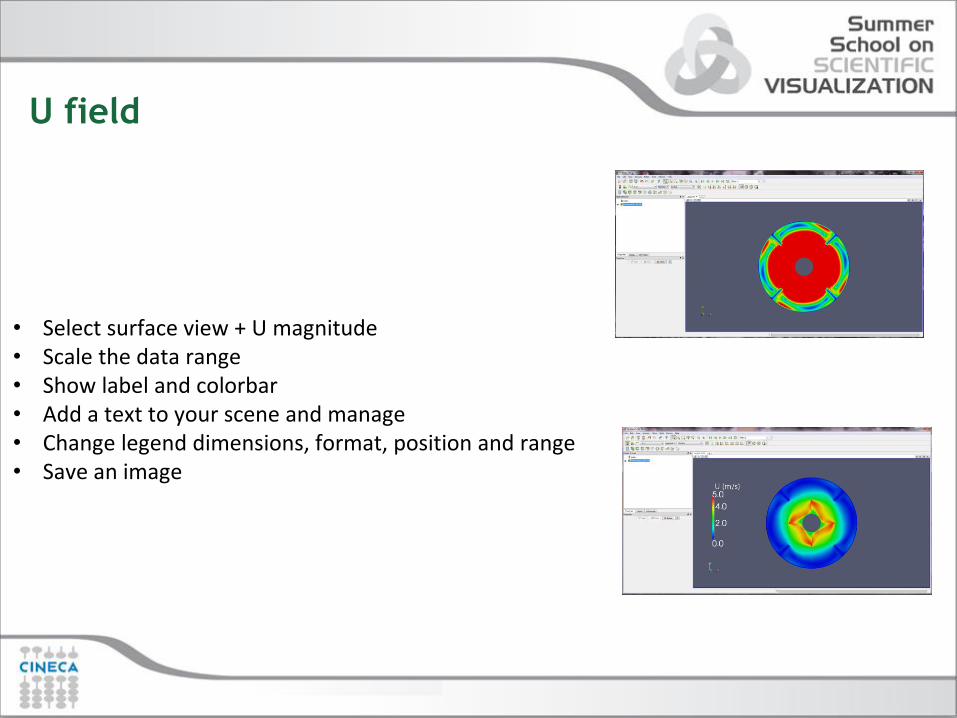
U field
• Select surface view + U magnitude • Scale the data range • Show label and colorbar • Add a text to your scene and manage • Change legend dimensions, format, position and range • Save an image
END OF PART A
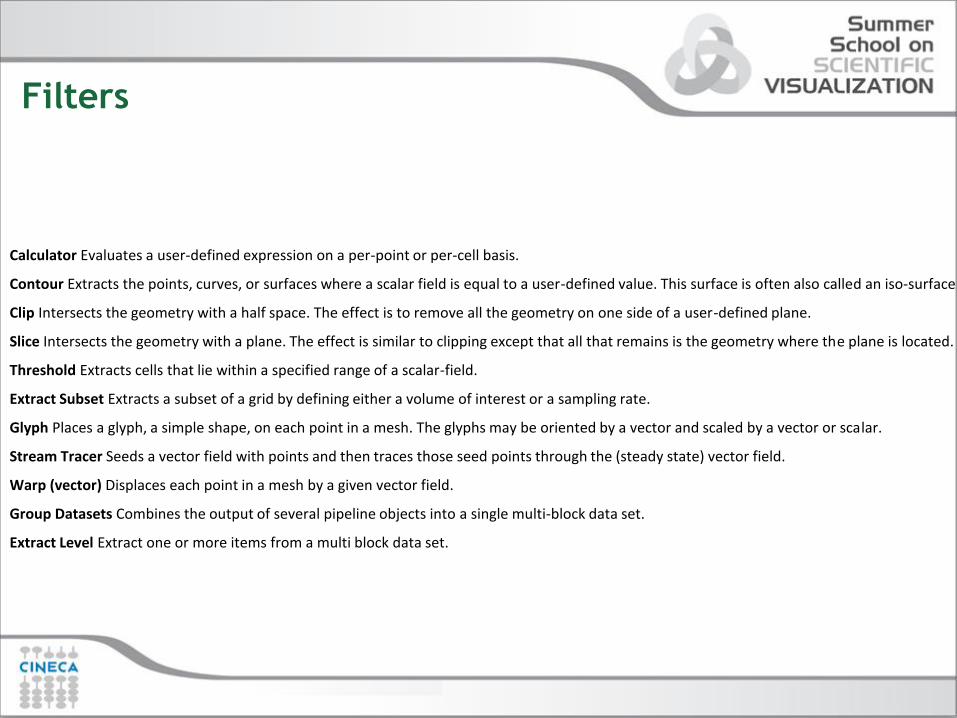
Filters
Calculator Evaluates a user-defined expression on a per-point or per-cell basis.
Contour Extracts the points, curves, or surfaces where a scalar field is equal to a user-defined value. This surface is often also called an iso-surface.
Clip Intersects the geometry with a half space. The effect is to remove all the geometry on one side of a user-defined plane.
Slice Intersects the geometry with a plane. The effect is similar to clipping except that all that remains is the geometry where the plane is located.
Threshold Extracts cells that lie within a specified range of a scalar-field.
Extract Subset Extracts a subset of a grid by defining either a volume of interest or a sampling rate.
Glyph Places a glyph, a simple shape, on each point in a mesh. The glyphs may be oriented by a vector and scaled by a vector or scalar.
Stream Tracer Seeds a vector field with points and then traces those seed points through the (steady state) vector field.
Warp (vector) Displaces each point in a mesh by a given vector field.
Group Datasets Combines the output of several pipeline objects into a single multi-block data set.
Extract Level Extract one or more items from a multi block data set.

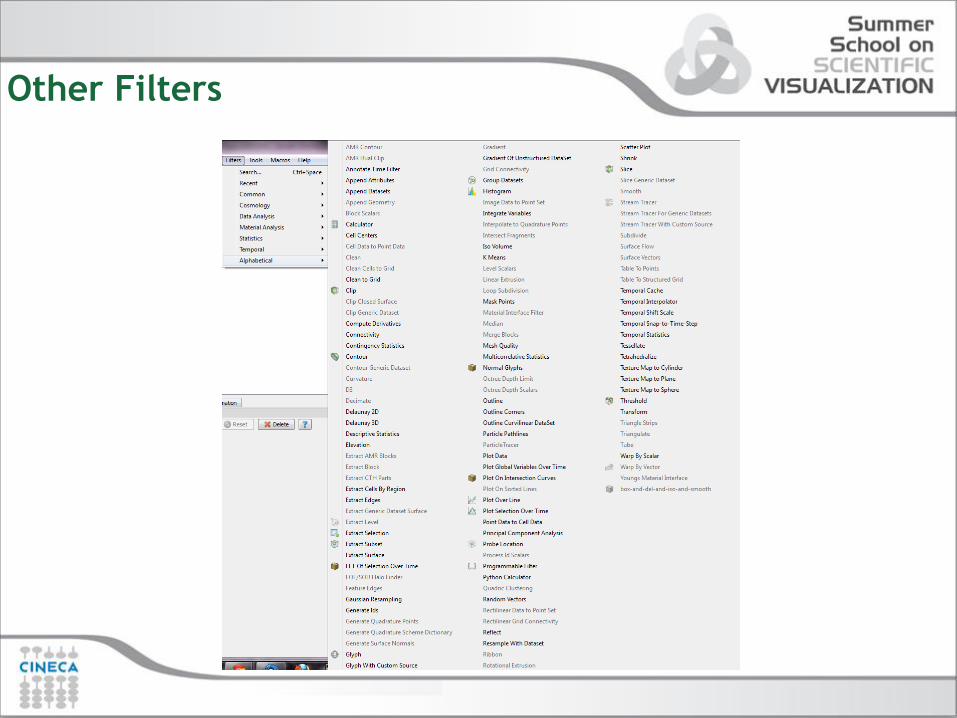
Other Filters
Recent The list of most recently used filters sorted with the most recently used filters on top.
AMR A set of filters designed specifically for data in an adaptive mesh refinement (AMR) structure.
CTH Filters used to process results from a CTH simulation.
Common The most common filters. This is the same list of filters available in the filters toolbar and listed previously.
Cosmology This contains filters developed at LANL for cosmology research.
Data Analysis The filters designed to retrieve quantitative values from the data. These filters compute data on the mesh, extract elements from
the mesh, or plot data.
Material Analysis Filters for processing data from volume fractions of materials.
Statistics This contains filters that provide descriptive statistics of data, primarily in tabular form.
Temporal Filters that analyze or modify data that changes over time. All filters can work on data that changes over time because they are
executed on each time snapshot. However, filters in this category will introspect the available time extents and examine how data changes over
time.
Alphabetical An alphabetical listing of all the filters available. If you are not sure where to find a particular filter, this list is guaranteed to have it.
There are also many filters that are not listed anywhere but in this list.
Other Filters
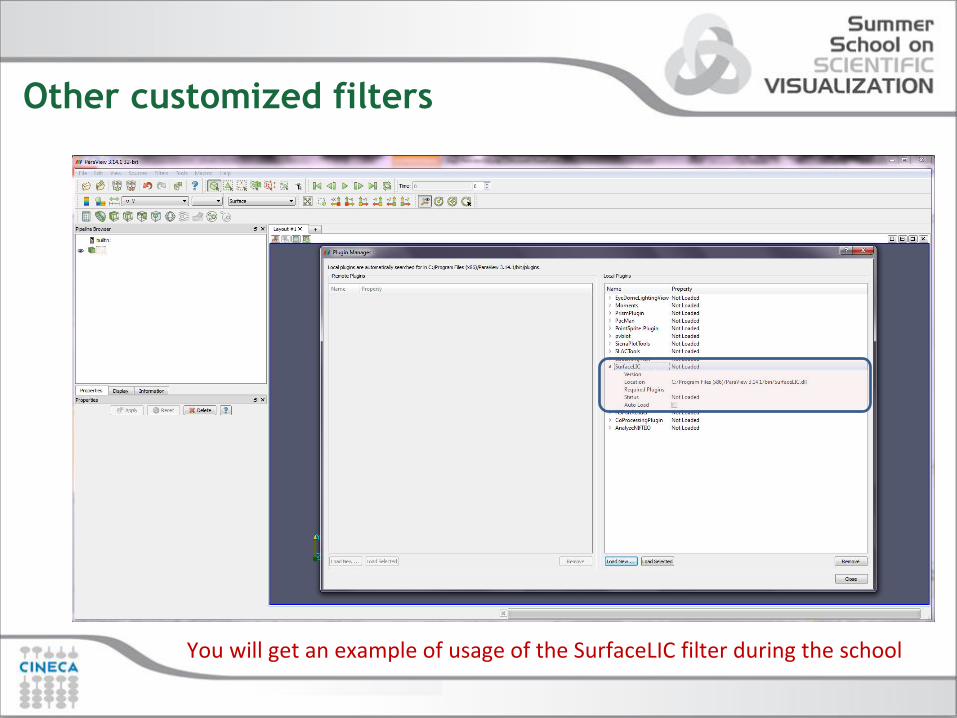
Other customized filters
You will get an example of usage of the SurfaceLIC filter during the school
Working with filters over data
Perform basic filtering on the data provided for the school
• Slicing
• Iso-surface
• Extract surface
• Clipping
• Vectors
• Streamlines

Vectors Visualization
• Select filter for 3d vectors • Select a slice normal to z axis • Select 2d vectors on the slice • Modify vectors aspects
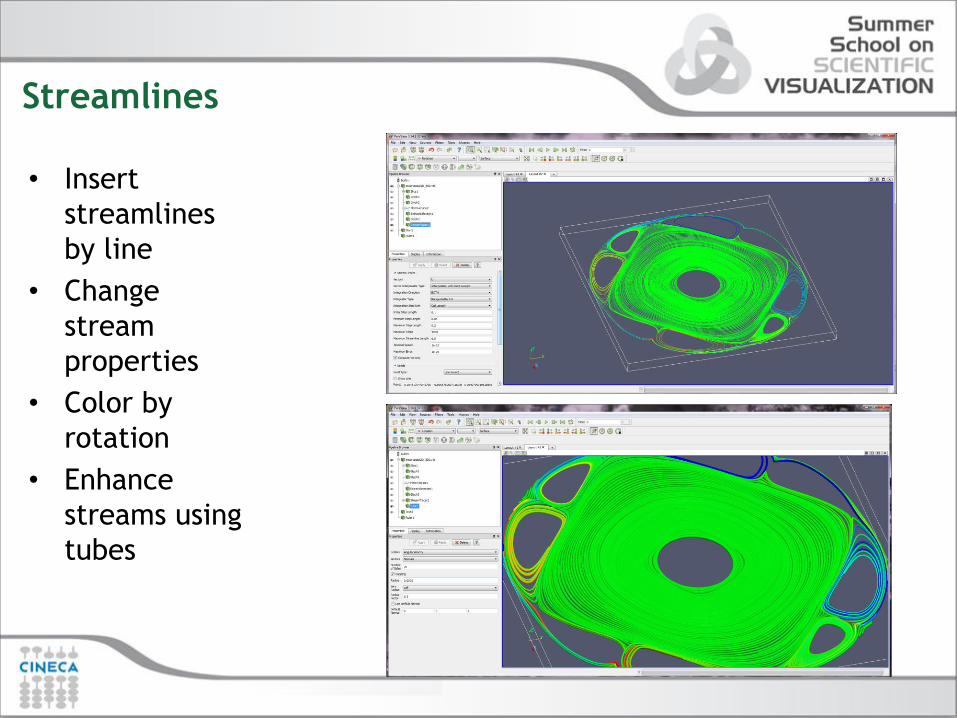
Streamlines
• Insert
streamlines
by line
• Change
stream
properties
• Color by
rotation
• Enhance
streams using
tubes
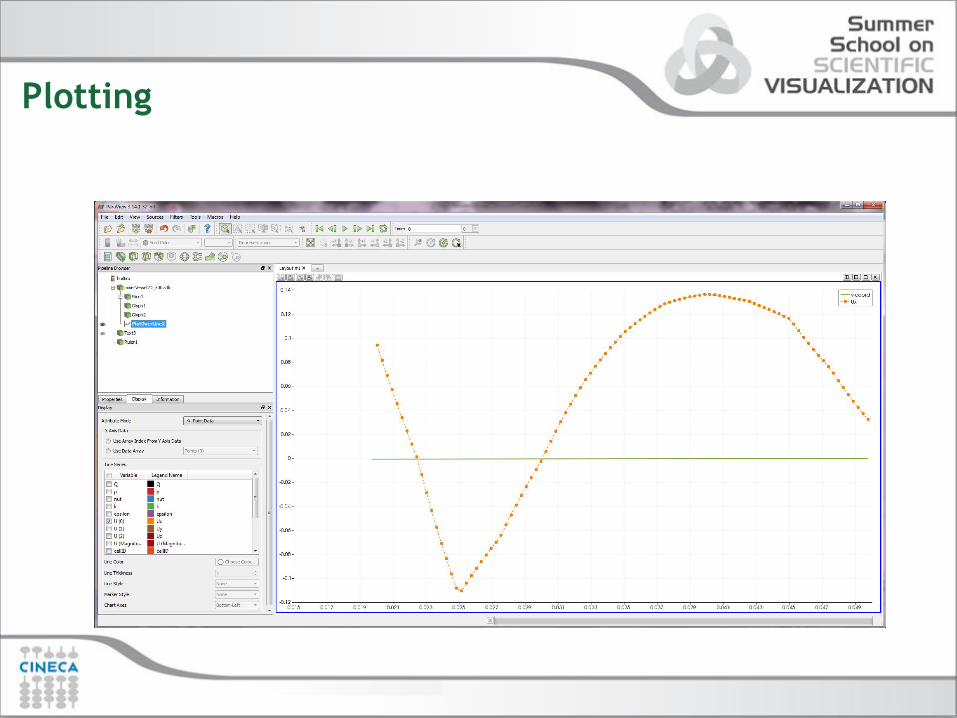
Plotting
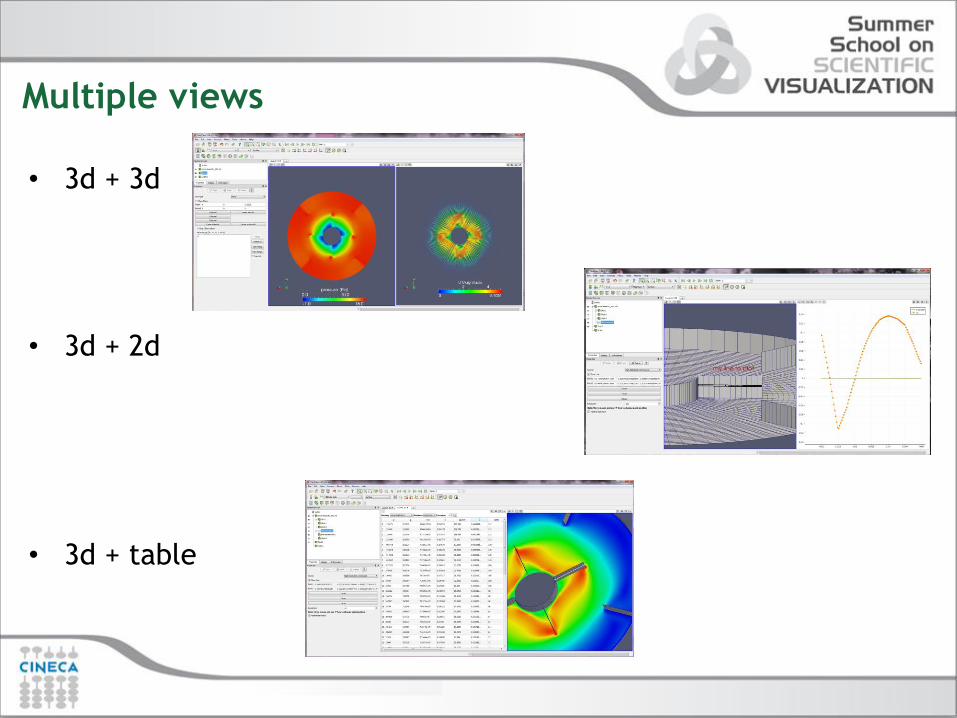
Multiple views
• 3d + 3d
• 3d + 2d
• 3d + table
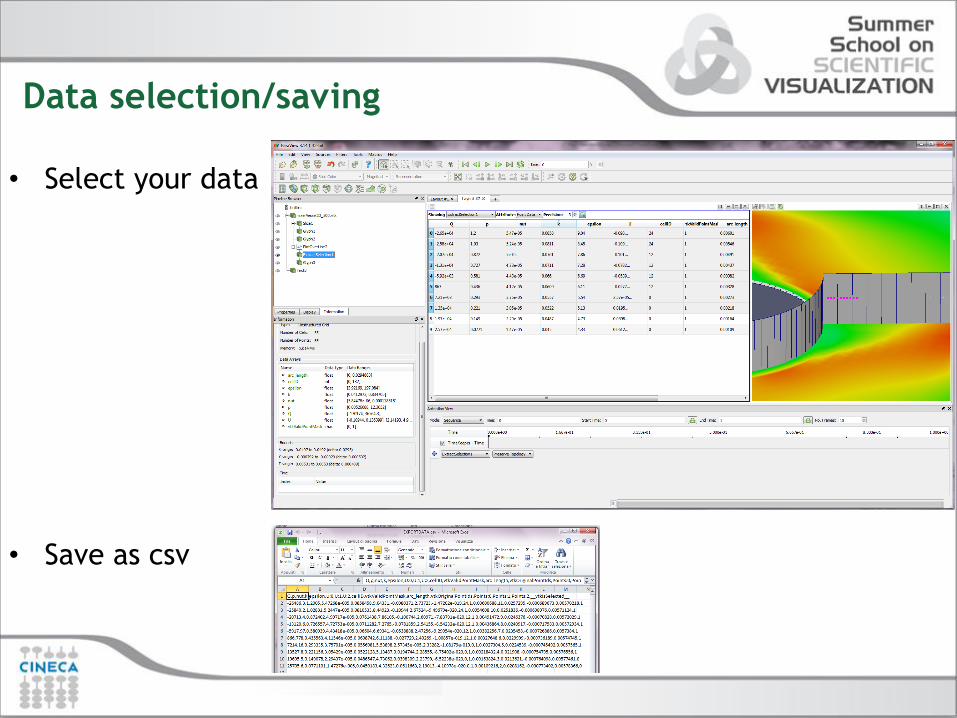
Data selection/saving
• Select your data
• Save as csv
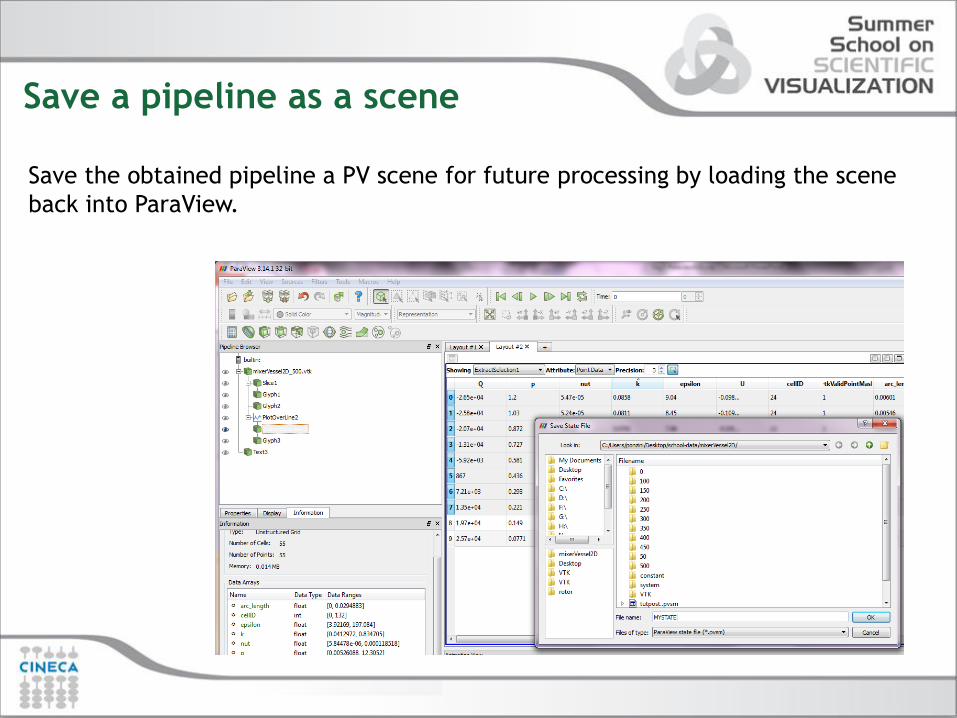
Save a pipeline as a scene
Save the obtained pipeline a PV scene for future processing by loading the scene
back into ParaView.
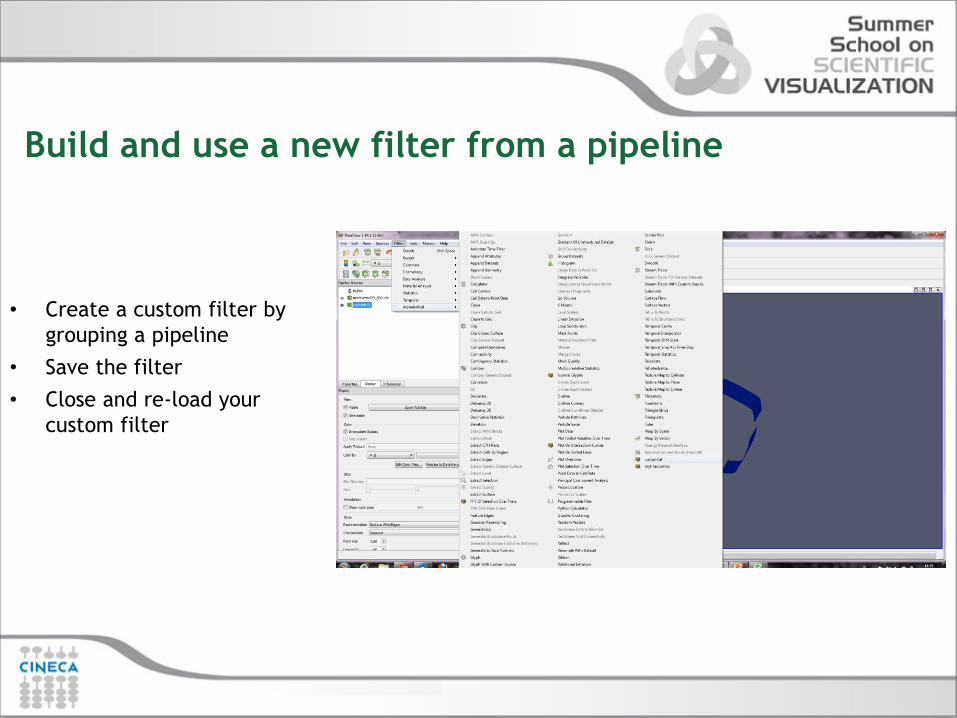
Build and use a new filter from a pipeline
• Create a custom filter by
grouping a pipeline
• Save the filter
• Close and re-load your
custom filter
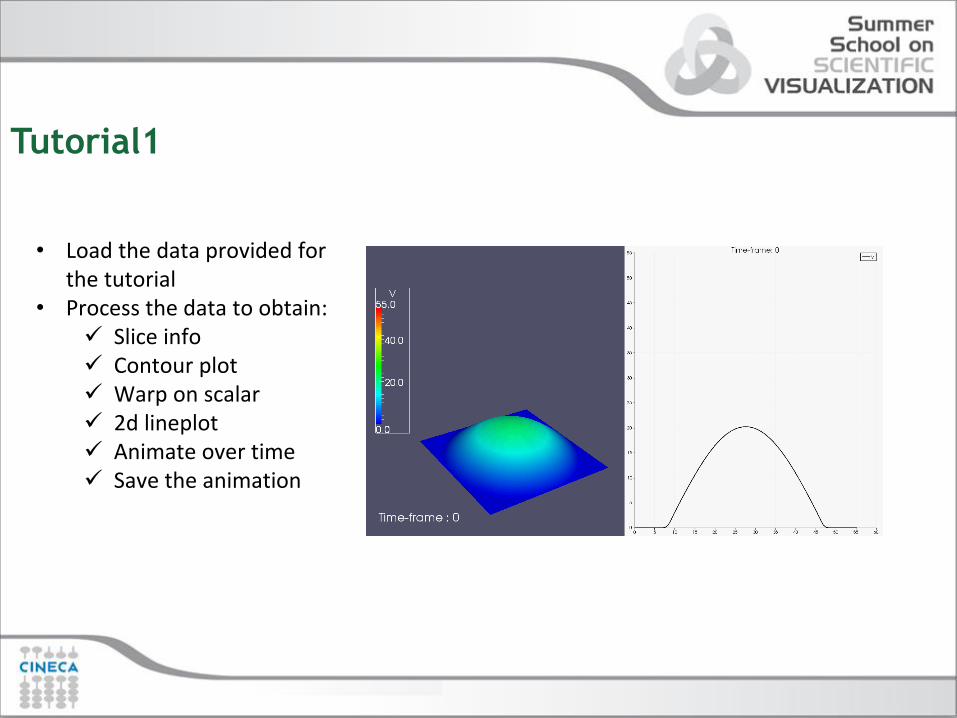
Tutorial1
• Load the data provided for the tutorial
• Process the data to obtain: Slice info Contour plot Warp on scalar 2d lineplot Animate over time Save the animation
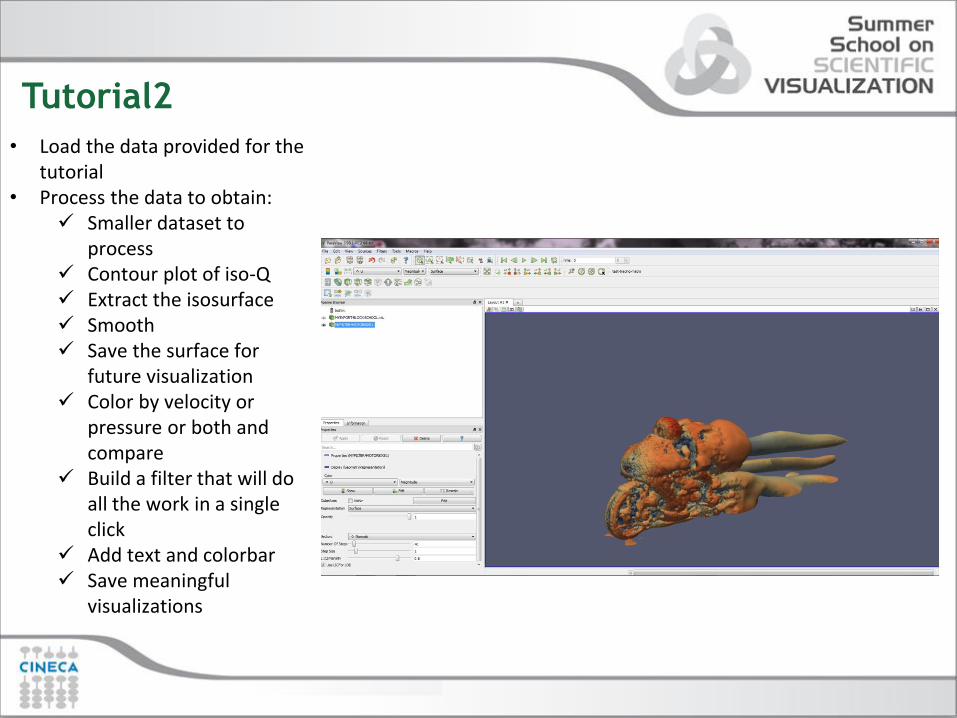
Tutorial2
• Load the data provided for the tutorial
• Process the data to obtain: Smaller dataset to
process Contour plot of iso-Q Extract the isosurface Smooth Save the surface for
future visualization Color by velocity or
pressure or both and compare
Build a filter that will do all the work in a single click
Add text and colorbar Save meaningful
visualizations


