35
Introduct ion to Phylogene tics
| Date post: | 03-Jan-2016 |
| Category: |
Documents |
| Upload: | lesley-james |
| View: | 243 times |
| Download: | 3 times |

Introduction to
Phylogenetics

Phylogenetics • Phylogenetics is the study of evolutionary
relationships among a group of organisms.
• Phylogenetic analysis is the means of inferring or estimating these relationships.
• The result of phylogenetic studies is a hypothesis about the evolutionary history of taxonomic groups: their phylogeny
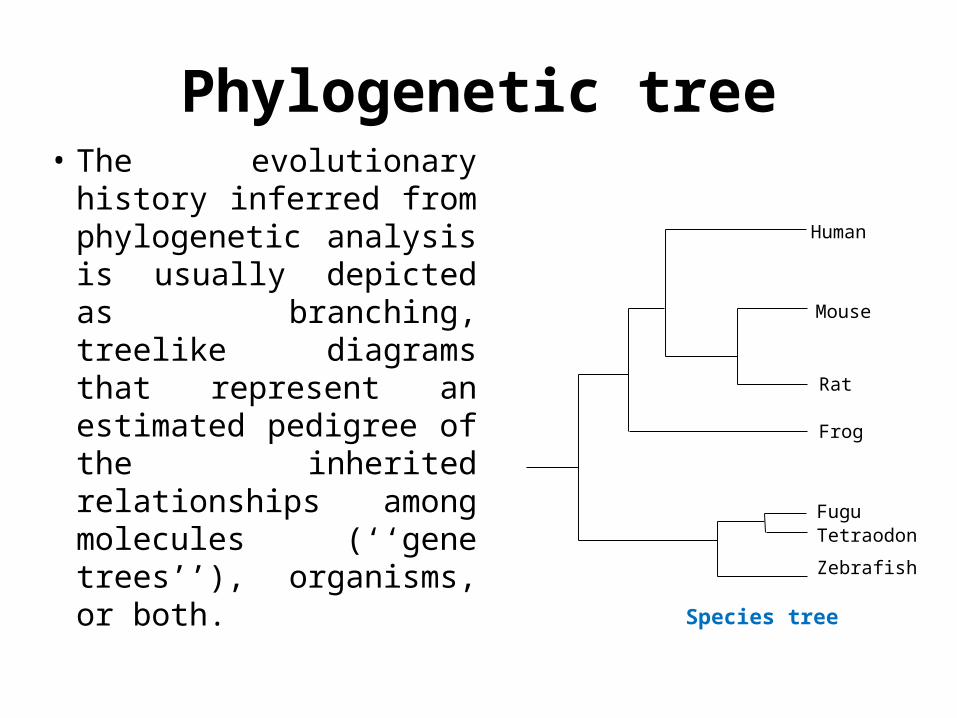
Phylogenetic tree• The evolutionary history
inferred from phylogenetic analysis is usually depicted as branching, treelike diagrams that represent an estimated pedigree of the inherited relationships among molecules (‘‘gene trees’’), organisms, or both.
Human
Mouse
Rat
FuguTetraodon
Zebrafish
Frog
Species tree
Why phylogenetic trees?• Phylogenetic trees are extremely handy tools used by
biologists to understand:
- the composition of genomes,- relationships among genes in humans and other species,- the functions of proteins that run our cells,- historical relationships among diverse species,- the processes that generate unique body shapes, - the origins of remarkable abilities in living organisms,
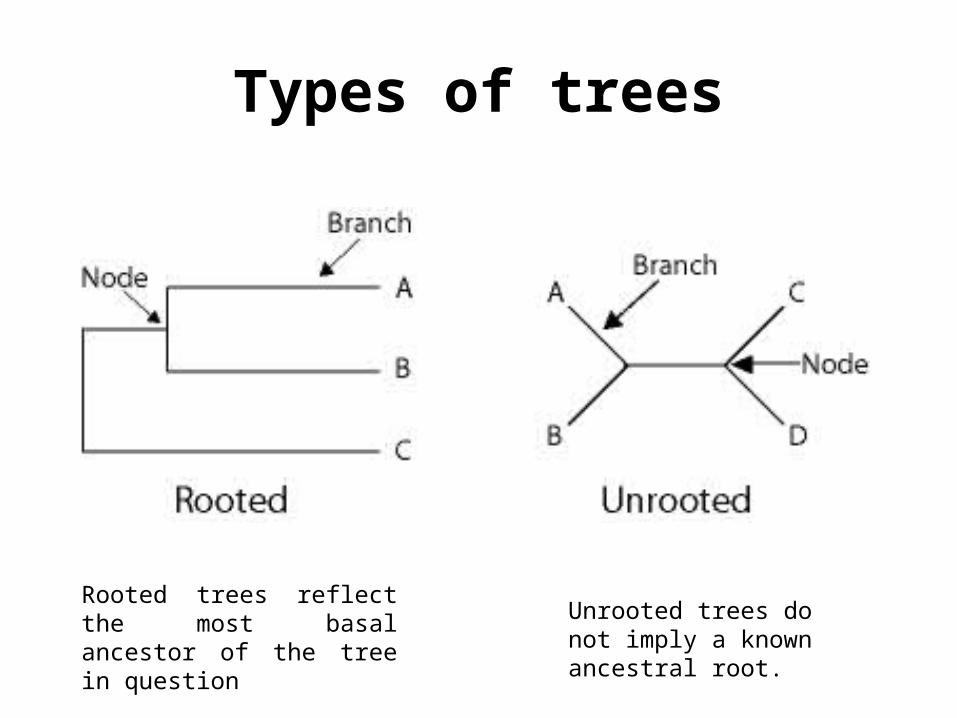
Types of trees
Rooted trees reflect the most basal ancestor of the tree in question
Unrooted trees do not imply a known ancestral root.
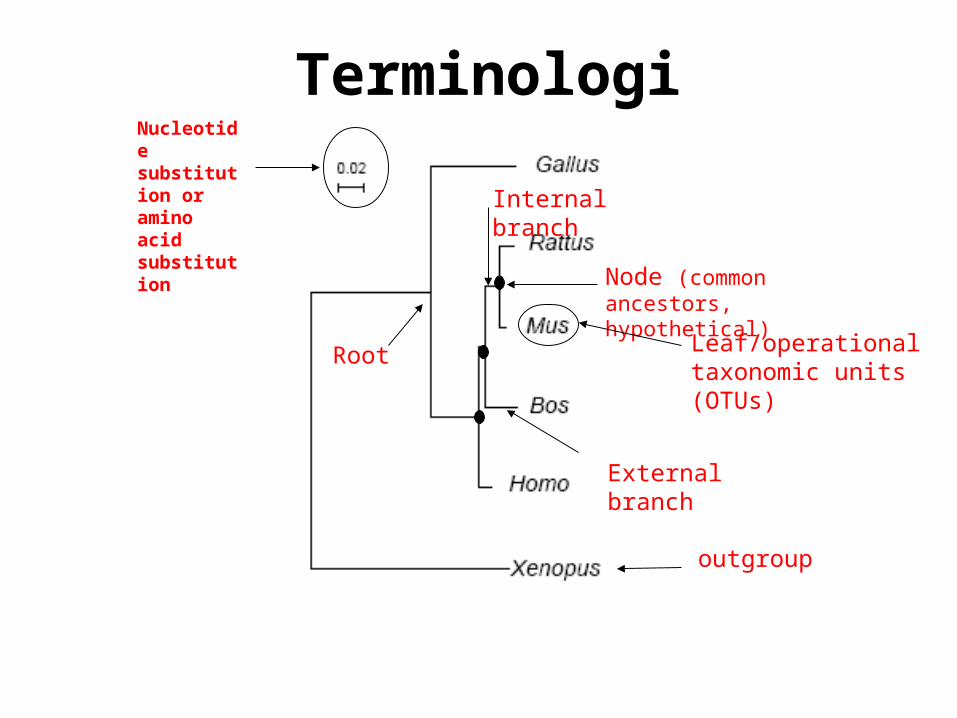
Terminologies
Node (common ancestors, hypothetical)
External branch
Internal branch
Leaf/operational taxonomic units (OTUs)
Root
Nucleotide substitution or amino acid substitution
outgroup
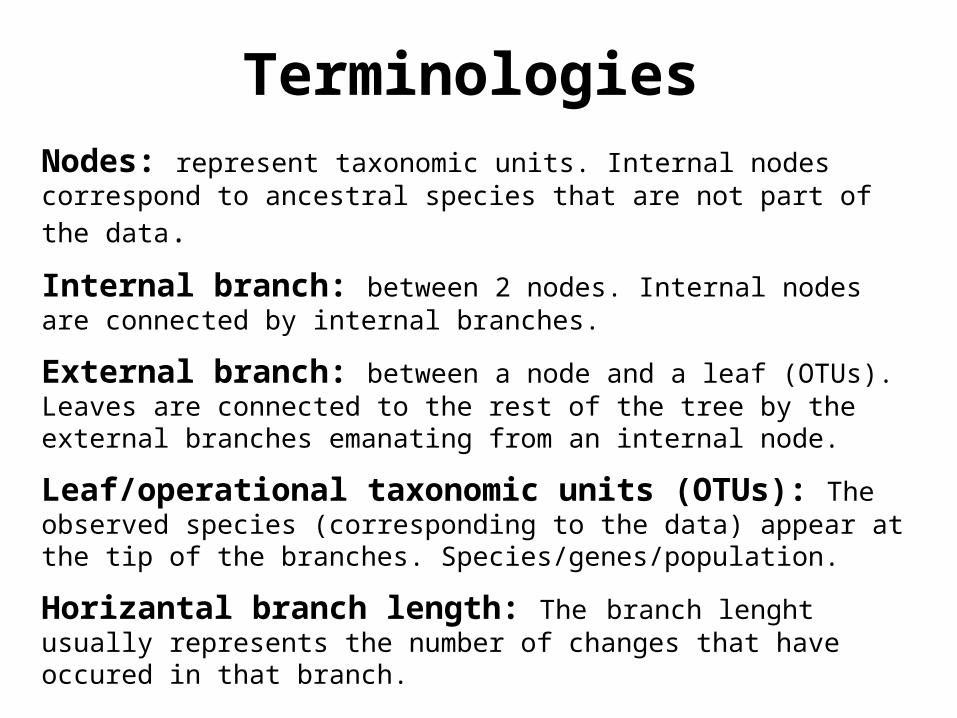
Nodes: represent taxonomic units. Internal nodes correspond to ancestral species that are not part of the data.
Internal branch: between 2 nodes. Internal nodes are connected by internal branches.
External branch: between a node and a leaf (OTUs). Leaves are connected to the rest of the tree by the external branches emanating from an internal node.
Leaf/operational taxonomic units (OTUs): The observed species (corresponding to the data) appear at the tip of the branches. Species/genes/population.
Horizantal branch length: The branch lenght usually represents the number of changes that have occured in that branch.
Terminologies
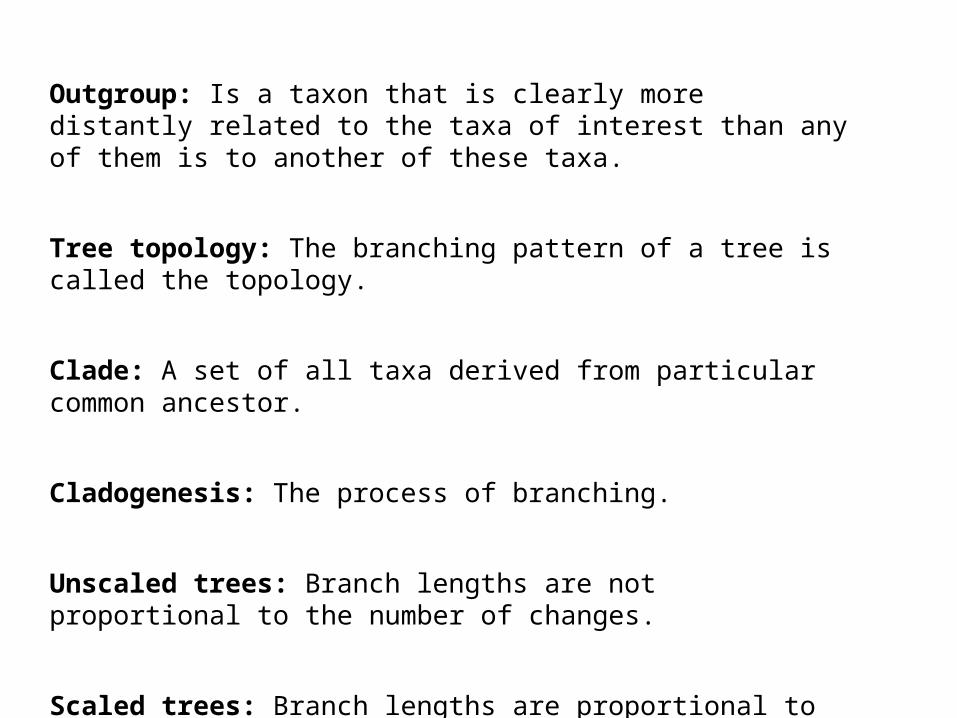
Outgroup: Is a taxon that is clearly more distantly related to the taxa of interest than any of them is to another of these taxa.
Tree topology: The branching pattern of a tree is called the topology.
Clade: A set of all taxa derived from particular common ancestor.
Cladogenesis: The process of branching.
Unscaled trees: Branch lengths are not proportional to the number of changes.
Scaled trees: Branch lengths are proportional to the number of changes

Altering the position of root, changes the meaning of Phylogenetic tree
A
B
C
D
B
A
C
D
C
D
A
B
A
B
C
D
A
B
C
D
D
C
A
B
C and D branch late C and D branch early
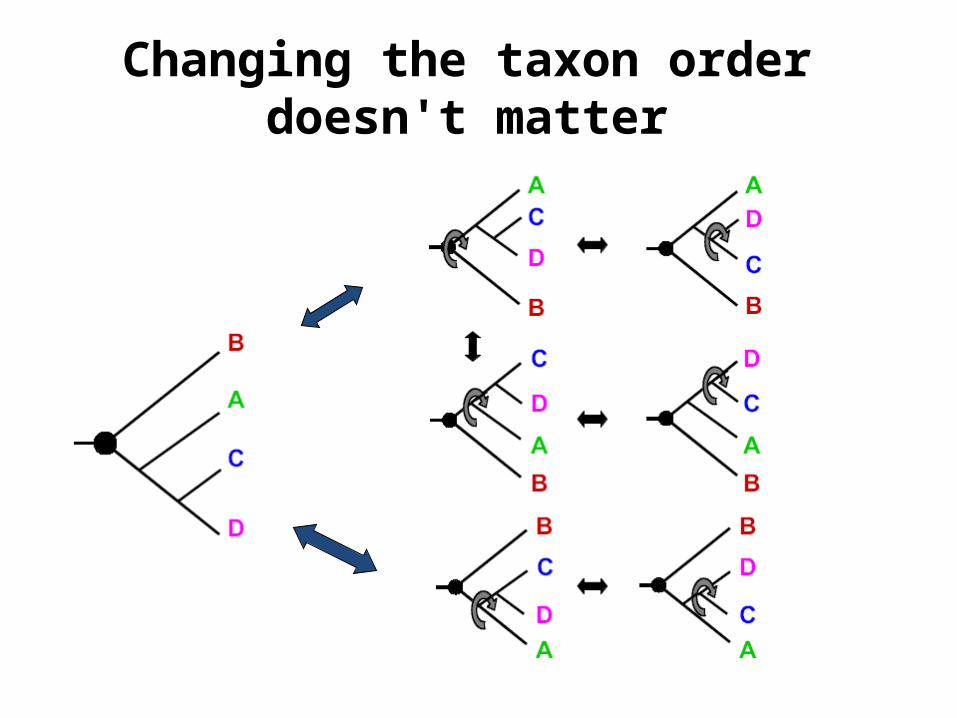
Changing the taxon order doesn't matter

Types of trees
Simply shows relative recency of common ancestor
A cladogram with branch lengths
A dendogram having all tips equidistant from root

Types of Phylogenetic Data
• Biomolecular sequences: DNA, RNA, amino acid, in a multiple alignment
• Molecular markers (e.g., SNPs, RFLPs, etc.)• Morphology• Gene order and content

Molecular DataThere are two types of molecular data: characters and distances
Characters: can be a nucleotide / amino acid at a site in DNA /protein sequence, or the presence or absence of deletion or insertion at a site. That is each nucleotide/amino acid site in a DNA/protein sequence can be consider a character site.
Taxa CharactersSpecies A ATGGCTATTCTTATAGTACGSpecies B ATCGCTAGTCTTATATTACASpecies C TTCACTAGACCT--TGGTCCASpecies D TTGACCAGACCT--TGGTCCGSpecies E TTGACCAGTTCT-- TAGTTCG

Making trees using character-based methods
The main idea of character based methods is to search for a tree that requires the smallest number of evolutionary changes to explain the differences among the OTUs under study.
Such a tree is called maximum parsimonious (“simple”) tree.

As an example of tree-building using maximum parsimony, consider these four taxa:
AAGAAAGGAAGA
How might they have evolved from acommon ancestor such as AAA?

Tree-building methods: Maximum parsimony
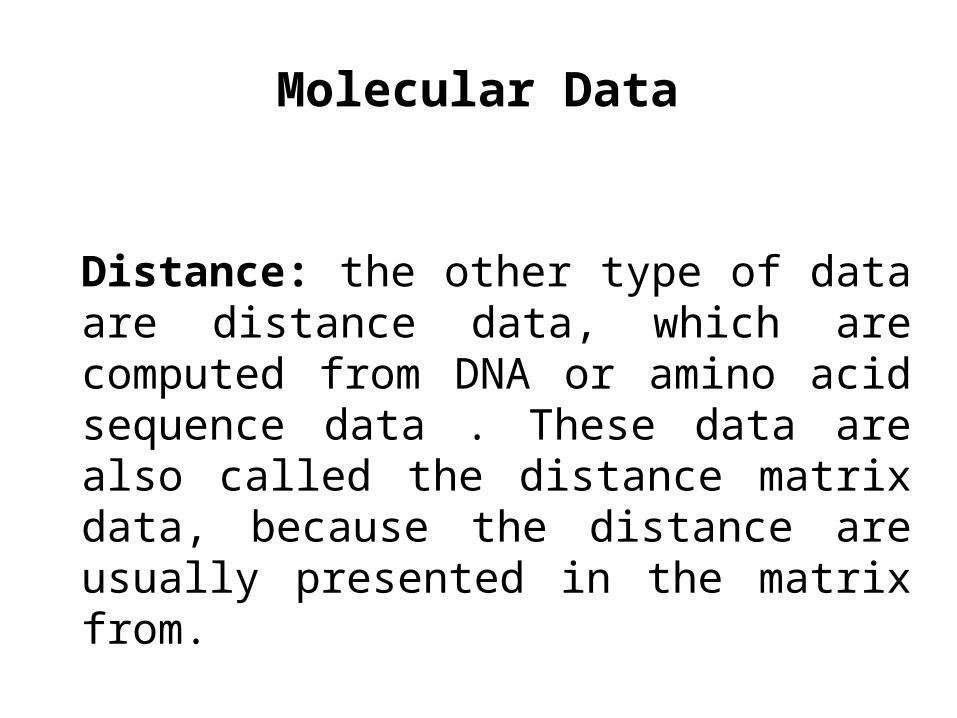
Distance: the other type of data are distance data, which are computed from DNA or amino acid sequence data . These data are also called the distance matrix data, because the distance are usually presented in the matrix from.
Molecular Data

Tree construction using distances

The simplest distance based method is UPGMA
UPGMA employs a sequential clustring algorithm, in which local topological relationships are inferred in order of decreasing similarity and a phylogenetic tree is built in a stepwise manner.
First we identify the two OTUs that are most similar to each other (having the shortest distance) and treat them as a new single OTU.
Such an OTU is is referred to as a composite OTU.
Subsequently from among the new group of OTUs, we identify the pair with the highest similarity and so on, until only two OTUs are left.
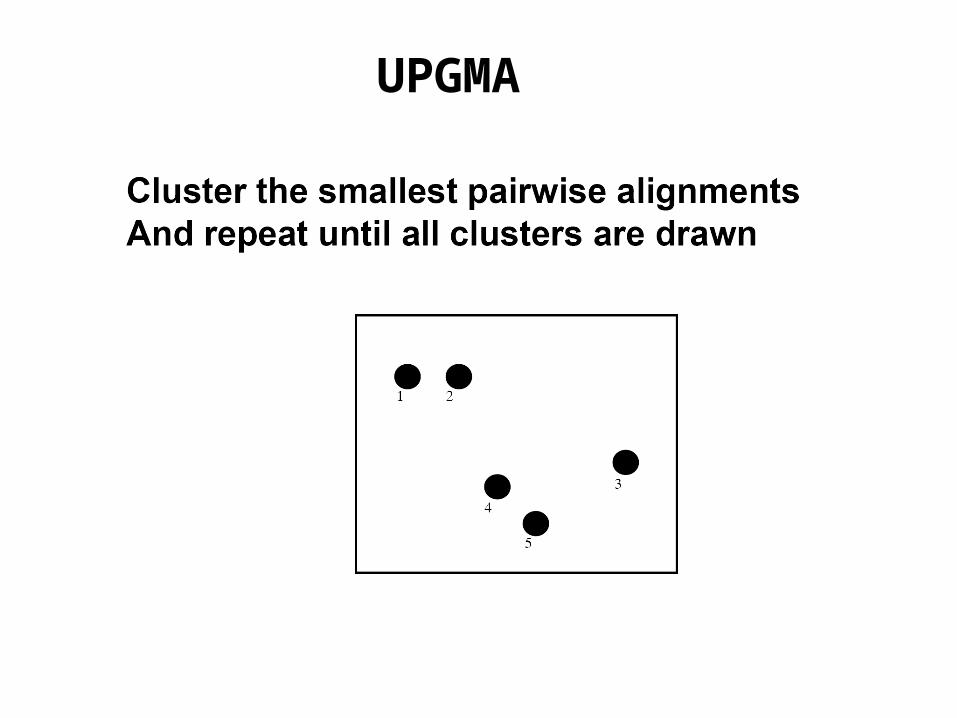
UPGMA


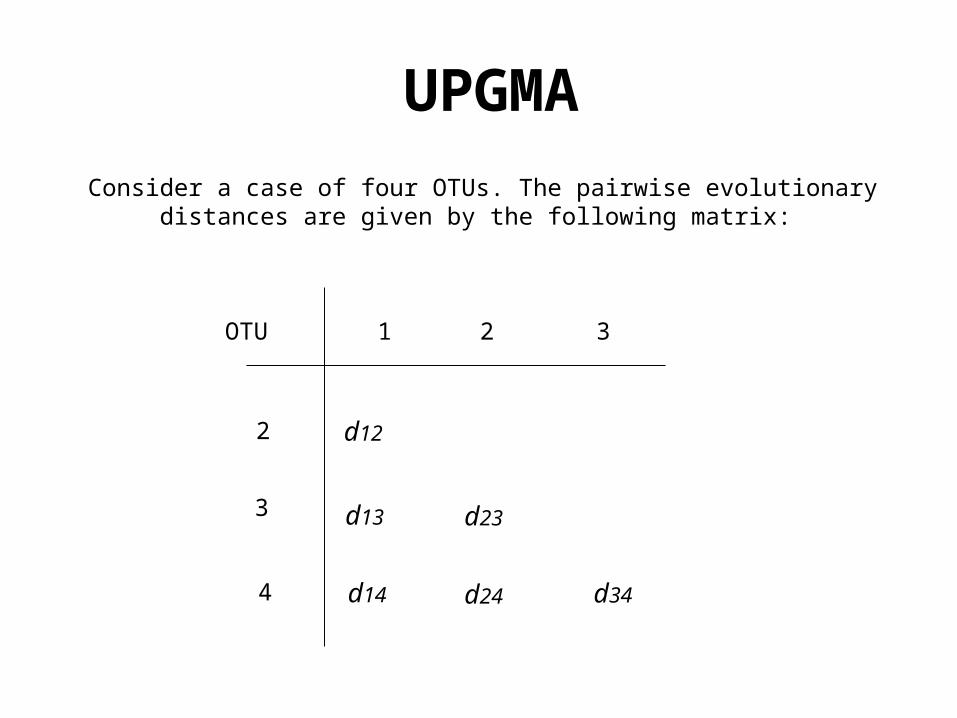
UPGMA
Consider a case of four OTUs. The pairwise evolutionary distances are given by the following matrix:
OTU 1 2 3
2
3
4
d12
d13
d14
d23
d24 d34

UPGMA: Construct a phylogenetic tree following UPGMA algorithm.
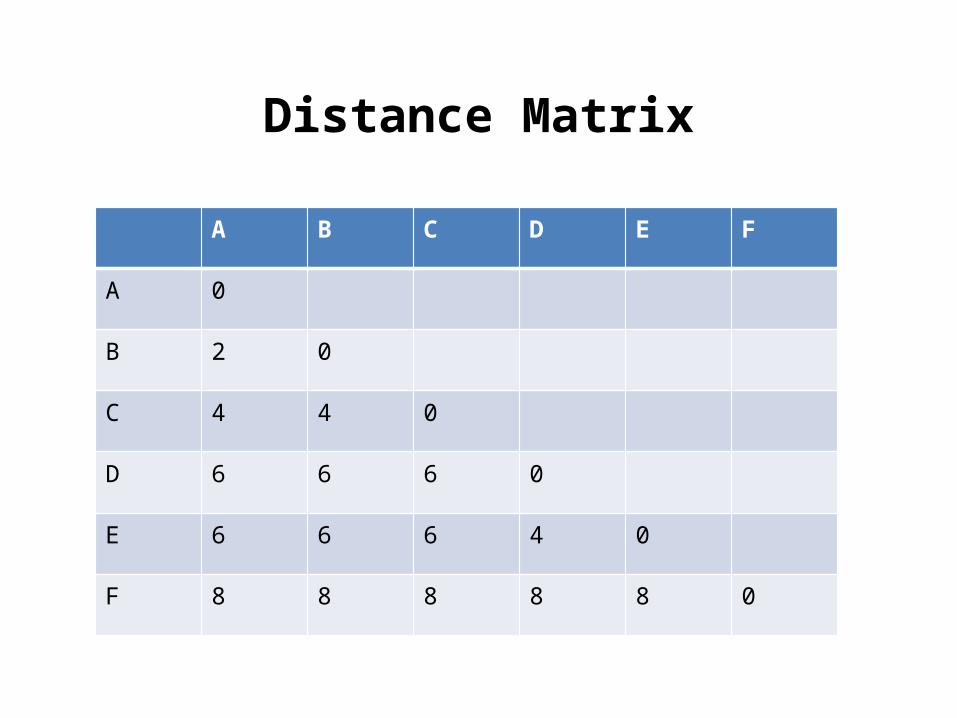
A B C D E F
A 0
B 2 0
C 4 4 0
D 6 6 6 0
E 6 6 6 4 0
F 8 8 8 8 8 0
Distance Matrix

TRY THIS!!!


Neighbor joining Method
Neighbor-joining (Saitou and Nei, 1987) is a method that is related to the cluster method but does not require the data to be ultrametric. In other words it does not require that all lineages have diverged by equal amounts.
The method is especially suited for datasets comprising lineages with largely varying rates of evolution.

Neighbor joining MethodThe neighbor-joining
method Is especially usefulfor making a tree having alarge number of taxa.
Begin by placing all the taxa in a star-like structure.
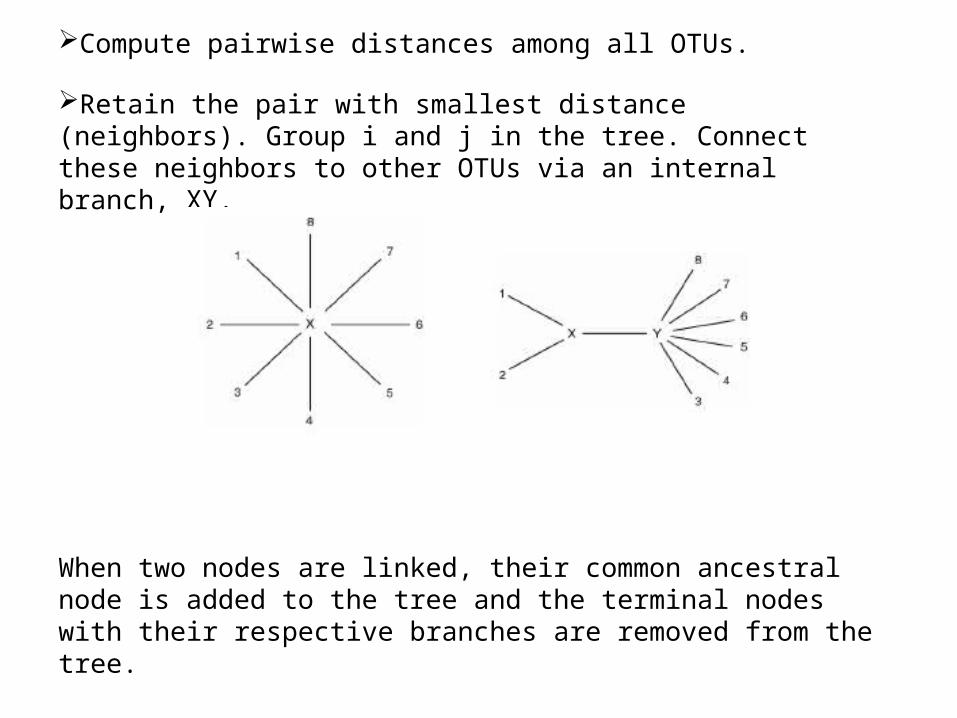
Compute pairwise distances among all OTUs.
Retain the pair with smallest distance (neighbors). Group i and j in the tree. Connect these neighbors to other OTUs via an internal branch, XY.
When two nodes are linked, their common ancestral node is added to the tree and the terminal nodes with their respective branches are removed from the tree.

N=6 N=5 N=4
Neighbor joining Method

Applications of phylogeny
"Species" trees recover the genealogy of taxa, individuals of a population, etc.Internal nodes represent speciation or other taxonomic events.
Species trees should contain sequences from only orthologous genes.

"Gene" trees represent the evolutionary history of the genes included in the study.
Gene trees can provide evidence for gene duplication events, as well as speciation events.
Sequences from different homologs can be included in a gene tree; the subsequent analyses should cluster orthologs, thus demonstrating the evolutionary history of the orthologs.

Tools/Softwares
• CLUSTALWhttp://www.ebi.ac.uk/Tools/services/web/toolform.ebi?
tool=clustalw2• PHYLIPhttp://evolution.genetics.washington.edu/phylip.html• PAUPhttp://paup.csit.fsu.edu/• Mega5• http://www.ncbi.nlm.nih.gov/pubmed/215463
53


