26
March 12, 2009 Intro to RTSA 1 Introduction to Real-Time Spectrum Analysis. ing. Gianfranco Miele TRIGGER CAPTURE ANALYZE

March 12, 2009 Intro to RTSA1
Introduction to Real-Time Spectrum Analysis.
ing. Gianfranco Miele
TRIGGER CAPTURE ANALYZE

March 12, 2009 Intro to RTSA2
Technology Trends in RF
Wireless is everywhere
RF prevalent across a broad range of industries
Crowded RF spectrum
Increased surveillance and intelligence gathering
Accelerating shift to Digital RF, fully leveraging computer technologies
March 12, 2009 Intro to RTSA3
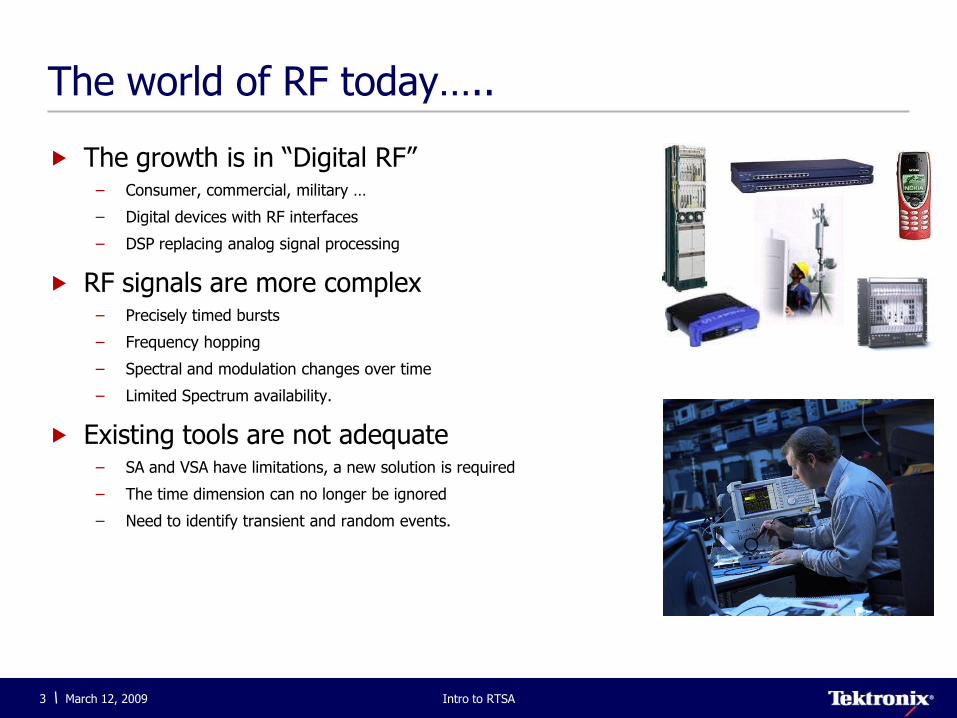
The world of RF today…..
The growth is in “Digital RF”– Consumer, commercial, military …
– Digital devices with RF interfaces
– DSP replacing analog signal processing
RF signals are more complex– Precisely timed bursts
– Frequency hopping
– Spectral and modulation changes over time
– Limited Spectrum availability.
Existing tools are not adequate– SA and VSA have limitations, a new solution is required
– The time dimension can no longer be ignored
– Need to identify transient and random events.

March 12, 2009 Intro to RTSA4
Evolution of Signal Analysis Techniques
SA
Market
Drivers
Measurement
Challenges
Solutions
VSA
RTSA1960s 1990s TODAY
• Military
• Communication systems
• Emerging solid state technology
• High frequency measurements
• Analog modulation
• Encryption
• Military signal intelligence
• Cell phones
• Complex digital modulation
• Digital Demodulation
• Emergence of Standards
• Congested RF spectrum• Pervasiveness of low cost RF
in consumer electronics• Growth of DSP-based,
modulation-agile communication systems
• Time-varying, bursted, and transient RF signals
• Complexity of wireless communication standards
• RF power vs. frequency
• Low noise floor
• High dynamic range
• Digital modulation analysis
• Flexible time-correlated multi-domain analysis
• Seamless capture of RF signals changing over time
• Frequency domain trigger

March 12, 2009 Intro to RTSA5
Why Current Solutions Aren’t Adequate
SA Short-Comings
Limited digital modulation analysis
No frequency change over time
No frequency domain triggering
Swept acquisition
No memory
Single domain views
VSA Short-Comings
Poor Spectrum Analyzer performance – Limited dynamic range– Controls and human interface unfamiliar to SA users
No frequency domain trigger– Misses transient events– No analysis reference to time.
No multi domain correlated views.

March 12, 2009 Intro to RTSA6
Time-correlated Multi-domain Analysis
Time-correlatedmulti-domain display
Error vectormeasurements
Time vs. Power view
Constellation view
Frequency vs.Power view

March 12, 2009 Intro to RTSA7
Traditional Swept Architecture
Display
Resolution Bandpass
Filter
Input
Local
OscillatorTime
Sweep

March 12, 2009 Intro to RTSA8
Real-time Architecture

March 12, 2009 Intro to RTSA9
Swept vs. Real-time Seamless Capture
Real-Time Analyzers
Swept Analyzers
FREQUENCY
TIME
FREQUENCY

March 12, 2009 Intro to RTSA10
the signal seamlessly in time, into memory
on an RF signal based on power or frequency characteristics
Real-time Spectrum Analysis
Trigger |
Capture |
Analyze |
Time Domain Frequency Domain Modulation Domain
the signal simultaneously in multiple domains

March 12, 2009 Intro to RTSA11
Trigger on any event
Frame 1 Frame 2 Frame 3 Frame 4 Frame N
Analyze the Frequency Domain over time – FFT produces frequency
domain
Signal is stored into memory
Capture the Signal seamlessly, frame by frame, into Memory
Real Time Spectrum Analyzer ConceptsThe Real Time Spectrum Analyzer Process

March 12, 2009 Intro to RTSA12
Basic Operation of RTSA (1)How does a user capture X seconds of data?
Use TIMING menu to set acquisition length to X seconds
RTSA captures X seconds of signal information in a single block
Block consists of “n” frames, each with 1024 samples
The frames are captured and stored into memory one at a time– No gaps between the frames
Time to acquire 1 block (n frames) = acquisition length
Frame 1 Frame 2 Frame 3 Frame 4 Frame n
Time
Time to Acquire 1 Frame = Frame Acquisition Time
1024 Samples per frame (fixed)

March 12, 2009 Intro to RTSA13
Basic Operation of RTSA (2)Turning Time into Frequency
RTSA performs FFT on each individual frame resulting in “n” spectra
These “n” spectra represent a seamless history of the frequency domain characteristics
Frame 1 Frame 2 Frame 3 Frame 4 Frame n
Spectrum 4 Spectrum nSpectrum 3Spectrum 2Spectrum 1

March 12, 2009 Intro to RTSA14
Frequency/Time Tradeoffs
Wider capture bandwidth
Frequency domain effects– Sample rate increases– RBW increases– Freq resolution decreases
Time domain effects– Time resolution increases– Frame length decreases– Max record length decreases
Narrower capture bandwidth
Frequency domain effects– Sample rate decreases– RBW decreases– Freq resolution increases
Time domain effects– Time resolution decreases– Frame length increases– Max record length increases
Capture
Wide span Narrow Span

March 12, 2009 Intro to RTSA15
Frequency/Time Tradeoff Example
Capture bandwidth = 15 MHz
Frequency domain effects– Sample rate = 25.6 Msps– NBW = 43.7 kHz– Freq resolution = 25.0 kHz
Time domain effects– Time resolution = 39.0 nsec– Frame length = 40.0 usec– Max record length = 2.56 sec
(for RSA3300A w/Opt 02 - 256 MB RAM)
Capture bandwidth = 1 kHz
Frequency domain effects– Sample rate = 1.6 ksps– NBW = 2.67 Hz– Freq resolution 1.56 Hz
Time domain effects– Time resolution = 625 usec– Frame length = 640 msec– Max record length = 11.4 hours
(for RSA3300A w/Opt 02 - 256 MB RAM)
Capture
15 MHz 1 kHz

March 12, 2009 Intro to RTSA16
Frequency Mask Trigger
Define a frequency mask which can be used to trigger on specific events in the frequency domain
Reliably detect and capture elusive RF signals that a level trigger cannot see in a crowded spectral environment
March 12, 2009 Intro to RTSA17
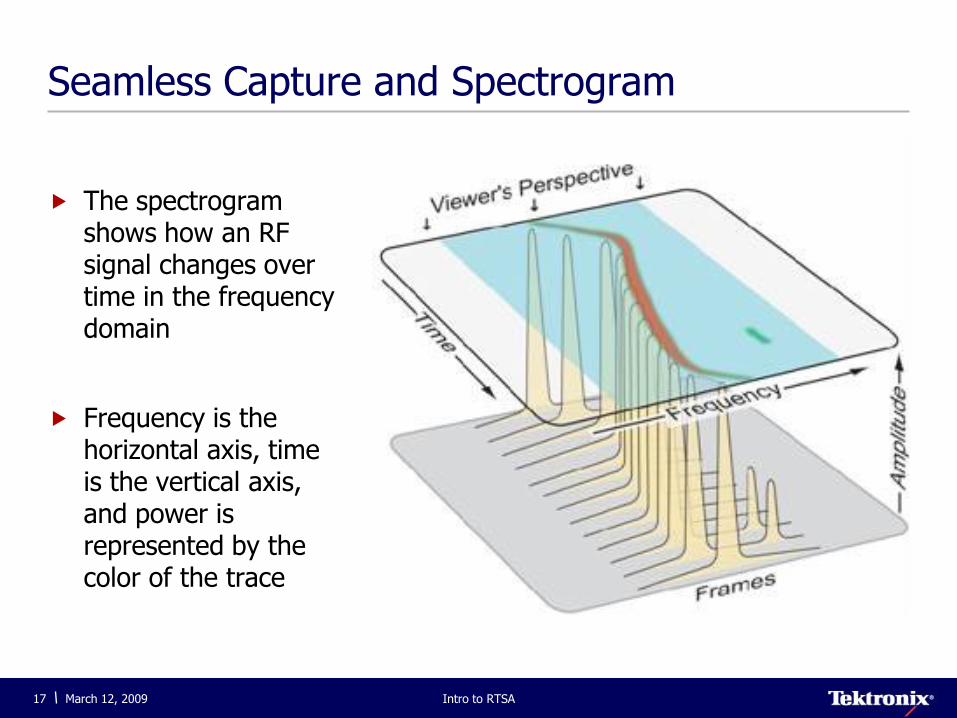
Seamless Capture and Spectrogram
The spectrogram shows how an RF signal changes over time in the frequency domain
Frequency is the horizontal axis, time is the vertical axis, and power is represented by the color of the trace

March 12, 2009 Intro to RTSA18
Real Time Spectrum Analyzer ConceptsThe Real Time Spectrum Analyzer Advantage
Trigger on any change in the monitored spectrum
Seamlessly capture and store a span of RF frequencies at once
Analyze how the frequency and amplitude changes over time

March 12, 2009 Intro to RTSA19
Real Time Spectrum Analysis Capabilities Analysis -Practical Examples
Spectrogram shows frequency domain behavior over time with amplitude
Spectrum view shows an instantaneous spectrum at the selected moment of time
Analyzer Settings:– Span 5 MHz
– Acquisition length 16ms
– Spectrum frame time 160s
Measuring Pulsed/Burst Signal

March 12, 2009 Intro to RTSA20
Real Time Spectrum Analysis Capabilities Analysis -Practical Examples

March 12, 2009 Intro to RTSA21
New RTSA Capability: Overlapping FFTs
Signal Captured in the Time Domain
1024 Samples 1024 Samples
Acquired Signal Data Transformed into FFT Frames, No Overlap Processing
1024 Samples 1024 Samples 1024 Samples 1024 Samples
Acquired Signal, Post-Processed with Overlap FFTs
1024 Samples1024 Samples
1024 Samples
1024 Samples
1024 Samples
1024 Samples
Overlap Interval Samples
FFT Overlap Samples

March 12, 2009 Intro to RTSA22
Overlapping FFT

March 12, 2009 Intro to RTSA23
Overlapping FFT continued
March 12, 2009 Intro to RTSA24
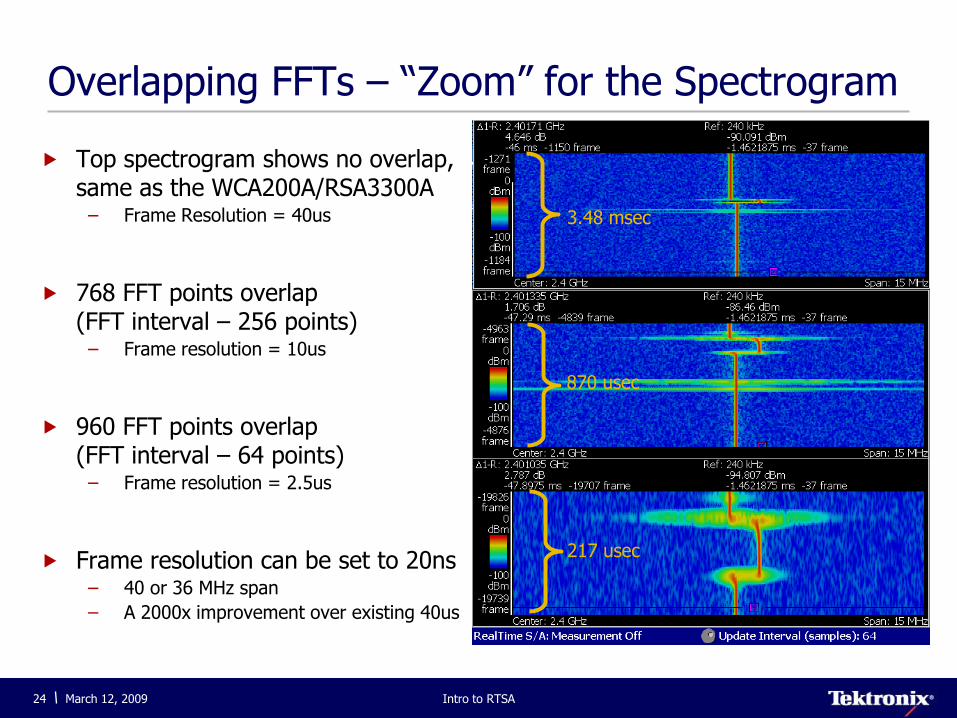
Top spectrogram shows no overlap, same as the WCA200A/RSA3300A
– Frame Resolution = 40us
768 FFT points overlap (FFT interval – 256 points)
– Frame resolution = 10us
960 FFT points overlap (FFT interval – 64 points)
– Frame resolution = 2.5us
Frame resolution can be set to 20ns– 40 or 36 MHz span
– A 2000x improvement over existing 40us
3.48 msec
870 usec
217 usec
3.48 msec
870 usec
217 usec
Overlapping FFTs – “Zoom” for the Spectrogram

March 12, 2009 Intro to RTSA25
Zooming into the Spectrogram display
Without overlapping FFTs With overlapping FFTs
Chirped Radar

March 12, 2009 Intro to RTSA26
Three Measurement Modes
1. S/A Mode:– Real-time spectrum analysis– Traditional spectrum analysis
2. DEMOD Mode:– General purpose analog modulation analysis– General purpose digital modulation analysis – Standards based modulation analysis
3. TIME Mode:– Time domain transient analysis– CCDF analysis
Analyze


