Page 1
© Renishaw Diagnostics LtdSlide 1
Introduction to SERS applicationsSense ‘13, VTT, Espoo
Dr. David EustaceCommercial Business Manager
Renishaw Diagnostics LtdNova Technology ParkGlasgowUK
www.RenishawDiagnostics.com
Page 2
EU FP-7 PHOTOSENS Project
Slide 2 © 2011 Renishaw Diagnostics Ltd.Confidential
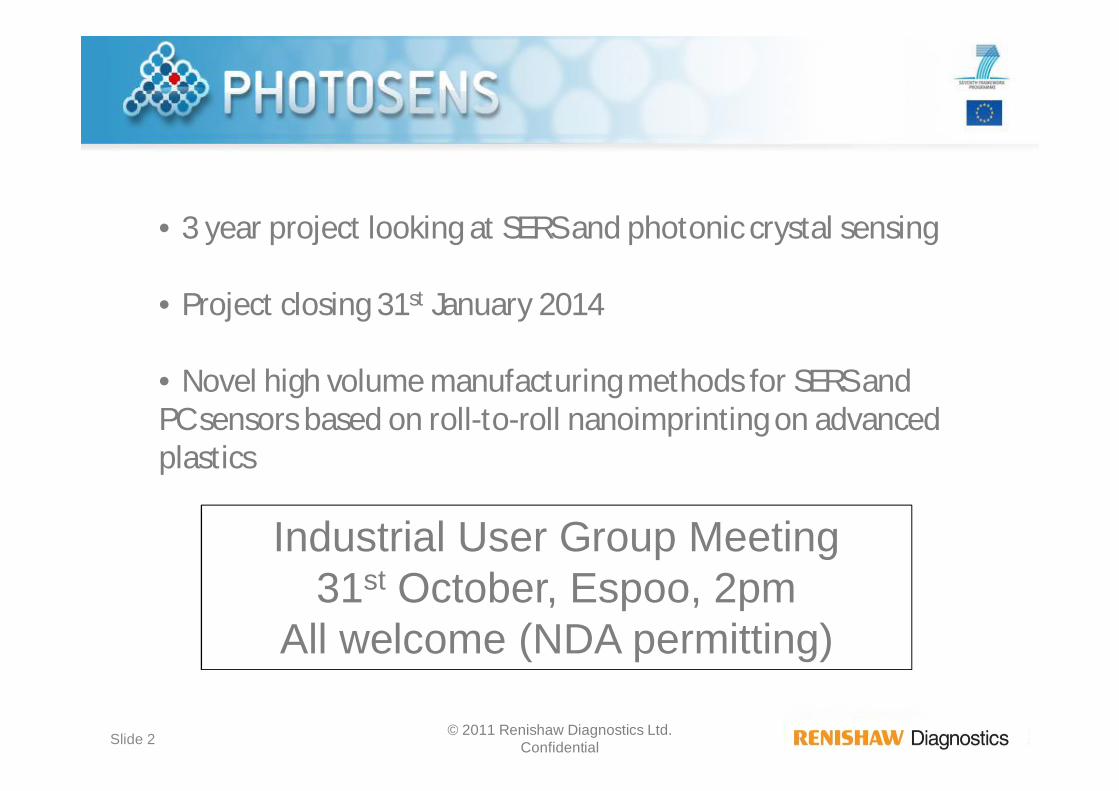
• 3 year project looking at SERS and photonic crystal sensing
• Project closing 31st January 2014
• Novel high volume manufacturing methods for SERS andPC sensors based on roll-to-roll nanoimprinting on advancedplastics
Industrial User Group Meeting31st October, Espoo, 2pm
All welcome (NDA permitting)
Page 3
Slide 3 © Renishaw Diagnostics Ltd.
Contents
• Intro to Renishaw Diagnostics
• Surface enhanced Raman scattering (SERS)
• Klarite SERS substrates, applications
• RenDx™ DNA detection using SERRS
• RenDx RUO Product
Page 4
Slide 4
Introduction to Renishaw Diagnostics Ltd
• Formed in July 2007 as D3 Technologies Ltd
• Spin out from University of Strathclyde, with seed funding fromScottish Enterprise
• Acquired analytical business unit of Mesophotonics (July 07)
• Expanded facility in June 2010 to ~6000 sq.ft
• 25 full time multidisciplinary staff, expanding
• Renishaw plc – majority shareholder
• Molecular diagnostics focus with research in adjacent sectors
©Renishaw Diagnostics Ltd
Page 5
Slide 5
Core Competence & IP
• World-leading centre for the exploitation of SurfaceEnhanced Resonance Raman Spectroscopy (SERRS)for clinical research and molecular diagnosticsapplications
• Unique combination of IP and expertise
• Proprietary Raman substrates
• Advanced biology, chemistry and biochemistry
• Fully regulatory compliant organisation; ISO13485accredited.
©Renishaw Diagnostics Ltd
Page 6
Slide 6
What is SERS? (simple version!)
• SERS is a laser based optical spectroscopy which creates enhancedscattering from a molecule absorbed onto a ‘roughened’ metal surface
Laser induces vibration andcauses light to scatter
Molecule on active surface givesmuch stronger scattering
Each vibration generates aunique peak in the spectra.
Corrugatedmetal surface
Laser1
2 34
SERS signal5
©Renishaw Diagnostics Ltd
Page 7
Slide 7 © Renishaw Diagnostics Ltd.
What is SERS?
• Corrugated metal surfaces dramatically increase efficiency of light coupling into andout of molecules (>106)
• Enhancement of Raman scattering due a combination of:– Electromagnetic effect (largest contribution)
• Molecule vibrations are much stronger in strong plasmon electromagnetic fields• Enhancement factor >104
• Well proven
– Chemical effect (minor contribution)• Molecule-metal bond (adsorption) favour direct transfer of energy into the molecule• Enhancement factor ~102
• Still unclear and debated
inin
First experimental observation: pyridine on roughened Ag electrodes Chem. Phys. Lett. 26 163 (1974)
Page 8
Slide 8 © Renishaw Diagnostics Ltd.
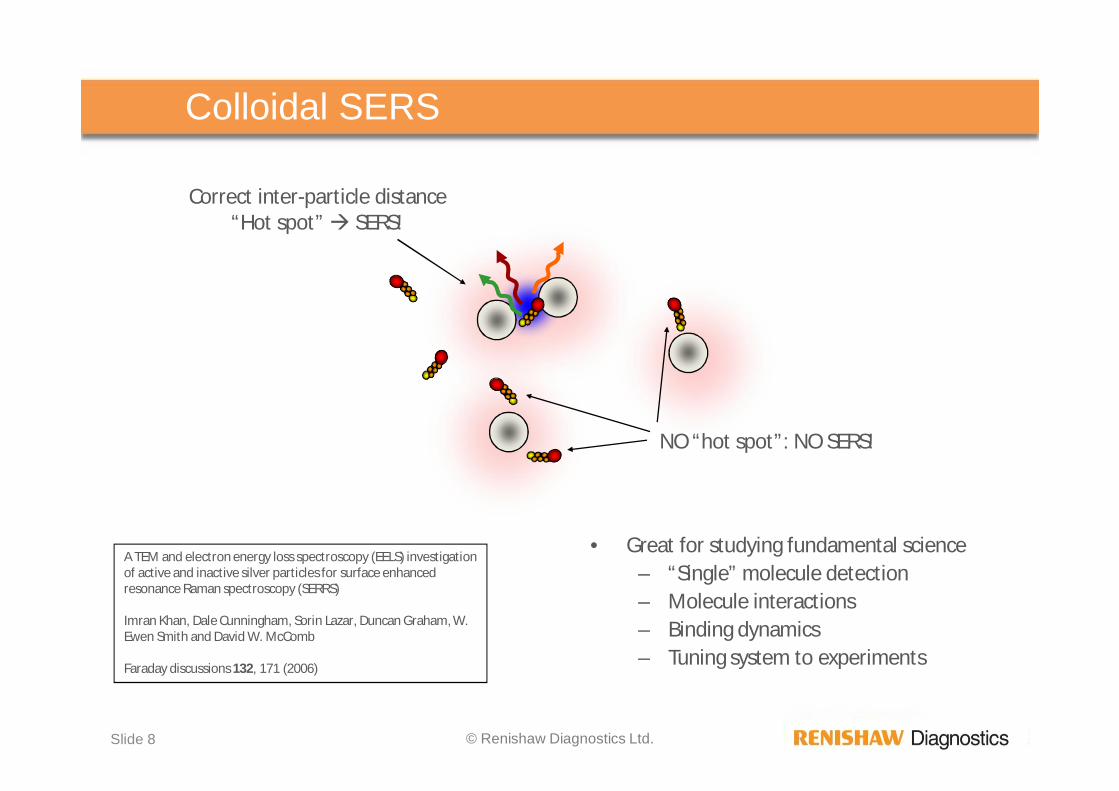
Correct inter-particle distance“Hot spot” SERS!
NO “hot spot”: NO SERS!
• Great for studying fundamental science– “Single” molecule detection– Molecule interactions– Binding dynamics– Tuning system to experiments
A TEM and electron energy loss spectroscopy (EELS) investigationof active and inactive silver particles for surface enhancedresonance Raman spectroscopy (SERRS)
Imran Khan, Dale Cunningham, Sorin Lazar, Duncan Graham, W.Ewen Smith and David W. McComb
Faraday discussions 132, 171 (2006)
Colloidal SERS
Page 9
Slide 9 © Renishaw Diagnostics Ltd.
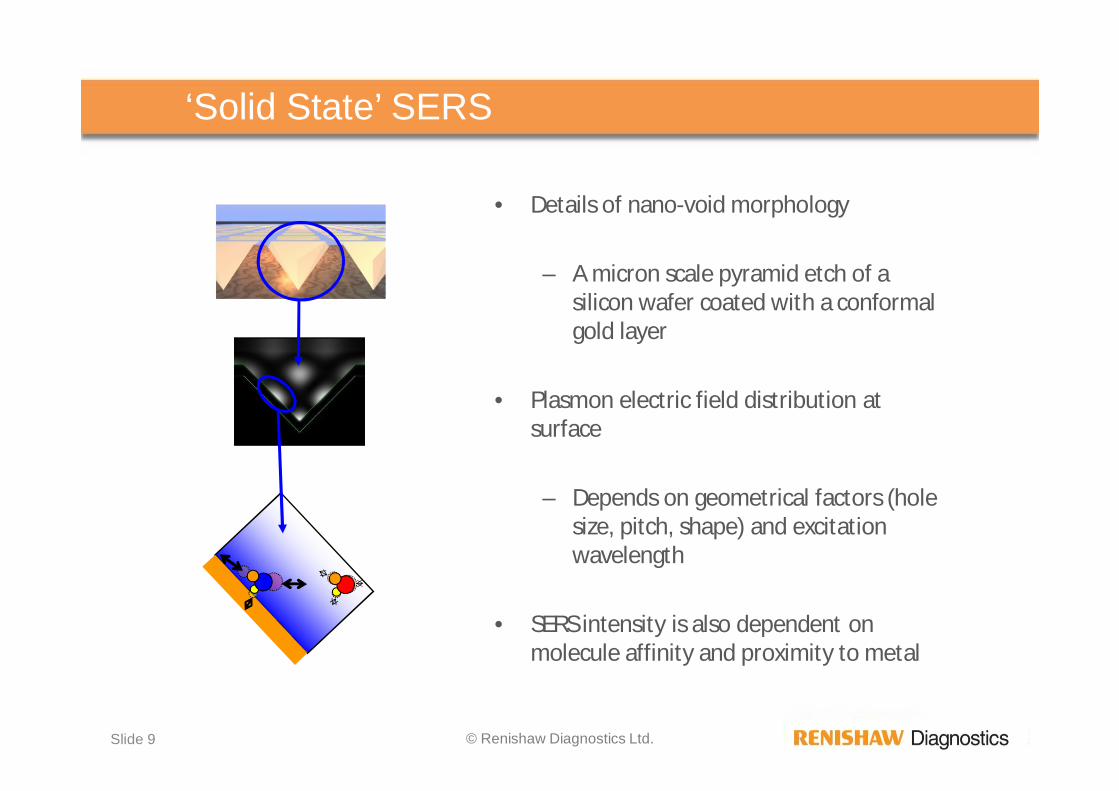
‘Solid State’ SERS
• Details of nano-void morphology
– A micron scale pyramid etch of asilicon wafer coated with a conformalgold layer
• Plasmon electric field distribution atsurface
– Depends on geometrical factors (holesize, pitch, shape) and excitationwavelength
• SERS intensity is also dependent onmolecule affinity and proximity to metal
Page 10
Slide 10 © Renishaw Diagnostics Ltd.
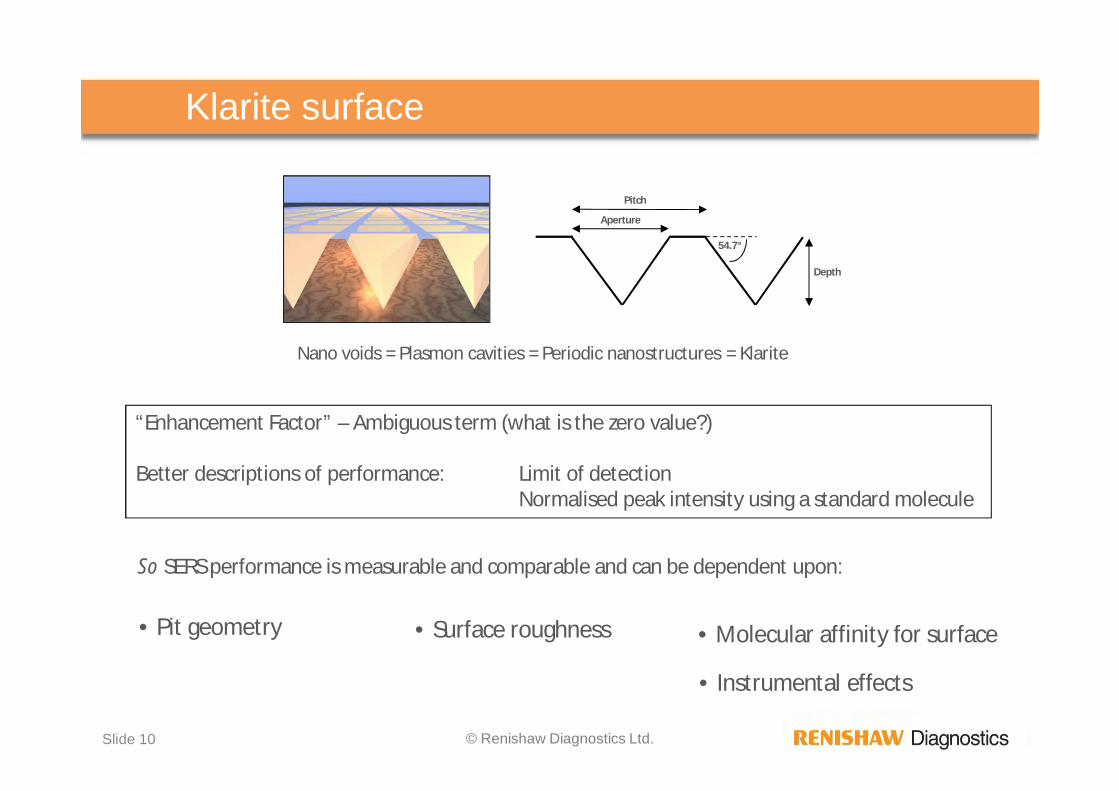
Nano voids = Plasmon cavities = Periodic nanostructures = Klarite
Aperture
Pitch
Depth
54.7°
“Enhancement Factor” – Ambiguous term (what is the zero value?)
Better descriptions of performance: Limit of detectionNormalised peak intensity using a standard molecule
So SERS performance is measurable and comparable and can be dependent upon:
• Pit geometry • Surface roughness • Molecular affinity for surface
• Instrumental effects
Klarite surface
Page 11
Slide 11 © Renishaw Diagnostics Ltd.
Typical Renishaw Diagnostics manufacturing run: 3 x 6-inch wafers200-400 chips per waferUp to 1200 chips in a single batch
Arraystructured
surface
1 m
Etched features
SERSactive area
2µm
Electric fieldlocalization
FlatAu
Klarite substrate
Page 12
Slide 12
Key Advantages
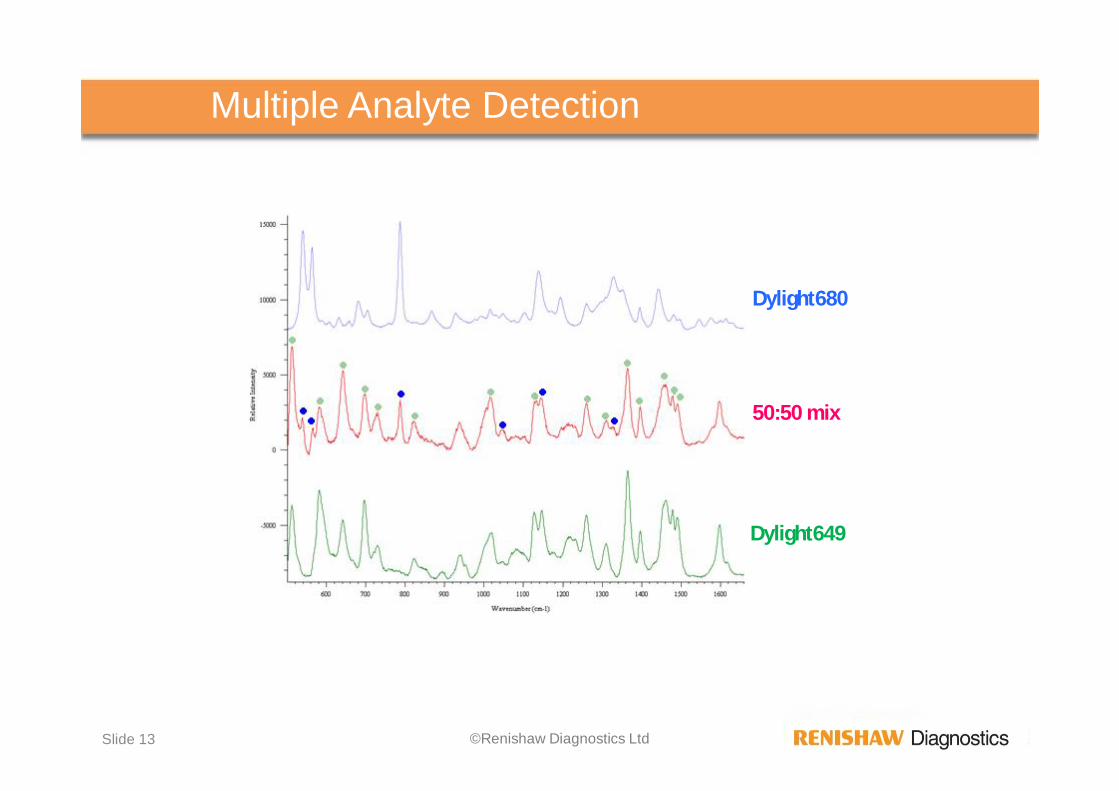
• Increased multiplex capability - the unique molecular fingerprintgenerated by SERRS means true multiple analyte detection can becarried out in a single experiment
• High sensitivity & specificity - SERRS has been shown to be 3 ordersof magnitude more sensitive than fluorescence
• Ease of adaptation to existing routine experiments in terms ofspectral interpretation and reagents
©Renishaw Diagnostics Ltd
Page 13
Slide 13
Multiple Analyte Detection
©Renishaw Diagnostics Ltd
Dylight649
50:50 mix
Dylight680
Page 14
Slide 14 © Renishaw Diagnostics Ltd.
1100115012001250130013501400145015001550160016501700
-2000
0
2000
4000
6000
8000
10000
12000
14000
16000
18000
10-4M Average0_5x10-4M average10-5M average0_5x10-5M average10-6M average0_5x10-6M average
Wavenumbers [1/cm]
Inte
nsity
0
2000
4000
6000
8000
10000
12000
14000
16000
18000
0.00000010.0000010.000010.00010.001
Concentration (M)
Inte
nsity
(arb
.)
Run 1 average peak height
Run 2 average peak height
Run 3 average peak height
Accurate quantification with RSD <15% opens up a range of new applications.
IMPORTANT: Multivariate analysis using chemometrics is much more accurate than this univariatemethod.
Quantification possibilities
Page 15
Slide 15 © Renishaw Diagnostics Ltd.
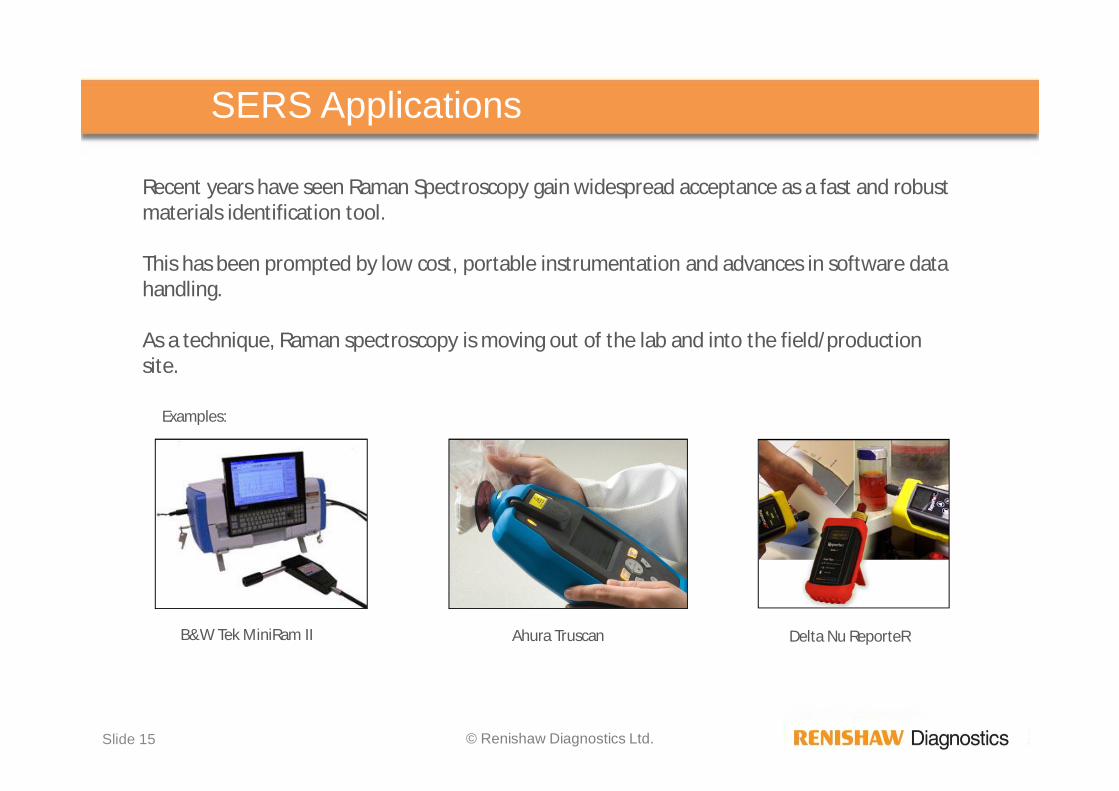
SERS Applications
Recent years have seen Raman Spectroscopy gain widespread acceptance as a fast and robustmaterials identification tool.
This has been prompted by low cost, portable instrumentation and advances in software datahandling.
As a technique, Raman spectroscopy is moving out of the lab and into the field/productionsite.
Delta Nu ReporteRB&W Tek MiniRam II Ahura Truscan
Examples:
Page 16
Slide 16 © Renishaw Diagnostics Ltd.
1500 1000 500
L-Alanine
L-Phenylalanine
Wavenumber (cm-1)
160 012 0080 04 00R am a n sh if t (cm -1)
Cytochrome C
Lysozyme
Bacillus spore
Increasingcomplexity
What can you detect?
Page 17
Slide 17 © Renishaw Diagnostics Ltd.
• Industry requirement for reduced plant turnaround time throughimproved CV time.
• HPLC CV protocols can involve long sample measurement times (up to ~30mins).
• When a large number of measurements are required, long measurementtimes can lead to extended delays.
• SERS based protocols have the potential to rapidly decrease measurementtimes, while providing additional molecule specific information.
• Klarite® SERS substrates can be used to deliver a robust and reproduciblequantification protocol.
Application example: Cleaning verification
Page 18
Slide 18 © Renishaw Diagnostics Ltd.
1100115012001250130013501400145015001550160016501700
-3000
0
3000
6000
9000
12000
15000
18000
21000
24000
27000
30000*10-4M Average*0_5X10-4M Average*10-5M Average*0_5X10-5M Average*10-6M Average*0_5X10-6M Average
Wavenumbers [1/cm]
Inte
nsity
1100115012001250130013501400145015001550160016501700
-2000
0
2000
4000
6000
8000
10000
12000
14000
16000
18000
10-4M Average0_5x10-4M average10-5M average0_5x10-5M average10-6M average0_5x10-6M average
Wavenumbers [1/cm]
Inte
nsity
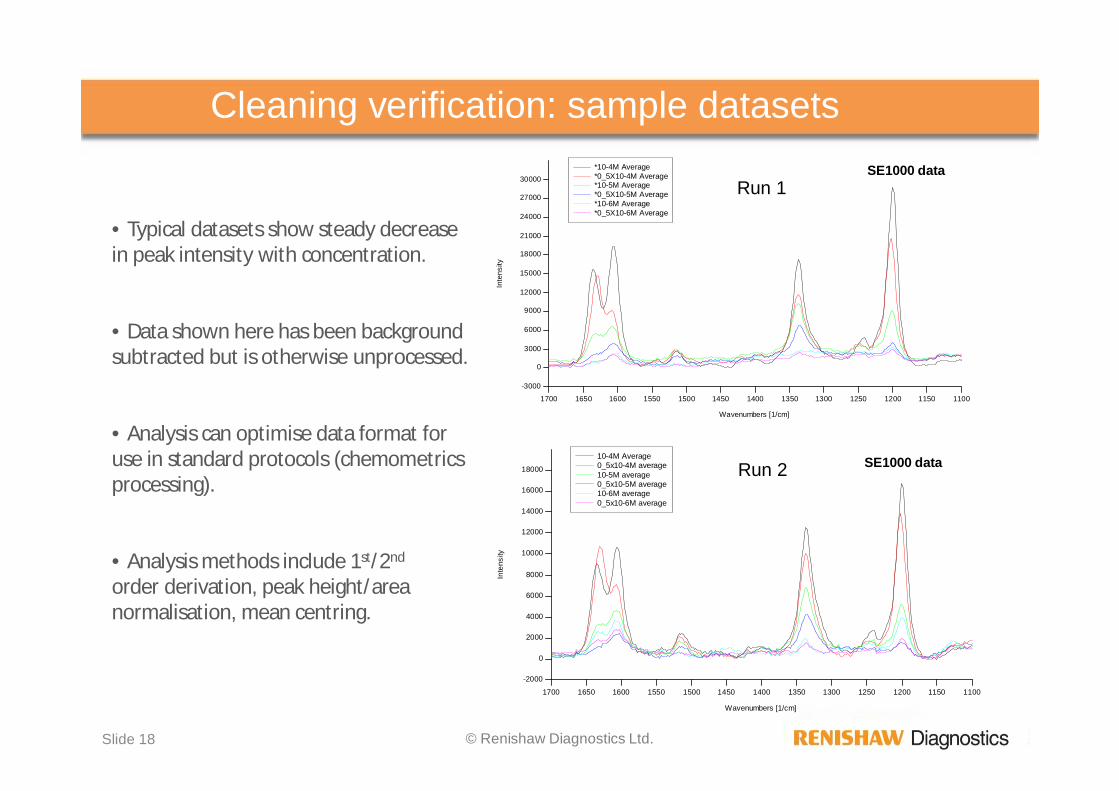
• Typical datasets show steady decreasein peak intensity with concentration.
• Data shown here has been backgroundsubtracted but is otherwise unprocessed.
• Analysis can optimise data format foruse in standard protocols (chemometricsprocessing).
• Analysis methods include 1st/2nd
order derivation, peak height/areanormalisation, mean centring.
Run 1
Run 2 SE1000 data
SE1000 data
Cleaning verification: sample datasets
Page 19
Slide 19 © Renishaw Diagnostics Ltd.
PHOTOSENS project
• Cheaper mass-produced substrates using plastic based roll-to-roll manufacturing
• Enhanced chemical sensing using MIP and surface chemistry
• Use both of the above to overcome key hurdles to marketentry within pharmaceutical environment: cost, reproducibility,sensitivity, experiment set-up
Page 20
Slide 20 © Renishaw Diagnostics Ltd.
Summary
• Renishaw Diagnostics are commercialising state-of-the-artSERS applications
• These offer high sensitivity and specificity whilesignificantly reducing measurement times
• Multiplex detection offers real advantages in diagnostics
• Portability of instrumentation is key to wide range ofapplication environments
Page 21
EU FP-7 PHOTOSENS Project
Slide 21 © 2011 Renishaw Diagnostics Ltd.Confidential
• 3 year project looking at SERS and photonic crystal sensing
• Project closing 31st January 2014
• Novel high volume manufacturing methods for SERS andPC sensors based on roll-to-roll nanoimprinting on advancedplastics
Industrial User Group Meeting31st October, Espoo, 2pm
All welcome (NDA permitting)


![Arctic solar energy solutions - VTT.fi · 3 Arctic solar energy solutions [Arktiset aurinkoenergiaratkaisut]. Riku Pasonen, Kari Mäki, Raili Alanen & Kari Sipilä. Espoo 2012. VTT](https://static.documents.pub/doc/80x56/5ae2866a7f8b9a90138c6b06/arctic-solar-energy-solutions-vttfi-arctic-solar-energy-solutions-arktiset-aurinkoenergiaratkaisut.jpg)


