56

Administrative Stuff
• Pre-requisites: calculus, linear algebra
• Attendance: must attend 60% of classes
• On-site versus online: on-site students can do one online session [licensing]
• Homework: all assignments and due dates have been posted• Only half credit awarded if turned in past due date• For example: if you turn in a homework assignment late, and you would have
scored 3 out of 3 points if you had turned it in on time, then you will be awarded 1.5 points
• Grading: must successfully complete 17 out of 28 possible homework points

Course Outline
1. Introduction to Statistical Learning
2. Linear Regression
3. Classification
4. Resampling Methods
5. Linear Model Selection and Regularization
6. Moving Beyond Linearity
7. Tree-Based Methods
8. Support Vector Machines
9. Unsupervised Learning
10.Neural Networks and Genetic Algorithms

Course Website
Assignments and Discussion
http://canvas.uw.edu/
Recordings
http://uweoconnect.extn.washington.edu/mlearn210/
Notes/Slides
http://cross-entropy.net/ML210

Considerations
• Remember to keep your sense of humor
• Keep up with the work every week
• Ask questions! If you have questions, others probably have the same questions!

Agenda

Machine Learning Definition
• Using data to create a model to map one-or-more input values to one-or-more output values
• Interest from many groups• Computer scientists: “machine learning”
• Statisticians: “statistical learning”
• Engineers: “pattern recognition”
Overview of Statistical Learning

Applications
• E-Commerce: sentiment and trend analysis; dynamic pricing; predict which ad a user is most likely to click; customer segmentation
• Editing: spell correct
• Education: recommendations based on student’s aptitude
• Finance: predict whether an applicant will default on loan
• Genomics: predict gene function; personalized medicine
• Government: detect abusive tax avoidance transactions
• Healthcare: image analysis for diagnosis
• Manufacturing: predict when maintenance is needed
• Security: predict whether a transaction is fraudulent; biometrics recognition
• Translation: convert spoken language to another language
Overview of Statistical Learning

Examples of Learning Problems
• Predict whether a patient, hospitalized due to a heart attack, will have a second heart attack. The prediction is to be based on demographic, diet and clinical measurements for that patient.
• Predict the price of a stock in 6 months from now, on the basis of company performance measures and economic data.
• Identify the numbers in a handwritten ZIP code, from a digitized image.
• Estimate the amount of glucose in the blood of a diabetic person, from the infrared absorption spectrum of that person’s blood.
• Identify the risk factors for prostate cancer, based on clinical and demographic variables.
Overview of Statistical Learning

Wage Data
scatter plot scatter plot box plot
Overview of Statistical Learning

Change in Standard & Poor’s Index
Overview of Statistical Learning

Predicted Probability of Decrease
Overview of Statistical Learning
Slightly higher Predicted Probability of Decrease when there is an Actual Decrease
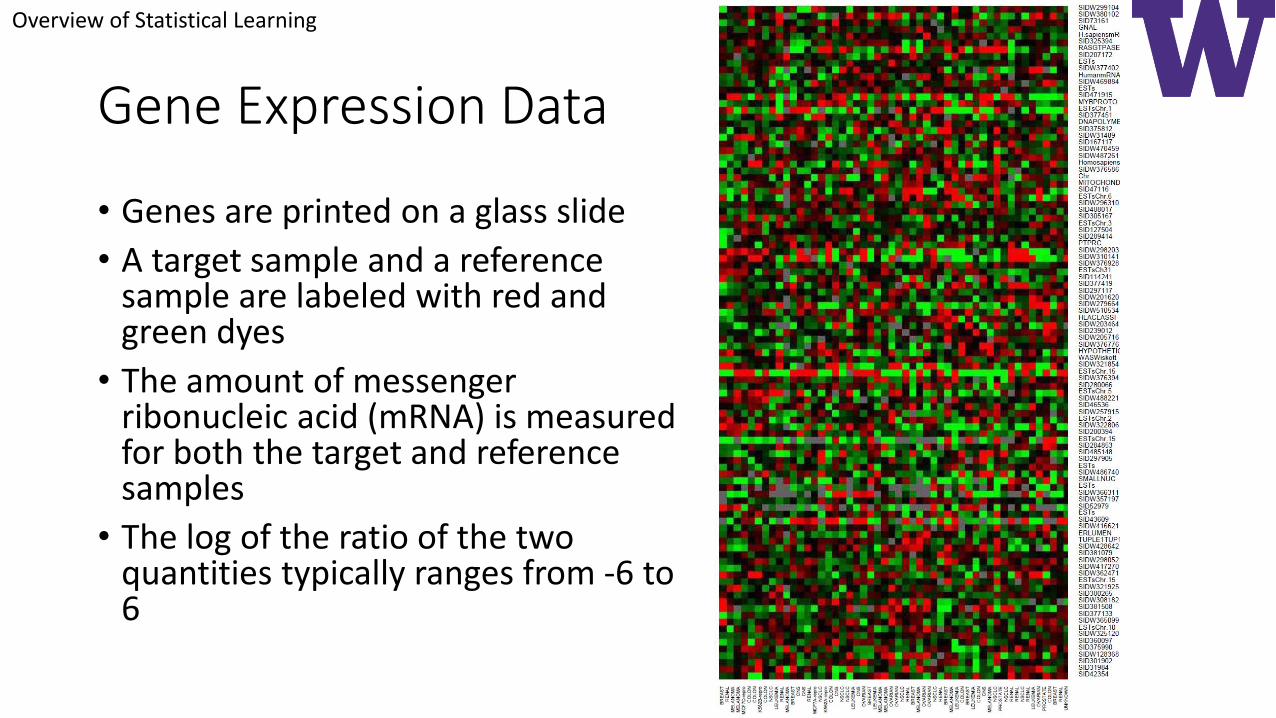
Gene Expression Data
• Genes are printed on a glass slide
• A target sample and a reference sample are labeled with red and green dyes
• The amount of messenger ribonucleic acid (mRNA) is measured for both the target and reference samples
• The log of the ratio of the two quantities typically ranges from -6 to 6
Overview of Statistical Learning

Gene Expression Data
Overview of Statistical Learning

Matrix Notation
matrix: bold, upper-case Xeach cell indexed by row and column
row: lower-case, script 𝓍:values for an observationi is an index for the rowp is the number of predictors
column: bold, lower-case x:values for a variablej is an index for the columnn is the number of observation
x is used to identify input data
example: 150 x 4 matrixsepal width, sepal length, petal width, petal length measurementsfor 150 flowers
authors representall vectors as columns
Notation and Simple Matrix Algebra
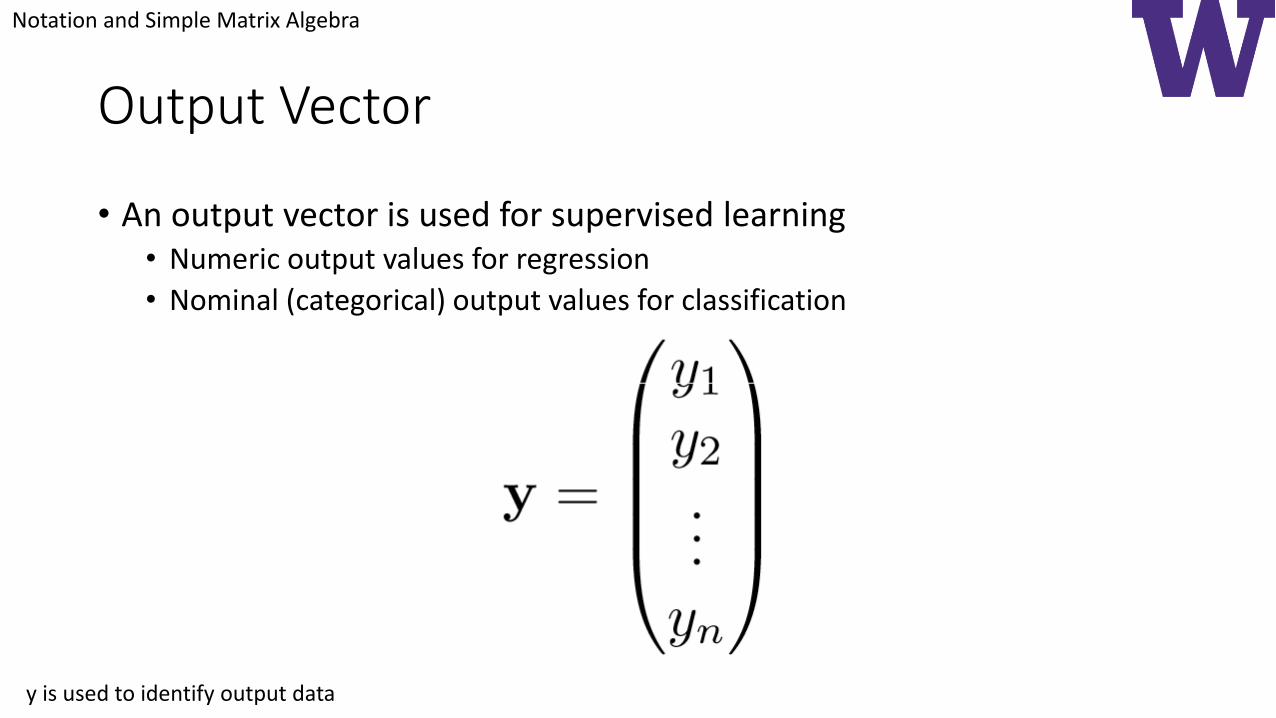
Output Vector
• An output vector is used for supervised learning• Numeric output values for regression
• Nominal (categorical) output values for classification
y is used to identify output data
Notation and Simple Matrix Algebra

Alternative Names
• X
• Input Variable
• Predictor
• Covariate
• Independent
• Exogenous
• y
• Output Variable
• Response
• Target
• Dependent
• Endogenous
Notation and Simple Matrix Algebra

Counts
• ‘n’ is the number of observations in a data set (rows of the matrix)
• ‘p’ is the number of predictors in a data set (columns of the matrix)
Notation and Simple Matrix Algebra

Matrix Transposition
We just swap the row and column indices: 𝑛𝑒𝑤𝑗,𝑖 = 𝑜𝑙𝑑𝑖,𝑗
Notation and Simple Matrix Algebra

Alternative Matrix Notation
matrix expressed as a set of row vectors,where each row is an observation[the authors are treating an observationVector as a column vector]
matrix expressed as a set of column vectors,where each column is a variable
Notation and Simple Matrix Algebra

Matrix Multiplication
𝑨 ∈ ℝ𝑛 𝑥 𝑝 𝑩 ∈ ℝ𝑝 𝑥 𝑘 𝑨𝑩 ∈ ℝ𝑛 𝑥 𝑘
ℝ: a value from the real number line
Notation and Simple Matrix Algebra

Vector Multiplication
𝛽 =
𝛽0𝛽1𝛽2
𝑥 =
𝑥0𝑥1𝑥2
𝛽𝑇 𝑥 = 𝛽0 ∗ 𝑥0 + 𝛽1 ∗ 𝑥1 + 𝛽2 ∗ 𝑥2
[sometimes called a dot product]
Notation and Simple Matrix Algebra
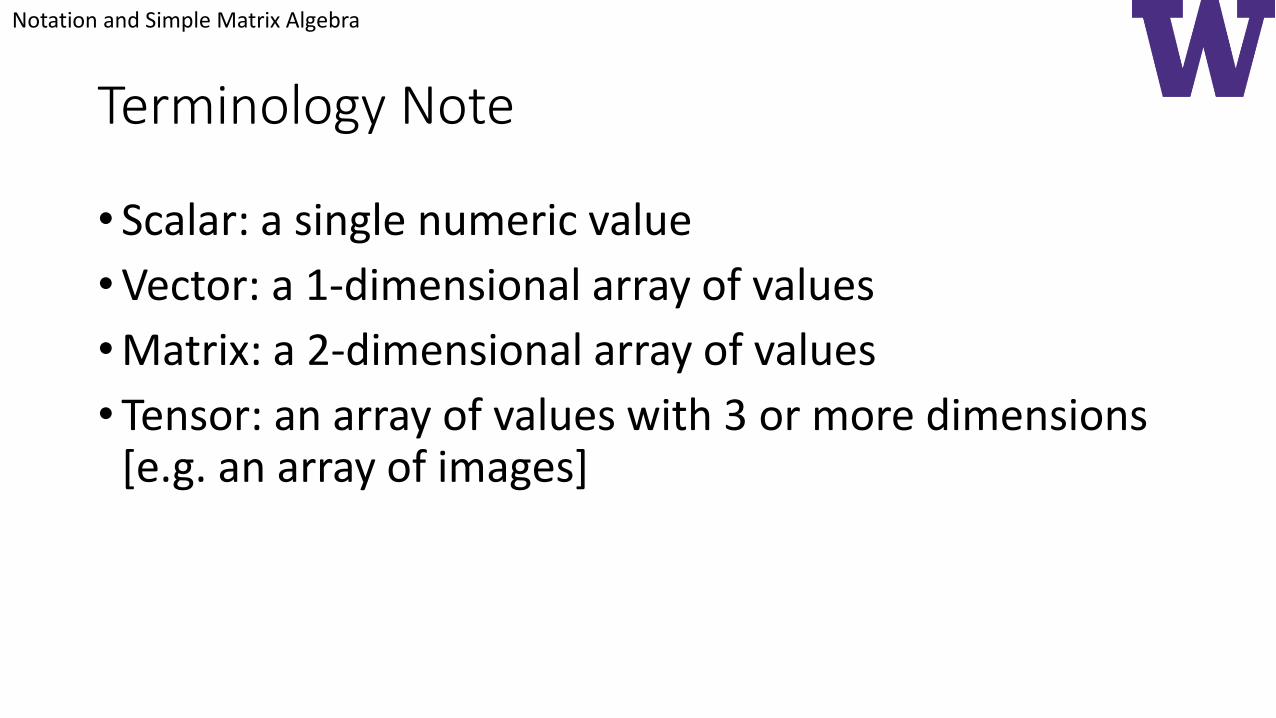
Terminology Note
• Scalar: a single numeric value
•Vector: a 1-dimensional array of values
•Matrix: a 2-dimensional array of values
• Tensor: an array of values with 3 or more dimensions [e.g. an array of images]
Notation and Simple Matrix Algebra

Organization of the Book
• Statistical Learning Terminology and Concepts, plus ‘k’ nearest neighbor
• Regression: Linear Regression
• Classification: Logistic Regression and Linear Discriminant Analysis
• Resampling: Cross Validation and the Bootstrap
• Regression Revisited: Stepwise Selection, Ridge Regression, Principal Components Regression, Partial Least Squares, and the LASSO
• Non-Linear Regression
• Tree-Based Classification: Bagging, Boosting, and Random Forests
• Support Vector Machines
• Unsupervised Learning: Principal Component Analysis, k-Means Clustering, and Hierarchical Clustering
Organization of the Book

Data Sets Referenced by the Textbook
Data Sets Used in Labs and Exercises

Advertising Data
What is Statistical Learning?

Our First Equation• 𝑌 = 𝑓 𝑋 + 𝜖
• 𝑌 is an output Sales value
• 𝑓 𝑋 is a function of TV budget• f(X) = 0.05 * X + 7
• Slope: (22 – 7) / (300 – 0) = 0.05
• Intercept: 22 - 0.05 * 300 = 7
• f( 0) = 0.05 * 0 + 7 = 7
• f(100) = 0.05 * 100 + 7 = 12
• f(200) = 0.05 * 200 + 7 = 17
• f(300) = 0.05 * 300 + 7 = 22
• 𝜖 is a residual “error” term (Greek letter “epsilon”)
Data = read.csv("http://www-bcf.usc.edu/~gareth/ISL/Advertising.csv")
What is Statistical Learning?

Income as a Function of Education
What is Statistical Learning?
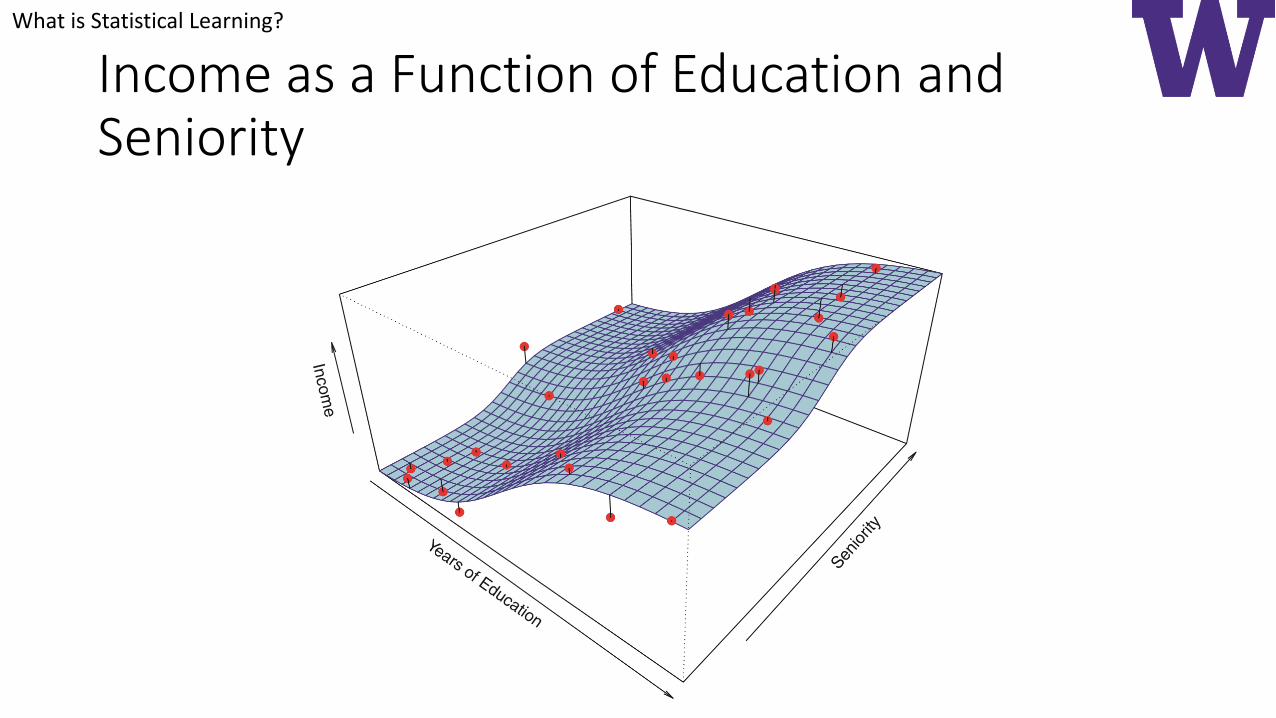
Income as a Function of Education and Seniority
What is Statistical Learning?

Why Estimate 𝑓 𝑋 ?
𝑌 = መ𝑓 𝑋
• The hats (circumflex characters: ‘^’) indicate we’re talking about estimates rather than some notion of absolute truth
• መ𝑓 𝑋 is the function we learned from data: our function is a model that maps an input to an output
• 𝑌 is our prediction
• Reasons:• To predict an outcome
• To understand the influence of the predictors on the outcome
What is Statistical Learning?

Prediction [Our First Loss Function: Squared Error]
• A loss function measures how well a model is able to map inputs to outputs
• 𝐸 𝑌 − 𝑌2= 𝐸 𝑓 𝑋 + 𝜖 − መ𝑓 𝑋
2= 𝐸 𝑓 𝑋 − መ𝑓 𝑋
2+ 𝑉𝑎𝑟 𝜖
• 𝐸 𝑓 𝑋 − መ𝑓 𝑋2
is referred to as reducible error: we could reduce the error if we had better features
• 𝑉𝑎𝑟 𝜖 is referred to as irreducible error, because we believe the process is stochastic rather than deterministic
• 𝐸 indicates we’re talking about an expected value (average value)
• 𝑉𝑎𝑟 indicates we’re talking about variance, the expected squared deviation from the mean• Since we believe our residual error has a mean of zero E 𝜖2 = 𝑉𝑎𝑟 𝜖
What is Statistical Learning?

Inference [Understanding]
• Which predictors are associated with the response?
• What is the relationship between the response and each predictor?
• Can the relationship between the inputs and outputs be summarized adequately using a linear model, or is the relationship more complex?
• Examples:• Which media contribute to sales?• Which media generate the biggest boost in sales?• How much increase in sales is associated with a given increase in TV
advertising?
What is Statistical Learning?

How Do We Estimate f?
• Parametric methods: the size of the model is fixed; e.g. linear regression, polynomial regression, logistic regression, neural network
• Non-Parametric methods: the size of the model can grow with the amount of training data; e.g. nearest neighbor, random forests, gradient boosting, support vector machines
What is Statistical Learning?

Parametric Linear Model for Income
What is Statistical Learning?

Non-Parametric Non-Linear Model for Income
What is Statistical Learning?

Trade-Off Between Prediction Accuracy and Model Interpretability
What is Statistical Learning?

Supervised versus Unsupervised Learning
• Supervised Learning• The learning algorithm is given a target output variable
• Classification: the output variable is nominal (categorical, qualitative)
• Regression: the output variable is numeric (quantitative)
• Unsupervised Learning• The learning algorithm is *not* given a target output variable
• Clustering
• Principal Component Analysis
What is Statistical Learning?

Unsupervised Learning and Class Overlap
What is Statistical Learning?

Measuring the Quality of the Model
Common Loss functions• Regression
• Gaussian loss (mean squared error)
• Laplacian loss (mean absolute error)
• Classification• Log loss
• Hinge loss
Assessing Model Accuracy

Example: High Bias (underfitting) versus High Variance (overfitting)
Assessing Model Accuracy
Overfitting: the region of flexibility where the loss increases for the testing data but decreases for the training data

Example: Overfitting
Assessing Model Accuracy

Bias versus Variance Trade-Off
Assessing Model Accuracy

Bias Variance Decomposition
𝐸 𝑦0 − መ𝑓 𝑥02= 𝐸 𝑓 𝑥0 + 𝜖 − መ𝑓 𝑥0
2= 𝐸 𝑓 𝑥0 − መ𝑓 𝑥0
2+ 𝑉𝑎𝑟 𝜖
= 𝐸 𝑓 𝑥0 − 𝐸 መ𝑓 𝑥0 + 𝐸 መ𝑓 𝑥0 − መ𝑓 𝑥0
2
+ 𝑉𝑎𝑟 𝜖
= 𝐸 𝑓 𝑥0 − 𝐸 መ𝑓 𝑥0
2
+ 2 ∗ 𝑓 𝑥0 − 𝐸 መ𝑓 𝑥0 ∗ 𝐸 መ𝑓 𝑥0 − መ𝑓 𝑥0 + 𝐸 መ𝑓 𝑥0 − መ𝑓 𝑥0
2
+ 𝑉𝑎𝑟 𝜖
= 𝐸 𝑓 𝑥0 − 𝐸 መ𝑓 𝑥0
2
+ 0 + E 𝐸 መ𝑓 𝑥0 − መ𝑓 𝑥0
2
+ 𝑉𝑎𝑟 𝜖
= 𝐵𝑖𝑎𝑠 መ𝑓 𝑥02+ 𝑉𝑎𝑟 መ𝑓 𝑥0 +𝑉𝑎𝑟 𝜖
• We’re adding and subtracting the same value (zero) on line 2
• We’re grouping pairs of terms and multiplying on line 3
• We’re using E 𝐸 መ𝑓 𝑥0 − መ𝑓 𝑥0 = 0 on line 4
Assessing Model Accuracy

Optimal Flexibility Varies by Problem
Variance Increases and Bias Decreases as Model Flexibility Increases
Assessing Model Accuracy

Classification Error
I() is an indicator function which returns 1 iff (if and only if) the condition is true; e.g. the actual class label is not equal to the predicted class label
Assessing Model Accuracy
Accuracy = 1 - Error

Bayes Classifier
The Bayes classifier picks the class ‘j’ that maximizes the probability
Read “probability that Y is equal to j given that X is equal to x0“
The Bayes error rate is
Assessing Model Accuracy

Bayes Classifier for Simulated Problem
Assessing Model Accuracy
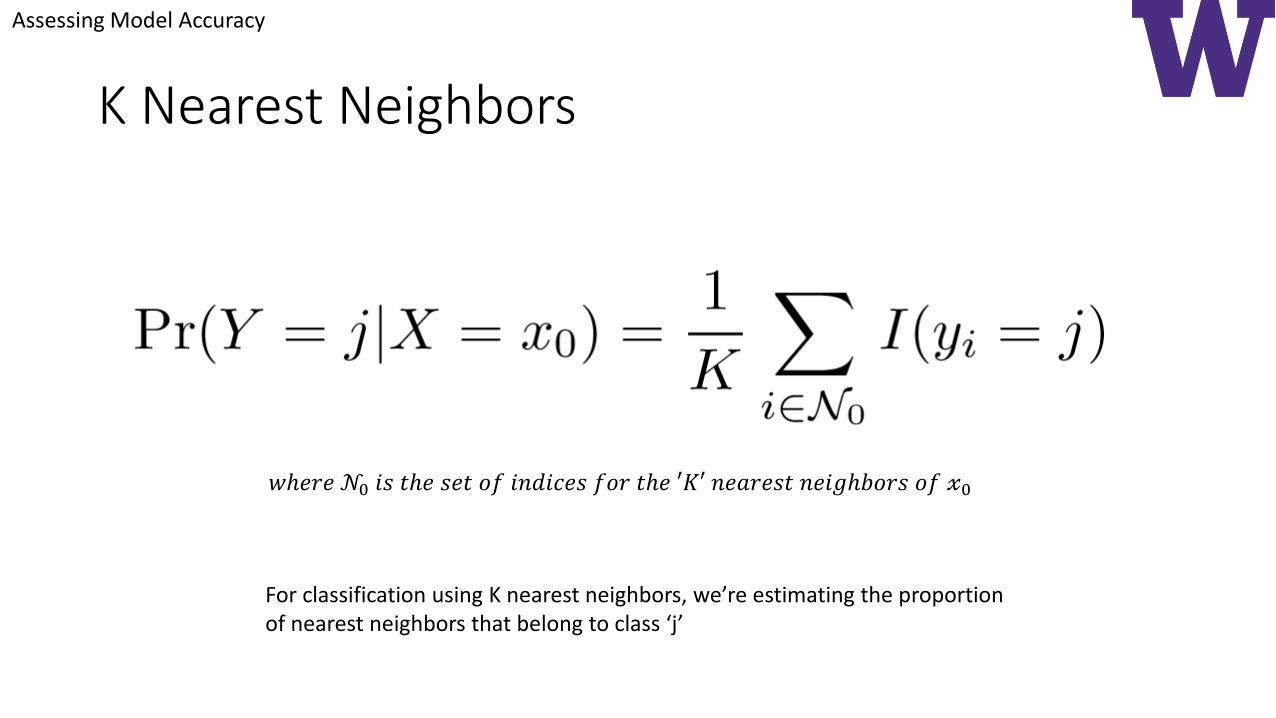
K Nearest Neighbors
𝑤ℎ𝑒𝑟𝑒 𝒩0 𝑖𝑠 𝑡ℎ𝑒 𝑠𝑒𝑡 𝑜𝑓 𝑖𝑛𝑑𝑖𝑐𝑒𝑠 𝑓𝑜𝑟 𝑡ℎ𝑒 ′𝐾′ 𝑛𝑒𝑎𝑟𝑒𝑠𝑡 𝑛𝑒𝑖𝑔ℎ𝑏𝑜𝑟𝑠 𝑜𝑓 𝓍0
For classification using K nearest neighbors, we’re estimating the proportionof nearest neighbors that belong to class ‘j’
Assessing Model Accuracy

K Nearest Neighbor Classifier Example (k=3)
Assessing Model Accuracy

KNN with K=10 versus Bayes Decision Boundary
Assessing Model Accuracy

KNN with K=1 versus K=10
Assessing Model Accuracy

Error versus Complexity for KNN
Assessing Model Accuracy

What’s Left to Talk About?
• Lab• Install R from https://cran.r-project.org/• Execute the commands from the Lab in Section 2.3 of the textbook• Use the following R command to install the “ISLR” package:
install.packages(“ISLR”)# choose “USA (WA) [https]” for the mirror
• Homework• Submit your response for Assignment #1 to the http://canvas.uw.edu site
a. Please include a brief note about …1. your education2. your current job3. how you would like to use knowledge acquired through this certificate program
b. Answer question #2 from the exercises in Section 2.4 (page 52)c. Answer question #9 from the exercises in Section 2.4 (page 56)d. https://kaggle.com/join/ml210_mnist
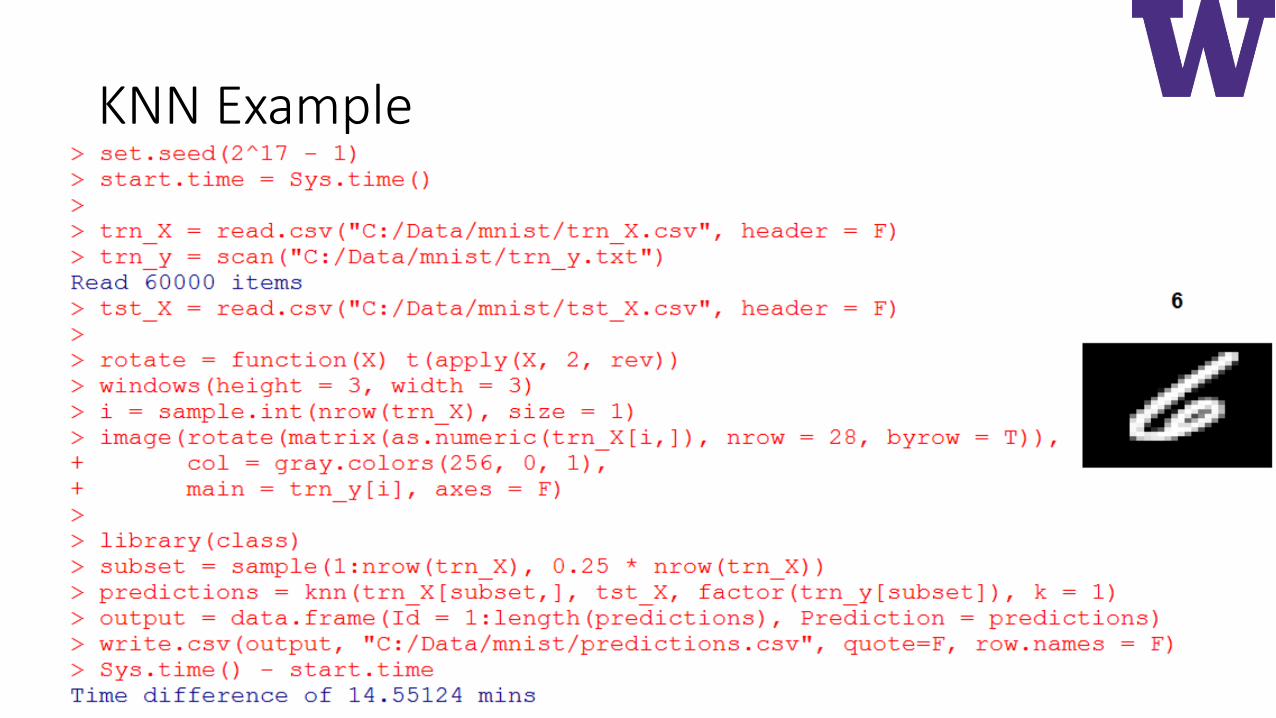
KNN Example

Agenda


