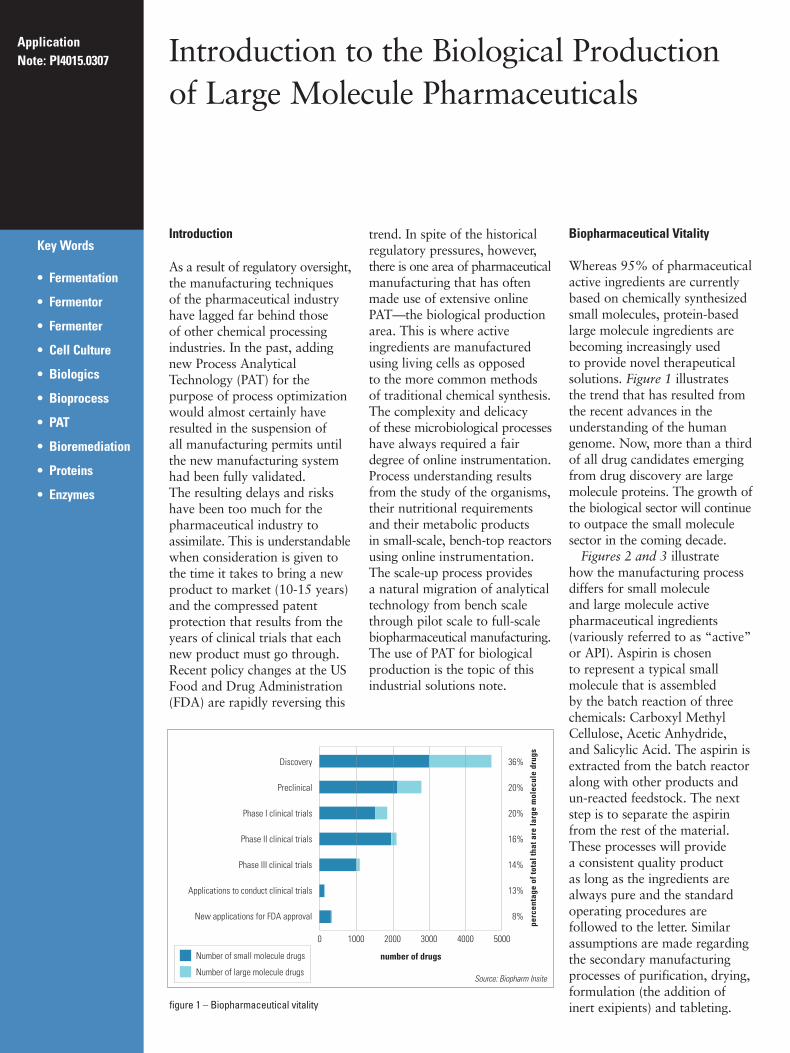
Application Note: PI4015.0307 Introduction As a result of regulatory oversight, the manufacturing techniques of the pharmaceutical industry have lagged far behind those of other chemical processing industries. In the past, adding new Process Analytical Technology (PAT) for the purpose of process optimization would almost certainly have resulted in the suspension of all manufacturing permits until the new manufacturing system had been fully validated. The resulting delays and risks have been too much for the pharmaceutical industry to assimilate. This is understandable when consideration is given to the time it takes to bring a new product to market (10-15 years) and the compressed patent protection that results from the years of clinical trials that each new product must go through. Recent policy changes at the US Food and Drug Administration (FDA) are rapidly reversing this trend. In spite of the historical regulatory pressures, however, there is one area of pharmaceutical manufacturing that has often made use of extensive online PAT—the biological production area. This is where active ingredients are manufactured using living cells as opposed to the more common methods of traditional chemical synthesis. The complexity and delicacy of these microbiological processes have always required a fair degree of online instrumentation. Process understanding results from the study of the organisms, their nutritional requirements and their metabolic products in small-scale, bench-top reactors using online instrumentation. The scale-up process provides a natural migration of analytical technology from bench scale through pilot scale to full-scale biopharmaceutical manufacturing. The use of PAT for biological production is the topic of this industrial solutions note. Biopharmaceutical Vitality Whereas 95% of pharmaceutical active ingredients are currently based on chemically synthesized small molecules, protein-based large molecule ingredients are becoming increasingly used to provide novel therapeutical solutions. Figure 1 illustrates the trend that has resulted from the recent advances in the understanding of the human genome. Now, more than a third of all drug candidates emerging from drug discovery are large molecule proteins. The growth of the biological sector will continue to outpace the small molecule sector in the coming decade. Figures 2 and 3 illustrate how the manufacturing process differs for small molecule and large molecule active pharmaceutical ingredients (variously referred to as “active” or API). Aspirin is chosen to represent a typical small molecule that is assembled by the batch reaction of three chemicals: Carboxyl Methyl Cellulose, Acetic Anhydride, and Salicylic Acid. The aspirin is extracted from the batch reactor along with other products and un-reacted feedstock. The next step is to separate the aspirin from the rest of the material. These processes will provide a consistent quality product as long as the ingredients are always pure and the standard operating procedures are followed to the letter. Similar assumptions are made regarding the secondary manufacturing processes of purification, drying, formulation (the addition of inert exipients) and tableting. Introduction to the Biological Production of Large Molecule Pharmaceuticals Key Words • Fermentation • Fermentor • Fermenter • Cell Culture • Biologics • Bioprocess • PAT • Bioremediation • Proteins • Enzymes 0 5000 4000 3000 2000 1000 number of drugs percentage of total that are large molecule drugs 36% 20% 20% 16% 14% 13% 8% Discovery Preclinical Phase I clinical trials Phase II clinical trials Phase III clinical trials Applications to conduct clinical trials New applications for FDA approval Number of small molecule drugs Number of large molecule drugs figure 1 – Biopharmaceutical vitality Source: Biopharm Insite
Transcript
Application Note: PI4015.0307
Introduction
As a result of regulatory oversight,the manufacturing techniques of the pharmaceutical industryhave lagged far behind those of other chemical processingindustries. In the past, addingnew Process AnalyticalTechnology (PAT) for thepurpose of process optimizationwould almost certainly haveresulted in the suspension of all manufacturing permits untilthe new manufacturing systemhad been fully validated. The resulting delays and riskshave been too much for thepharmaceutical industry toassimilate. This is understandablewhen consideration is given tothe time it takes to bring a newproduct to market (10-15 years)and the compressed patentprotection that results from theyears of clinical trials that eachnew product must go through.Recent policy changes at the USFood and Drug Administration(FDA) are rapidly reversing this
trend. In spite of the historicalregulatory pressures, however,there is one area of pharmaceuticalmanufacturing that has oftenmade use of extensive onlinePAT—the biological productionarea. This is where activeingredients are manufacturedusing living cells as opposed to the more common methods of traditional chemical synthesis.The complexity and delicacy of these microbiological processeshave always required a fairdegree of online instrumentation.Process understanding resultsfrom the study of the organisms,their nutritional requirementsand their metabolic products in small-scale, bench-top reactorsusing online instrumentation.The scale-up process provides a natural migration of analyticaltechnology from bench scalethrough pilot scale to full-scalebiopharmaceutical manufacturing.The use of PAT for biologicalproduction is the topic of thisindustrial solutions note.
Biopharmaceutical Vitality
Whereas 95% of pharmaceuticalactive ingredients are currentlybased on chemically synthesizedsmall molecules, protein-basedlarge molecule ingredients arebecoming increasingly used to provide novel therapeuticalsolutions. Figure 1 illustrates the trend that has resulted fromthe recent advances in theunderstanding of the humangenome. Now, more than a thirdof all drug candidates emergingfrom drug discovery are largemolecule proteins. The growth ofthe biological sector will continueto outpace the small moleculesector in the coming decade.
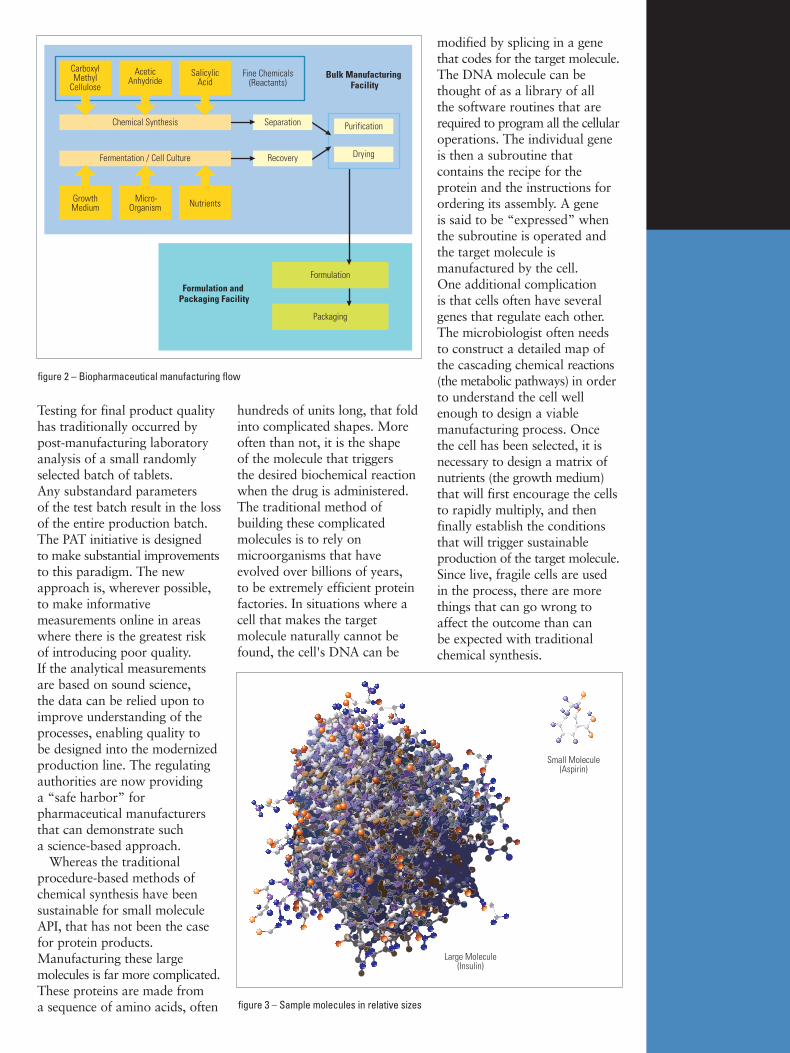
Figures 2 and 3 illustrate how the manufacturing processdiffers for small molecule and large molecule activepharmaceutical ingredients(variously referred to as “active”or API). Aspirin is chosen to represent a typical smallmolecule that is assembled by the batch reaction of threechemicals: Carboxyl MethylCellulose, Acetic Anhydride, and Salicylic Acid. The aspirin isextracted from the batch reactoralong with other products andun-reacted feedstock. The nextstep is to separate the aspirinfrom the rest of the material.These processes will provide a consistent quality product as long as the ingredients arealways pure and the standardoperating procedures arefollowed to the letter. Similarassumptions are made regardingthe secondary manufacturingprocesses of purification, drying,formulation (the addition ofinert exipients) and tableting.
Introduction to the Biological Productionof Large Molecule Pharmaceuticals
Key Words
• Fermentation
• Fermentor
• Fermenter
• Cell Culture
• Biologics
• Bioprocess
• PAT
• Bioremediation
• Proteins
• Enzymes
0 50004000300020001000
number of drugs
perc
enta
geof
tota
ltha
tare
larg
em
olec
ule
drug
s
36%
20%
20%
16%
14%
13%
8%
Discovery
Preclinical
Phase I clinical trials
Phase II clinical trials
Phase III clinical trials
Applications to conduct clinical trials
New applications for FDA approval
Number of small molecule drugs
Number of large molecule drugs
figure 1 – Biopharmaceutical vitality
Source: Biopharm Insite
Testing for final product qualityhas traditionally occurred bypost-manufacturing laboratoryanalysis of a small randomlyselected batch of tablets. Any substandard parameters of the test batch result in the lossof the entire production batch.The PAT initiative is designed to make substantial improvementsto this paradigm. The newapproach is, wherever possible,to make informativemeasurements online in areaswhere there is the greatest riskof introducing poor quality. If the analytical measurementsare based on sound science, the data can be relied upon toimprove understanding of theprocesses, enabling quality to be designed into the modernizedproduction line. The regulatingauthorities are now providing a “safe harbor” forpharmaceutical manufacturersthat can demonstrate such a science-based approach.
Whereas the traditionalprocedure-based methods ofchemical synthesis have beensustainable for small moleculeAPI, that has not been the casefor protein products.Manufacturing these largemolecules is far more complicated.These proteins are made from a sequence of amino acids, often
hundreds of units long, that foldinto complicated shapes. Moreoften than not, it is the shape of the molecule that triggers the desired biochemical reactionwhen the drug is administered.The traditional method ofbuilding these complicatedmolecules is to rely onmicroorganisms that haveevolved over billions of years, to be extremely efficient proteinfactories. In situations where acell that makes the targetmolecule naturally cannot befound, the cell's DNA can be
modified by splicing in a genethat codes for the target molecule.The DNA molecule can bethought of as a library of all the software routines that arerequired to program all the cellularoperations. The individual geneis then a subroutine thatcontains the recipe for theprotein and the instructions forordering its assembly. A gene is said to be “expressed” whenthe subroutine is operated andthe target molecule ismanufactured by the cell. One additional complication is that cells often have severalgenes that regulate each other.The microbiologist often needsto construct a detailed map ofthe cascading chemical reactions(the metabolic pathways) in orderto understand the cell wellenough to design a viablemanufacturing process. Once the cell has been selected, it isnecessary to design a matrix ofnutrients (the growth medium)that will first encourage the cellsto rapidly multiply, and thenfinally establish the conditionsthat will trigger sustainableproduction of the target molecule.Since live, fragile cells are usedin the process, there are morethings that can go wrong toaffect the outcome than can be expected with traditionalchemical synthesis.
Packaging
Formulation
Drying
PurificationChemical Synthesis
Fine Chemicals(Reactants)
Recovery
Separation
Formulation and Packaging Facility
Fermentation / Cell Culture
Bulk Manufacturing Facility
AceticAnhydride
SalicylicAcid
CarboxylMethyl
Cellulose
Micro-Organism NutrientsGrowth
Medium
figure 2 – Biopharmaceutical manufacturing flow
Small Molecule(Aspirin)
Large Molecule(Insulin)
figure 3 – Sample molecules in relative sizes
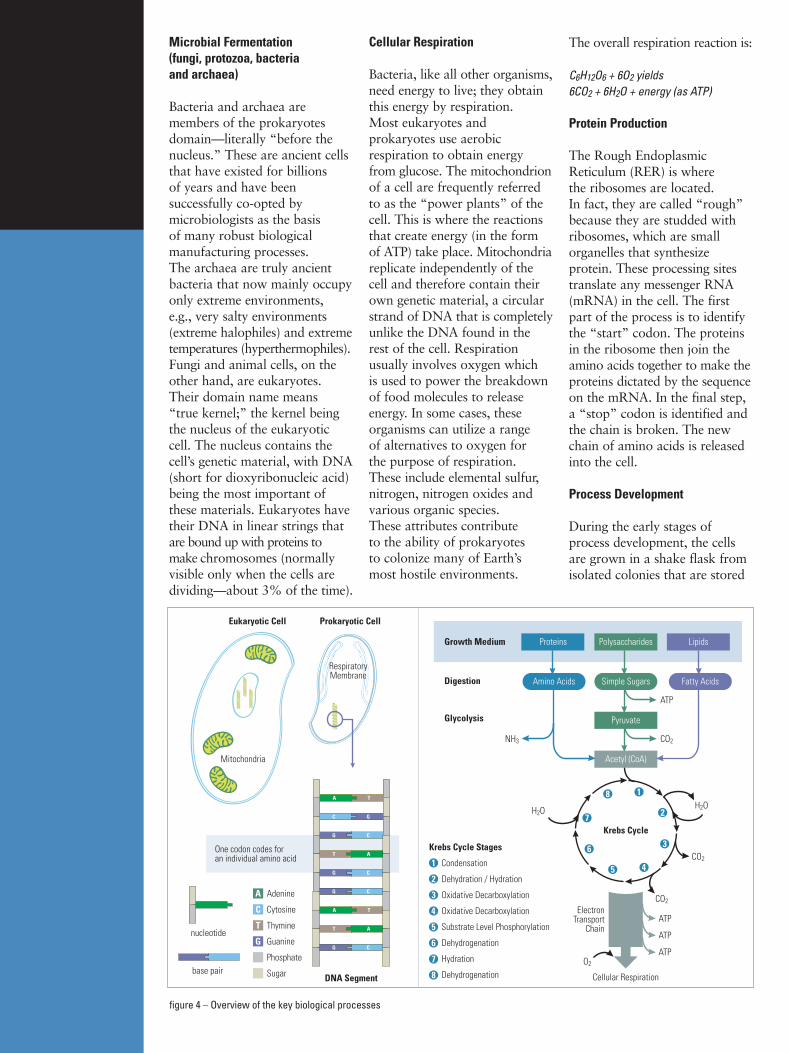
Microbial Fermentation(fungi, protozoa, bacteria and archaea)
Bacteria and archaea aremembers of the prokaryotesdomain—literally “before thenucleus.” These are ancient cellsthat have existed for billions of years and have beensuccessfully co-opted bymicrobiologists as the basis of many robust biologicalmanufacturing processes. The archaea are truly ancientbacteria that now mainly occupyonly extreme environments, e.g., very salty environments(extreme halophiles) and extremetemperatures (hyperthermophiles).Fungi and animal cells, on theother hand, are eukaryotes.Their domain name means “true kernel;” the kernel beingthe nucleus of the eukaryoticcell. The nucleus contains thecell’s genetic material, with DNA(short for dioxyribonucleic acid)being the most important ofthese materials. Eukaryotes havetheir DNA in linear strings thatare bound up with proteins tomake chromosomes (normallyvisible only when the cells aredividing—about 3% of the time).
Cellular Respiration
Bacteria, like all other organisms,need energy to live; they obtainthis energy by respiration. Most eukaryotes andprokaryotes use aerobicrespiration to obtain energyfrom glucose. The mitochondrionof a cell are frequently referredto as the “power plants” of thecell. This is where the reactionsthat create energy (in the formof ATP) take place. Mitochondriareplicate independently of thecell and therefore contain theirown genetic material, a circularstrand of DNA that is completelyunlike the DNA found in therest of the cell. Respirationusually involves oxygen which is used to power the breakdownof food molecules to releaseenergy. In some cases, theseorganisms can utilize a range of alternatives to oxygen for the purpose of respiration. These include elemental sulfur,nitrogen, nitrogen oxides andvarious organic species. These attributes contribute to the ability of prokaryotes to colonize many of Earth’s most hostile environments.
The Rough EndoplasmicReticulum (RER) is where the ribosomes are located. In fact, they are called “rough”because they are studded withribosomes, which are smallorganelles that synthesizeprotein. These processing sitestranslate any messenger RNA(mRNA) in the cell. The firstpart of the process is to identifythe “start” codon. The proteinsin the ribosome then join theamino acids together to make theproteins dictated by the sequenceon the mRNA. In the final step,a “stop” codon is identified andthe chain is broken. The newchain of amino acids is releasedinto the cell.
Process Development
During the early stages ofprocess development, the cellsare grown in a shake flask fromisolated colonies that are stored
H2O
Acetyl (CoA)
CO2NH3
Pyruvate
ATP
Simple Sugars
Adenine
Cytosine
Thymine
Guanine
Phosphate
Sugar
Proteins PolysaccharidesGrowth Medium
Digestion
Glycolysis
ElectronTransport
Chain
Cellular Respiration
ATP
ATP
ATP
H2O
CO2
O2
CO2
Krebs Cycle
Condensation
Dehydration / Hydration
Oxidative Decarboxylation
Oxidative Decarboxylation
Substrate Level Phosphorylation
Dehydrogenation
Hydration
Dehydrogenation
Krebs Cycle Stages
Prokaryotic CellEukaryotic Cell
Mitochondria
One codon codes foran individual amino acid
RespiratoryMembrane
DNA Segment
A T
C G
CG
AT
CG
CG
A T
AT
CG
base pair
nucleotide
Lipids
Amino Acids Fatty Acids
figure 4 – Overview of the key biological processes
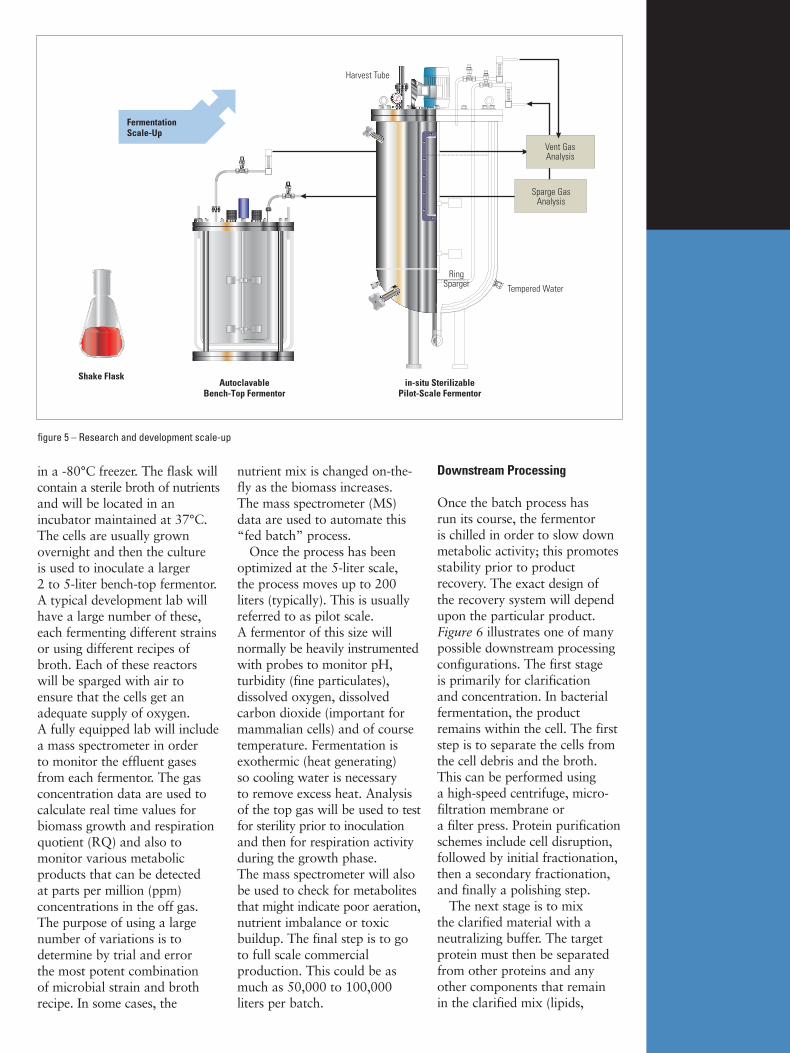
in a -80°C freezer. The flask willcontain a sterile broth of nutrientsand will be located in anincubator maintained at 37°C.The cells are usually grownovernight and then the cultureis used to inoculate a larger 2 to 5-liter bench-top fermentor. A typical development lab willhave a large number of these,each fermenting different strainsor using different recipes ofbroth. Each of these reactorswill be sparged with air toensure that the cells get anadequate supply of oxygen. A fully equipped lab will includea mass spectrometer in order to monitor the effluent gasesfrom each fermentor. The gasconcentration data are used tocalculate real time values forbiomass growth and respirationquotient (RQ) and also tomonitor various metabolicproducts that can be detected at parts per million (ppm)concentrations in the off gas.The purpose of using a largenumber of variations is todetermine by trial and error the most potent combination of microbial strain and brothrecipe. In some cases, the
nutrient mix is changed on-the-fly as the biomass increases. The mass spectrometer (MS)data are used to automate this“fed batch” process.
Once the process has beenoptimized at the 5-liter scale,the process moves up to 200liters (typically). This is usuallyreferred to as pilot scale. A fermentor of this size willnormally be heavily instrumentedwith probes to monitor pH,turbidity (fine particulates),dissolved oxygen, dissolvedcarbon dioxide (important formammalian cells) and of coursetemperature. Fermentation isexothermic (heat generating) so cooling water is necessaryto remove excess heat. Analysisof the top gas will be used to testfor sterility prior to inoculationand then for respiration activityduring the growth phase. The mass spectrometer will alsobe used to check for metabolitesthat might indicate poor aeration,nutrient imbalance or toxicbuildup. The final step is to goto full scale commercialproduction. This could be asmuch as 50,000 to 100,000liters per batch.
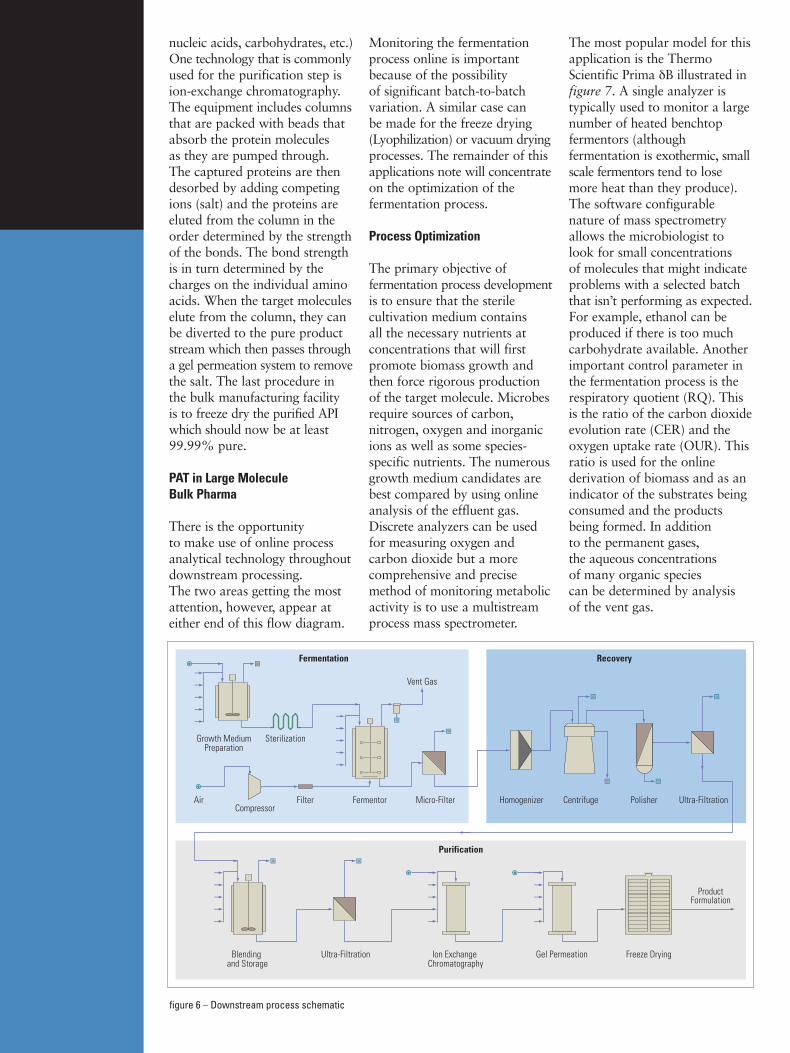
Downstream Processing
Once the batch process has run its course, the fermentor is chilled in order to slow downmetabolic activity; this promotesstability prior to productrecovery. The exact design of the recovery system will dependupon the particular product.Figure 6 illustrates one of manypossible downstream processingconfigurations. The first stage is primarily for clarification and concentration. In bacterialfermentation, the productremains within the cell. The firststep is to separate the cells fromthe cell debris and the broth.This can be performed using a high-speed centrifuge, micro-filtration membrane or a filter press. Protein purificationschemes include cell disruption,followed by initial fractionation,then a secondary fractionation,and finally a polishing step.
The next stage is to mix the clarified material with aneutralizing buffer. The targetprotein must then be separatedfrom other proteins and anyother components that remain in the clarified mix (lipids,
Harvest Tube
Shake FlaskAutoclavable
Bench-Top Fermentorin-situ Sterilizable
Pilot-Scale Fermentor
RingSparger Tempered Water
FermentationScale-Up
Sparge GasAnalysis
Vent GasAnalysis
figure 5 – Research and development scale-up
nucleic acids, carbohydrates, etc.)One technology that is commonlyused for the purification step ision-exchange chromatography.The equipment includes columnsthat are packed with beads thatabsorb the protein molecules as they are pumped through.The captured proteins are thendesorbed by adding competingions (salt) and the proteins areeluted from the column in theorder determined by the strengthof the bonds. The bond strengthis in turn determined by thecharges on the individual aminoacids. When the target moleculeselute from the column, they canbe diverted to the pure productstream which then passes througha gel permeation system to removethe salt. The last procedure inthe bulk manufacturing facility is to freeze dry the purified APIwhich should now be at least99.99% pure.
PAT in Large Molecule Bulk Pharma
There is the opportunity to make use of online processanalytical technology throughoutdownstream processing. The two areas getting the mostattention, however, appear ateither end of this flow diagram.
Monitoring the fermentationprocess online is importantbecause of the possibility of significant batch-to-batchvariation. A similar case can be made for the freeze drying(Lyophilization) or vacuum dryingprocesses. The remainder of thisapplications note will concentrateon the optimization of thefermentation process.
Process Optimization
The primary objective offermentation process developmentis to ensure that the sterilecultivation medium contains all the necessary nutrients atconcentrations that will firstpromote biomass growth andthen force rigorous productionof the target molecule. Microbesrequire sources of carbon,nitrogen, oxygen and inorganicions as well as some species-specific nutrients. The numerousgrowth medium candidates arebest compared by using onlineanalysis of the effluent gas.Discrete analyzers can be usedfor measuring oxygen andcarbon dioxide but a morecomprehensive and precisemethod of monitoring metabolicactivity is to use a multistreamprocess mass spectrometer.
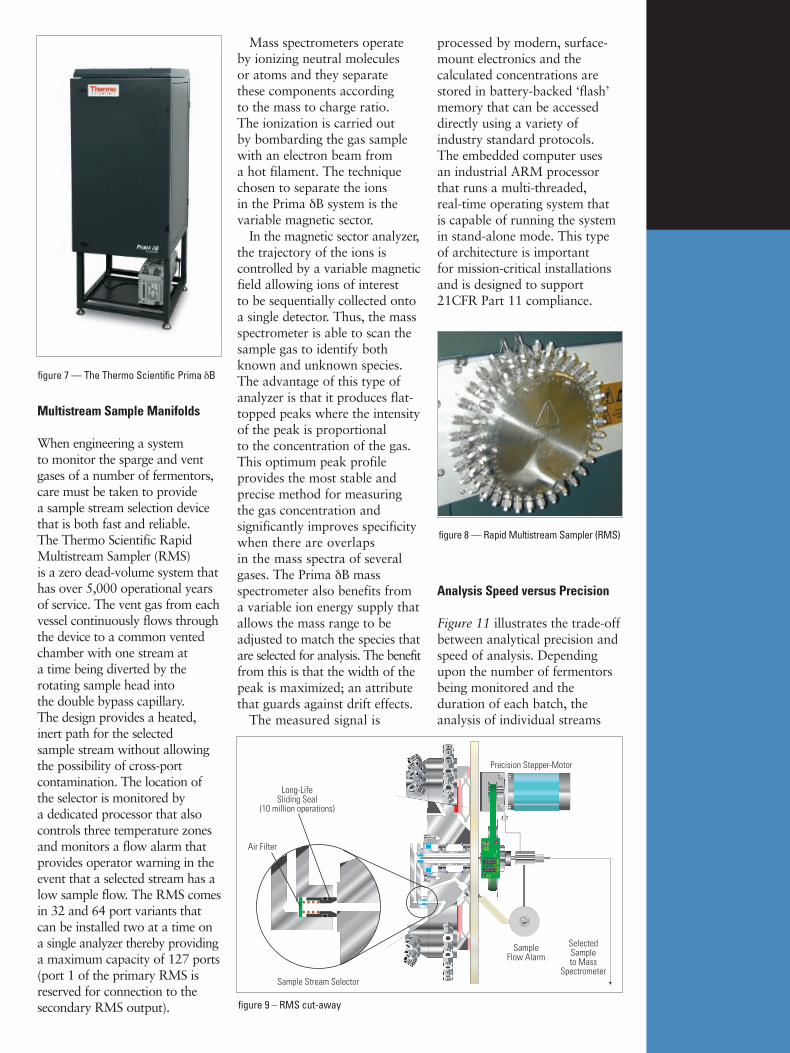
The most popular model for thisapplication is the ThermoScientific Prima δB illustrated infigure 7. A single analyzer istypically used to monitor a largenumber of heated benchtopfermentors (althoughfermentation is exothermic, smallscale fermentors tend to losemore heat than they produce).The software configurablenature of mass spectrometryallows the microbiologist tolook for small concentrations of molecules that might indicateproblems with a selected batchthat isn’t performing as expected.For example, ethanol can beproduced if there is too muchcarbohydrate available. Anotherimportant control parameter inthe fermentation process is therespiratory quotient (RQ). Thisis the ratio of the carbon dioxideevolution rate (CER) and theoxygen uptake rate (OUR). Thisratio is used for the onlinederivation of biomass and as anindicator of the substrates beingconsumed and the productsbeing formed. In addition to the permanent gases, the aqueous concentrations of many organic species can be determined by analysis of the vent gas.
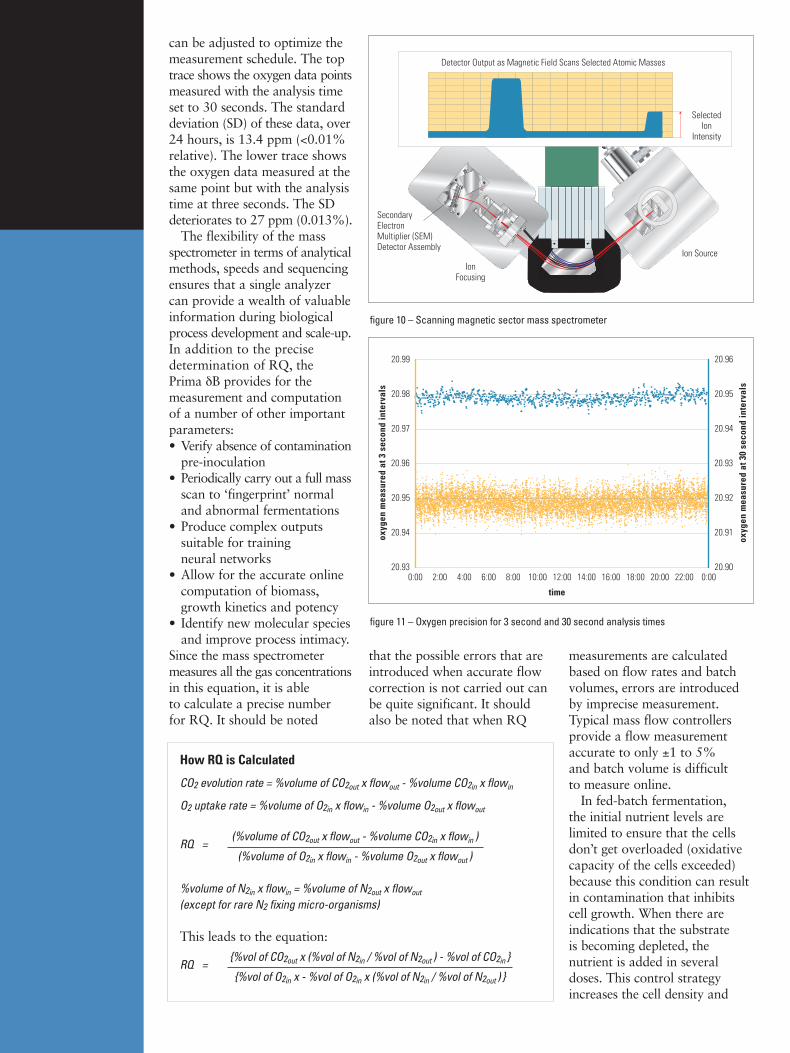
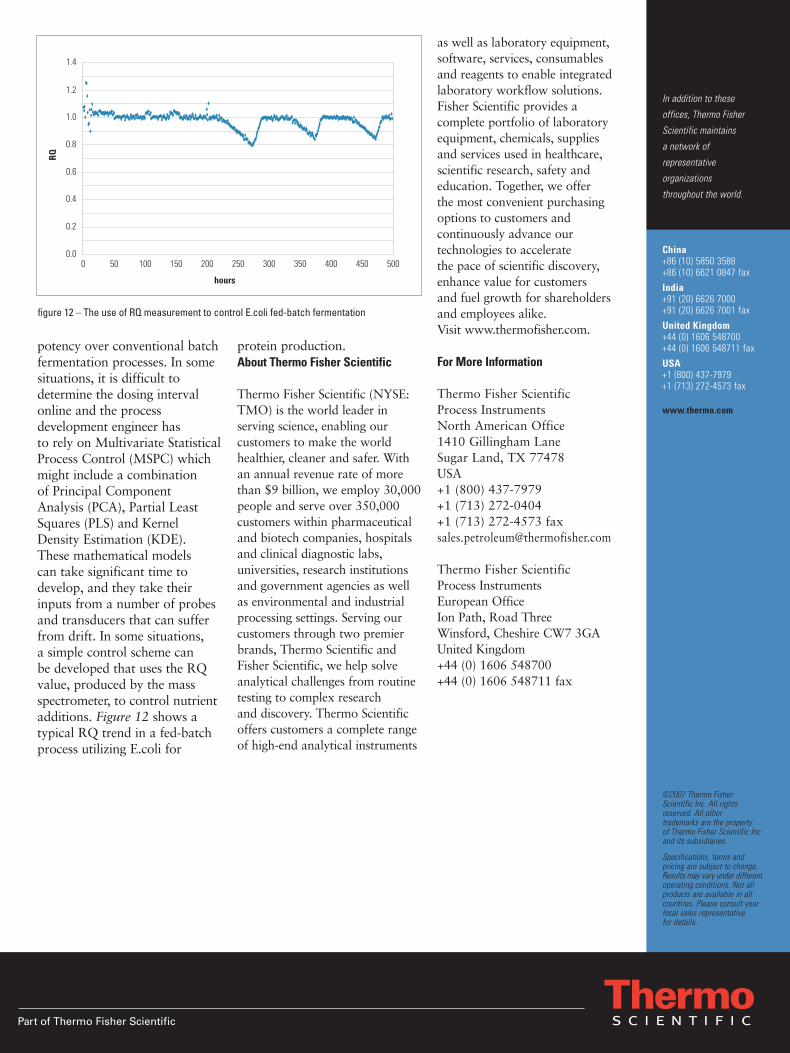
When engineering a system to monitor the sparge and ventgases of a number of fermentors,care must be taken to provide a sample stream selection devicethat is both fast and reliable. The Thermo Scientific RapidMultistream Sampler (RMS) is a zero dead-volume system thathas over 5,000 operational yearsof service. The vent gas from eachvessel continuously flows through the device to a common ventedchamber with one stream at a time being diverted by therotating sample head into the double bypass capillary. The design provides a heated,inert path for the selected sample stream without allowingthe possibility of cross-portcontamination. The location ofthe selector is monitored by a dedicated processor that alsocontrols three temperature zonesand monitors a flow alarm thatprovides operator warning in theevent that a selected stream has alow sample flow. The RMS comesin 32 and 64 port variants thatcan be installed two at a time ona single analyzer thereby providinga maximum capacity of 127 ports(port 1 of the primary RMS isreserved for connection to thesecondary RMS output).
Mass spectrometers operateby ionizing neutral molecules or atoms and they separate these components according to the mass to charge ratio. The ionization is carried out by bombarding the gas samplewith an electron beam from a hot filament. The techniquechosen to separate the ions in the Prima δB system is thevariable magnetic sector.
In the magnetic sector analyzer,the trajectory of the ions iscontrolled by a variable magneticfield allowing ions of interest to be sequentially collected ontoa single detector. Thus, the massspectrometer is able to scan thesample gas to identify bothknown and unknown species.The advantage of this type ofanalyzer is that it produces flat-topped peaks where the intensityof the peak is proportional to the concentration of the gas.This optimum peak profileprovides the most stable andprecise method for measuringthe gas concentration andsignificantly improves specificitywhen there are overlaps in the mass spectra of severalgases. The Prima δB massspectrometer also benefits froma variable ion energy supply thatallows the mass range to beadjusted to match the species thatare selected for analysis. The benefitfrom this is that the width of thepeak is maximized; an attributethat guards against drift effects.
The measured signal is
processed by modern, surface-mount electronics and thecalculated concentrations arestored in battery-backed ‘flash’memory that can be accesseddirectly using a variety ofindustry standard protocols. The embedded computer uses an industrial ARM processorthat runs a multi-threaded, real-time operating system that is capable of running the systemin stand-alone mode. This typeof architecture is important for mission-critical installationsand is designed to support21CFR Part 11 compliance.
Analysis Speed versus Precision
Figure 11 illustrates the trade-offbetween analytical precision andspeed of analysis. Dependingupon the number of fermentorsbeing monitored and theduration of each batch, theanalysis of individual streams
figure 7 — The Thermo Scientific Prima δB
figure 8 — Rapid Multistream Sampler (RMS)
SelectedSampleto Mass
SpectrometerSample Stream Selector
Air Filter
Long-LifeSliding Seal
(10 million operations)
Precision Stepper-Motor
SampleFlow Alarm
figure 9 – RMS cut-away
can be adjusted to optimize themeasurement schedule. The toptrace shows the oxygen data pointsmeasured with the analysis timeset to 30 seconds. The standarddeviation (SD) of these data, over24 hours, is 13.4 ppm (<0.01%relative). The lower trace showsthe oxygen data measured at thesame point but with the analysistime at three seconds. The SDdeteriorates to 27 ppm (0.013%).
The flexibility of the massspectrometer in terms of analyticalmethods, speeds and sequencingensures that a single analyzercan provide a wealth of valuableinformation during biologicalprocess development and scale-up.In addition to the precisedetermination of RQ, the Prima δB provides for themeasurement and computationof a number of other importantparameters:• Verify absence of contamination
pre-inoculation• Periodically carry out a full mass
scan to ‘fingerprint’ normaland abnormal fermentations
• Produce complex outputssuitable for training neural networks
• Allow for the accurate onlinecomputation of biomass,growth kinetics and potency
• Identify new molecular speciesand improve process intimacy.
Since the mass spectrometermeasures all the gas concentrationsin this equation, it is able to calculate a precise number for RQ. It should be noted
that the possible errors that areintroduced when accurate flowcorrection is not carried out canbe quite significant. It shouldalso be noted that when RQ
measurements are calculatedbased on flow rates and batchvolumes, errors are introducedby imprecise measurement.Typical mass flow controllersprovide a flow measurementaccurate to only ±1 to 5% and batch volume is difficult to measure online.
In fed-batch fermentation, the initial nutrient levels arelimited to ensure that the cellsdon’t get overloaded (oxidativecapacity of the cells exceeded)because this condition can resultin contamination that inhibits cell growth. When there areindications that the substrate is becoming depleted, thenutrient is added in severaldoses. This control strategyincreases the cell density and
figure 11 – Oxygen precision for 3 second and 30 second analysis times
How RQ is Calculated
CO2 evolution rate = %volume of CO2out x flowout - %volume CO2in x flowin
O2 uptake rate = %volume of O2in x flowin - %volume O2out x flowout
RQ = (%volume of CO2out x flowout - %volume CO2in x flowin )
(%volume of O2in x flowin - %volume O2out x flowout )
%volume of N2in x flowin = %volume of N2out x flowout
(except for rare N2 fixing micro-organisms)
This leads to the equation:
RQ = {%vol of CO2out x (%vol of N2in / %vol of N2out ) - %vol of CO2in }
{%vol of O2in x - %vol of O2in x (%vol of N2in / %vol of N2out ) }
potency over conventional batchfermentation processes. In somesituations, it is difficult todetermine the dosing intervalonline and the processdevelopment engineer has to rely on Multivariate StatisticalProcess Control (MSPC) whichmight include a combination of Principal ComponentAnalysis (PCA), Partial LeastSquares (PLS) and KernelDensity Estimation (KDE).These mathematical models can take significant time todevelop, and they take theirinputs from a number of probesand transducers that can sufferfrom drift. In some situations, a simple control scheme can be developed that uses the RQvalue, produced by the massspectrometer, to control nutrientadditions. Figure 12 shows atypical RQ trend in a fed-batchprocess utilizing E.coli for
protein production.About Thermo Fisher Scientific
Thermo Fisher Scientific (NYSE:TMO) is the world leader inserving science, enabling ourcustomers to make the worldhealthier, cleaner and safer. Withan annual revenue rate of morethan $9 billion, we employ 30,000people and serve over 350,000customers within pharmaceuticaland biotech companies, hospitalsand clinical diagnostic labs,universities, research institutionsand government agencies as wellas environmental and industrialprocessing settings. Serving ourcustomers through two premierbrands, Thermo Scientific andFisher Scientific, we help solveanalytical challenges from routinetesting to complex research and discovery. Thermo Scientificoffers customers a complete rangeof high-end analytical instruments
as well as laboratory equipment,software, services, consumablesand reagents to enable integratedlaboratory workflow solutions.Fisher Scientific provides acomplete portfolio of laboratoryequipment, chemicals, suppliesand services used in healthcare,scientific research, safety andeducation. Together, we offer the most convenient purchasingoptions to customers andcontinuously advance ourtechnologies to accelerate the pace of scientific discovery,enhance value for customers and fuel growth for shareholdersand employees alike. Visit www.thermofisher.com.
Specifications, terms andpricing are subject to change.Results may vary under differentoperating conditions. Not allproducts are available in allcountries. Please consult yourlocal sales representative for details.