Introduction to the Models Introduction to the Models and Tools for Social Networks and Tools for Social Networks Kenneth Frank, College of Kenneth Frank, College of Education and Fisheries and Education and Fisheries and Wildlife Wildlife Help from: Ann Krause, Ben Help from: Ann Krause, Ben Michael Pogodzinski, Bo Yan, Michael Pogodzinski, Bo Yan, Min Sun, I-Chen, Chong Min Kim Min Sun, I-Chen, Chong Min Kim 1
Transcript
Introduction to the Models and Tools Introduction to the Models and Tools for Social Networksfor Social Networks
Kenneth Frank, College of Education and Kenneth Frank, College of Education and Fisheries and WildlifeFisheries and Wildlife
Help from: Ann Krause, Ben Michael Help from: Ann Krause, Ben Michael Pogodzinski, Bo Yan, Min Sun, I-Chen, Pogodzinski, Bo Yan, Min Sun, I-Chen,
Chong Min Kim Chong Min Kim
11
AbstractAbstract Many quantitative analyses in the social sciences are applied to data Many quantitative analyses in the social sciences are applied to data
regarding characteristics of people, but not to data describing interactions regarding characteristics of people, but not to data describing interactions among people. But interactions play an important role in affecting people’s among people. But interactions play an important role in affecting people’s behavior and beliefs that cannot be explained purely in terms of individual behavior and beliefs that cannot be explained purely in terms of individual attributes or organizational context. In this workshop we will focus on attributes or organizational context. In this workshop we will focus on analyzing social network data (who interacts with whom) so that we can relate analyzing social network data (who interacts with whom) so that we can relate people's interactions with what they think and do. We draw on statistical people's interactions with what they think and do. We draw on statistical concepts that account for the unusual nature of network data as well as concepts that account for the unusual nature of network data as well as substantive theories across the social sciences to specify and interpret social substantive theories across the social sciences to specify and interpret social network models. network models.
Topics include models of influence through a social network, choices in a Topics include models of influence through a social network, choices in a social network, clustering and graphical representations; ethical issues and social network, clustering and graphical representations; ethical issues and IRB, and software. Throughout examples are given using simple toy data and IRB, and software. Throughout examples are given using simple toy data and analyses in published papers.analyses in published papers.
Students taking this workshop should have roughly one year of applied Students taking this workshop should have roughly one year of applied statistics so that they are extremely comfortable with the general linear model statistics so that they are extremely comfortable with the general linear model (regression and ANOVA), and analysis of 2x2 tables. (regression and ANOVA), and analysis of 2x2 tables.
22
33
44
55
66
77
88
OverviewOverview Introduction
Overview What Are Social Networks?
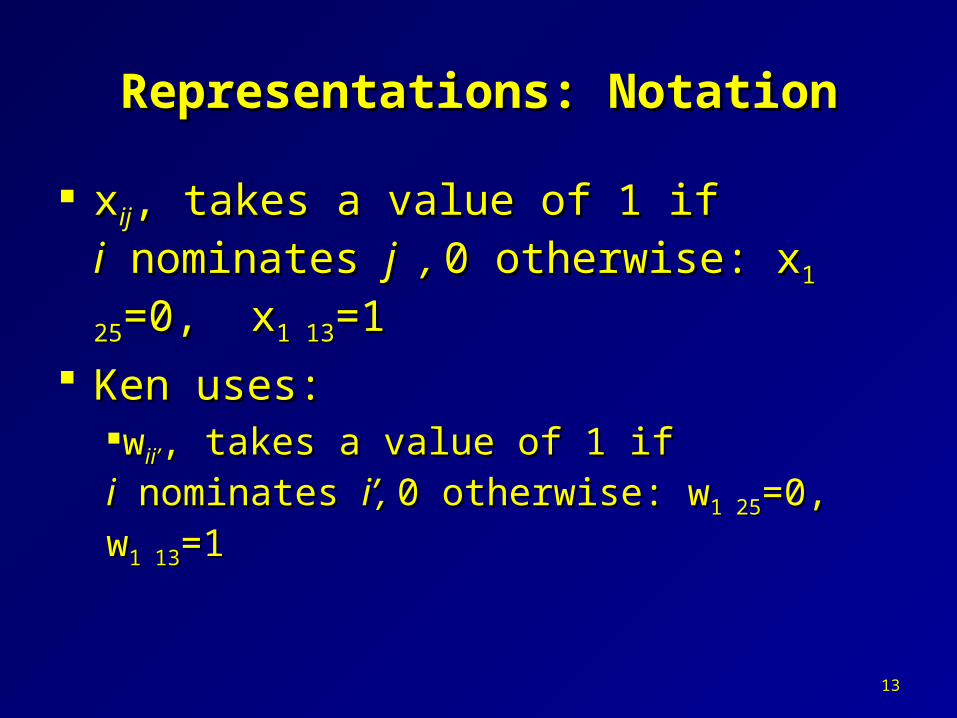
Representations of Social Networks: Sociomatrix Representations: Notation Representations: Sociogram
Characteristics of Social Network Data Ego Centric Data
FavoritesFavorites Barry Wellman on Misconceptions Doreian: Social Network Effects added to other... Breiger: Tracking Network Analysis from Metaph...
Mine Frank: Integrating Social Networks into Models and G... Personal Two Fundamental Processes Involving Human Social Networks Selection and Influence Causality Scramble Exercise
What Are Social Networks?What Are Social Networks?
A set of actors and the ties (resource flows) or relations A set of actors and the ties (resource flows) or relations (stable states) among them.(stable states) among them. close colleagues (relation) among teachers (actors)close colleagues (relation) among teachers (actors) help (tie) one teacher (actor) provides to another help (tie) one teacher (actor) provides to another communication (tie) between people (actors) in an organizationcommunication (tie) between people (actors) in an organization friendships (relation) among politicians (actors)friendships (relation) among politicians (actors) links (relation) among web sites (actors)links (relation) among web sites (actors) referrals (tie) among social service agencies (actors)referrals (tie) among social service agencies (actors)
For me: actors must For me: actors must have agencyhave agency Able to take deliberate actionAble to take deliberate action Actor network theory ? Can artifacts have agency and take Actor network theory ? Can artifacts have agency and take
deliberate action?deliberate action? More than BookFaceMore than BookFace
1010
Format of Network Data (W)Format of Network Data (W)
Your name: Lisa Jones (person 1)Please indicate who helped you with computers at xxx and the frequency with which you interact with each person.
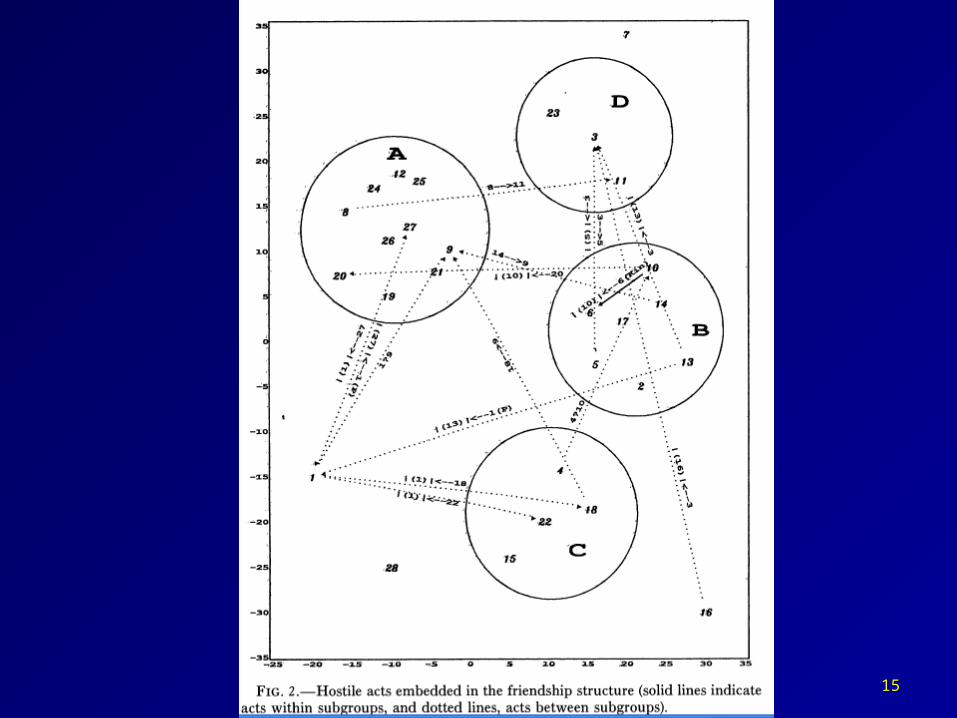
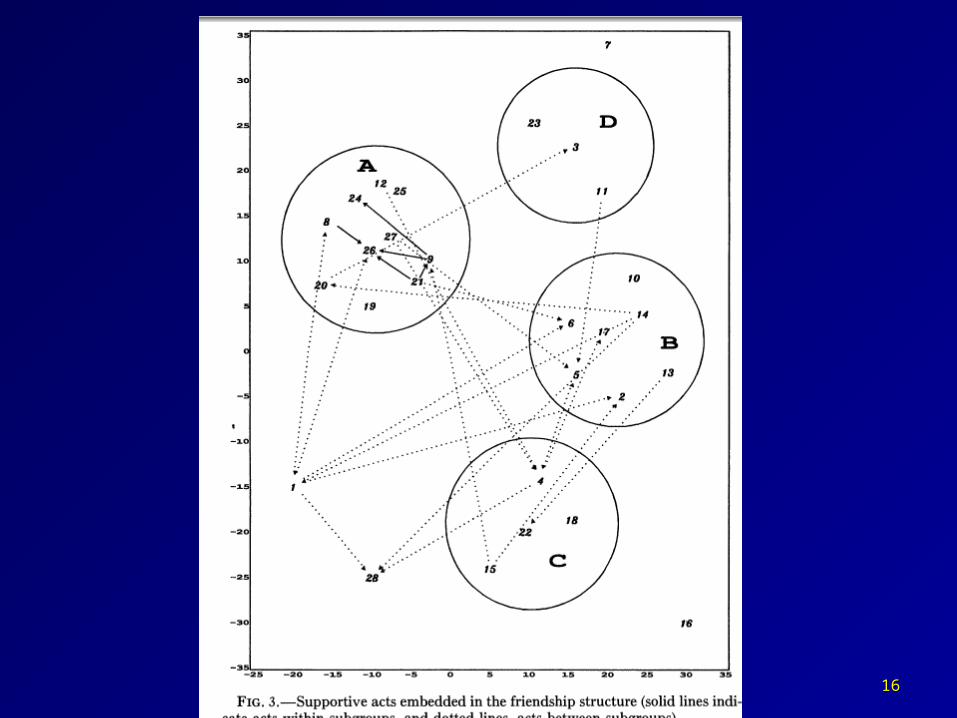
Representations of Social NetworksRepresentations of Social NetworksFriendships among the French financial eliteFriendships among the French financial elite
Lines indicate friendships: solid within subgroups, dotted between subgroups.
numbers represent actors
Rgt,Cen,Soc,Non = political parties; B=Banker, T=treasury; E=Ecole National D’administration
Frank, K.A. & Yasumoto, J. (1998). "Linking Action to Social Structure within a System: Social Capital Within and Between Subgroups." American Journal of Sociology, Volume 104, No 3, pages 642-686 1414
1515
1616
1717
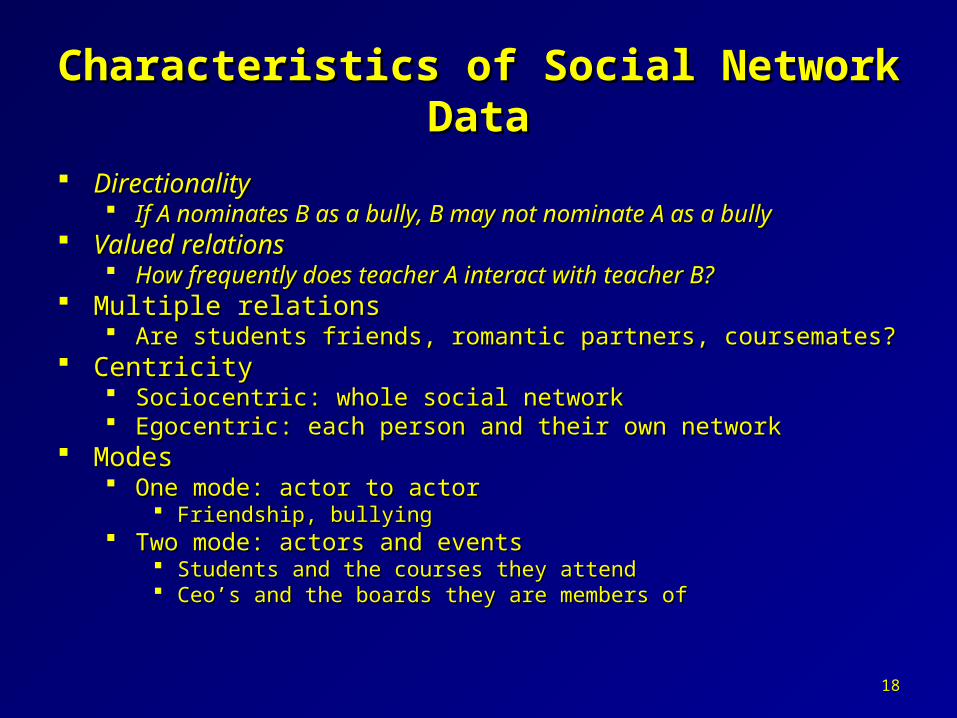
Characteristics of Social Network DataCharacteristics of Social Network Data
DirectionalityDirectionality If A nominates B as a bully, B may not nominate A as a bullyIf A nominates B as a bully, B may not nominate A as a bully
Valued relationsValued relations How frequently does teacher A interact with teacher B?How frequently does teacher A interact with teacher B?
Multiple relationsMultiple relations Are students friends, romantic partners, coursemates?Are students friends, romantic partners, coursemates?
CentricityCentricity Sociocentric: whole social networkSociocentric: whole social network Egocentric: each person and their own networkEgocentric: each person and their own network
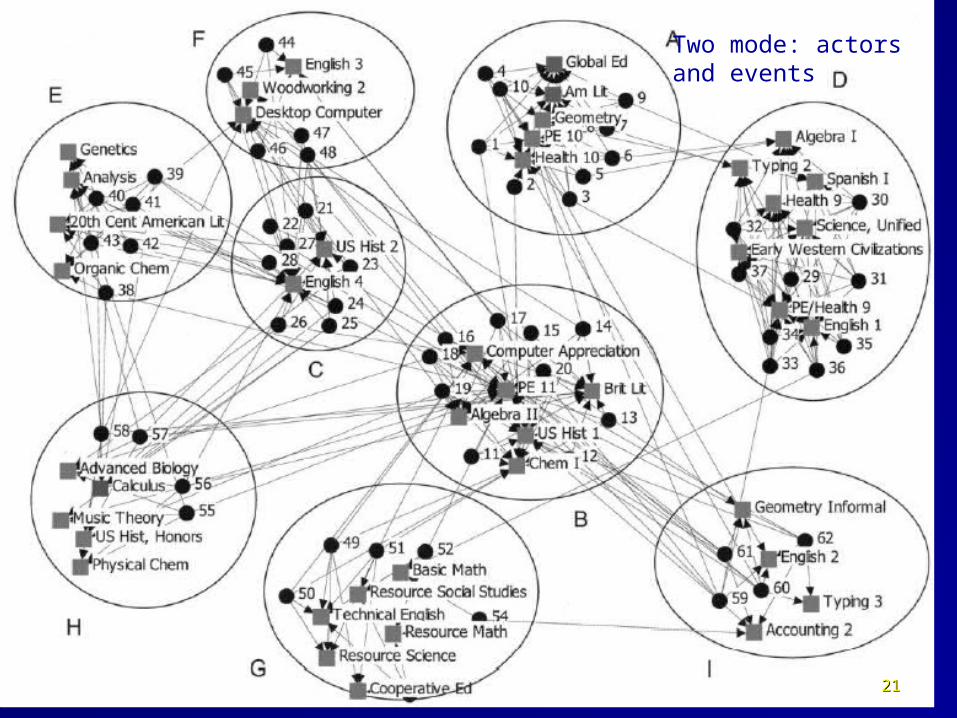
ModesModes One mode: actor to actor One mode: actor to actor
Friendship, bullyingFriendship, bullying Two mode: actors and eventsTwo mode: actors and events
Students and the courses they attendStudents and the courses they attend Ceo’s and the boards they are members of Ceo’s and the boards they are members of
1818
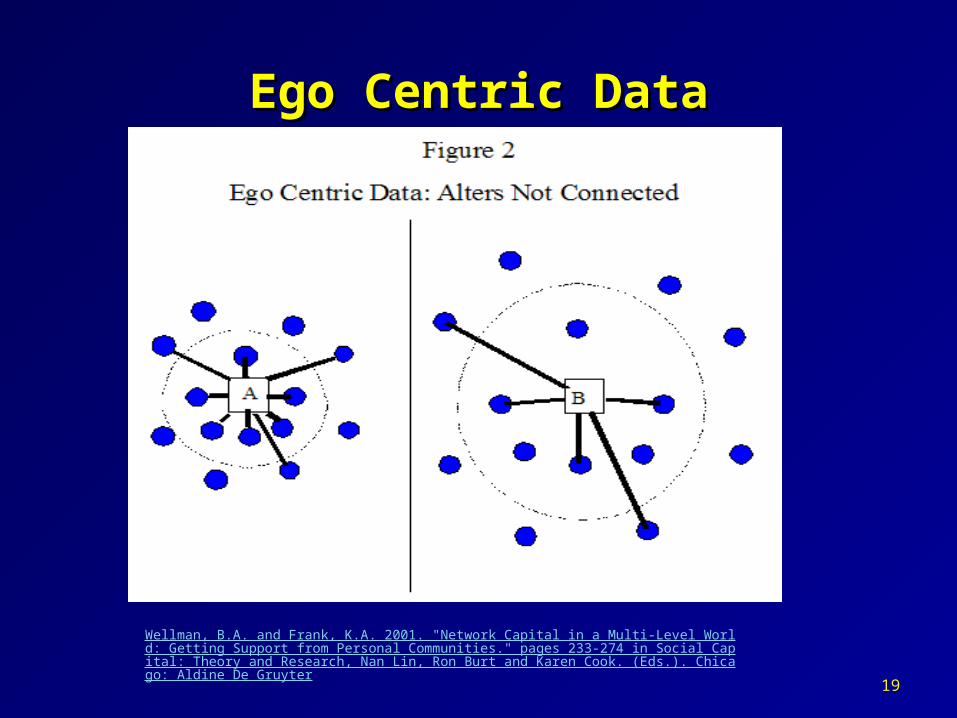
Ego Centric DataEgo Centric Data
Wellman, B.A. and Frank, K.A. 2001. "Network Capital in a Multi-Level World: Getting Support from Personal Communities." pages 233-274 in Social Capital: Theory and Research, Nan Lin, Ron Burt and Karen Cook. (Eds.). Chicago: Aldine De Gruyter
1919
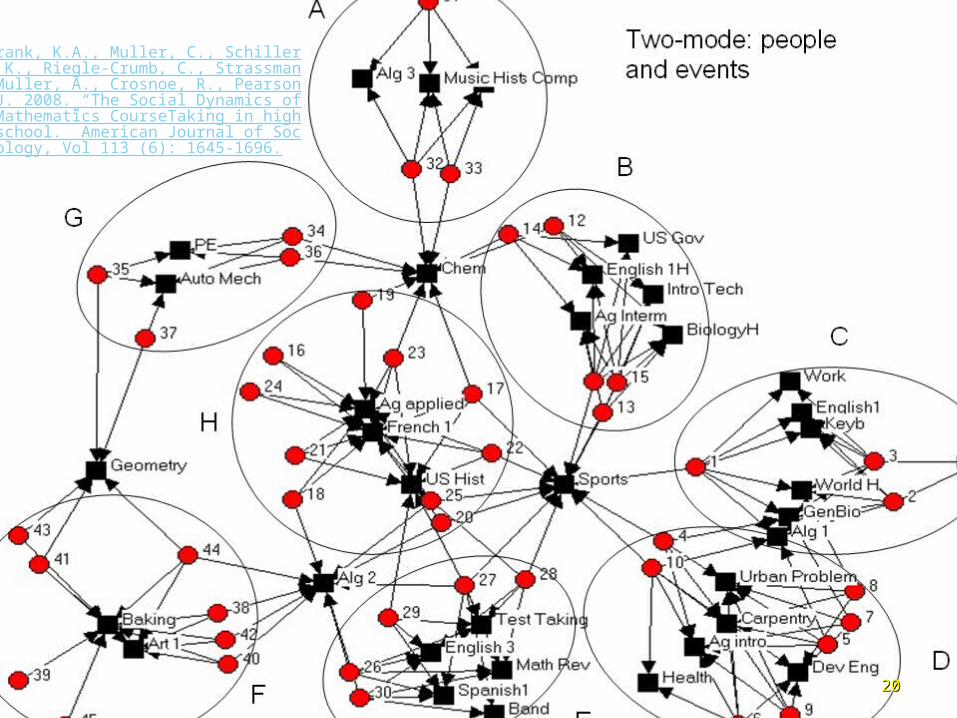
Frank, K.A., Muller, C., Schiller, K., Riegle-Crumb, C., Strassman-Muller, A., Crosnoe, R., Pearson J. 2008. “The Social Dynamics of Mathematics CourseTaking in high school.” American Journal of Sociology, Vol 113 (6): 1645-1696.
2020
Two mode: actors and events
2121
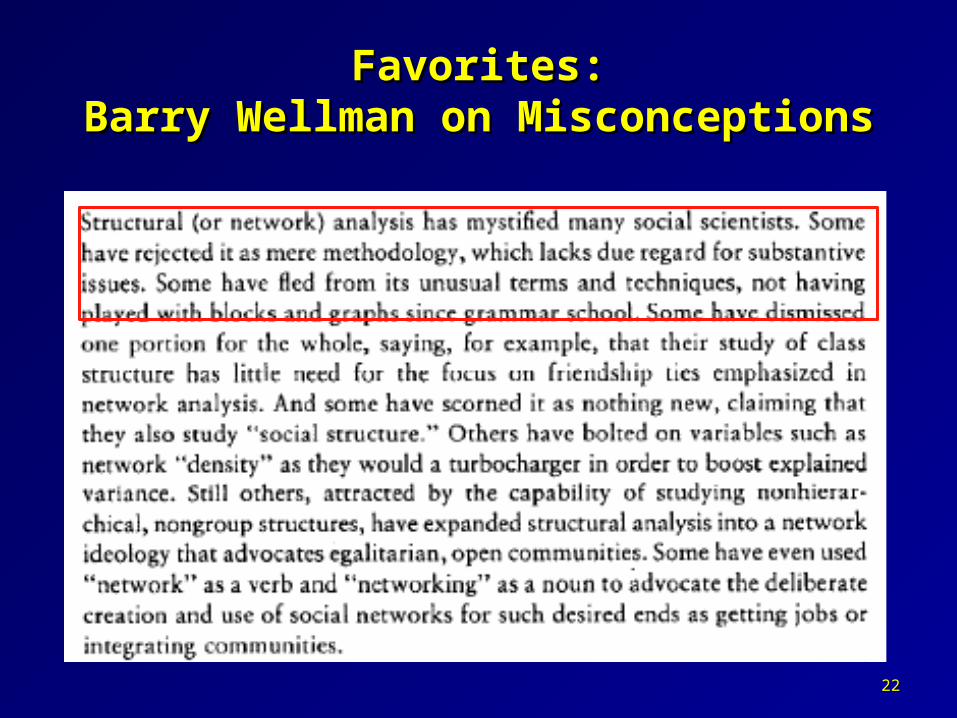
Favorites:Favorites:Barry Wellman on MisconceptionsBarry Wellman on Misconceptions
2222
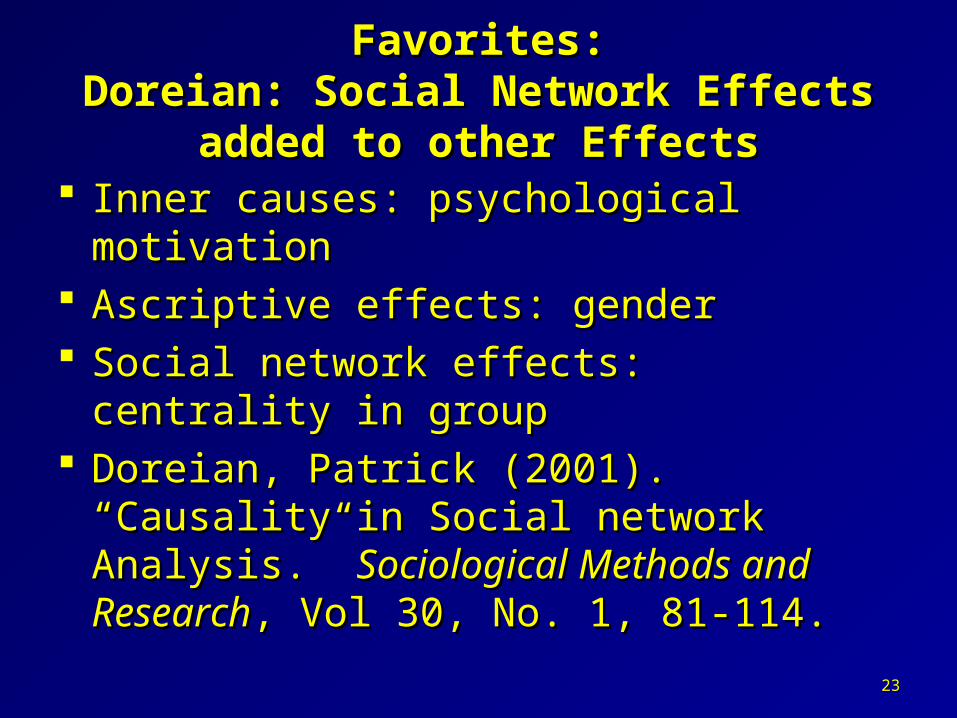
Favorites:Favorites:Doreian: Social Network Effects added to Doreian: Social Network Effects added to
other Effectsother Effects Inner causes: psychological motivationInner causes: psychological motivation Ascriptive effects: genderAscriptive effects: gender Social network effects: centrality in groupSocial network effects: centrality in group Doreian, Patrick (2001). “Causality in Doreian, Patrick (2001). “Causality in
Social network Analysis.” Social network Analysis.” Sociological Sociological Methods and ResearchMethods and Research, Vol 30, No. 1, 81-, Vol 30, No. 1, 81-114.114.
2323
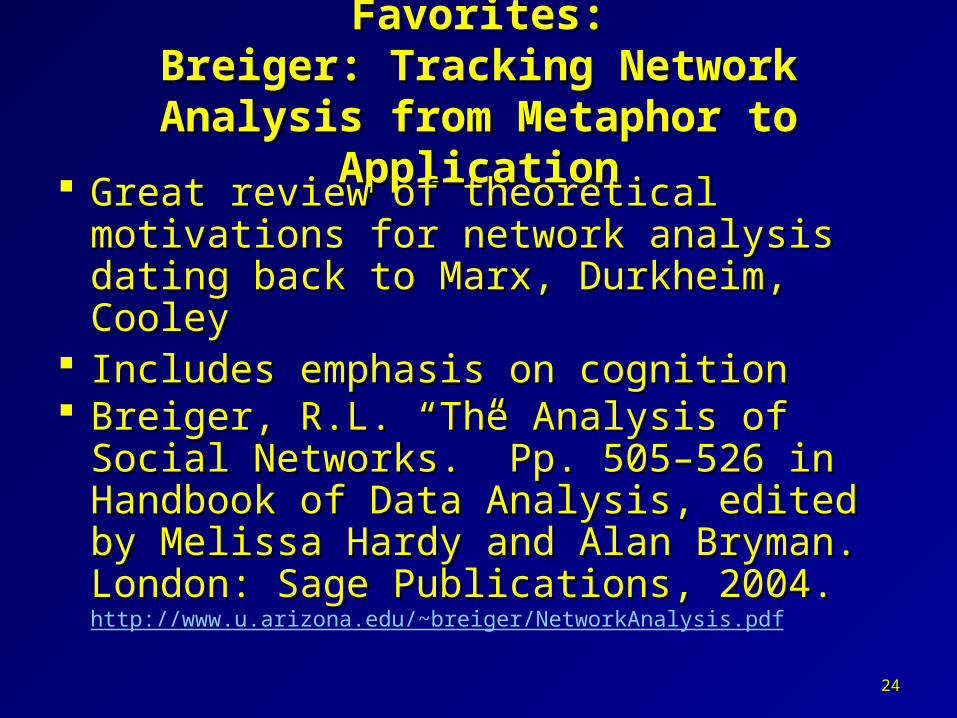
Favorites:Favorites:Breiger: Tracking Network Analysis from Breiger: Tracking Network Analysis from
Metaphor to ApplicationMetaphor to Application Great review of theoretical motivations for Great review of theoretical motivations for
network analysis dating back to Marx, network analysis dating back to Marx, Durkheim, CooleyDurkheim, Cooley
Includes emphasis on cognition Includes emphasis on cognition Breiger, R.L. “The Analysis of Social Breiger, R.L. “The Analysis of Social
Networks.” Pp. 505–526 in Handbook of Networks.” Pp. 505–526 in Handbook of Data Analysis, edited by Melissa Hardy Data Analysis, edited by Melissa Hardy and Alan Bryman. London: Sage and Alan Bryman. London: Sage Publications, 2004. Publications, 2004. http://www.u.arizona.edu/~breiger/NetworkAnalysis.pdf
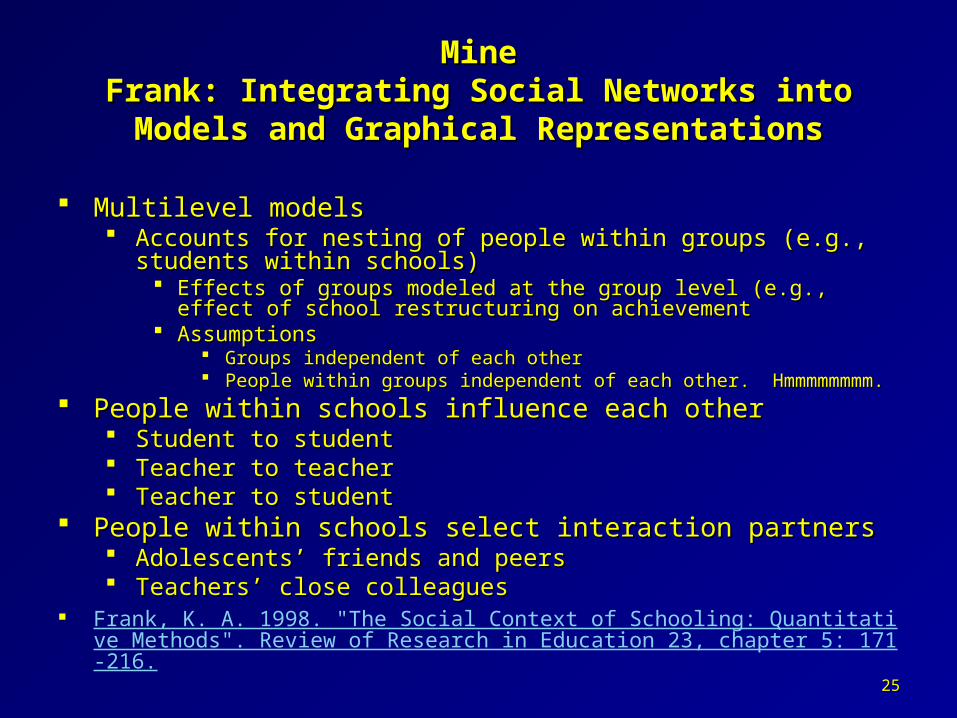
Multilevel modelsMultilevel models Accounts for nesting of people within groups (e.g., students within Accounts for nesting of people within groups (e.g., students within
schools)schools) Effects of groups modeled at the group level (e.g., effect of school Effects of groups modeled at the group level (e.g., effect of school
restructuring on achievementrestructuring on achievement AssumptionsAssumptions
Groups independent of each otherGroups independent of each other People within groups independent of each other. Hmmmmmmmm.People within groups independent of each other. Hmmmmmmmm.
People within schools influence each otherPeople within schools influence each other Student to studentStudent to student Teacher to teacherTeacher to teacher Teacher to studentTeacher to student
People within schools select interaction partnersPeople within schools select interaction partners Adolescents’ friends and peersAdolescents’ friends and peers Teachers’ close colleaguesTeachers’ close colleagues
Frank, K. A. 1998. "The Social Context of Schooling: Quantitative Methods". Review of Research in Education 23, chapter 5: 171-216.
Social Processes in SchoolsSocial Processes in Schools
2626
PersonalPersonal
I started my work with Valerie Lee, my I started my work with Valerie Lee, my dissertation chair was Tony Bryk, and my first dissertation chair was Tony Bryk, and my first faculty mentor was Steve Raudenbush. faculty mentor was Steve Raudenbush. Raudenbush, S. W., and A.S. Bryk. 2002Raudenbush, S. W., and A.S. Bryk. 2002
Hierarchical linear models: Applications and data Hierarchical linear models: Applications and data analysis methods (2nd ed.). Thousand Oaks, CA: analysis methods (2nd ed.). Thousand Oaks, CA: Sage.Sage.
This article is my recognition of their influences This article is my recognition of their influences and then pushing to networksand then pushing to networks Charles Bidwell played a strong rollCharles Bidwell played a strong roll Aaron Pallas, Steve Raudenbush and Noah Friedkin Aaron Pallas, Steve Raudenbush and Noah Friedkin
as editorsas editors
2727
Two Fundamental Processes Involving Two Fundamental Processes Involving Human Social Networks Human Social Networks
Influence: Change in actors’ beliefs or behaviors as a result of Influence: Change in actors’ beliefs or behaviors as a result of interaction with othersinteraction with others Teachers’ change uses of computers as a result of use of others’ Teachers’ change uses of computers as a result of use of others’
around them (Frank, Zhao and Borman 2004)around them (Frank, Zhao and Borman 2004) Adolescents’ change effort in school in response to peers’ effort (Frank Adolescents’ change effort in school in response to peers’ effort (Frank
et al 2008, AJS; )et al 2008, AJS; ) Selection: Actors choose with whom to interact as a function of the Selection: Actors choose with whom to interact as a function of the
characteristics of the chooser, chosen, and the dyadcharacteristics of the chooser, chosen, and the dyad Teachers choose to help others with technology based on close Teachers choose to help others with technology based on close
collegial ties (Frank and Zhao 2005)collegial ties (Frank and Zhao 2005) French bankers choose whom to take supportive or hostile action French bankers choose whom to take supportive or hostile action
against based on friendship structure (Frank and Yasumoto, 1998)against based on friendship structure (Frank and Yasumoto, 1998) Who does one child nominate as a bully?Who does one child nominate as a bully?
Each process relates social network to beliefs or behaviorsEach process relates social network to beliefs or behaviors
Frank, K.A., & Fahrbach, K. (1999). "Organizational Culture as a Complex System: balance and Information in Models of Influence and Selection." Special issue of Organization Science on Chaos and Complexity, Vol 10, No. 3, pp. 253-277. 2828
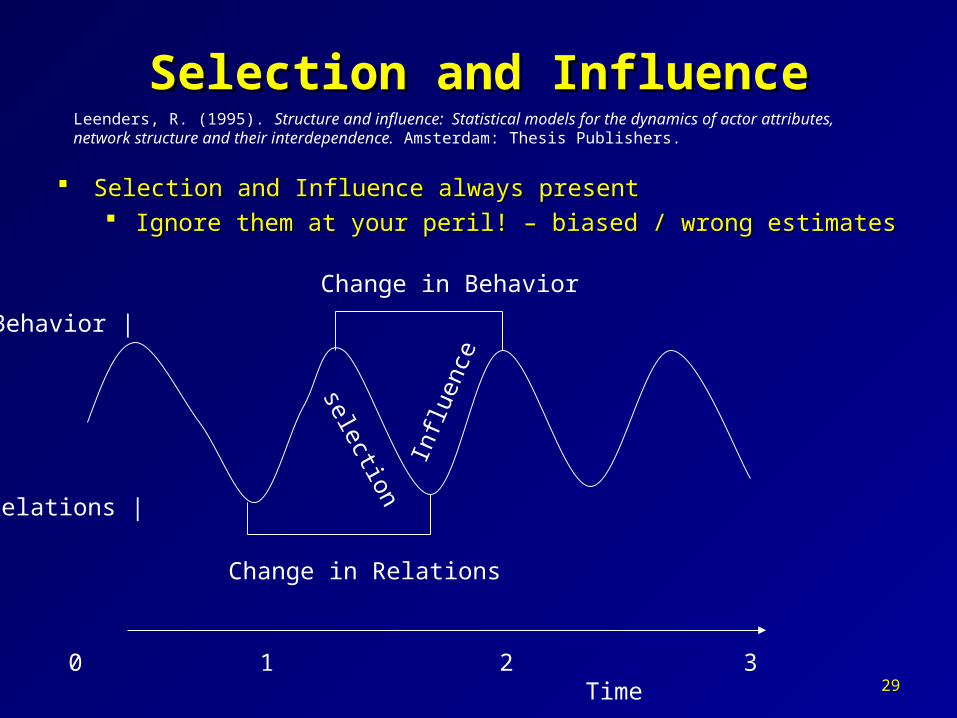
Selection and InfluenceSelection and Influence
Selection and Influence always presentSelection and Influence always present Ignore them at your peril! – biased / wrong estimatesIgnore them at your peril! – biased / wrong estimates
Influ
ence
selection
0 1 2 3 Time
Change in Behavior
Change in Relations
Behavior |
Relations |
Leenders, R. (1995). Structure and influence: Statistical models for the dynamics of actor attributes, network structure and their interdependence. Amsterdam: Thesis Publishers.
2929
CausalityCausality
Is it selection or influence?Is it selection or influence? Do people choose to interact with others like themselves (selection) or Do people choose to interact with others like themselves (selection) or
do they changedo they change Birds of a feather flock togetherBirds of a feather flock together
Beliefs/behaviors based on interactions with others (influence)? Beliefs/behaviors based on interactions with others (influence)? She’s hanging out with the wrong crowd!She’s hanging out with the wrong crowd!
Need longitudinal data!!!!!!!Need longitudinal data!!!!!!! Influence Influence
With whom did you talk over the last week: asked at week 2 (1With whom did you talk over the last week: asked at week 2 (12)2) What are your beliefs? (asked at week 1)What are your beliefs? (asked at week 1) What are your beliefs (asked at week 2)What are your beliefs (asked at week 2)
SelectionSelection With whom did you talk over the last week: asked at week 1 (0With whom did you talk over the last week: asked at week 1 (0 1) 1) With whom did you talk over the last week: asked at week 2 (1With whom did you talk over the last week: asked at week 2 (1 2) 2) What are your beliefs? (asked at week 1, or asked at weeks 1 and 2 and What are your beliefs? (asked at week 1, or asked at weeks 1 and 2 and
take the average)take the average)
3030
Scramble ExerciseScramble Exercise
Think: Identify a networkThink: Identify a network ActorsActors RelationsRelations
Process and bases of Influence Process and bases of Influence why would one person be influenced by another?why would one person be influenced by another?
Process and bases of SelectionProcess and bases of Selection why would one person choose to interact with a specific other?why would one person choose to interact with a specific other?
Form: Meet and share in groups of 3-4Form: Meet and share in groups of 3-4 Others: Question bases for making inferencesOthers: Question bases for making inferences
Scramble: Form new group of 3-4 peopleScramble: Form new group of 3-4 people Matchmaker (at lunch): Identify matches of interest Matchmaker (at lunch): Identify matches of interest
between members of first and second groupbetween members of first and second group
3131
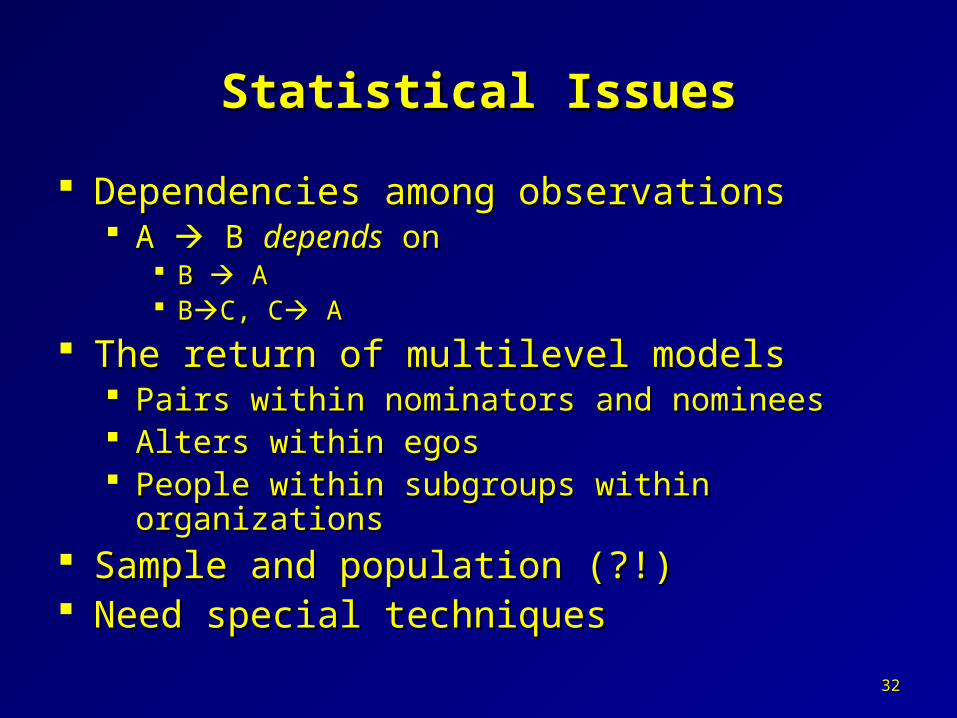
Statistical IssuesStatistical Issues
Dependencies among observationsDependencies among observations A A B B dependsdepends on on
B B A A BBC, CC, C A A
The return of multilevel modelsThe return of multilevel models Pairs within nominators and nomineesPairs within nominators and nominees Alters within egosAlters within egos People within subgroups within organizationsPeople within subgroups within organizations
Sample and population (?!)Sample and population (?!) Need special techniquesNeed special techniques
3232
OverviewOverview Introduction Influence
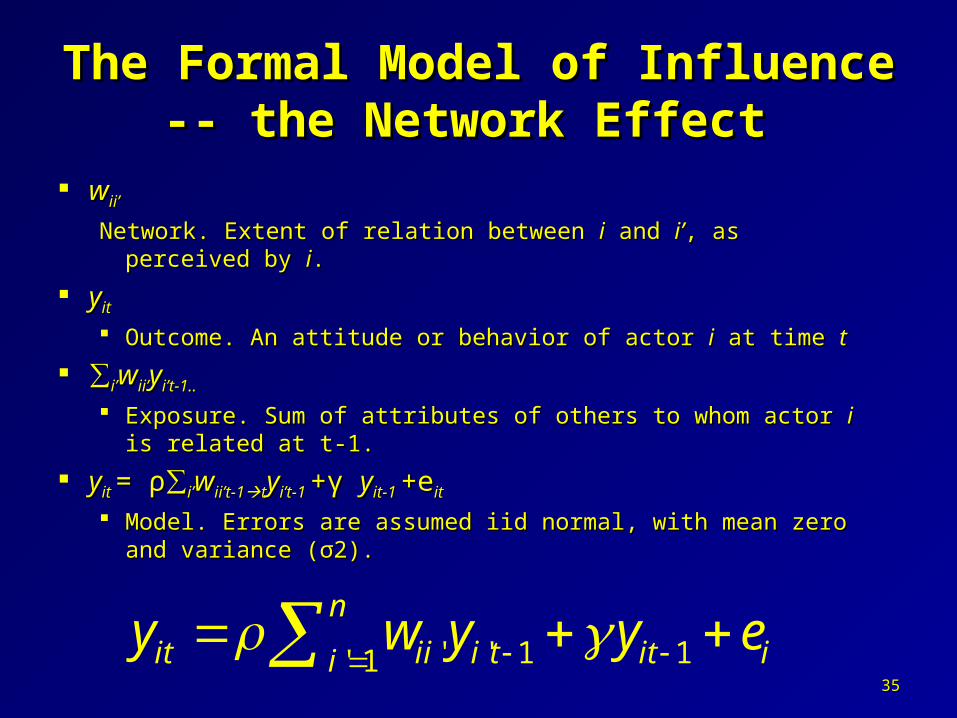
Influence: How Interactions Affect Beliefs and Behaviors The Formal Model of Influence -- the Network Effect Influence in Words (for teachers’ use of computers) Exposure: Graphical Representation
Model and Equation: Toy Data For Actor 3:
Influence Exercise Influence Model with Toy Data Software
Questions about W: Timing Studies of Teachers’ Implementation of Innovation
Measures of Y: Use of Computers Format of Network Data (W) General Influence Model in Empirical Example Definitions of Social Capital (Individual Level) Social Capital and the Network Effect Modification: Capacity to Convey Resource Longitudinal Model Effects of Social Capital on Implementation of Computers ... Importance of Controlling for the Prior: Longitudinal Data
Influence: How Interactions Affect Beliefs and BehaviorsInfluence: How Interactions Affect Beliefs and Behaviors http://edcc1a.cvm.msu.edu:8080/ess/echo/presentation/7de39417-3bb2-493a-bda2-e338666d0547 (0-7:52) (0-7:52)
Research questionsResearch questionsHow does a teacher’s interactions affect her implementation of innovations?How does a teacher’s interactions affect her implementation of innovations?How does a banker’s interactions affect her profitability?How does a banker’s interactions affect her profitability?How does an adolescent’s interactions affect her delinquency, alcohol use or How does an adolescent’s interactions affect her delinquency, alcohol use or engagement in school?engagement in school?
Theoretical Mechanisms (see Frank and Fahrbach, 1999)Theoretical Mechanisms (see Frank and Fahrbach, 1999)Frank, K.A., & Fahrbach, K. (1999). "Organizational Culture as a Complex System: balance and Information in Models of Influence and Selection." Special issue of Organization Science on Chaos and Complexity, Vol 10, No. 3, pp. 253-277.
Normative/conformity : change to conform to others aroundNormative/conformity : change to conform to others aroundInformation: change based on new informationInformation: change based on new informationDual processes: both applyDual processes: both apply
Friedkin, Noah (2002). Social Influence Network Theory: Toward a Science of Strategic Modification Friedkin, Noah (2002). Social Influence Network Theory: Toward a Science of Strategic Modification of Interpersonal Influence Systems. In National Academy Press: Dynamic Social Network of Interpersonal Influence Systems. In National Academy Press: Dynamic Social Network Modeling and Analysis: Workshop Summary and Papers (2003). Modeling and Analysis: Workshop Summary and Papers (2003). http://www.nap.edu/books/0309089522/html/
Model. Model. Errors are assumed iid normal, with mean zero and Errors are assumed iid normal, with mean zero and variance (σ2). variance (σ2).
' ' 1 1' 1
n
it ii i t it iiy w y y e
3535
Influence in Words Influence in Words (for technology use)(for technology use)
Use of technology time Use of technology time 22ii==
ρρ[[use of first colleague time use of first colleague time 1]1] + +ρρ[[use of second colleague time use of second colleague time 1]1] + +ρρ[[use of third colleagueuse of third colleague time time 1]1] + +γγ((use time use time 1)1)ii + +
Model and Equation: Toy DataModel and Equation: Toy Data
.029-.093.094-.027-.025.022
+ (.67)
0 1 0 1 0 1
0 1 0 1 0 1
x x x x x x
0 x 2.4=0 1 x 2.6=2.60 x 1.1=0 1 x 6-.5=-.50 x -3 =0 1 x – 1=-1 Total =(1.1)/3 =.37
=
3838
For Actor 3:For Actor 3:
yy3 time 23 time 2= intercept+ = intercept+ ρρ((yy2 time 12 time 1+ y+ y4 time 14 time 1+y+y6 time 16 time 1)/3 + )/3 + γγ y y3 time 1 3 time 1 + e+ e3 3
Assume Bob talks to Sue with frequency 1, to Lisa with frequency 3 Assume Bob talks to Sue with frequency 1, to Lisa with frequency 3 and not at all to Jane. Last year (at time 1), Sue’s organic farming and not at all to Jane. Last year (at time 1), Sue’s organic farming implementation behavior was a 9, Lisa’s was a 5 and Jane’s was 2. implementation behavior was a 9, Lisa’s was a 5 and Jane’s was 2.
What is the What is the meanmean of the exposure of Bob to his peers regarding of the exposure of Bob to his peers regarding organic farming? organic farming?
Hint ( Mean=sum/n, but what should Hint ( Mean=sum/n, but what should nn be?) be?)
Specify a model with two sources of exposure (e.g., within versus Specify a model with two sources of exposure (e.g., within versus between subgroups)between subgroups)
Influence answers
4040
Influence Model with Toy Data SoftwareInfluence Model with Toy Data Softwarehttp://edcc1a.cvm.msu.edu:8080/ess/echo/presentation/7de39417-3bb2-493a-bda2-e338666d0547
(7:52-32:51)(7:52-32:51) http://www.msu.edu/~kenfrank/software.htm#Influence_Models_ Influence program using means and merges in spss
influence program using proc means and merges in sas (21:20-32:51) (21:20-32:51) Sas tutorial: http://www.ats.ucla.edu/stat/sas/Sas tutorial: http://www.ats.ucla.edu/stat/sas/
Influence program using means and merges in stata [save and uncompress] [save and uncompress] Stata tutorial: Stata tutorial: http://www.ats.ucla.edu/stat/stata/
Exercise: Modifications to the Influence Exercise: Modifications to the Influence Model (SPSS)Model (SPSS)
Is influence increased if we weight exposure by the in-degree (number of Is influence increased if we weight exposure by the in-degree (number of times nominated) of the person influencing (i’)?times nominated) of the person influencing (i’)? Change: COMPUTE exposure=relate * yvar1Change: COMPUTE exposure=relate * yvar1 To: COMPUTE exposure=relate * yvar1*(indeg+1)To: COMPUTE exposure=relate * yvar1*(indeg+1)
Is influence stronger of we take the sum instead of the mean?Is influence stronger of we take the sum instead of the mean? Change: /exposure_mean_1=MEAN(exposure)Change: /exposure_mean_1=MEAN(exposure) To: /exposure_sum_1=SUM(exposure)To: /exposure_sum_1=SUM(exposure) Use exposure_sum_1 in the regressionUse exposure_sum_1 in the regression
What if you didn’t control for the prior?What if you didn’t control for the prior? Change: /METHOD=ENTER exposure_mean_1 yvar1.Change: /METHOD=ENTER exposure_mean_1 yvar1. To /METHOD=ENTER exposure_mean_1.To /METHOD=ENTER exposure_mean_1.
Does coefficient for exposure term depend on prior (interaction term)?Does coefficient for exposure term depend on prior (interaction term)? run influence for technologyrun influence for technology
4242
Exercise: Modifications to the Influence Exercise: Modifications to the Influence Model (SAS)Model (SAS)
Is influence increased if we weight exposure by the in-Is influence increased if we weight exposure by the in-degree (number of times nominated) of the person degree (number of times nominated) of the person influencing (i’)?influencing (i’)? Set useattr=Set useattr=1; 1;
Is influence stronger of we take the sum instead of the mean?Is influence stronger of we take the sum instead of the mean? Change: mean=totinfl Change: mean=totinfl To: sum=totinfl To: sum=totinfl
What if you didn’t control for the prior?What if you didn’t control for the prior? Change: model yvar2=totinfl yvar1;Change: model yvar2=totinfl yvar1; To: model yvar2=totinfl ;To: model yvar2=totinfl ;
Does coefficient for exposure term depend on prior (interaction Does coefficient for exposure term depend on prior (interaction term)term)
run influence for technologyrun influence for technology
4343
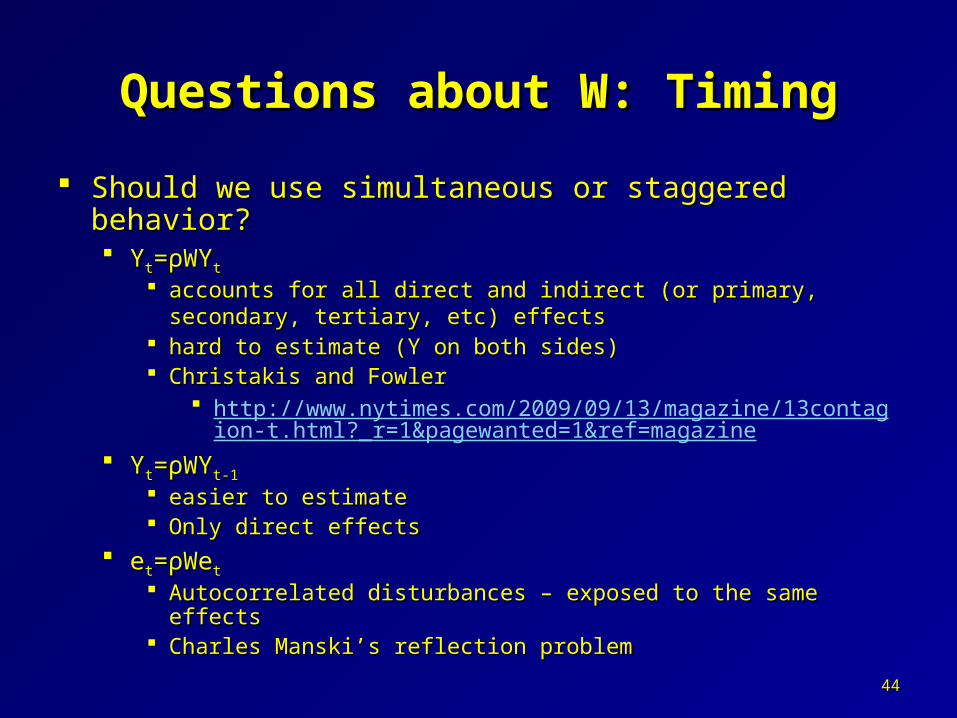
Questions about W: TimingQuestions about W: Timing
Should we use simultaneous or staggered behavior?Should we use simultaneous or staggered behavior? YYtt==ρρWYWYt t
accounts for all direct and indirect (or primary, secondary, tertiary, accounts for all direct and indirect (or primary, secondary, tertiary, etc) effectsetc) effects
hard to estimate (Y on both sides)hard to estimate (Y on both sides) Christakis and FowlerChristakis and Fowler
easier to estimateeasier to estimate Only direct effectsOnly direct effects
eett==ρρWeWett
Autocorrelated disturbances – exposed to the same effectsAutocorrelated disturbances – exposed to the same effects Charles Manski’s reflection problemCharles Manski’s reflection problem
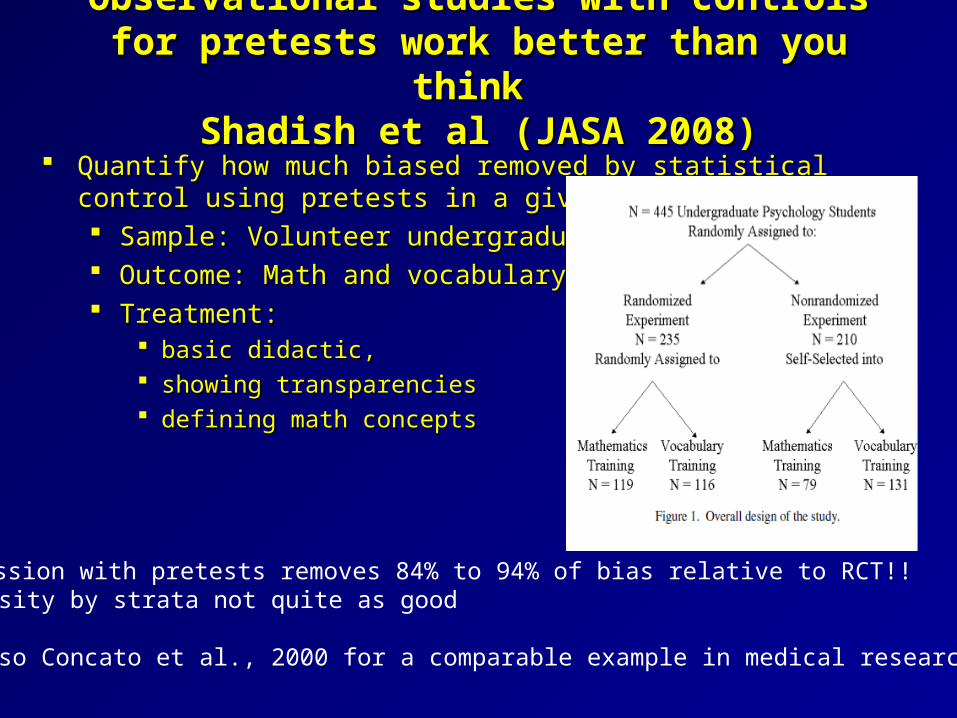
Observational studies with controls for Observational studies with controls for pretests work better than you think pretests work better than you think
Shadish et al (JASA 2008)Shadish et al (JASA 2008) Quantify how much biased removed by statistical control using Quantify how much biased removed by statistical control using
pretests in a given setting pretests in a given setting Sample: Volunteer undergraduatesSample: Volunteer undergraduates Outcome: Math and vocabulary testsOutcome: Math and vocabulary tests Treatment: Treatment:
basic didactic, basic didactic, showing transparenciesshowing transparencies defining math conceptsdefining math concepts
OLS Regression with pretests removes 84% to 94% of bias relative to RCT!!Propensity by strata not quite as good
See also Concato et al., 2000 for a comparable example in medical research
OLS might not workOLS might not work
So what would it take to change an So what would it take to change an inference?inference? How strong must a confound be to reduce How strong must a confound be to reduce
estimated effect below a threshold for making estimated effect below a threshold for making an inference?an inference?
https://www.msu.edu/~kenfrank/research.htm#causal
Related to: how bad would your sample have to be to Related to: how bad would your sample have to be to invalidate your inference?invalidate your inference?
Questions about W:Questions about W:Cohesion versus Structural EquivalenceCohesion versus Structural Equivalence
Cohesion -- direct connections/communicationCohesion -- direct connections/communicationExamples:Examples:
Students’ educational and aspirations decisions are influenced through Students’ educational and aspirations decisions are influenced through direct discussions direct discussions Adolescents’ delinquency is influenced by the delinquency of their Adolescents’ delinquency is influenced by the delinquency of their friendsfriends
Structural Equivalence -- common roles/comparison & comparisonStructural Equivalence -- common roles/comparison & comparisonExamples Examples
Students who occupy similar positions defined by curricular tracks may Students who occupy similar positions defined by curricular tracks may develop similar educational aspirations develop similar educational aspirations Businesses who sell to similar others may adopt similar practicesBusinesses who sell to similar others may adopt similar practices
Direct Influence versus Indirect Influence (Leenders)Direct Influence versus Indirect Influence (Leenders) Are you influenced by those who you do not talk to, but with whom Are you influenced by those who you do not talk to, but with whom
you share intermediaries?you share intermediaries?
4747
Redundant Effects through A NetworkRedundant Effects through A Network
4848
Questions about W: Row Normalization Questions about W: Row Normalization and Interpretation of Influenceand Interpretation of Influence
Divide values by row marginalDivide values by row marginal Different transformation for each subjectDifferent transformation for each subject
Changes metric to “influence units” Changes metric to “influence units” Access of one unit of expertise of one Access of one unit of expertise of one influence unitinfluence unit
increases number of uses of computers by xx per increases number of uses of computers by xx per year.year.
Theoretical meaning of “influence units” versus Theoretical meaning of “influence units” versus frequency of interactionfrequency of interaction Could you model “influence unit” with a selection Could you model “influence unit” with a selection
model?model?
4949
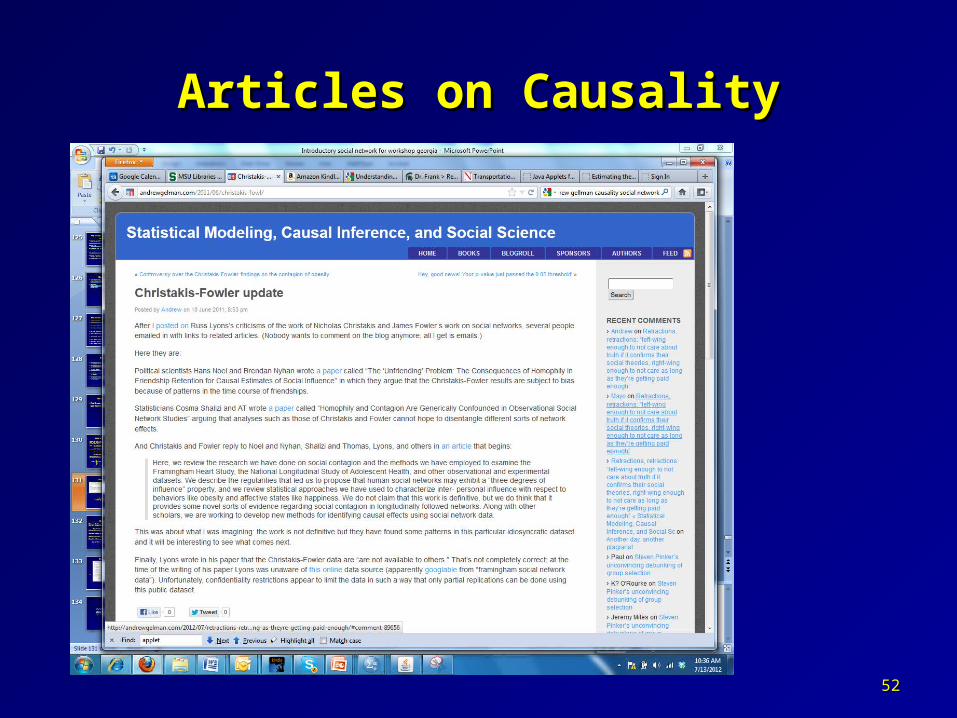
Articles on CausalityArticles on Causality
5050
Lyons, RussellThe spread of evidence-poor medicine via flawed social-network analysis, Stat., Politics, Policy 2, 1 (2011), Article 2. DOI: 10.2202/2151-7509.1024See Andrew Gelman: http://themonkeycage.org/blog/2011/06/10/1-lyonss-statistical-critiques-seem-reasonable-to-me-there-could-well-be-something-important-that-im-missing-but-until-i-hear-otherwise-for-example-in-a-convincing-reply-by-christakis-and-f/
Critique ofChristakis and Fowler“influence” model pages 5-6
Studies of Teachers’ Implementation of InnovationStudies of Teachers’ Implementation of Innovation http://edcc1a.cvm.msu.edu:8080/ess/echo/presentation/7de39417-3bb2-493a-bda2-e338666d0547
(32:51)40:00)(32:51)40:00)
Enumerated network within elementary schoolsEnumerated network within elementary schools Network questions: e.g., “who has helped you Network questions: e.g., “who has helped you
use computers in the last year”use computers in the last year” LongitudinalLongitudinal
2 measures of use of computers a year apart2 measures of use of computers a year apart Multiple studies:Multiple studies:
Technology, 6 schools across nation (1999-2000)Technology, 6 schools across nation (1999-2000) Technology in 26 schools in one state (2002-2003)Technology in 26 schools in one state (2002-2003) Reforms in 21 schools in one state (2004-2005)Reforms in 21 schools in one state (2004-2005) Collective Efficacy in 41 schools in two states (2005-Collective Efficacy in 41 schools in two states (2005-
Measures of Y: Use of ComputersMeasures of Y: Use of Computers
Teacher’s Use of Technology at Time 2 (α=.94)
I use computers to help me...
Never Yearly Monthly Weekly Daily 1 2 | 3 4 5 introduce new material into the curriculum. 1 2 | 3 4 5 guide student communication. 1 2 | 3 4 5 model an idea or activity. 1 2 | 3 4 5 connect the curriculum to real world tasks. 1 2 3 | 4 5 teach the required curriculum. 1 2 3 | 4 5 motivate students.| indicates mean response
Expertise (α=.76):Use at time 1 for teacher and student purposes (e.g., to help students communicate)Total number of applications with which the teacher was familiar at time 2extent to which the teacher reported being able to operate computers at time 2How confident the teacher felt with computers at time 2
5555
Format of Network Data (W)Format of Network Data (W)
Your name: Lisa Jones (person 1)Please indicate who helped you with computers at xxx and the frequency with which you interact with each person.
General Influence Model in Empirical ExampleGeneral Influence Model in Empirical Example
Y=Y=ρρWYWY Y: Teacher’s use of computers in Y: Teacher’s use of computers in
classroom (in times used per year)classroom (in times used per year) W: help or talk about technology (in days W: help or talk about technology (in days
per year)per year) ρρ: network effect of interaction on use of : network effect of interaction on use of
computerscomputers
Frank, K. A., Zhao, Y., and Borman (2004). Social Capital and the Diffusion of Innovations within Organizations: Application to the Implementation of Computer Technology in Schools." Sociology of Education, 77: 148-171.
5757
A
B
C
D
Help from CC
Exposure to Expertise of OthersExposure to Expertise of Others
5858
Questions regarding WQuestions regarding W
Take sum or Mean?Take sum or Mean? Timing?Timing? Cohesion versus structural equivalenceCohesion versus structural equivalence Social capital as a guideSocial capital as a guide
5959
Definitions of Social CapitalDefinitions of Social Capital
Alejandro Portes (1998 "Social Capital: Its Origins and Applications in Modern Sociology." Annual Review of Sociology, Vol 24, pages 1-24, page 7):
“...the consensus is growing in the literature that social capital stands for the ability of actors to secure benefits by virtue of membership in social networks or other social structures.” (emphasis added)
See also Nan Lin: (1999. Building a network theory of social capital. Connections, 22(1), 28-51.):
Refers to social capital as “Investment in social relations by individuals through which they gain access to embedded resources to enhance expected returns of instrumental or expressive actions. (emphasis added)
6060
Social Capital and the Network Social Capital and the Network EffectEffect
Social Capital=Social Capital=
potential to access resources through social potential to access resources through social relationsrelations
Resource =Expertise Resource =Expertise
Social relation=help from teacher i’ to teacher i.Social relation=help from teacher i’ to teacher i.
' ' 1' 1help expertise
n
ii i ti 6161
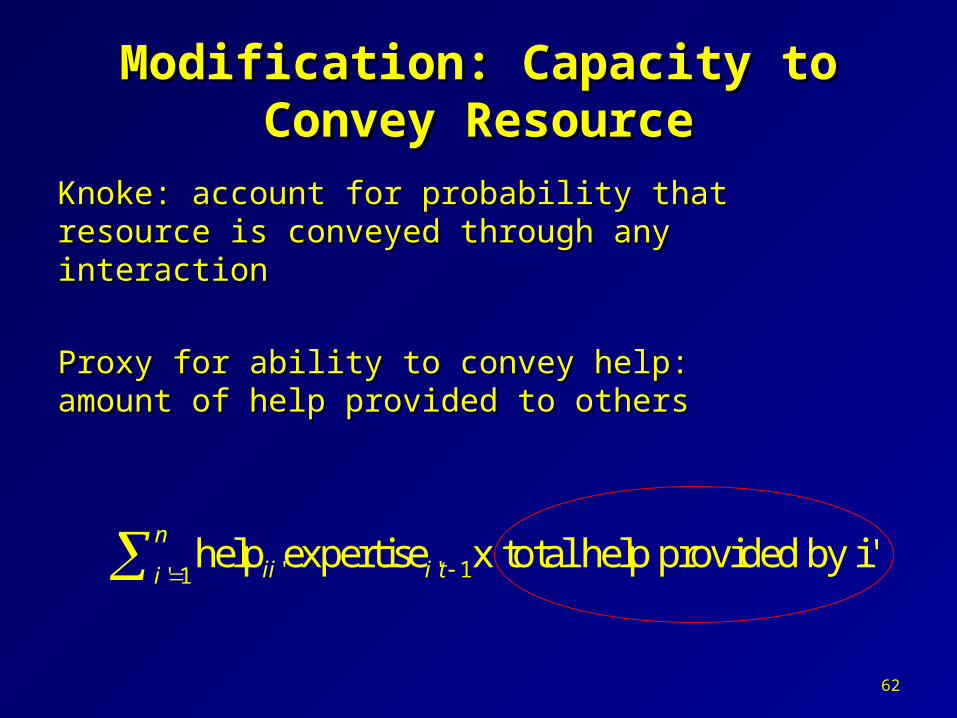
Modification: Capacity to Convey Modification: Capacity to Convey ResourceResource
Knoke: account for probability that resource is Knoke: account for probability that resource is conveyed through any interactionconveyed through any interaction
Proxy for ability to convey help: amount of help Proxy for ability to convey help: amount of help provided to othersprovided to others
' ' 1' 1help expertise x total help provided by i'
n
ii i ti
6262
Longitudinal ModelLongitudinal Model
yyii t t=intercept+=intercept+ρ∑ρ∑i’i’wwii’ii’ t-1→t t-1→tyyi’i’ t-1 t-1 x x ∑∑iiwwii’ii’ + +γγyyiit-1t-1
Take sum (resources accessed)Take sum (resources accessed) Partial control for selection of similar Partial control for selection of similar
or valuable others by including or valuable others by including yyiit-1t-1
Continuity through Continuity through γγ..
6363
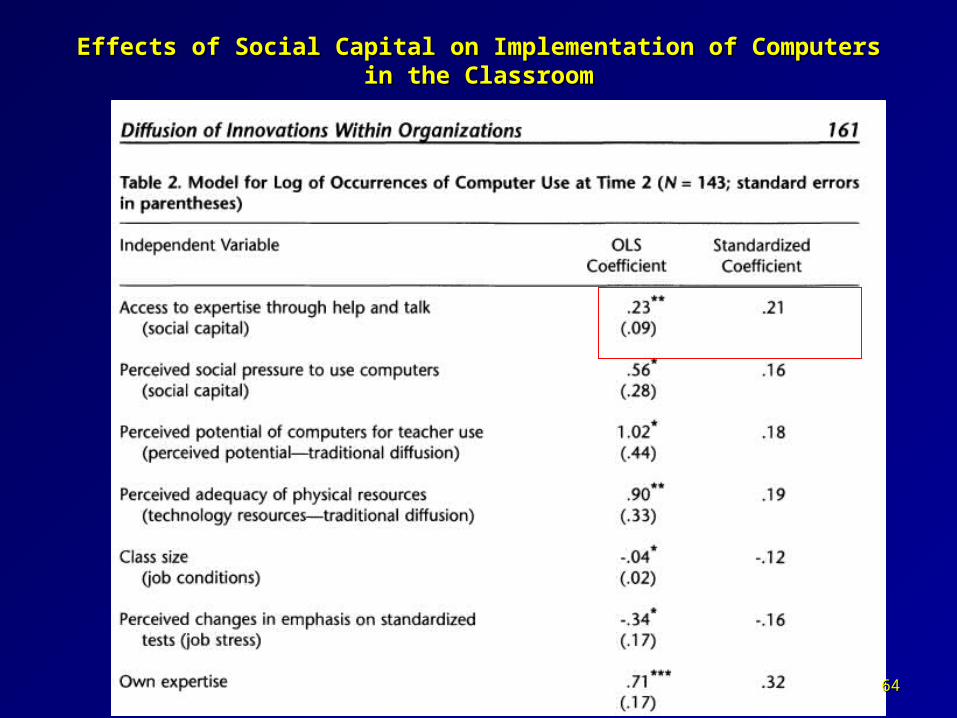
Effects of Social Capital on Implementation of Computers in the Effects of Social Capital on Implementation of Computers in the ClassroomClassroom
6464
Importance of Controlling for the Prior: Longitudinal DataImportance of Controlling for the Prior: Longitudinal Data
6565
Metric Based on Expertise/DayMetric Based on Expertise/Day
WY is an interaction: WY is an interaction: units = days per year units = days per year x x expertise expertise
Solution 1: interpret standardized coefficientsSolution 1: interpret standardized coefficients Network effect as strong as perceptionsNetwork effect as strong as perceptions
Solution 2:Solution 2: Divide by number of days in a year: WY/365,Divide by number of days in a year: WY/365,
new metric is access to expertise per daynew metric is access to expertise per day .23WY =.23.23WY =.23HelpHelpxxExpertise=84HelpExpertise=84HelpxxExpertise/365Expertise/365 Access of one unit of expertise per day increases Access of one unit of expertise per day increases
number of uses of computers by 84 per year.number of uses of computers by 84 per year.
6666
Your own Influence ModelA) Identify a network in which you are interested
B) Characterize the theoretical processes of influence that occur in the network. Throughwhat mechanisms due actors influence each other? What is conveyed through a tie or relation that could change an
actor’s belief or behavior?
C) write down a model of influence
1) How should W be specified -- what is the relation?
2) What is the time interval during which interaction occurs With a partner
I) Compare your representations of social structure
II) Compare your calculations for the example influence model
III) Critique the other person’s influence model
A) Does the model capture the theoretical influence processes? If not, what needs to beadded or modified?
B) Does the time interval seem reasonable?
C) Is the process based on cohesion or structural equivalence?
D) How would you measure the variables, w and y in your model?
6767
OverviewOverview Introduction Influence Selection
Selection: How Actors Choose Others with whom to Interact Selection Model Selection Exercise Estimation of Selection Model
The p1 Approach Visual Representations of p2 Model Reciprocity: Wii’ (as yij) Wi’i (as yji) Modeled Simultan... Basic Selection Model (p2) Toy Data Setting up p2 Example Output for p2 for Toy Data see also http://stat.g... Selection model (p2): Toy Data Prediction for Pair (2,5) Selection Model (p2): Toy DataPrediction for Pair (2,5) Selection Model (p2): Toy Data Selection Application Transition from Social Exchange to quasi ties ... Alternatives for Running p2
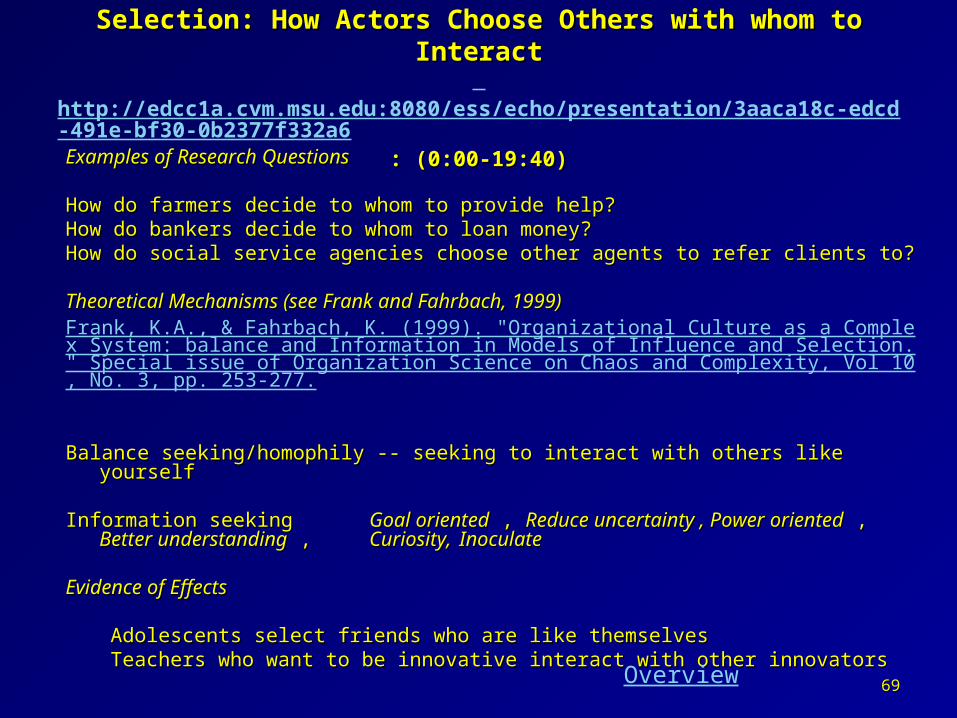
Examples of Research QuestionsExamples of Research Questions
How do farmers decide to whom to provide help?How do farmers decide to whom to provide help?How do bankers decide to whom to loan money?How do bankers decide to whom to loan money?How do social service agencies choose other agents to refer clients to?How do social service agencies choose other agents to refer clients to?
Theoretical Mechanisms (see Frank and Fahrbach, 1999)Theoretical Mechanisms (see Frank and Fahrbach, 1999)Frank, K.A., & Fahrbach, K. (1999). "Organizational Culture as a Complex System: balance and Information in Models of Influence and Selection." Special issue of Organization Science on Chaos and Complexity, Vol 10, No. 3, pp. 253-277.
Balance seeking/homophily -- seeking to interact with others like yourself Balance seeking/homophily -- seeking to interact with others like yourself
Information seekingInformation seeking Goal orientedGoal oriented , , Reduce uncertainty , Power orientedReduce uncertainty , Power oriented , , Better Better understandingunderstanding , , Curiosity, Curiosity, InoculateInoculate
Evidence of EffectsEvidence of Effects
Adolescents select friends who are like themselvesAdolescents select friends who are like themselvesTeachers who want to be innovative interact with other innovatorsTeachers who want to be innovative interact with other innovators
Selection: How Actors Choose Others with whom to InteractSelection: How Actors Choose Others with whom to Interact
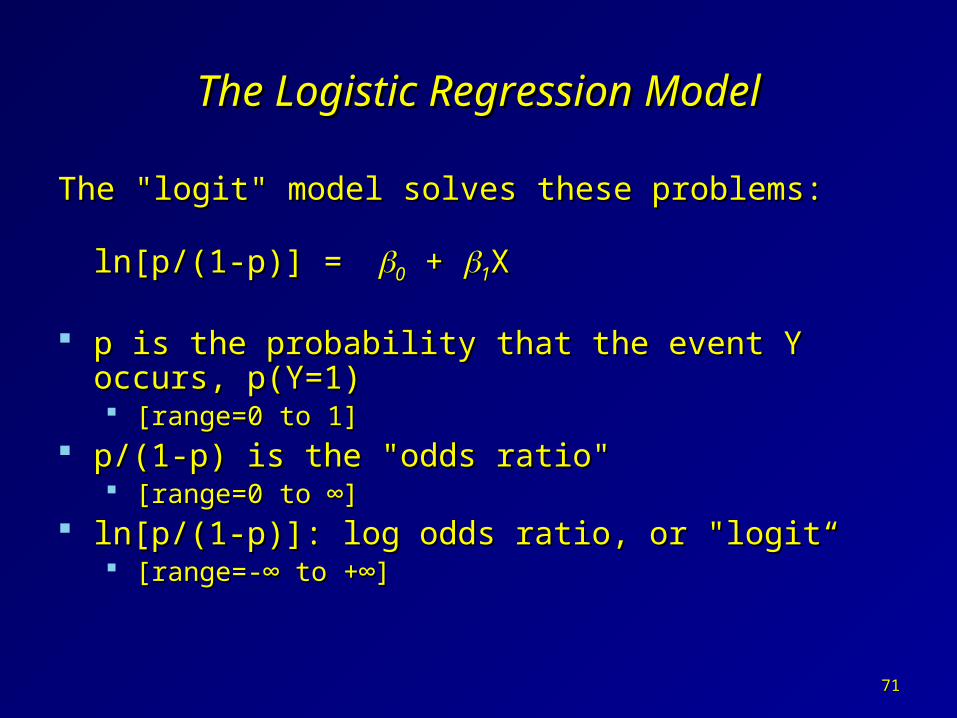
The Logistic Regression ModelThe Logistic Regression Model
The "logit" model solves these problems:The "logit" model solves these problems:
ln[p/(1-p)] = ln[p/(1-p)] = 00 + + 11X X
p is the probability that the event Y occurs, p is the probability that the event Y occurs, p(Y=1) p(Y=1) [range=0 to 1][range=0 to 1]
p/(1-p) is the "odds ratio" p/(1-p) is the "odds ratio" [range=0 to ∞][range=0 to ∞]
ln[p/(1-p)]: log odds ratio, or "logit“ln[p/(1-p)]: log odds ratio, or "logit“ [range=-∞ to +∞][range=-∞ to +∞]
7171
x
x
e
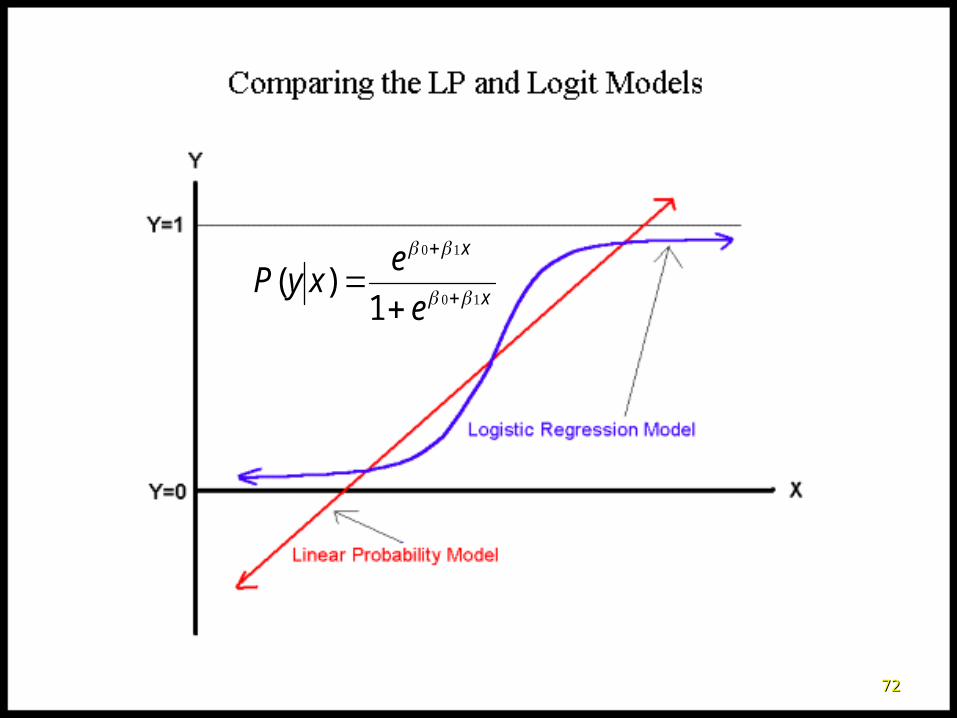
exyP
1)(
7272
Interpretation of OgiveInterpretation of Ogive
The logistic distribution constrains the The logistic distribution constrains the estimated probabilities to lie between 0 and estimated probabilities to lie between 0 and 1. 1.
The estimated probability is:The estimated probability is:
p = 1/[1 + ep = 1/[1 + e((00 + + 11X )X )] ]
if you let if you let 00 + + 11X =0, then p = .50 X =0, then p = .50
as as 00 + + 11X gets really big, p approaches 1 X gets really big, p approaches 1
as as 00 + + 11X gets really small, p approaches 0X gets really small, p approaches 0
7373
7474
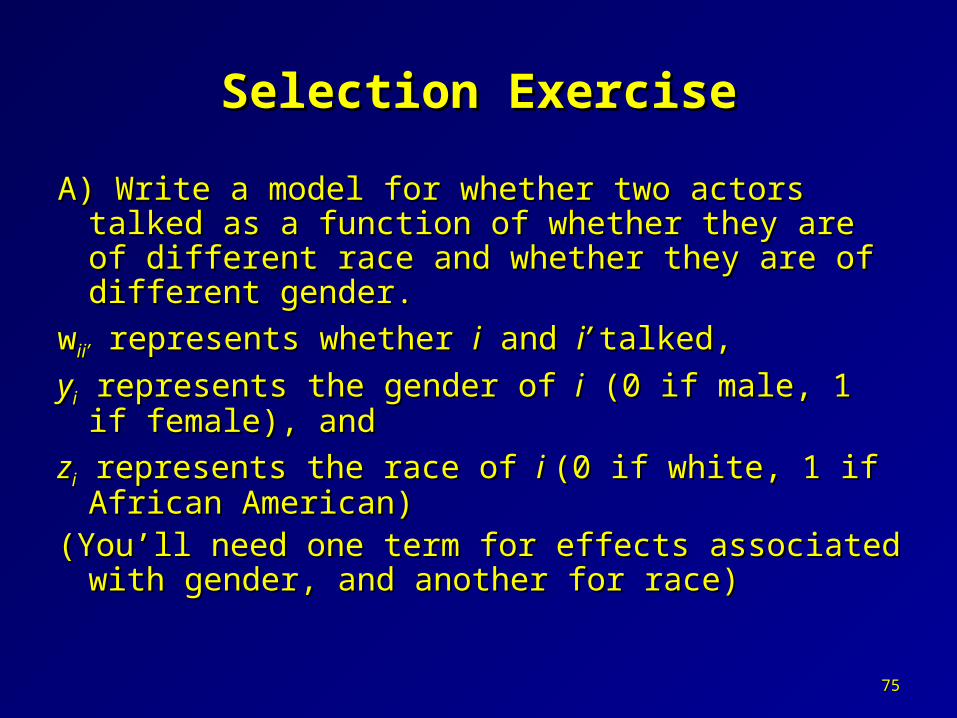
Selection ExerciseSelection Exercise
A) Write a model for whether two actors talked as A) Write a model for whether two actors talked as a function of whether they are of different race a function of whether they are of different race and whether they are of different gender.and whether they are of different gender.
wwii’ii’ represents whether represents whether ii and and i’ i’ talked, talked,
yyii represents the gender of represents the gender of ii (0 if male, 1 if female), (0 if male, 1 if female), and and
zzii represents the race of represents the race of i i (0 if white, 1 if African (0 if white, 1 if African American)American)
(You’ll need one term for effects associated with (You’ll need one term for effects associated with gender, and another for race)gender, and another for race)
7575
Selection ExerciseSelection Exercise
B) Assume that Bob and Lisa are African B) Assume that Bob and Lisa are African American and that Jane and Bill are white. Bill American and that Jane and Bill are white. Bill and Bob are Male and Lisa and Jane are female.and Bob are Male and Lisa and Jane are female.
Calculate the independent variables based on Calculate the independent variables based on difference of race and gender for Bob with each difference of race and gender for Bob with each of his interaction partners:of his interaction partners:
(Bob, Lisa): different gender = _______; (Bob, Lisa): different gender = _______; different race = _________ different race = _________(Bob, Jane): different gender =_______; (Bob, Jane): different gender =_______; different race = _________ different race = _________(Bob, Bill): different gender = _______; (Bob, Bill): different gender = _______; different race =__________ different race =__________
7676
Selection ExerciseSelection Exercise
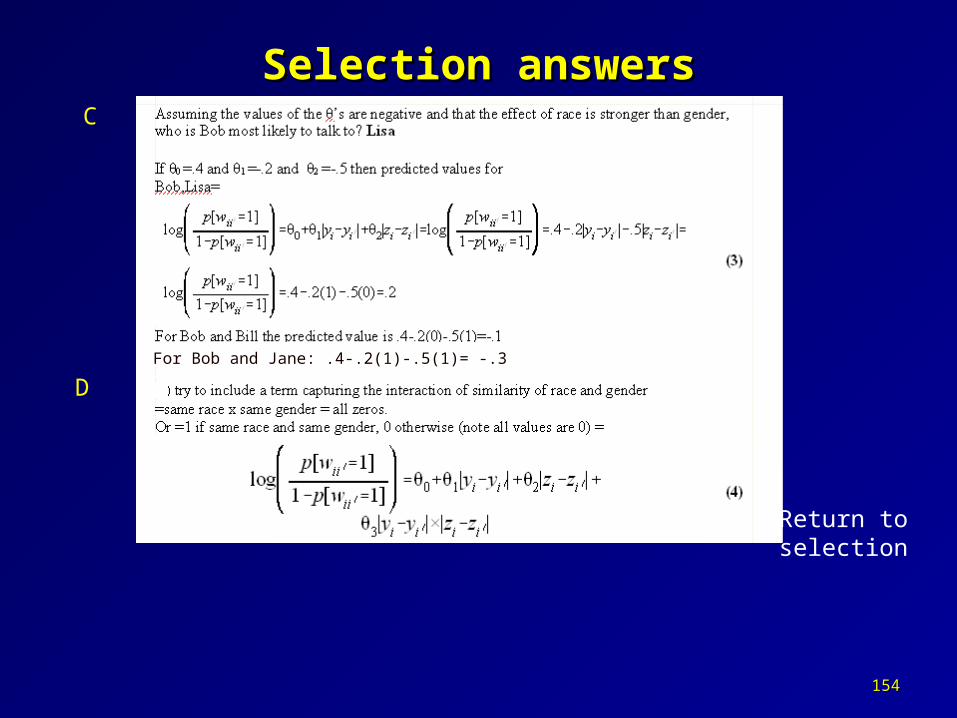
C) Assuming the values of the C) Assuming the values of the θθ’s are ’s are negative and that the effect of race is negative and that the effect of race is stronger than that of gender, who is Bob stronger than that of gender, who is Bob most likely to talk to?most likely to talk to?
D) Include a term capturing the interaction of D) Include a term capturing the interaction of similarity of race and gendersimilarity of race and gender
Selection answers 7777
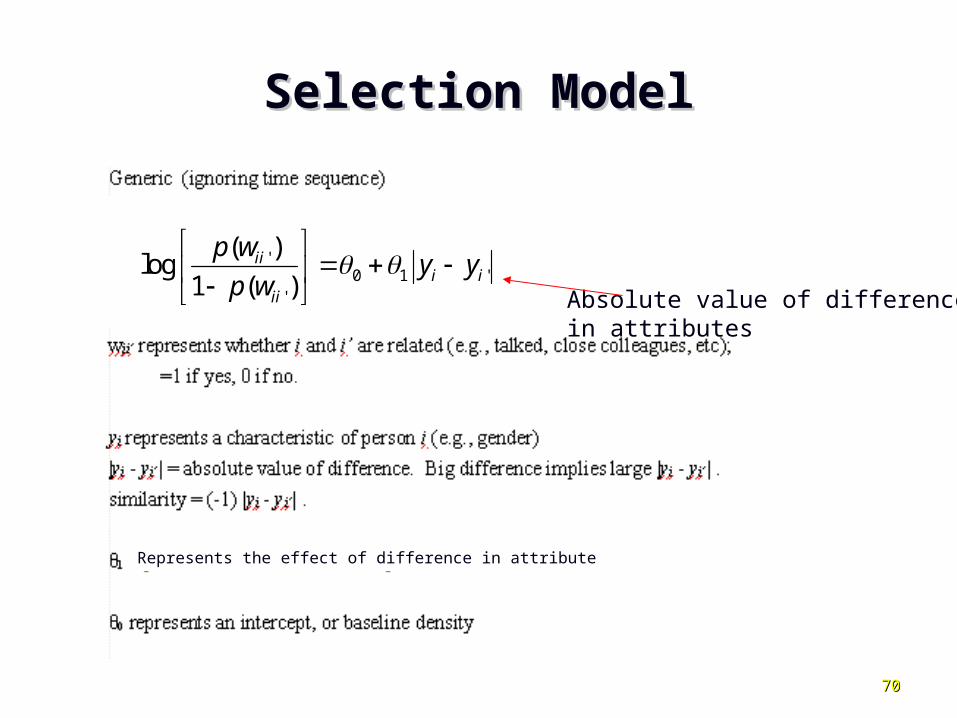
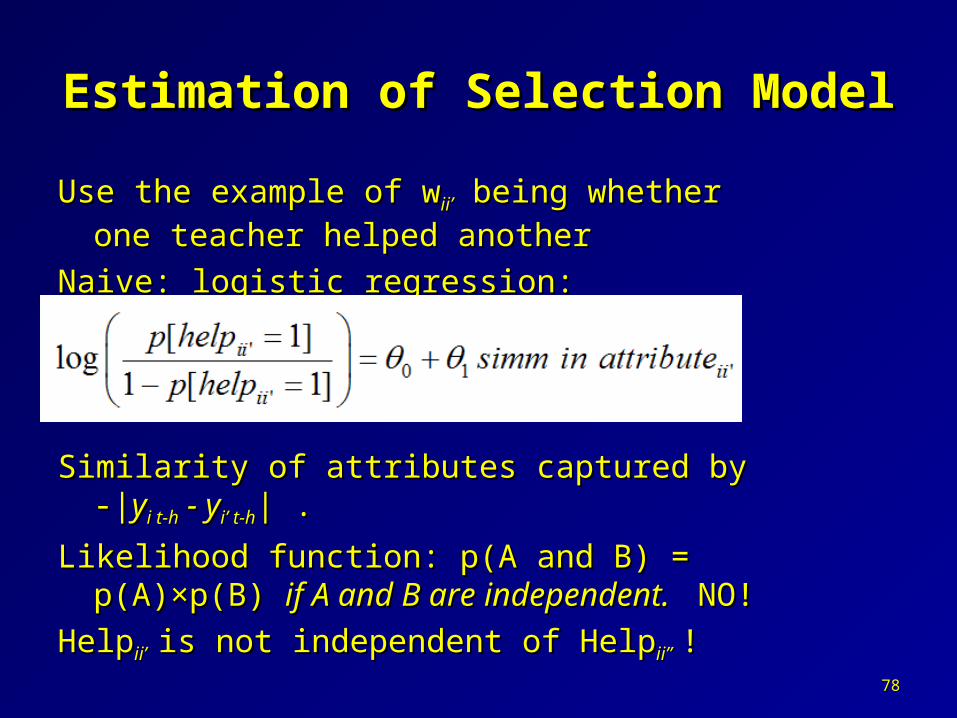
Estimation of Selection ModelEstimation of Selection Model
Use the example of wUse the example of wii’ii’ being whether one being whether one
Similarity of attributes captured by -|Similarity of attributes captured by -|yyi t-hi t-h - y - yi’ t-hi’ t-h| .| .
Likelihood function: p(A and B) = p(A)×p(B) Likelihood function: p(A and B) = p(A)×p(B) if A if A and B are independent. and B are independent. NO! NO!
HelpHelpii’ii’ is not independent of Helpis not independent of Helpii”ii” !!
7878
The pThe p11 Approach Approach
WWi’i i’i =0=0 WWi’i i’i =1=1
WWii’ ii’ =0=0 Cell ACell A
(reciprocity)(reciprocity)
Cell BCell B
WWii’ ii’ =1=1 Cell CCell C Cell DCell D
(reciprocity)(reciprocity)
Model as 4 cells, A,B,C,D instead of just WWii’ii’ =0 =0
Holland, Paul W. and S. Leinhardt. 1981. "An Exponential Family of Probability Distributions for Directed Graphs." Journal of American Statistical Association 76(373):33-49.
7979
Estimation via p*Estimation via p*
8080
Visual representations of p2 modelVisual representations of p2 modelcontrol for dependencies associated with nominator and nomineecontrol for dependencies associated with nominator and nominee
Van Duijn, M.A.J. (1995). Estimation of a random effects model for directed graphs. In: Snijders, T.A.B. (Ed.) SSS '95. Symposium Statistische Software, nr. 7. Toeval zit overal: programmatuur voor random-coefficient modellen [Chance is omnipresent: software for random coefficient models], p. 113-131. Groningen, iec ProGAMMA.SOFTWARE http://stat.gamma.rug.nl/stocnet/Lazega, E. and van Duijn, M (1997). “Position in formal structure, personal characteristics and choices of advisors in a law firm: a logistic regression model for dyadic network data.” Social Networks, Vol 19, pages 375-397.
: (19:40-42:25): (19:40-42:25)0) make square network data file out of list using makemat.sas will put 0) make square network data file out of list using makemat.sas will put file called file called
1) Using Van Duijn’s p2:1) Using Van Duijn’s p2:go to: go to: http://stat.gamma.rug.nl/stocnet/go to downloads and save stocnet in c:\stocnet (follow directions if you go to downloads and save stocnet in c:\stocnet (follow directions if you
install somewhere else).install somewhere else).
Unzip into c:\stocnetUnzip into c:\stocnetrun stocnet.exerun stocnet.exe
Manual available @ Manual available @ http://stat.gamma.rug.nl/stocnet/downloads/manualp2.pdf
Optional: network data at t-1Save in c:\stocnet\networks\pretoyw.dat
2.4 2 2.6 2 1.1 1 -.5 -.5 -3 -2 -1 -.5
Attributes (1 & 2)Save in c:\stocnet\actfiles\toyatt.dat
To convert edgelist data for p2 (using sas):KLiqueFinder can also convert an edgelist to p2 data: set option 14 in printo to a 1. output will be in xxxxxx.dat, where “xxxxxx” are the 1st 6 characters of your filename
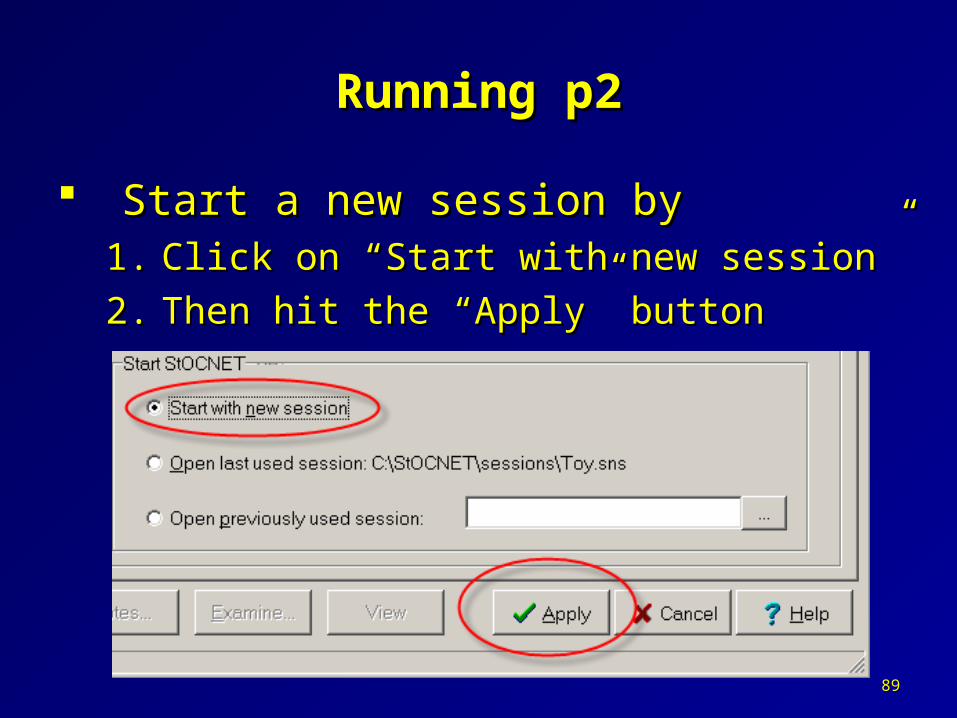
Start a new session byStart a new session by1.1. Click on “Start with new session”Click on “Start with new session”
2.2. Then hit the “Apply” buttonThen hit the “Apply” button
8989
Running p2Running p2
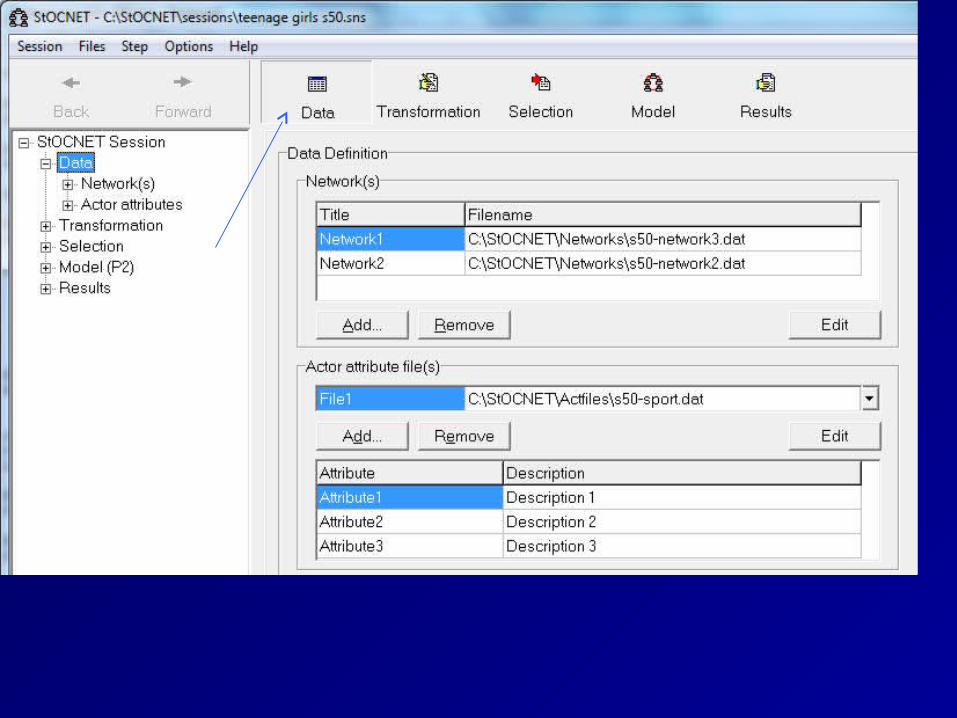
Click on the “Data” icon to add data.Click on the “Data” icon to add data.
9090
Running p2Running p2
Click on the Click on the “Add…” button.“Add…” button.1) add network 1) add network data collt1.datdata collt1.dat2) add network 2) add network data coll21.datdata coll21.dat3) add actor data 3) add actor data indiv.datindiv.dat
9191
Running p2Running p2
Once you finish Once you finish adding data, click adding data, click on the “Apply” on the “Apply” button first.button first.
Then, you can Then, you can click on the “View” click on the “View” button to view button to view data.data.
9292
Running p2Running p2
Click on the “Model” iconClick on the “Model” icon
9393
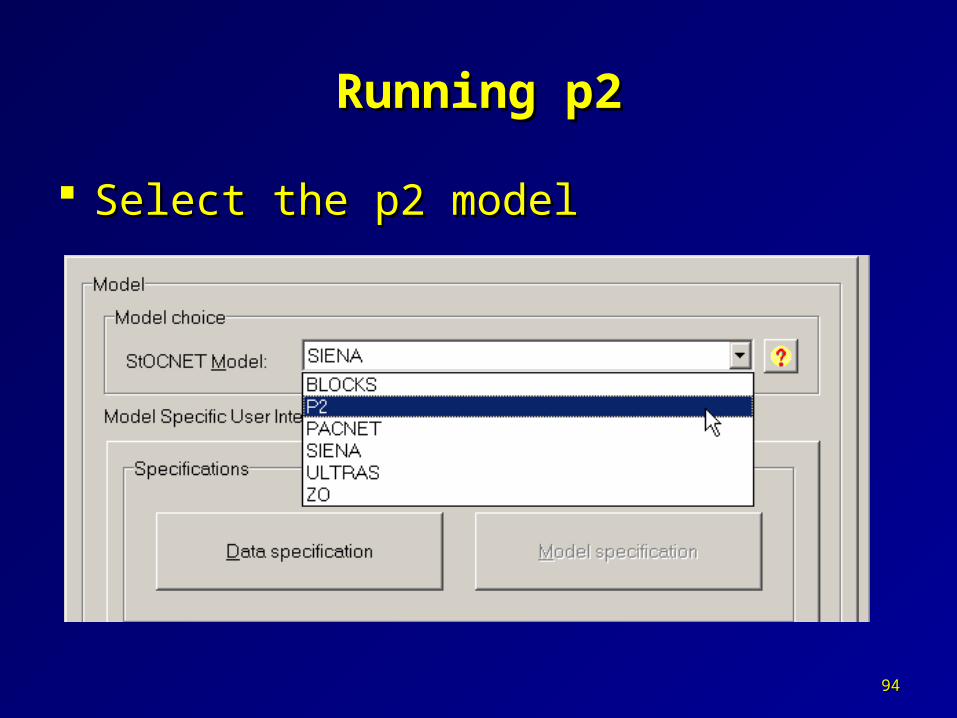
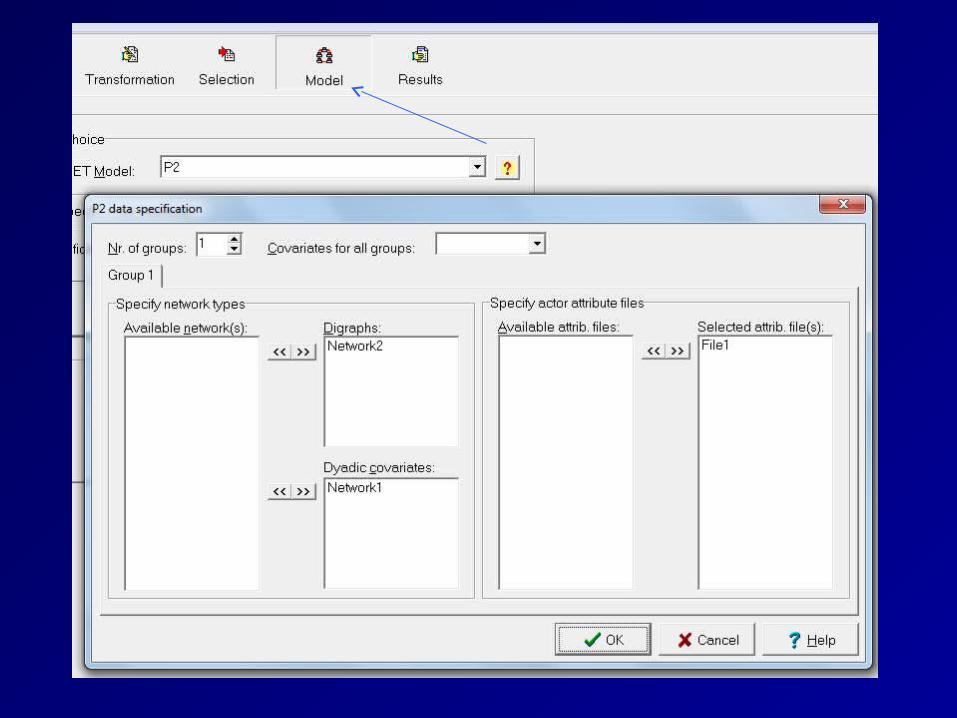
Running p2Running p2
Select the p2 modelSelect the p2 model
9494
Running p2Running p2
Click on the “Data specification” buttonClick on the “Data specification” button
9595
Running p2Running p2put network1 (toydata) into digraphput network1 (toydata) into digraph
put file1 (indiv) into selected attributesput file1 (indiv) into selected attributes
9696
Running p2Running p2 Specify model with actor attributes on Specify model with actor attributes on
network parametersnetwork parameters
9797
Density is pair level for us
Visual Representations of Selection Visual Representations of Selection ModelsModels
9898
Selection Model (p2)Selection Model (p2)
'0 0 ' 1 ' '
'
( )log
1 ( )ii
i i i i i iii
p wy y w
p w
0 00 01i
i i iy u '
0 ' 00 01 ' 'i
i i iy v
Pair Level (i,i’)
Sender Level (i)
Receiver Level (i’)
ui ~N(0,τu)
Vi’ ~N(0,τv)
Difference In attribute reciprocity
Sender attribute
Receiver attribute
Sender variance
Receiver variance
9999
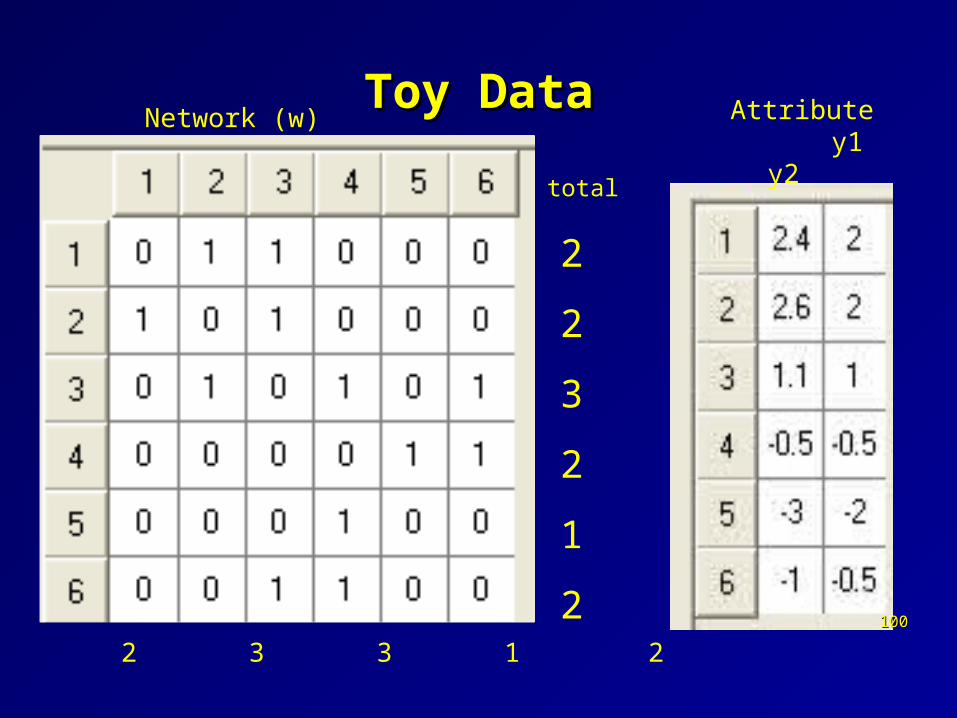
Toy DataToy DataNetwork (w) Attribute
y1 y2
2
2
3
2
1
2
total
100100
Total 1 2 3 3 1 2
W
|Yi-Yi’ |
101101
Example Output for p2 for Toy DataExample Output for p2 for Toy Datasee also http://stat.gamma.rug.nl/stocnet/downloads/manualp2.pdfsee also http://stat.gamma.rug.nl/stocnet/downloads/manualp2.pdf
P2MCMC RW ml mvP2MCMC RW ml mv
testtoy.outtesttoy.out
October 13, 2009, 11:36:25 AMOctober 13, 2009, 11:36:25 AM
October 13, 2009, 11:36:25 AMOctober 13, 2009, 11:36:25 AM
Number of valid tie indicator observations: 45Number of valid tie indicator observations: 45
@1@1
Descriptives:Descriptives:
GroupGroup Observed Initial Tie variables Digraph Number of ties Observed Initial Tie variables Digraph Number of ties Reciprocal ties Mutliplex ties Exchange tiesReciprocal ties Mutliplex ties Exchange ties
This last term models wither difference in attribute 1 predicts density.This last term models wither difference in attribute 1 predicts density.
105105
0 is contained within the 95% interval of the posterior distribution
Selection model (p2): Toy DataSelection model (p2): Toy Data
'0 0 ' ' '
'
( )log + -2.38 3.76
1 ( )ii
i i i i i iii
p wy y w
p w
0 3.79 .308i i iy u
0 ' '3.79 [not modeled]i iv
Pair level (i,i’)
Sender Level (i)
Receiver Level (i’)
ui ~N(0,.43)
vi ~N(0,4.9)
Bigger difference more interaction
High Reciprocity
Big y2 more interaction
106106
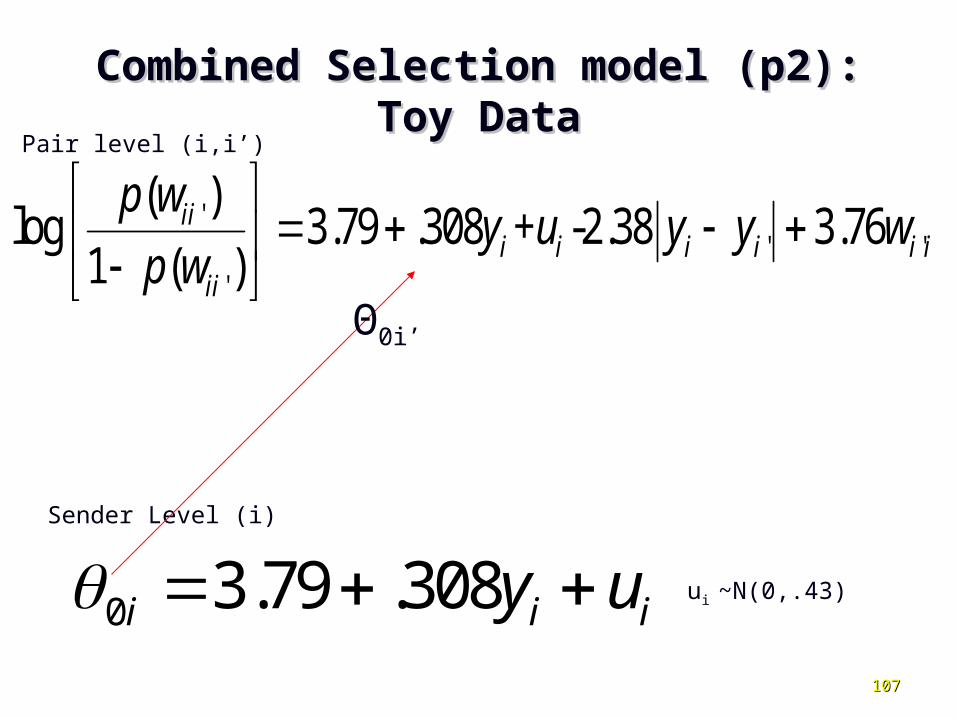
Combined Selection model (p2): Toy DataCombined Selection model (p2): Toy Data
'' '
'
( )log 3.79 .308 + -2.38 3.76
1 ( )ii
i i i i i iii
p wy u y y w
p w
0 3.79 .308i i iy u
Pair level (i,i’)
Sender Level (i)
ui ~N(0,.43)
Θ0i’
107107
Add Dyadic CovariateAdd Dyadic Covariate
108108
Specify P2 ModelSpecify P2 Model
109109
P2 Data SpecificationP2 Data Specification
110110
P2 Model SpecificationP2 Model Specification
111111
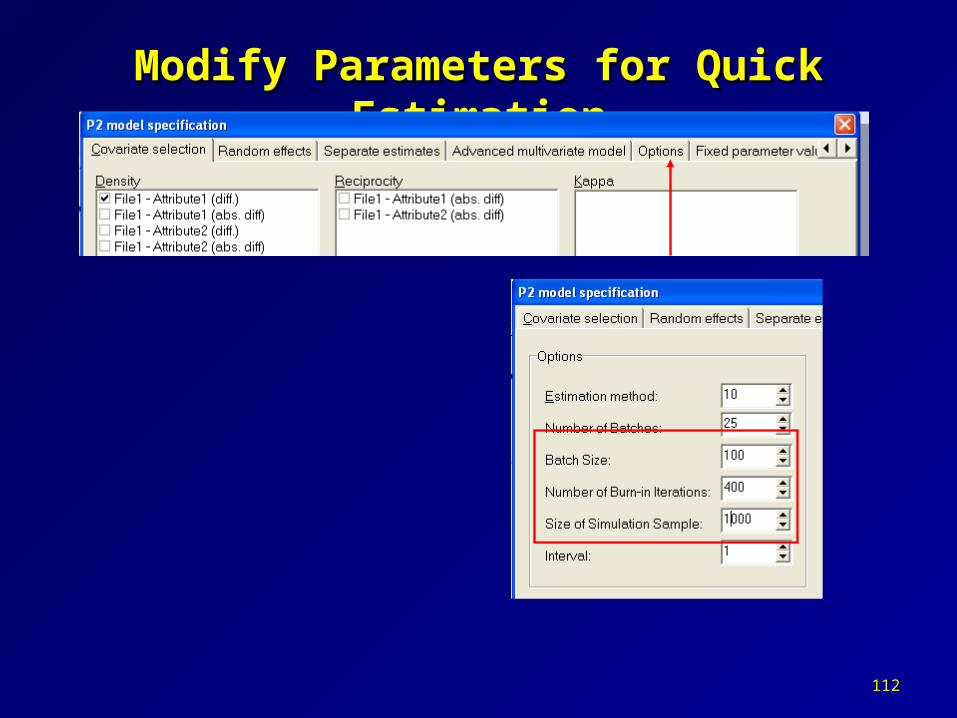
Modify Parameters for Quick EstimationModify Parameters for Quick Estimation
112112
Prediction for Pair (2,5) Selection Model Prediction for Pair (2,5) Selection Model (p2): Toy Data(p2): Toy Data
2,5
2 2 5 5,2
2,5
-5.1
2,5 -5.1
p(w )log =3.79+.308×2 -2.38 2 --2 +3.760
1-p(w )
=3.79+.308×2-2.38×4+3.760(0)=-5.1,
ep(w )= =.006
1+e
Pair level (2,5)
Actual value: W2,5=0
113113
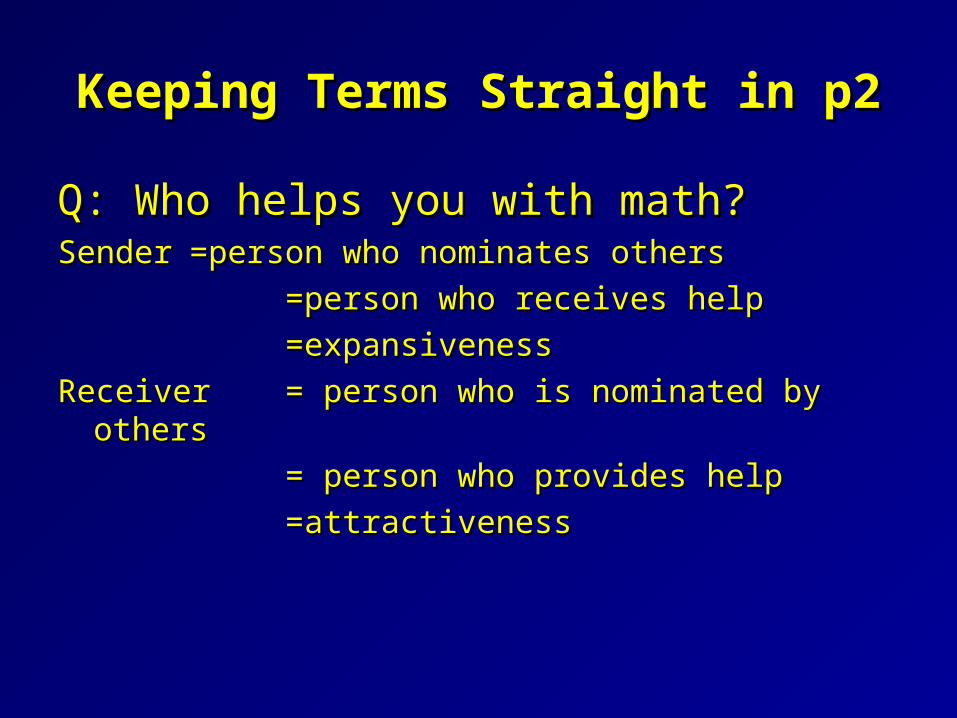
Keeping Terms Straight in p2Keeping Terms Straight in p2
Q: Who helps you with math?Q: Who helps you with math?SenderSender =person who nominates others=person who nominates others
=person who receives help =person who receives help
=expansiveness=expansiveness
Receiver Receiver = person who is nominated by others = person who is nominated by others
= person who provides help = person who provides help
=attractiveness=attractiveness
Keeping Terms Straight in p2Keeping Terms Straight in p2
Q: Who gave you cigarettes?Q: Who gave you cigarettes?
SenderSender =person who nominates others=person who nominates others
=person who receives cigarettes=person who receives cigarettes
=expansiveness=expansiveness
Receiver Receiver = person who is nominated by others = person who is nominated by others
= person who provides cigarettes= person who provides cigarettes
=attractiveness=attractiveness
Exercise for P2Exercise for P2
How can you make an inference about the How can you make an inference about the effect of similarity of an attributeeffect of similarity of an attribute
What happens to the similarity of attribute What happens to the similarity of attribute when you control for time 1?when you control for time 1?
Try putting in the model:Try putting in the model: Difference in attribute1+attribute1 on Difference in attribute1+attribute1 on
sender+attribute1 on receiversender+attribute1 on receiver Did it work? Did it work?
What is the difference between putting in What is the difference between putting in difference in attribute instead of absolute difference in attribute instead of absolute value of the difference? value of the difference?
Marijtje Van Duijn’s P2 in her own wordsMarijtje Van Duijn’s P2 in her own words
Alternatives for Running p2Alternatives for Running p2
In sas:In sas:download Sam Field’s p2 via sas from my web site:download Sam Field’s p2 via sas from my web site:http://www.msu.edu/~kenfrank/software.htm#Selection_Models:_p2
download glimmix from my web site and save to c:\download glimmix from my web site and save to c:\run glimmix.sas in sasrun glimmix.sas in sasrun Sam’s program (p2_explore.sas)run Sam’s program (p2_explore.sas)Note it generates its own ego and alter files (see data Note it generates its own ego and alter files (see data ii and and
data data jj) and network data () and network data (a5a5), but these could be read in.), but these could be read in.
Can also do using Peter Hoff’s R routine Can also do using Peter Hoff’s R routine http://www.stat.washington.edu/hoff/Code/GBME/. For For R, go to http://cran.cnr.berkeley.edu/R, go to http://cran.cnr.berkeley.edu/
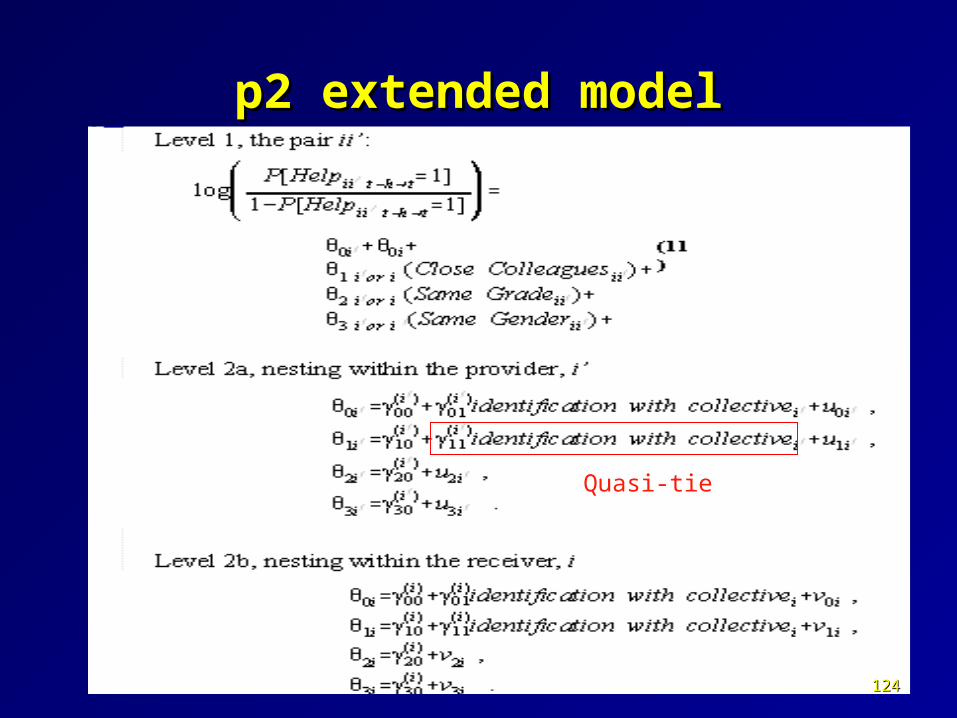
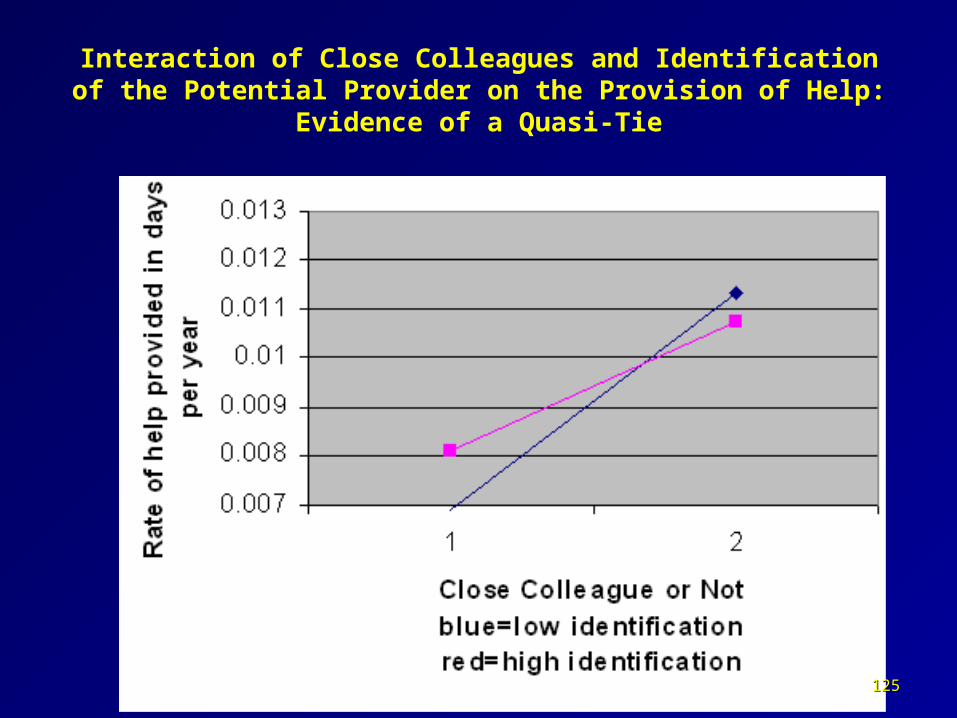
Selection ApplicationSelection ApplicationTransition from Social Exchange to Systemic Exchange Via Quasi-TiesTransition from Social Exchange to Systemic Exchange Via Quasi-Ties
KliqueFinder Step 1) Criteria for Determining defining clusters Step 2) Maximizing Criterion Step 3) Examine evidence of clusters Step 4) Evaluating the performance of the algorithm : Did... Crystalized sociogram of Close Collegial Ties
Ripple Plot Running KliqueFinder
Centrality EthicsEthics Resources
127127
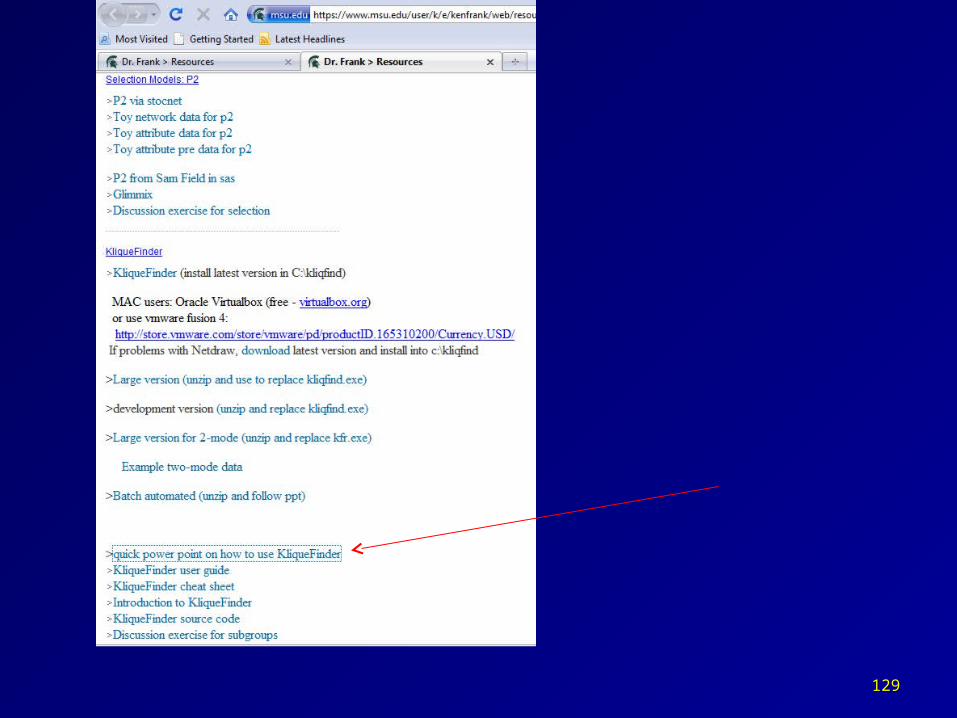
KliqueFinder: KliqueFinder: Identifying Clusters in Network DataIdentifying Clusters in Network Data
Go to: Go to: https://www.msu.edu/user/k/e/kenfrank/web/resources.htm#KliqueFinder
Based on:Based on: FrankFrank, K. 1996. “Mapping interactions within and between cohesive , K. 1996. “Mapping interactions within and between cohesive
subgroups.” subgroups.” Social Networks Social Networks 18: 93-119.18: 93-119. FrankFrank. K.A. 1995. “Identifying Cohesive Subgroups.” . K.A. 1995. “Identifying Cohesive Subgroups.” Social NetworksSocial Networks (17): (17):
27-56.27-56. *Field, S. **Field, S. *Frank, K.A.Frank, K.A., Schiller, K, Riegle-Crumb, C, and Muller, C. 2006. , Schiller, K, Riegle-Crumb, C, and Muller, C. 2006.
“Identifying Social Contexts in Affiliation Networks: Preserving the Duality of “Identifying Social Contexts in Affiliation Networks: Preserving the Duality of People and Events. People and Events. Social NetworksSocial Networks 28:97-123. * co first authors. 28:97-123. * co first authors.
Scenarios for the Network analystScenarios for the Network analyst
For each of the scenarios below, For each of the scenarios below, identify the theoretical processes at workidentify the theoretical processes at workwrite down what model or tool you would employ to evaluate the theory. write down what model or tool you would employ to evaluate the theory. describe what data you would collect to apply the model or tool to describe what data you would collect to apply the model or tool to describe what estimation procedure/tool you would use.describe what estimation procedure/tool you would use.
Sally is concerned that her daughter is experimenting with alcohol and thinks it is because her daughter’s friends are Sally is concerned that her daughter is experimenting with alcohol and thinks it is because her daughter’s friends are experimenting. Sally wonders generally if adolescents tend to drink more if their friends drink alcohol. experimenting. Sally wonders generally if adolescents tend to drink more if their friends drink alcohol.
Michael wants to understand the social structure of his synagogue. He has an idea that there are certain sets of Michael wants to understand the social structure of his synagogue. He has an idea that there are certain sets of people who interact with each other, and, if he could understand what those sets of people are, he might people who interact with each other, and, if he could understand what those sets of people are, he might better be able to tailor programs of the synagogue to be more effective.better be able to tailor programs of the synagogue to be more effective.
How could Michael use the information above track the diffusion of new beliefs or behaviors in his synagogue?How could Michael use the information above track the diffusion of new beliefs or behaviors in his synagogue?
Pennie wants to know under what conditions one social service agency would allocate resources to another. Is it Pennie wants to know under what conditions one social service agency would allocate resources to another. Is it because they have a history of doing so, they share clients, they deal with similar issues, etc.because they have a history of doing so, they share clients, they deal with similar issues, etc.
What clustering among social service agencies might emerge as a result of the processes above? What clustering among social service agencies might emerge as a result of the processes above?
130130
Centrality: The Strength of the Connection between an Actor and the
Network Freeman, L. C. (1978/1979). Centrality in social networks conceptual
clarification. Social Networks, 1, 215-239. Degree: number of ties to node i Betweeness: proportion of geodisics (connecting paths) between j
and k that go through i. Closeness: total number of edges required to link i to all others
See http://www.soc.duke.edu/~jmoody77/s884/syllabus_09.htm Bonacich (1972): eigen vector The centrality of a given person (ei) depends on the centrality of the
people to whom the person is tied (wii’=1 if i and i’ are related, 0 otherwise): The elements in e then represent the components of the eigen vector
of W – do a factor analysis of W
' '' 1
n
i ii iie w e e We
ei is the centrality of actor i. wii is the network data. λ is a constant
Individualistic, not view of networkIndividualistic, not view of network Does not explicitly account for resources Does not explicitly account for resources
flowing through tiesflowing through ties structuralstructural
133133
Centralization -- the Centrality of the System
How does the pattern of communication in organization A differ from that in organization B, and how are these patterns formed by characteristics external to the organization?
Freeman: distribution of centrality Compare measures against the maximal
measure in the graph -- but what if there is more than one actor
who is highly extreme in centrality?
134134
Barnett G., & Rice, R.: warp. (1985, Longitudinal Non-Euclidean Networks: Applying Galileo, Social
Networks, pages 287-322):
135135
Calculating Warp: Still not sure how this Calculating Warp: Still not sure how this works?works?
EIGEN FACTOR VALUE ------- ------- 1: 13.238 2: -1.000 3: -12.238 ======= ======= 26.475
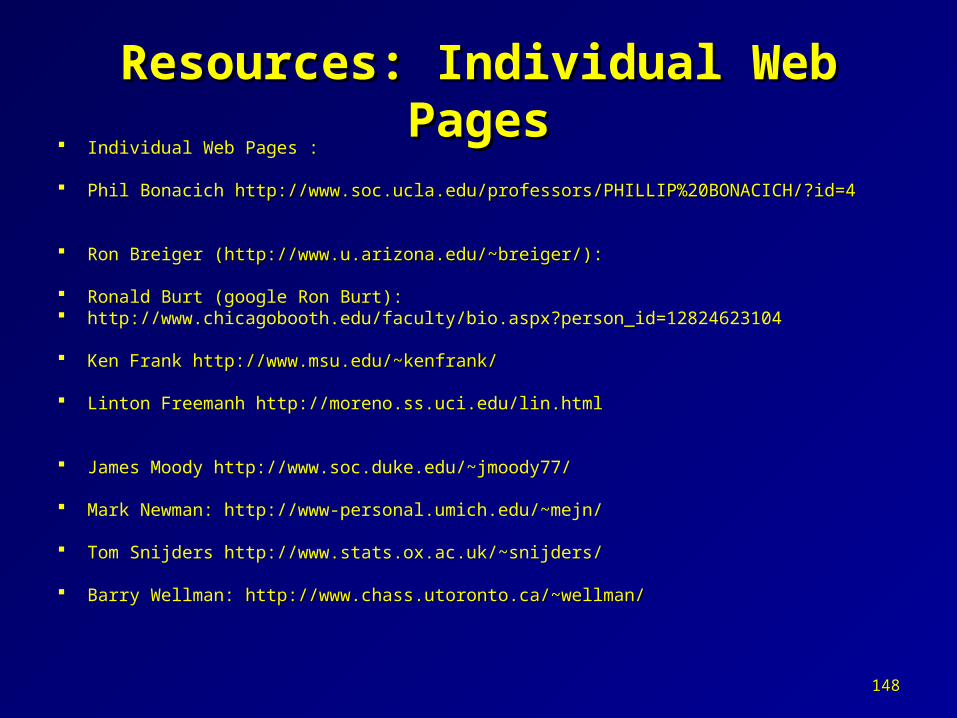
Logistics of Data Collection Organizing data entry Resources for Networks: Books Resources for Networks: Web Resources: Clearinghouses Resources: Individual web Pages
138138
Logistics of Data Collection
Need for longitudinal data to disentangle selection from influence (Matsueda and Anderson 1998; Leenders 1995).
Time constraints: how long does a network question take? Without roster: 2-3 minutes With roster: 5-10 minutes (depending on size of network)
High response rates (70% or more) needed to characterize system, influence incentives: school, individual administer in collective settings (e.g., staff meeting) do not be perceived to be affiliated with principal
Network data without survey? Sensors Participation in events (two-mode) on-line e-mails web links
Marsden in Carrington et al., follow up on Marsden, Peter V. 1990. “Network Data and Measurement.” Annual Review of
Confidentiality/Ethical issues in Collecting Network Data
Need names on survey
Data can be confidential but not anonymous (especially for longitudinal)
R.L. Breiger, “Ethical Dilemmas in Social Network Research: Introduction to Special Issue.” Social Networks 27 / 2 (2005): 89 – 93. Read it online. http://www.u.arizona.edu/~breiger/2005BreigerIntroEthics.pdfhttp://www.u.arizona.edu/~breiger/2005BreigerIntroEthics.pdf (All issues of social networks available via science direct)
Who benefits from network analysis? Who bears the cost?
Kadushin, Charles “Who benefits from network analysis: ethics of social network research” Social Networks 27 / 2 (2005): Pages 139-153. chapter 11 of Understanding Social Networks
Issues to raise when dealing with Human Subjects Board:
Klovdahl, Alden S. Social network research and human subjects protection: Towards more effective infectious disease control Pages 119-137
Hint on Human Subjects boards: they like precedents. Once you have one network study accepted, refer to it when submitting others!
141141Video: >rich media >vodcast>podcast>Course Portal (1:23:41-1:28)
The SRI/KLiqueFinder Solution to confidentiality: aggregate to subgroups
1) Provide information about who is in which cluster as well as information regarding the resources embedded in each cluster. Resources could be information, expertise, material resources, etc.
Benefit: reveals location of resources relative to social; structureProtection: does not reveal specific responses because all information is at the
cluster level.
2) Provide locations from in a sociogram unique for each respondent, indicating where that person is located (“you are here”). But figure does not include the lines from a sociogram, so respondents cannot infer others’ responses.
Benefit: Respondents then use this as a guide to individual behavior for identifying further resources or information.Protection: Specific responses of others not revealed, so confidentiality preserved.
142142
143143
Scenarios for the Network Analyst: Scenarios for the Network Analyst: Ethical ConsiderationsEthical Considerations
For your previous answer to each of the scenarios below, identify For your previous answer to each of the scenarios below, identify who would benefit from the analysis, who would benefit from the analysis, who bears the costswho bears the costshow confidentiality of subjects could be protectedhow confidentiality of subjects could be protected
Sally is concerned that her daughter is experimenting with alcohol and thinks it is because her daughter’s friends are Sally is concerned that her daughter is experimenting with alcohol and thinks it is because her daughter’s friends are experimenting. Sally wonders generally if adolescents tend to drink more if their friends drink alcohol. experimenting. Sally wonders generally if adolescents tend to drink more if their friends drink alcohol.
Michael wants to understand the social structure of his synagogue. He has an idea that there are certain sets of Michael wants to understand the social structure of his synagogue. He has an idea that there are certain sets of people who interact with each other, and, if he could understand what those sets of people are, he might people who interact with each other, and, if he could understand what those sets of people are, he might better be able to tailor programs of the synagogue to be more effective.better be able to tailor programs of the synagogue to be more effective.
How could Michael use the information above track the diffusion of new beliefs or behaviors in his synagogue?How could Michael use the information above track the diffusion of new beliefs or behaviors in his synagogue?
Pennie wants to know under what conditions one social service agency would allocate resources to another. Is it Pennie wants to know under what conditions one social service agency would allocate resources to another. Is it because they have a history of doing so, they share clients, they deal with similar issues, etc.because they have a history of doing so, they share clients, they deal with similar issues, etc.
What clustering among social service agencies might emerge as a result of the processes above? What clustering among social service agencies might emerge as a result of the processes above?
144144
Resources for Networks: Books
• Kadushin, Charles. (2012). Understanding Social Networks: Theories, Kadushin, Charles. (2012). Understanding Social Networks: Theories, Concepts, and Findings. Oxford: Oxford University Press.Concepts, and Findings. Oxford: Oxford University Press.
• Peter J. Carrington, John Scott, Stanley Wasserman “Models and Methods in Social Network Analysis” Cambridge, order from Amazon on-line.
• Wasserman, S., & Faust, K. (2005). Social networks analysis: Methods and applications. New York: Cambridge University. Go to Amazon to order electronically.
• Freeman, Linton (2004). The Development of Social Network Analysis: A Study in the Sociology of Science. Empirical Press of Vancouver, BC, Canada
http://www.icpsr.umich.edu/icpsrweb/NACDA/studies/20541http://www.icpsr.umich.edu/icpsrweb/NACDA/studies/20541 National Social Life, Health, and Aging Project (NSHAP)National Social Life, Health, and Aging Project (NSHAP)
Assume Bob talks to Sue with frequency 1, to Lisa with frequency 3 and not at all to Assume Bob talks to Sue with frequency 1, to Lisa with frequency 3 and not at all to Jane. Last year (at time 1), Sue’s organic farming implementation was a 9, Lisa’s was Jane. Last year (at time 1), Sue’s organic farming implementation was a 9, Lisa’s was a 5 and Jane’s was 2. a 5 and Jane’s was 2.
What is the What is the meanmean exposure of Bob’s to his peers regarding delinquency? exposure of Bob’s to his peers regarding delinquency? Sum=1x9+3x5+0x2=24Sum=1x9+3x5+0x2=24
N= 2 (number Bob talks to) or 3 (number of people) or 4 (number of N= 2 (number Bob talks to) or 3 (number of people) or 4 (number of interactions)? Hmmmmmm.interactions)? Hmmmmmm.
Mean = 24/2=12 or 24/3=8 or 24/4=6. Mean = 24/2=12 or 24/3=8 or 24/4=6.
Or, use the sum?Or, use the sum?
Specify a model with two sources of exposure (e.g., within versus between subgroupsSpecify a model with two sources of exposure (e.g., within versus between subgroupsLet sLet sii’ ii’ =1 if i and i’ are in the same subgroup, 0 otherwise=1 if i and i’ are in the same subgroup, 0 otherwise
yit ρwithinni 1,ii
siiwii yi t 1 ρbetweenni 1,i i
(1 sii )wiiyi t 1 γyi t 1 eit .yit ρwithinni 1,ii
siiwii yi t 1 ρbetweenni 1,i i
(1 sii )wiiyi t 1 γyi t 1 eit .
Return to influence 151151
Selection AnswersSelection Answers
'0 1 ' 2 '
'
( )log
1 ( )ii
i i i iii
p wy y z z
p w
152152
Selection AnswersSelection AnswersB) Assume Bob that and Lisa are African American and that Jane and Bill arewhite. Bill and Bob are Male and Lisa and Jane are female.
Calculate the independent variables based on race and gender for Bobwith each of his interaction partners:
(Bob, Lisa): different gender = |0-1|=1; different race = |1-1|=0
(Bob, Jane): different gender = |0-1|=1 ; different race = |1-0|=1
(Bob, Bill): different gender = |0-0|=0 ; different race = |1-0|=1
B) Assume Bob that and Lisa are African American and that Jane and Bill are
153153
Note: variable is 1 if different gender, 0 if same gender.Could also make it: 1 if same gender, 0 if different gender
C
Selection answersSelection answers
Return to selection
D
154154
For Bob and Jane: .4-.2(1)-.5(1)= -.3
Resources ExerciseResources Exercise
Find 2 web resources not listed above and Find 2 web resources not listed above and post them on angelpost them on angel
155155
Bounds on Bounds on ρρ(Based in part on dissertation by Jiqiang (Based in part on dissertation by Jiqiang
Xu)Xu) Ord says 1/Ord says 1/λλminmin < < ρρ < 1/ < 1/λλmaxmax , , λλ is an eigen value is an eigen value
Find the network modelFind the network model Try to relate this regression to one of our network models.
How does her analysis take into account ties among people?
How could you extend?
159159
Measure of Bridging CapitalMeasure of Bridging Capital
160160
Try to relate this regression to one of our network models.
How does her analysis take into account ties among people?
How could you extend?
161161
162162
Prior to workshopPrior to workshop
163163
1)Standard statistical software packageSas, spss or stata
2) KliqueFinder:–http://pikachu.harvard.edu/wkf/–Follow instructions to install. Put in c:\kliqfind–Mac users: vmware fusion, Windows 7, 32 bit: http://store.vmware.com/store/vmware/pd/productID.165310200/Currency.USD/
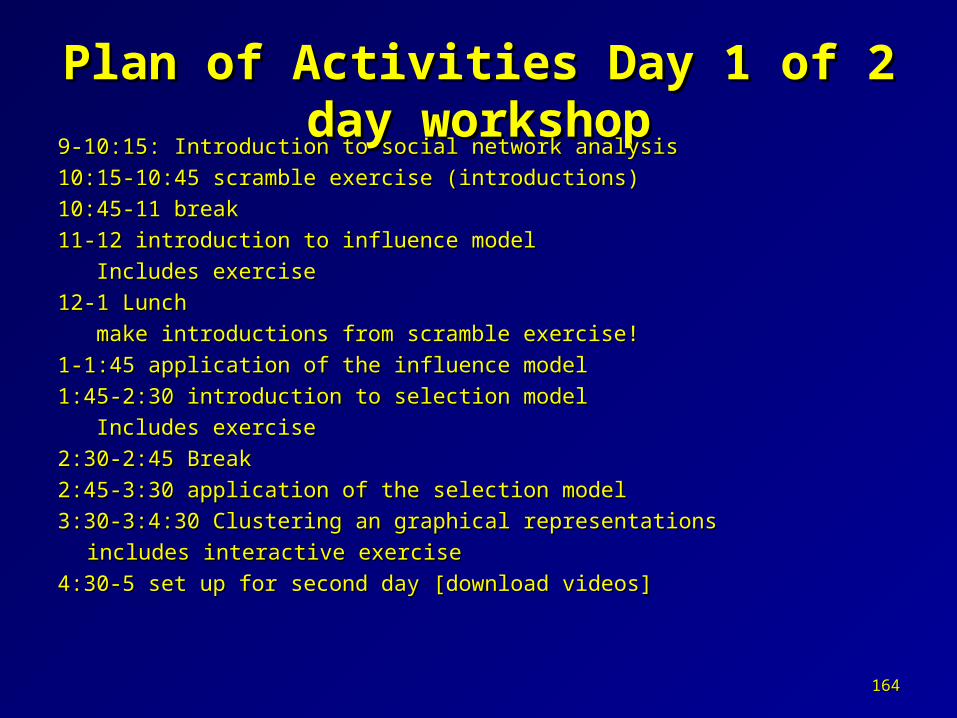
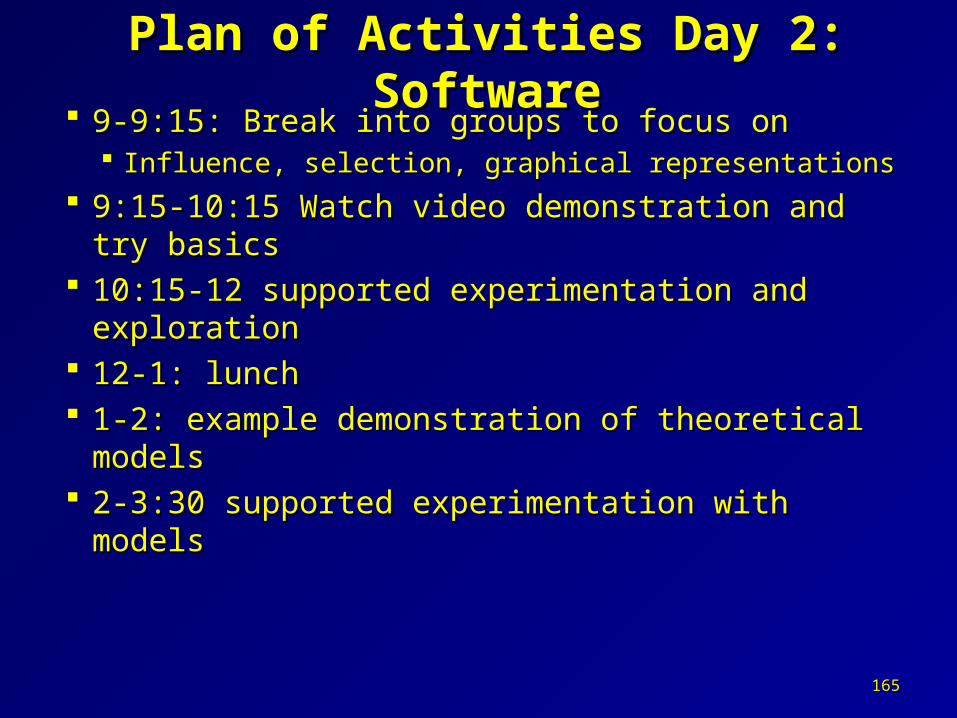
9:15-10:15 Watch video demonstration and try 9:15-10:15 Watch video demonstration and try basicsbasics
10:15-12 supported experimentation and 10:15-12 supported experimentation and explorationexploration
12-1: lunch12-1: lunch 1-2: example demonstration of theoretical models1-2: example demonstration of theoretical models 2-3:30 supported experimentation with models2-3:30 supported experimentation with models
165165
Research on networks in educationResearch on networks in education
on teachers:on teachers: Jim SpillaneJim Spillane Peter YoungsPeter Youngs Cynthia CoburnCynthia Coburn Alan DalyAlan Daly Min SunMin Sun Chong Min KimChong Min Kim Nienke MoolenaarNienke Moolenaar Ben PogodzinskiBen Pogodzinski Bill PenuelBill Penuel Russell ColeRussell Cole Jonathan SupovitzJonathan Supovitz Kara FinniganKara Finnigan Kara JacksonKara Jackson Paul CobbPaul Cobb Tom SmithTom Smith
On adolescent networks On adolescent networks on schoolson schools
Bill CarbonaroBill Carbonaro Jim MoodyJim Moody Yu XieYu Xie Chandra MuellerChandra Mueller Ann Strassman MullerAnn Strassman Muller Derek KreigerDerek Kreiger